the Creative Commons Attribution 4.0 License.
the Creative Commons Attribution 4.0 License.
 | 06 Feb 2018
Brief Communication: Synoptic-scale differences between Sundowner and Santa Ana wind regimes in the Santa Ynez Mountains, California
Benjamin J. Hatchett
Craig M. Smith
Nicholas J. Nauslar
Michael L. Kaplan
Downslope Sundowner winds in southern California's Santa Ynez Mountains favor wildfire growth. To explore differences between Sundowners and Santa Ana winds (SAWs), we use surface observations from 1979 to 2014 to develop a climatology of extreme Sundowner days. The climatology was compared to an existing SAW index from 1979 to 2012. Sundowner (SAW) occurrence peaks in late spring (winter). SAWs demonstrate amplified 500 hPa geopotential heights over western North America and anomalous positive inland mean sea-level pressures. Sundowner-only conditions display zonal 500 hPa flow and negative inland sea-level pressure anomalies. A low-level northerly coastal jet is present during Sundowners but not SAWs.
- Article
(5257 KB) - Full-text XML
-
Supplement
(2940 KB) - BibTeX
- EndNote


The combination of episodic low relative humidity and strong winds, complex terrain, and fuel conditions (e.g., load, moisture, and continuity) coupled with extensive wildland–urban interfaces (WUI) in southern California produces significant wildfire hazards with frequent large, severe, and costly fires (Westerling et al., 2004). In the semiarid steep lands of the Santa Ynez mountains and other parts of the Transverse Ranges of southern California (Fig. 1a), fire represents a critical component of shrubland-dominant ecosystems (Moritz, 2003). The Mediterranean climate promotes the accumulation of fine fuel during mild wet winters that dry during extended warm and dry summers. In this region, humans are the primary source of ignitions (Balch et al., 2017), with notable Santa Ynez fires (Fig. 1a) resulting from accidental ignitions to arson.

Figure 1(a) Map of the study area. Notable fire perimeters with impact on urban communities and agricultural operations are colored. The Santa Barbara Airport (KSBA) weather station was used to estimate temperature ramps produced by Sundowner wind events and the Montecito RAWs were used to evaluate winds during Sundowner conditions. (b, c) Examples of two characteristic temperature increases (temperature ramps) that occur outside of the month-averaged diurnal heating cycle (black line). The right y axis shows temperature at KSBA and the left y axis shows Montecito RAWs wind speed and gust velocity. (d–f) Monthly frequencies of (d) top 0.5 % of Sundowner-only events, (e) top 0.5 % of Sundowner events and any 6 h period of Santa Ana winds events (Sundowner + SAW in the text), and (f) top 2 % Santa-Ana-only (SAW in the text) events. Note differing y-axis scales.
Strong downslope wind events (e.g., Smith, 1979; Durran, 1990) can lead to damaging fires in mountainous regions when an ignition source is present (Sharples et al., 2010). In the Santa Ynez mountains, these winds are locally called “Sundowner” winds due to their characteristic onset during late afternoon or early evening (Blier, 1998; Fig 1b and c). In an effort to explain the dynamics of Sundowners, Cannon et al. (2017) performed 2 km horizontal-resolution numerical simulations of several case studies. Their simulations demonstrated the importance of northerly winds over the Santa Ynez that formed gravity waves in the lee of the Santa Ynez. They also found that the formation of a critical layer (Durran, 1990) or wind reversal with height in the lower troposphere, was important in enhancing downslope wind intensity by reflecting gravity wave energy to the surface. Wind gusts in the Santa Ynez foothills can exceed 25 m s−1 and low relative humidity results from advection of dry inland air masses and adiabatic warming as air descends nearly 900 m from the crest of the Santa Ynez southward to the coastal plain (Fig. 1b and c). During Sundowner conditions, wildfires ignited in the Santa Ynez Mountains rapidly grow downslope to threaten agriculture and densely populated urban communities along the mountain front and coastal plain regions. Although historical and paleofire regimes are dominated by large fires (Mensing et al., 1999), any fire near the WUI such as the Tea, Jesusita, or Painted Cave fires (Fig. 1a) can have devastating consequences. As climatic conditions increase water limitation (Williams and Abatzoglou, 2016) and the WUI continues to expand, the risk to life and property from fires in dryland regions will grow. Understanding and quantifying the primary weather components that produce elevated local and regional fire weather will be valuable in anticipating and mitigating these risks.
Extensive study on extreme fire weather in southern California has focused on Santa Ana winds (hereafter SAWs) that have contributed to many massive conflagrations (Raphael, 2003; Hughes and Hall, 2010; Moritz et al., 2010; Abatzoglou et al., 2013; Guzman-Morales et al., 2016). SAW conditions result from the development of a strong pressure gradient produced in response to a thermal gradient between the cold, inland deserts and warmer maritime air mass (Hughes and Hall, 2010). This thermally driven pressure gradient creates strong northeasterly winds and gravity wave-forced downward momentum transfer that yields regional downslope warming and low relative humidity. Despite the high impact of fires in the Santa Ynez Mountains on urban communities (i.e., WUI; Martinuzzi et al., 2015) and agricultural operations, little research has focused on the smaller-scale Sundowner winds and is limited to case studies (Blier, 1998; Cannon et al., 2017). These studies indicate that different atmospheric processes are involved in Sundowner events compared to classic SAW events at the synoptic scale (Blier, 1998; Cannon et al., 2017). However, these few case studies avoid generalizing their results in a climatological sense and to our knowledge no studies have yet attempted to relate Sundowner winds to SAWs.
Here we use observational data and atmospheric reanalysis products to produce a synoptic climatology of Sundowner winds in an effort to broaden the understanding of when and under what synoptic conditions Sundowner winds occur and to relate them to the well-studied SAWs. We hypothesize that Sundowner events are seasonally distinct from SAWs and have differing synoptic-scale patterns associated with them. Sundowners that coincide with SAWs are hypothesized to demonstrate similar synoptic patterns to SAW-only events. Identifying the nuances that differentiate Sundowners from SAWs may provide additional insight into fire weather forecasts and an understanding of weather–fire–climate interactions (Mensing et al., 1999; Moritz et al., 2010; Williams and Abatzoglou, 2016) in California's Transverse Ranges.
To develop a climatology of Sundowner winds, we acquired quality-controlled hourly air temperatures, wind speeds and directions, and dew point temperatures at the Santa Barbara airport (KSBA; Fig. 1a) from the National Center for Environmental Information (https://www.ncdc.noaa.gov/data-access/land-based-station-data) from 1 January 1979 to 31 December 2014. Downslope adiabatic warming of air parcels produces an abrupt increase in temperature in the coastal plain region, so we use hourly temperature ramps (increases) observed outside of the normal diurnal temperature cycle at KSBA as a proxy for Sundowner wind events (Fig. 1b and c). Monthly mean diurnal heating cycles were calculated using KSBA data over the recorded period. Days on which temperature was observed to rise during the period in which cooling normally occurred (typically 16:00 to 07:00 LST) were classified as a temperature ramp event. From this definition, we selected only the strong events or those in the top 0.5 % of the identified dates to be included as potential Sundowner events (n = 278 days). The use of the top 0.5 % of events allowed us to focus on the atmospheric dynamics characterizing the strong events. These events had a temperature ramp of at least 4.4 ∘C; this value provided confidence that observed heating was due to downslope warming and not merely due to advection of the marine boundary layer away from KSBA (Iacobellis and Cayan, 2013).
The hourly SAW index used for comparison with our Sundowner climatology was developed for southern California by Guzman-Morales et al. (2016) using output from a dynamically downscaled regional climate model at 10 km horizontal resolution. Guzman-Morales et al. (2016) defined SAWs at each grid cell by first identifying winds with a negative u-component (between 0 and 180∘) that exceeded the upper quartile of wind velocities in this cell. To be categorized as a SAW event, they required a 12 h period of continuous winds that had at least 1 h of velocity exceeding the grid cell velocity threshold. They allowed discontinuities of up to 12 h to account for breaks in SAWs, and their index reflects the regional average wind speed during periods of time that satisfied the direction–magnitude–continuity study design. To identify SAW-only days from Guzman-Morales et al. (2016) SAW index and due to the relative frequency of SAWs, we selected dates satisfying the top 2 % of SAW events (based on the median hourly SAW index for each day in the SAW index data set; n = 248 days). These days did not coincide with dates identified as Sundowner-only days (n = 142). For coinciding Sundowner and SAW days (hereafter Sundowner + SAW), we selected dates within the top 0.5 % of Sundowner events and also required 6 h of SAW index greater than zero (n = 136 days).
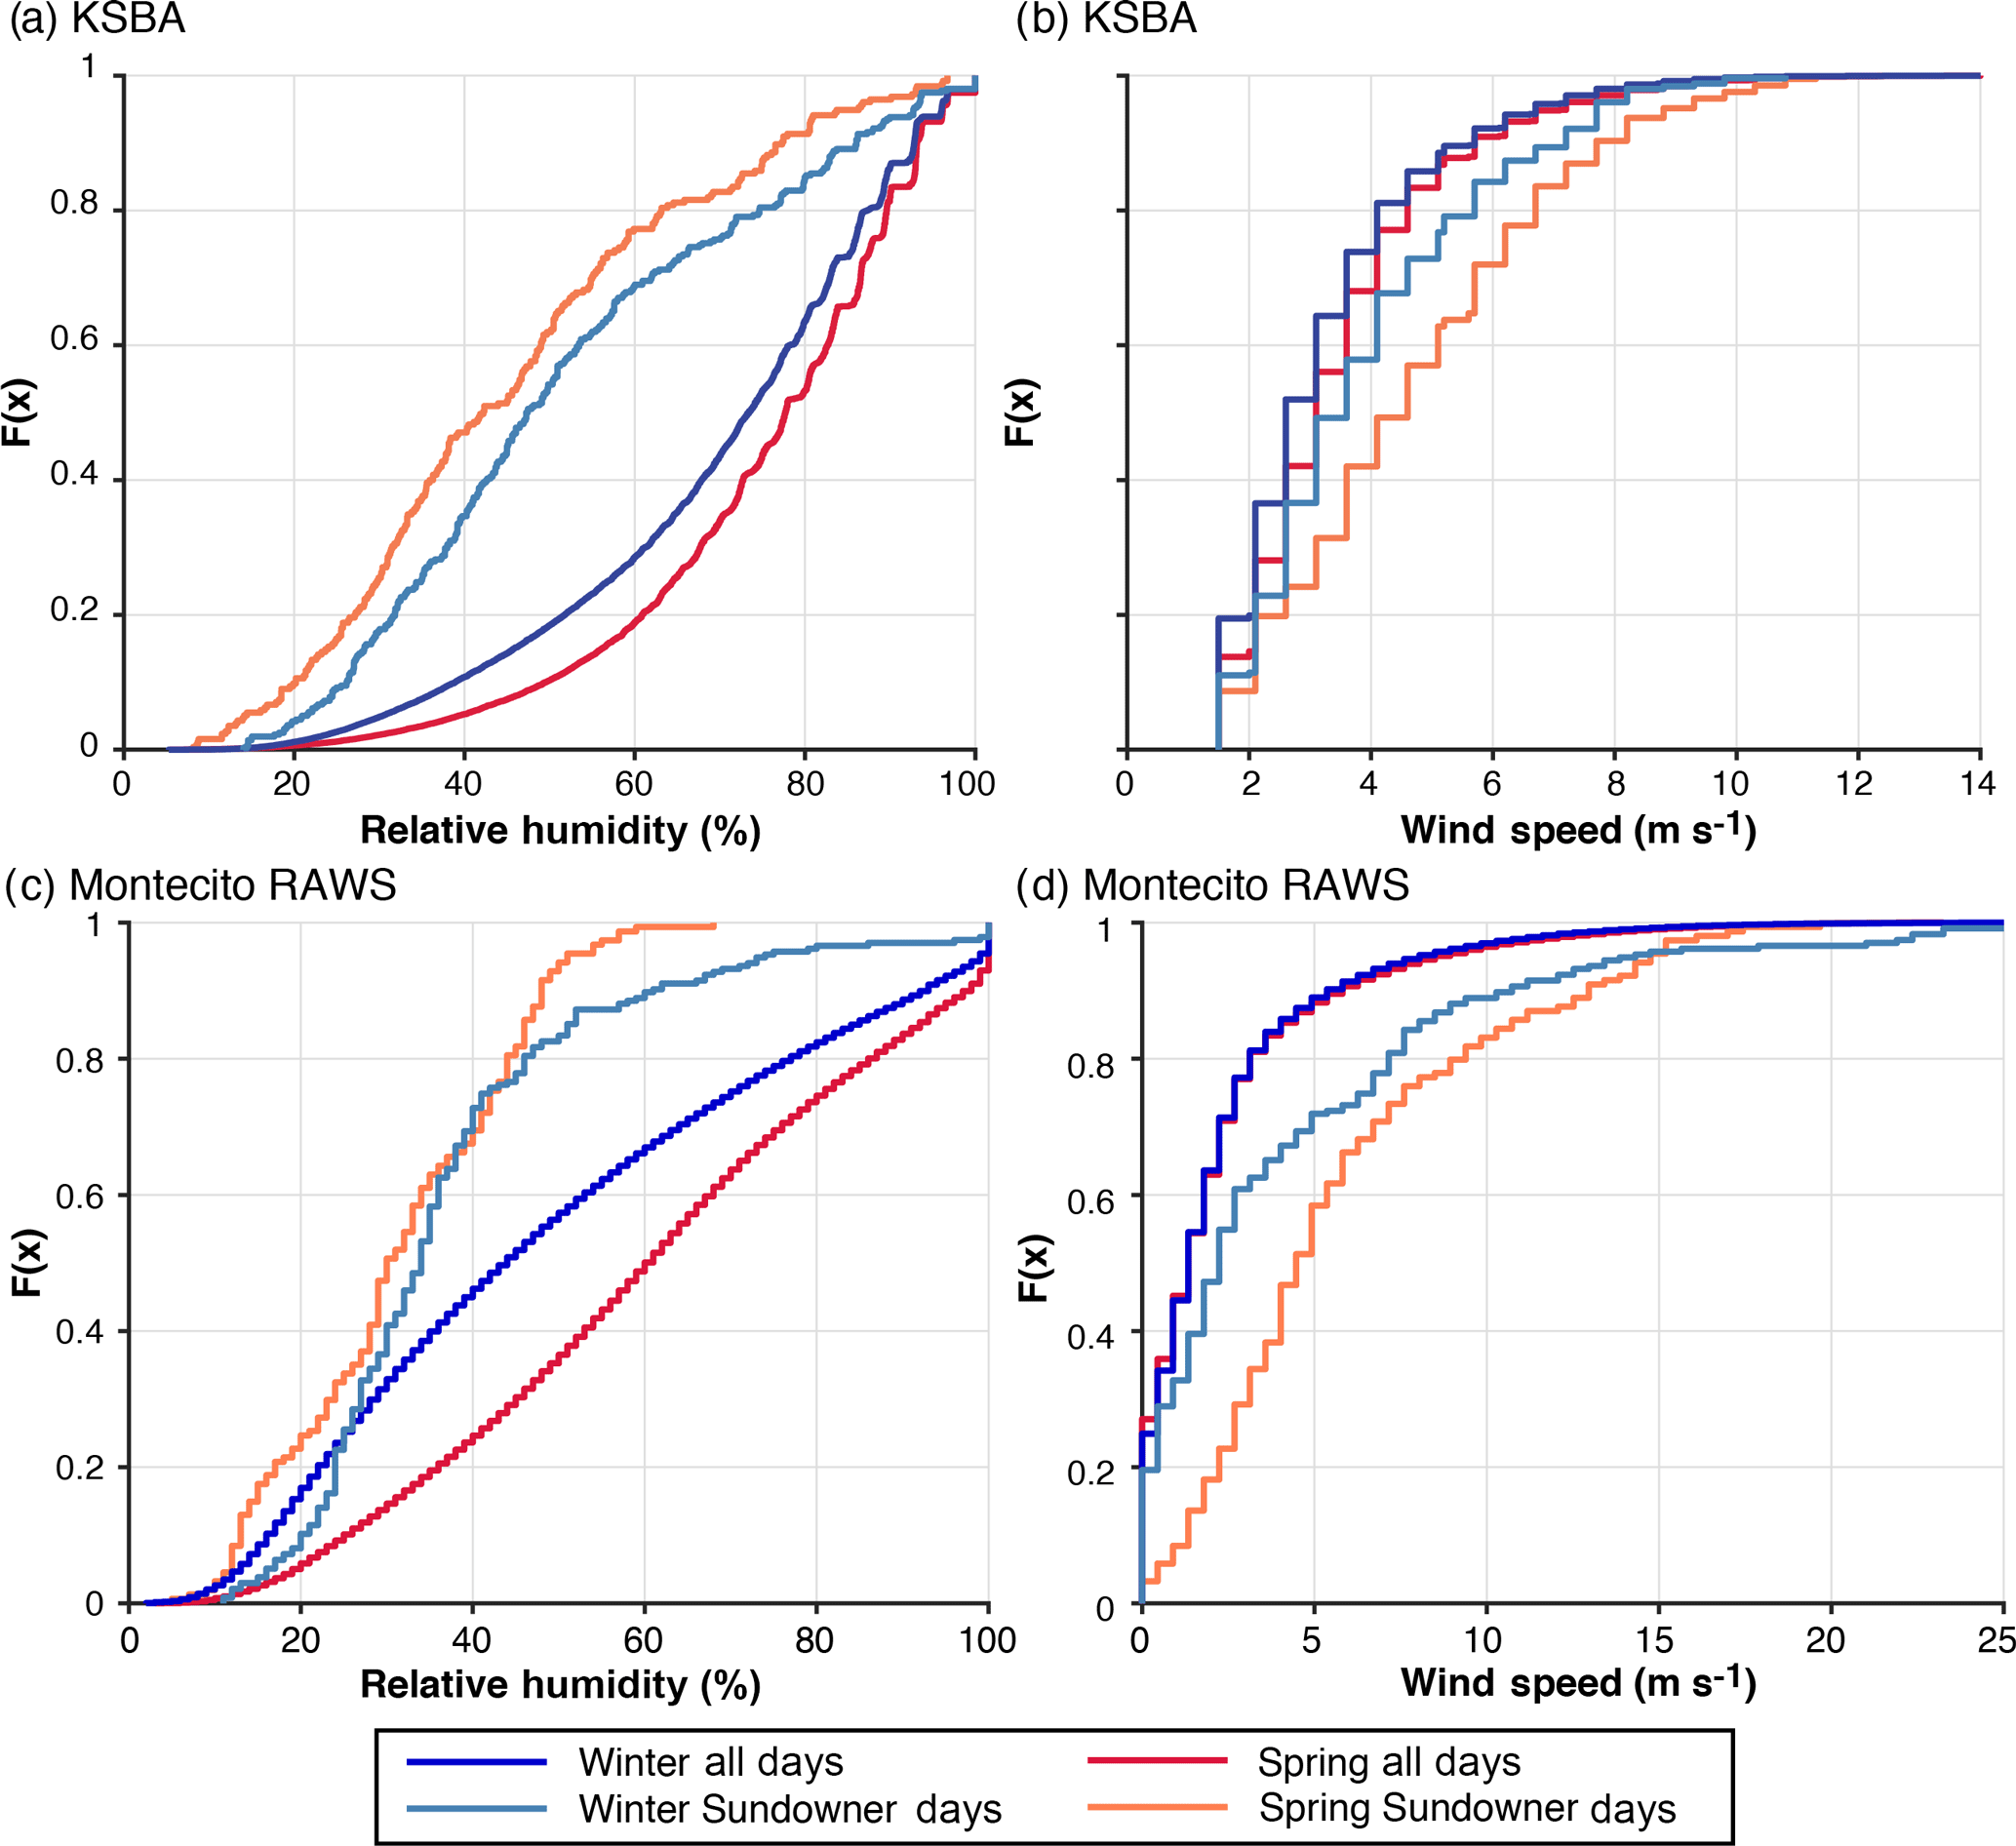
Figure 2(a) Cumulative distributions of relative humidity at KSBA during the extended spring (March–June) Sundowner maxima and extended winter (November–February) Santa Ana maxima. (b) As in (a) except for wind speed at KSBA. (c, d) As in (a, b) but for the Montecito RAWS. Distributions are created from either all hours (all days) or for the 5 h following each identified possible top 0.5 % of Sundowner events (Sundowner days) during the respective peak seasons (see Fig. 1d–f).
Output from the North American Regional Reanalysis (NARR; Mesinger et al., 2006) was used for composite analysis. Three-hourly, 32 km horizontal-resolution mean sea-level pressure (MSLP) and 500 hPa geopotential heights during each of the three regimes were averaged by peak seasons of identified Sundowner (March–June) and Santa Ana (November–February) regimes in order to separate out seasonal variability in geopotential heights and MSLP. Anomalies of MSLP and 500 hPa heights were calculated as differences from the 1981–2010 long-term daily means. Although our primary goal is to explore synoptic-scale differences between wind regimes, Cannon et al. (2017) pointed out the importance of northerly winds in Sundowners, which we would expect to be absent during SAW-only regimes. To do this, we examined vertical cross sections of northerly (v-component) winds from 32 to 36∘ N at levels between 1000 and 300 hPa from NARR. The coarse resolution of reanalysis products prevented us from attempting to identify overturning isentropes that are a key signature of mountain wave-induced gravity wave breaking (Smith et al., 2014; Cannon et al., 2017). Low-level (925 hPa) winds were composited to compare the spatial extent and magnitude of northerly winds, particularly offshore winds, during Sundowner and SAW events. To increase confidence that our temperature ramp identification technique selected favorable fire conditions (i.e., stronger wind and lower relative humidity compared to average conditions), we compared cumulative distributions of wind speed and relative humidity for all hours during peak Sundowner and Santa Ana months to the distribution of identified events for each 5 h period beginning with the temperature ramp hour. The August–Roche–Magnus approximation (Lawrence, 2005) was used to calculate relative humidity at KSBA from observed temperature and dew point. In this evaluation, we also included an assessment of all available hourly wind speeds and relative humidity values from 1 October 1997 to 31 December 2014 from the Montecito Remote Automated Weather Station (RAWS) located in the Santa Ynez foothills to the northeast of KSBA (Fig. 1a) in order to supplement the hypothesis that Sundowner conditions favor fire weather. Montecito RAWS data were acquired from the Western Regional Climate Center (http://www.wrcc.dri.edu/raws).
We find that Sundowner-only conditions peak during spring and early summer with less frequent occurrences during fall and early winter (Fig. 1d). Sundowner + SAW events primarily occur during the cool season (October–February) with a secondary peak in April (Fig. 1e). SAW-only frequency maximizes during the late fall and winter season (Fig. 1f; Raphael, 2003; Abatzoglou et al., 2013; Guzman-Morales et al., 2016), decreases during spring and is nearly absent in summer (Fig. 1f). The spring and early summer peaks in Sundowner-only occurrences (Fig. 1d) are consistent with many notable fires that have occurred in Santa Barbara (Fig. 1a; Cannon et al., 2017). Not all notable fires, including the Jesusita fire (Fig. 1a), occurred during strong Sundowner or SAW events as we have defined them. The climate and fuel loading of the Santa Ynez creates an environment in which damaging fires can occur under weaker Sundowner wind regimes should ignition occur.
For the period between 1997 and 2014 and during both the Sundowner and Santa Ana peak seasons, the relative humidity during Sundowner events is lower by 20–40 % at KSBA (Fig. 2a) with winds that are between 2 and 4 m s−1 stronger (Fig. 2b) than non-Sundowner days. Results from the Montecito RAWS station (Fig. 2c and d) are consistent with the KSBA results, with Sundowner days indicating reduced relative humidity and increased wind speed compared to all days for a given season. At both stations, springtime Sundowners demonstrated lower relative humidity and stronger winds compared to winter. These results are consistent regardless of whether the duration of Sundowners considered span the RAWS (1997–2014) or the KSBA period of the record (1979–2014; Fig. S1 in the Supplement).
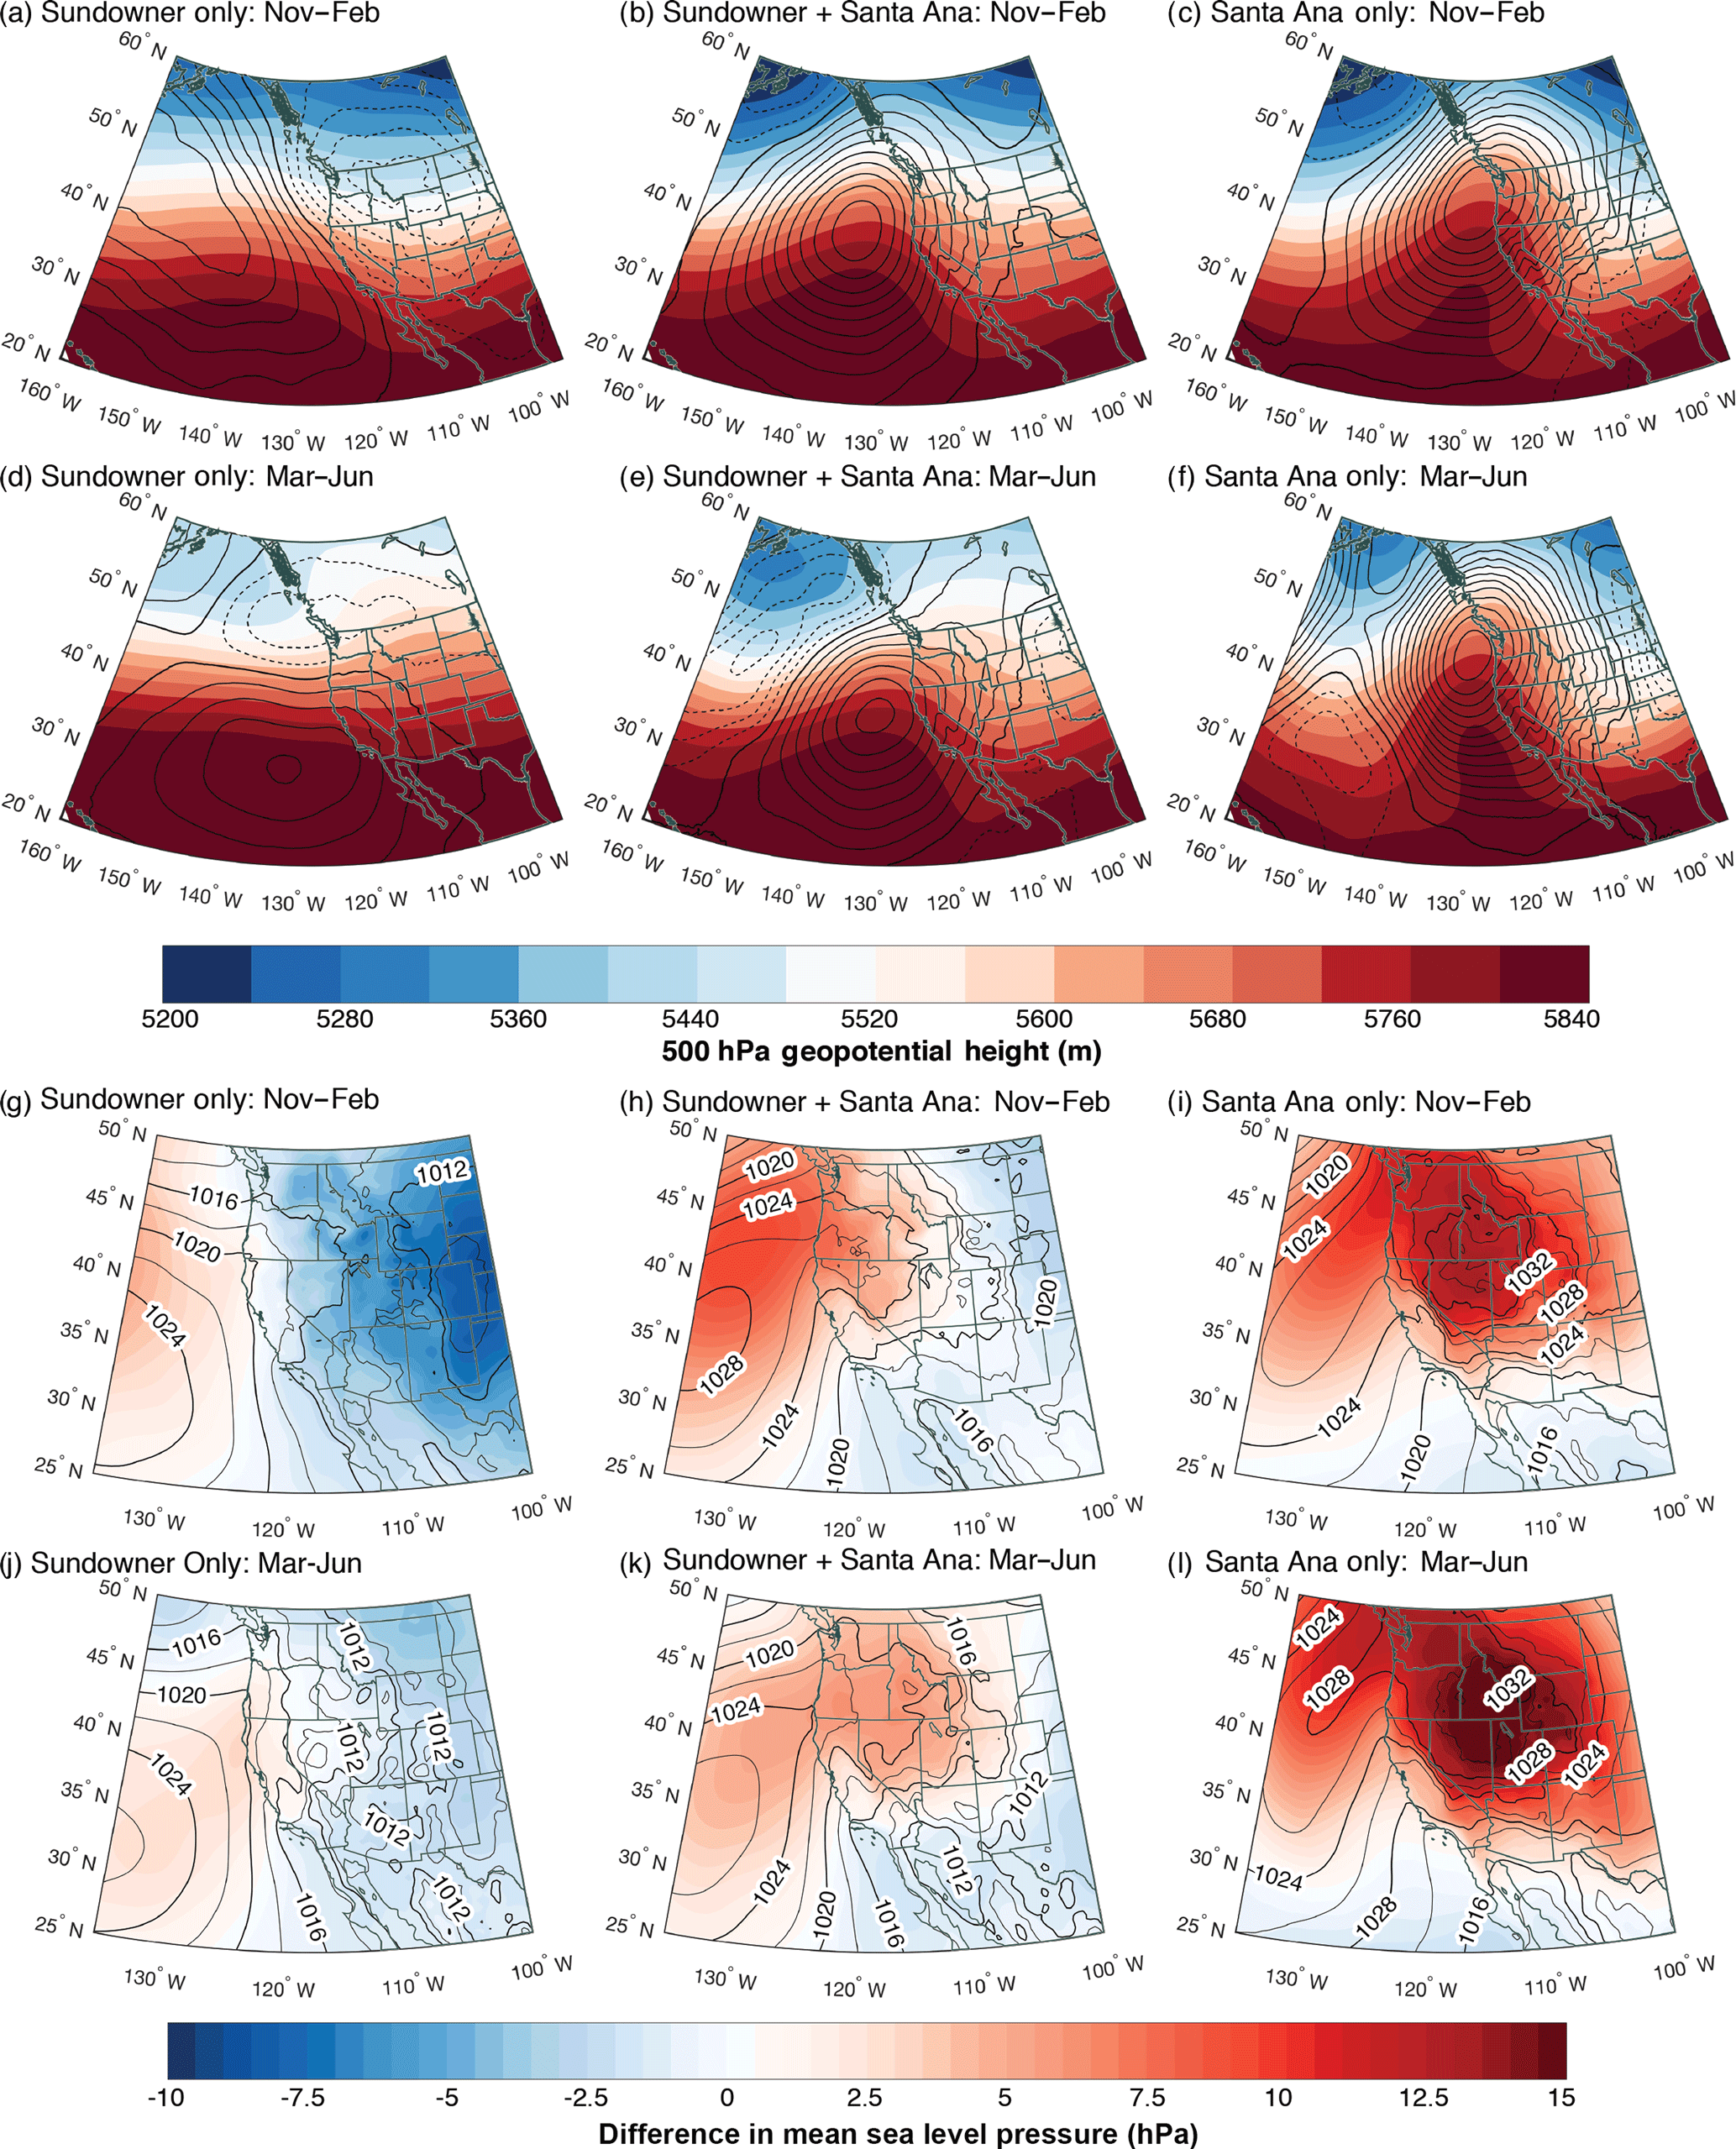
Figure 3(a–f) Composite North American Regional Reanalysis 500 hPa geopotential heights (filled contours) and geopotential height anomalies calculated as differences from the 1981–2010 long-term means (negative values are dashed; contour interval 10 m). (g–l) Mean sea-level pressure anomalies calculated as differences from the 1981–2010 long-term means (filled contours). Contour lines show mean sea-level pressure (contour interval 2 hPa; thick lines show 4 hPa).

Figure 4(a–d) Composite North American Regional Reanalysis 925 hPa wind velocity magnitudes (filled contours, contour interval 1 ms−1) with vectors showing total wind direction (vector size is proportional to wind magnitude). Shaded white areas indicate areas in which NARR terrain exceeds 925 hPa. The dark blue lines in each panel indicate the extent of the cross section used to produce the vertical cross sections shown in Fig. 5.

Figure 5(a-d) Composite North American Regional Reanalysis northerly (v-component) winds (filled contours; thin contour interval 0.5 ms−1 thick contour interval 2.5 ms−1) for the cross section spanning 32–36∘ N through the center of the study area at a longitude of 120∘ W. Black areas denote NARR terrain.
Composite analysis of NARR output during Sundowner-only days, SAW + Sundowner days, and SAW-only days for the months during the respective peaks of each wind regime (November–February – winter – for SAW and March–June – spring – for Sundowner) indicates that regardless of peak season, Sundowner-only events appear different from either SAW and SAW + Sundowner events at the synoptic scale. During both winter and spring Sundowner-only events, the 500 hPa ridge axis is more zonally elongated (Fig. 3a and d) compared to the other regimes (Fig. 3b, c, e, f). During SAW or Sundowner + SAW cases, the 500 hPa geopotential heights become meridionally amplified and positively tilted from the southwest to the northeast over western North America with substantial positive anomalies centered near 40∘ N, 130∘ W (Fig. 3b, c, e). This pattern is analogous to the 700 hPa anomalies shown by Hughes and Hall (2010) and promotes cold air advection from the interior western USA towards California (Abatzoglou et al., 2013) during strong SAW regimes (Fig. 3c and f). The deeper troughs in the Gulf of Alaska and over Manitoba during SAW conditions indicate amplified flow regimes compared to the Sundowner-only regime. The Sundowner + SAW composites are similar but less amplified and less positively tilted compared to the SAW-only composites. The similarity in 500 hPa geopotential height patterns between the two SAW regimes supports the hypothesis that SAW and SAW + Sundowner events are both created by large-scale thermal gradient and momentum fluxes resulting from the amplified ridging that produces broad offshore flow and downslope warming throughout southern California (Hughes and Hall, 2010). The more zonal conditions during Sundowner-only events (Fig. 3a and d) suggest that these events are synoptically distinct from the meridionally amplified conditions characterizing SAWs (Fig. 3c and f). For comparison, seasonal means of geopotential height and MSLP and differences between Sundowner only and SAW only for these fields are provided in the Supplement (Figs. S2 and S3, respectively.)
MSLP fields and their anomalies are consistent with the differences between Sundowner and SAW wind regimes. During Sundowner-only events, the maximum MSLP region (> 1020 hPa) is offshore (Fig. 3g and h) with small (> 3 hPa) positive offshore anomalies and moderate negative onshore anomalies, especially in winter (Fig. 3g). The Sundowner + SAW composites show an expansion of the eastern edge of the 1020 hPa area towards the northeast with a corresponding enhancement in positive offshore MSLP anomalies extending into the Pacific Northwest (Fig. 3b and e). During SAW-only events, the 1020 hPa region extends into and across western North America with a 1030 hPa maximum over the northern Intermountain West region (Fig. 3i and l). Although offshore positive MSLP anomalies exist, the maximum anomalies exceeding 10 hPa shift to the northern Great Basin and Intermountain West regions (Fig. 3i and l). A tighter east–west MSLP gradient exists west of the Santa Barbara region during Sundowner and SAW + Sundowner events compared to SAW-only events. This MSLP gradient likely contributes to the northerly winds that blow perpendicular and downslope across the east–west-trending Santa Ynez and other parts of the Transverse Ranges (Fig. 1a) and lead to localized increases in fire weather conditions via decreased relative humidity and increased wind (Figs. 1b, c and 2). As the regimes evolve from the Sundowner-only to SAW-only, a progression in amplification and positive tilt of the 500 hPa heights is observed with 1020 hPa MSLP contours extending further inland and a deepening trough in the Gulf of Alaska. While our composite analysis clearly indicates differences between Sundowner and SAW regimes, the weak MSLP anomalies and more zonal 500 hPa flow during Sundowners does not provide a compelling mechanism for their origin. This is consistent with the findings of Cannon et al. (2017) and suggests the important role of mesoscale forcing between low-level wind and terrain.
Focusing on the low-level (925 hPa) winds near the Southern California Bight, the presence of a 12 ms−1 north-northwesterly coastal jet is observed offshore of California with northerly flow in the region of the Santa Ynez during Sundowner-only events (Fig. 4a and c). The offshore coastal jet is a climatological feature of the eastern Pacific (Doubler et al., 2015) and may have a role in creating Sundowner winds if this northerly momentum is advected eastward, producing strong cross-mountain flow over the Santa Ynez. This low-level jet feature is absent during SAW-only events and the flow throughout the offshore portion of the domain has a larger easterly component, particularly over California (Fig. 4b and d). Vertical cross sections are consistent with the low-level coastal jet offshore of California and winds between −5 and −7.5 ms−1 up- and downstream of the terrain near Santa Barbara during Sundowner-only conditions (Fig. 5a and c). This is consistent with the case studies of Cannon et al. (2017) and the requirement for strong cross-mountain flow in downslope windstorms (Smith, 1979; Durran, 1990). Composites for SAW-only events indicates weak to no northerly wind (0 to −2.5 ms−1) in the vicinity of Santa Barbara (Fig. 5b and d). SAW events show stronger momentum aloft, consistent with the tighter mid-tropospheric geopotential height gradient (Fig. 3c and f) compared to Sundowner-only events (Fig. 3a and d). The 32 km horizontal resolution of NARR precludes a finer-scale analysis of how coastal winds and topography interact to produce Sundowners and is the subject of continuing research using a 10 year, 2 km horizontal-resolution downscaled climatology produced with a numerical weather prediction model (Smith et al., 2018). This study comprehensively addresses the subsynoptic dynamics of Sundowner wind events.
We defined Sundowner events as observed Santa Barbara airport temperature ramps that occurred outside of the normal diurnal cycle under the assumption that these ramps were driven by adiabatic descent of air parcels over the Santa Ynez Mountains. During the most extreme temperature ramps, reduced relative humidity and increased winds were observed in the foothills and at the coastal plain, thus supporting the validity of this assumption. These identified days were compared to an existing index of Santa Ana wind (SAW) regimes to evaluate potential synoptic differences between these two wind regimes. Sundowners occur most frequently during late spring and have a secondary maximum during winter that is often associated with SAWs. During either season, SAW regimes have distinctly different large-scale conditions compared to Sundowner-only conditions, with Sundowner-only conditions lacking the amplified geopotential heights and enhanced inland anomalous positive MSLP found during SAW regimes. Sundowner-only conditions demonstrated the presence of a low-level northerly coastal jet that was absent during SAW-only regimes. Our results are consistent with Blier (1998) and Cannon et al. (2017), showing that Sundowner winds are a unique phenomenon in the Santa Barbara region. Our findings are limited by the lack of upstream observational data and the small scale of the Santa Ynez mountains, which inhibits the ability of reanalysis output to comprehensively evaluate the three-dimensional characteristics of Sundowner winds. Continuing work seeks to understand more precisely how Sundowner winds are produced and to provide more detailed information regarding their local variability across the Santa Ynez Mountains. This information could improve spot weather forecasts (Nauslar et al., 2016), evaluate future fire–weather–climate interactions (Peterson et al., 2011), and aid mitigating fire hazard in the Transverse Ranges.
The MATLAB code used in this study will be made available upon request to the corresponding author Benjamin J. Hatchett.
All data have been properly cited in the text and are publicly available.
The supplement related to this article is available online at: https://doi.org/10.5194/nhess-18-419-2018-supplement.
CMS designed the temperature ramp identification technique, BJH wrote all code, performed the analysis, and prepared the manuscript with contributions from all co-authors.
The authors declare that they have no conflict of interest.
Benjamin J. Hatchett, Craig M. Smith, and Michael L. Kaplan were supported by
the National Science Foundation Physical and Dynamical Meteorology Program under
award AGS-1419267. Kellen Nelson, Clive Dorman, and two anonymous reviewers
provided helpful comments that improved this manuscript.
Edited by: Joaquim G. Pinto
Reviewed by: three anonymous referees
Abatzoglou, J. T., Barbero, R., and Nauslar, N. J.: Diagnosing Santa Ana Winds in southern California with synoptic-scale analysis, Weather Forecast., 28, 704–710, https://doi.org/10.1175/WAF-D-13-00002.1, 2013.
Balch, J. K., Bradley, B. A., Abatzoglou, J. T., Nagy, R. C., Fusco, E. J., and Mahood, A. L.: Human-started wildfires expand the fire niche across the United States, P. Natl. Acad. Sci. USA, 114, 2946–2951, https://doi.org/10.1073/pnas.1617394114, 2017.
Blier, W.: The Sundowner winds of Santa Barbara, California, Weather Forecast., 13, 702–716, https://doi.org/10.1175/1520-0434(1998)013<0702:TSWOSB>2.0.CO;2, 1998.
Cannon, F., Carvalho, L. M. V., Jones, C., Hall, T., Gomberg, D., Dumas, J., and Jackson, M.: WRF simulation of downslope wind events in coastal Santa Barbara county, Atmos. Res., 191, 57–73, https://doi.org/10.1016/j.atmosres.2017.03.010, 2017.
Doubler, D. L., Winkler, J. A., Bian, X., Walters, C. K., and Zhong, S.: An NARR-derived climatology of southerly and northerly low-level jets over North America and coastal environs, J. Appl. Meteorol. Clim., 54, 1596–1619, https://doi.org/10.1175/JAMC-D-14-0311.1, 2015.
Durran, D. R.: Mountain waves and downslope winds, Meteorol. Monogr., 23, 60–83, 1990.
Guzman-Morales, J., Gershunov, A., Theiss, J., Li, H., and Cayan, D.: Santa Ana winds of southern California: Their climatology, extremes, and behavior spanning six and a half decades, Geophys. Res. Lett., 43, 2827–2834, https://doi.org/10.1002/2016GL067887, 2016.
Hughes, M. and Hall, A.: Local and synoptic mechanisms causing southern California's Santa Ana winds, Clim. Dynam., 34, 847–857, https://doi.org/10.1007/s00382-009-0650-4, 2010.
Iacobellis, S. F. and Cayan, D. R.: The variability of California summertime marine stratus: Impacts on surface air temperatures, J. Geophys. Res.-Atmos., 118, 9105–9122, 2013.
Lawrence, M. G.: The Relationship between relative humidity and the dewpoint temperature in moist air: A simple conversion and applications, B. Am. Meteorol. Soc., 86, 225–233, https://doi.org/10.1175/BAMS-86-2-225, 2005.
Martinuzzi, S., Stewart, S. I., Helmers, D. P., Mockrin, M. H., Hammer, R. B., and Radeloff, V. C.: The 2010 wildland urban interface of the conterminous United States, Research Map NRS-8, United States Department of Agriculture, Newton Square, PA, 124 pp., available at: https://www.fs.fed.us/nrs/pubs/rmap/rmap_nrs8.pdf (last access: 1 April 2017), 2015.
Mensing, S. A., Michaelson, J., and Byrne, A.: A 560-year record of Santa Ana fires reconstructed from charcoal deposited in the Santa Barbara Basin, Quatern. Res., 51, 295–305, 1999.
Mesinger, F., DiMego, G., Kalnay, E., Mitchell, K., Shafran, P. C., Ebisuzaki, W., Jović, D., Woollen, J., Rogers, E., Berbery, E. H., Ek, M. B., Fan, Y., Grumbine, R., Higgins, W., Li, H., Lin, Y., Manikin, G., Parrish, D., and Shi, W.: North American regional reanalysis, B. Am. Meteorol. Soc., 87, 343–360, https://doi.org/10.1175/BAMS-87-3-343, 2006.
Moritz, M. A.: Spatiotemporal analysis of controls on shrubland fire regimes: Age dependency and fire hazard, Ecology, 84, 351–361, https://doi.org/10.1890/0012-9658(2003)084[0351:SAOCOS]2.0.CO;2, 2003.
Moritz, M. A., Moody, T. J., Krawchuk, M. A., Hughes, M., and Hall, A.: Spatial variation in extreme winds predicts large wildfire locations in chaparral ecosystems, Geophys. Res. Lett., 37, L04801, https://doi.org/10.1029/2009GL041735, 2010.
Nauslar, N. J., Brown, T. J., and Horel, J. D.: 2016: Verification of National Weather Service spot forecasts using atmospheric sounding observations, J. Operat. Meteorol., 4, 46–57, https://doi.org/10.15191/nwajom.2016.0404, 2016.
Peterson, S. H., Moritz, M. A., Morais, M. E., Dennison, P. E., and Carlson, J. M.: Modelling long-term fire regimes of southern California shrublands, Int. J. Wildland Fire, 20, 1–16, https://doi.org/10.1007/s00382-013-2022-3, 2011.
Raphael, M. N.: The Santa Ana winds of California, Earth Interact., 7, 1–13, https://doi.org/10.1175/1087-3562(2003)007<0001:TSAWOC>2.0.CO;2, 2003.
Sharples, J. J., Mills, G. A., McRae, R. H., and Weber, R. O.: Foehn-like winds and elevated fire danger conditions in Southeastern Australia. J. Appl. Meteorol. Clim., 49, 1067–1095, https://doi.org/10.1175/2010JAMC2219.1, 2010.
Smith, C. M., Koračin, D., and Horvath, K.: Day-ahead predictability of complex terrain flows for wind resource production: A case study of the Washoe Zephyr, Weather Forecast., 29, 1343–1355, https://doi.org/10.1175/WAF-D-14-00021.1, 2014.
Smith, C. M., Hatchett, B. J. and Kaplan, M. L.: Characteristics of Sundowner winds near Santa Barbara, CA from a dynamically downscaled climatology: Environment and effects near the surface, J. Appl. Meteorol. Clim., https://doi.org/10.1175/JAMC-D-17-0162.1, in press, 2018.
Smith, R. B.: The influence of mountains on the atmosphere, Adv. Geophys., 21, 87–230, https://doi.org/10.1016/S0065-2687(08)60262-9, 1979.
Westerling, A. L., Cayan, D. R., Brown, T. J., Hall, B. L., and Riddle, L. G.: Climate, Santa Ana winds and autumn wildfires in southern California, Eos Trans. AGU, 85, 289–296, https://doi.org/10.1029/2004EO310001, 2004.
Williams, A. P. and Abatzoglou, J. T.: Recent advances and remaining uncertainties in resolving past and future climate effects on global fire activity, Curr. Clim. Change Rep., 2, 1–14, https://doi.org/10.1007/s40641-016-0031-0, 2016.