the Creative Commons Attribution 4.0 License.
the Creative Commons Attribution 4.0 License.
 | 19 Dec 2018
Weight analysis of influencing factors of dam break risk consequences
Zongkun Li
Wei Li
Wei Ge
There are numerous influencing factors of the risk consequences of dam break. The scientific and reasonable index system and its weight distribution are some of the key elements for comprehensive evaluation of the dam break risk. Taking into consideration 20 factors, including hazards, exposure and vulnerability, the evaluation index system of the consequences of dam break risk is constructed. Using the Statistical Cloud Model (SCM) to improve the entropy method, we establish the weight calculation model of the influencing factors of dam break risk consequences. The results shows that the top five factors with the highest weight are risk population, flood intensity, alert time, risk understanding and distance from the dam. Compared to traditional algebraic weight calculation methods, the result is basically consistent with the algebraic weight distribution, and increases the range by 2.03 times, supporting a more scientific basis for recognizing and evaluating dam break risk consequences.
- Article
(4726 KB) - Full-text XML
- BibTeX
- EndNote


Comprehensive evaluation of the risk consequences of dam break is the overall description of the severity of the consequences of dam failure (Ling et al., 2009). The factors that can influence the risk consequences of dam break are usually composed of three factors, namely, hazards, exposure and vulnerability (Zhang et al., 2006; Smith, 2013). The vulnerability factor can be further divided into four aspects: loss of life, economic loss, social impact and environmental impact. From the point of view of system science, the dam break flood disaster system is a dynamic system with high dimensionality, complexity and uncertainty (Ge et al., 2017). It correlates with the development trend in risk assessment research “from low dimensional linearity to complex high-dimensional nonlinearity”, “from single scale to multi-dimensional space–time scale”, “from single scenario to combined scenario” and “from certainty to uncertainty” (Zou et al., 2013).
Previous research on the index system of risk consequences and its weight is not sufficient. The uncertainty of the impact of dam failure is explored and suggestions for the research index system are given (Lee and Noh, 2003; Wagenaar et al., 2016). The relationship among hazard-influencing factors and relationship between exposure and vulnerability factors are very complicated and the different types of flood including dam break flood can cause different degrees of life loss (Jonkman et al., 2018; Wisner and Uitto, 2009). The indirect loss index for natural disasters is introduced and their weight is calculated using the traditional algebraic method (Daniell et al., 2018). The DAMBREAK computer program is utilized to analyze the downstream environmental impact and present 21 influence receptors, but the weight distribution of them is too average (Colomer Mendoza and Gallardo, 2008). The Statistical Cloud Model (SCM) is used for qualitative and quantitative transformation to analyze regional water safety systems, but it is not combined with the weight calculation (Ren et al., 2017). In the quantitative evaluation of risk consequences, we need to consider the combined effects of various factors, in which weight is key. The function of weight is to coordinate and balance the difference among the indexes. It is a measure to unify each index without considering the dimension difference among the indexes. In order to evaluate the risk consequences more comprehensively and objectively, many influencing factors are needed. However, too many indicators, more than nine for example, will bring such problems as difficulty in expert scoring and consistency testing and too average of a weight distribution.
In the course of calculating the weights, different methods have their own emphasis. For example, the entropy weight method as one of the important methods of weight calculation, does not adequately consider the subjective opinions of experts. The analytic hierarchy process (AHP) is faced with the difficulty of consistency checking when dealing with the conditions of multiple factors (more than nine) (Su et al., 2016). When previous studies used the data of SCM to calculate weights, they had neglected the entropy when applying the SCM to convert subjective opinions, resulting in the imperfection of information utilization (Mithas et al., 2011; Wan et al., 2015). These mentioned defects all lead to lack of scientificity in the calculation of weight. This paper introduces SCM, which can reflect the fuzziness and randomness, to improve the entropy method for analyzing the weight of influencing factors of dam break risk consequences. The scientific influencing factors' weight will provide an important basis for further research on the dam break risk comprehensive evaluation and for the establishment and improvement of dam risk management theory.
2.1 Risk index system
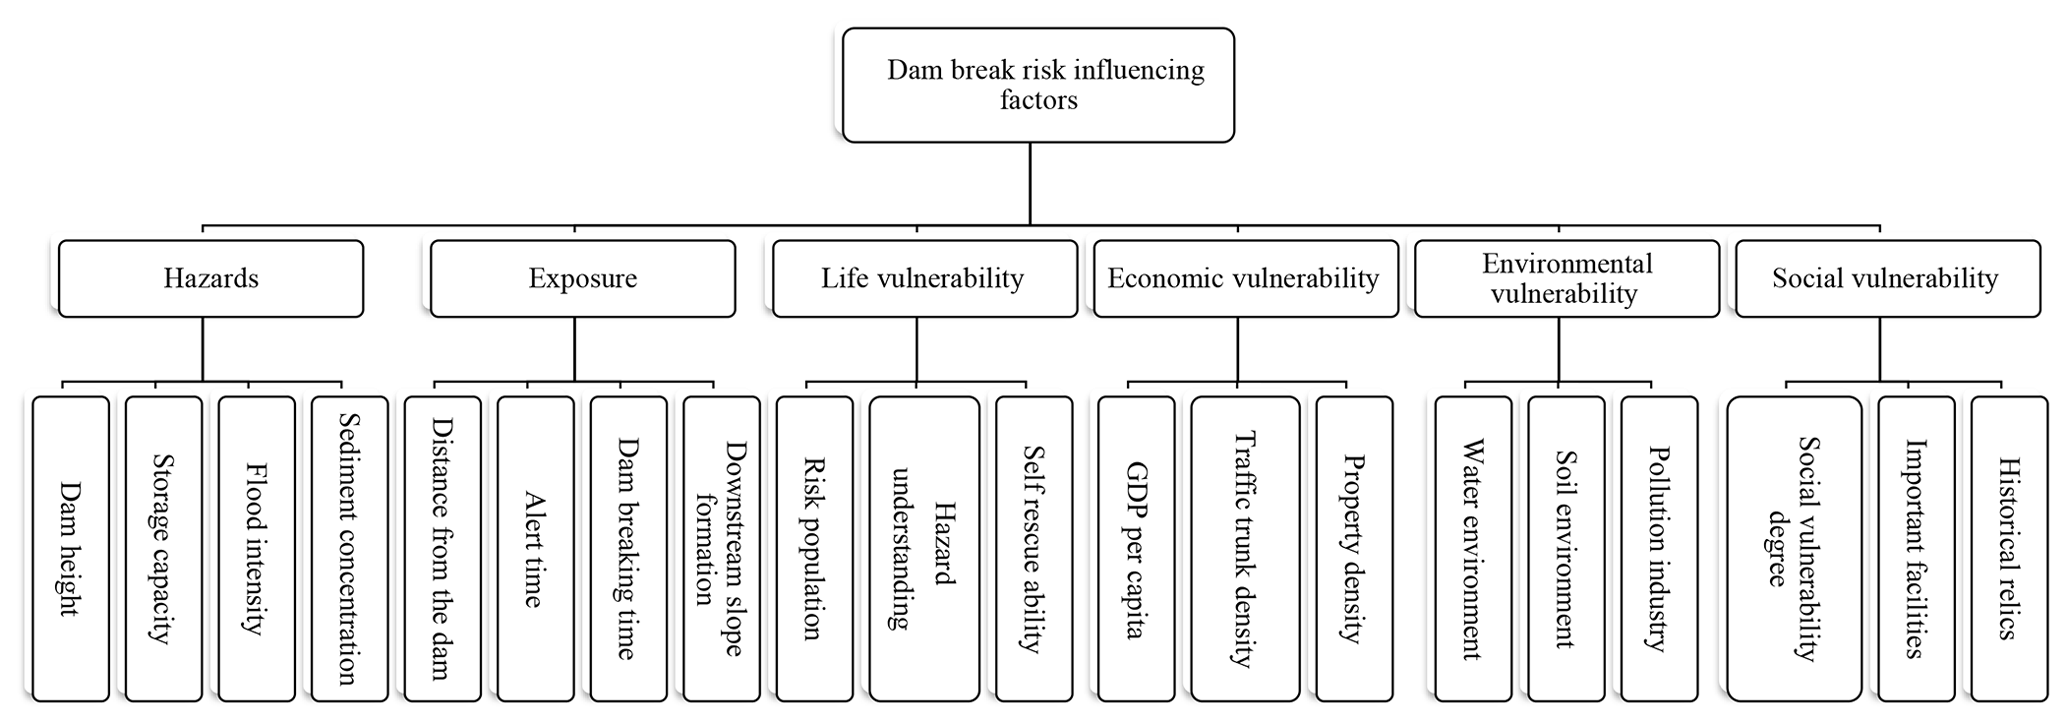
The establishment of an evaluation index system is a systematic process. A scientific and reasonable evaluation index system is the guarantee for accurate risk assessment of dam failure, and the evaluation result is helpful for later research. Influencing factors of dam break risk consequences are many and complicated in both quality and quantity, direct and indirect contribution, and natural and social effects (Zhou et al., 2014). We choose representative indicators as much as possible to reduce the mutual influence and derivative of the indicators. For example, the risk population is the most direct factor of life loss; we only set it in life-bearing bodies, even though it influences the economic and social aspects, but an indirect and less crucial way (Dutta et al., 2003). In the selection of economic impact factors, the selection of GDP (gross domestic product) per capita can better reflect the economic situation of the dam area. Compared with the GDP of the area, it is more accurate. Similarly, some crucial comprehensive indicators have also been selected, for example, flood intensity parameters that directly destroy downstream of the dam, and water environment and soil environment, which respectively refer to the quality of water and soil after being washed by a dam break flood. Another important indicator is the comprehensive ability and social carrying capacity, which include the performance of downstream disaster response, disaster rescue and relief capacity, and post-disaster reconstruction capacity. Whether the established index system is scientific and reasonable is directly related to whether it can objectively reflect the nature of the vulnerability itself. On the basis of aforementioned factors and characteristics of the dam break flood system, we establish the risk influencing factor index system scientifically and reasonably as shown in Fig. 1.
2.2 Weight-calculating model based on SCM-improved entropy method
Uncertainty is an intrinsic property of the objective world. The most important and most common uncertainties include fuzziness and randomness (Ragas et al., 2010). The influencing factor system of the dam failure risk consequence is a multilevel and multi-index system with uncertainties (Li et al., 1995). In determining the importance of each risk factor to the comprehensive evaluation of the consequence, a “quantitative conversion” of the uncertainty of the indicator is needed. In the process of conversion, the expert's judgment makes a choice among many different factors that mutually affect each other and will absolutely lead to the ambiguity of boundaries, which is the fuzziness. Conversely, the risk factors of dam break involve many aspects of life, economic loss, and environmental and social impacts. In order to avoid the impact of experts' personal experience and subjective factors in evaluation results, the risk factors of dam break need to adopt the method of group decision-making. When an expert judges diverse risk factors, other experts will have different opinions, reflected in the randomness of judgments. Therefore, the dam break risk assessment system is a complex system integrating fuzziness and randomness. The SCM is invented under this context of random and fuzzy features of the dam break risk system. It describes the concept of clouds, reflects the randomness and fuzziness of concepts in natural language, and realizes the conversion between qualitative and quantitative information (D. Wang et al., 2016; Liu et al., 2018). In the process of group decision-making, the traditional method is only a simple algebraic operation of an expert's ratings, which could not reflect the disagreements of different experts and the concentration of opinions. In fact, experts' opinions are actually a rounded value that focuses on a certain degree of swing, which uses a stable tendency of the random number instead of the exact value, basically consistent with the central idea of SCM and the concept of entropy (Yari and Chaji, 2012; M. Wang et al., 2016).
2.2.1 SCM theory
The SCM, which was proposed by Li Deyi, is a model of uncertainty transformation between a qualitative concept and quantitative numerical representation (Li et al., 1995, 2004). It mainly reflects the fuzziness and randomness of the concept of things or human knowledge in the objective world and integrates these two together. Constituting the mutual mapping between qualitative and quantitative, the cloud generator is the key to the SCM's practical application.
Membership cloud. Suppose a universe U={x}; L is the language value of the link in U. The membership degree RL (x) of the element x in U to the qualitative concept expressed by L is a stable random number. The membership degree distributed in the universe of discourse is called the membership cloud as shown in Fig. 2.
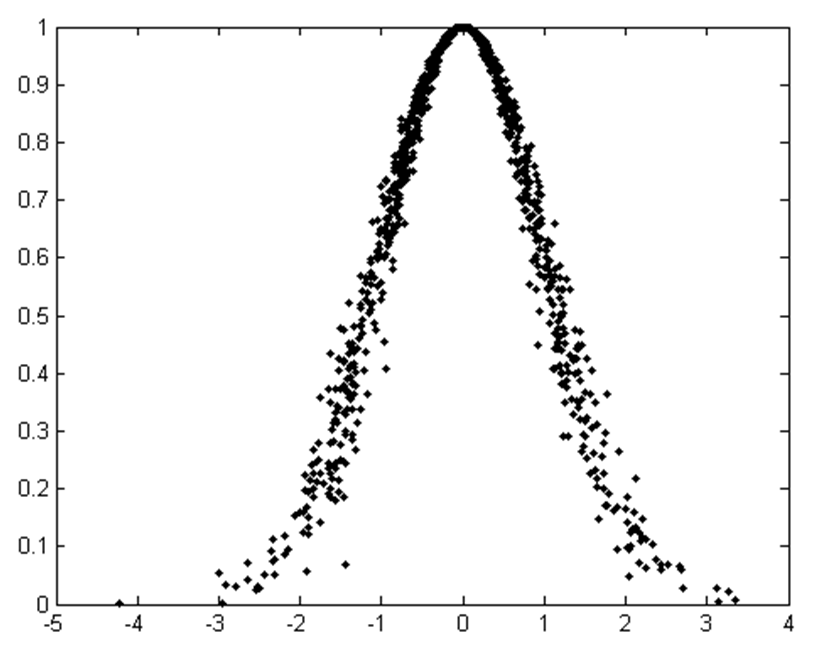
The x and y axes are for the expectation number and probability of distribution, respectively. RL (x) takes a value between 0 and 1, whereas the cloud represents the mapping from the universe U to the interval [0,1], that is, RL (x): , , x→RL (x).
It can be seen that the qualitative concept to the quantitative value on the universe U is a one-to-many mapping relation, rather than a one-to-one relationship on the traditional fuzzy function. The degree of membership of x to L is a probability distribution, not a fixed value. SCM uses the expectation (Ex), entropy (En) and hyper-entropy (He) as a whole to characterize an uncertain concept.
Expectation (Ex). The mathematical expectation of cloud drop distribution in the universe of discourse, that is, the domain value corresponding to the centric of the area under the coverage of the membership cloud, is the domain value x of the degree of membership. Generally, it is the point most capable of characterizing the qualitative concept, reflecting the information center value of the corresponding fuzzy concept.
Entropy (En). En is a measure of the ambiguity of a qualitative concept, reflecting the range of values that can be accepted by the concept in the universe U. In the SCM, entropy is mainly used to measure the ambiguity and probability of qualitative concepts, reflecting the uncertainty of qualitative concepts. The larger the En is, the larger the range of values that can be accepted by the concept and the more obscure the concept is. It embodies the flexibility of qualitative language.
Hyper-entropy (He). The measure of En uncertainty, entropy of entropy, reflects the discreteness of cloud drops. When the He is larger, the dispersion of cloud droplets is greater, that is, the greater the randomness of the membership value is and the greater the “thickness” of the cloud can be. When it is closer to the concept center or away from the center, the randomness is relatively small, which is similar to a person's subjective feelings.
Cloud generator. The generator is the most basic cloud algorithm, which can achieve quantitative range and distribution rules from the qualitative information expressed in language value. Cloud generators are mainly divided into the forward cloud generator and the backward cloud generator. The conversion process from qualitative concept to quantitative representation is conducted in the forward cloud generator; the conversion process from quantitative representation to qualitative concept is produced by the backward cloud generator.
2.2.2 Entropy method
The subjective weight analysis method is more dependent on the experts' opinions, and the consistency test under many factors is very difficult (Yari and Chaji, 2012). Therefore, this paper introduces the entropy weight method as an objective weight calculation method. Entropy is a measure of uncertainty or randomness in information theory (Ouyang and Shi, 2013). In general, the more uncertain or random the event is, the more information it will contain, so the bigger the entropy is. Therefore, the most important part of the entropy method is obtaining the differences in information, which is the degree of variation (Wang and Chen, 2016). According to the degree of variation of each index, we can calculate the entropy of each factor and then use the entropy to adjust the weight of it, and finally the objective weight value of the factors in the system is obtained.
The contribution of the numerical value in high frequencies or common consensus factor to the qualitative concept is greater than that of the numerical value in low frequencies (Yang and Nataliani, 2018). The En in the SCM could coincide with the idea of the entropy method in essence (T. Wang, 2015; Dong et al., 2010). This paper makes use of similar connotations of the SCM and entropy methods. The objective advantages of the entropy method need to be based on large numbers of score samples, which can be produced by the SCM cloud generator to obtain enough samples from limited expert opinions. This paper attempts to use the SCM of the qualitative–quantitative conversion model to improve the entropy method and make a scientific and objective response to the weight of risk factors.
2.2.3 Improved entropy method based on SCM
Suppose there are n indicators (column vectors) and m experts (row vectors). Each indicator computes the expectation and variance according to the cloud model. The statistical equation for calculating the jth indicator is as follows (Li et al., 1995).
The weight equation for the indicator calculated with the use of the conventional algebraic method is as follows:
This algebraic method is easy to use, but it does not make any use of the changes of En in the SCM and may be misleading. For example, when the average scores of all indicators are the same, the weight of each indicator will calculate the same result. However, Enj and Hej could change greatly but will not make enough reflection of the change in the original equation, so an improved model is needed to replace this equation, as follows:
If the Enj is not equal to 0, the equation of the weight is revised and the cloud entropy is involved in the calculation. The larger the cloud entropy, the more divergence of opinions the expert has on the index, so the weight of the index should be reduced. The smaller the entropy is, the smaller the expert's disagreement on the indicator, so the weight of the indicator should be increased. When the minimum entropy Enj is equal to 0, indicating that the indicators of the experts have the same score, then the weight of the equation remains unchanged.
3.1 Expert scoring
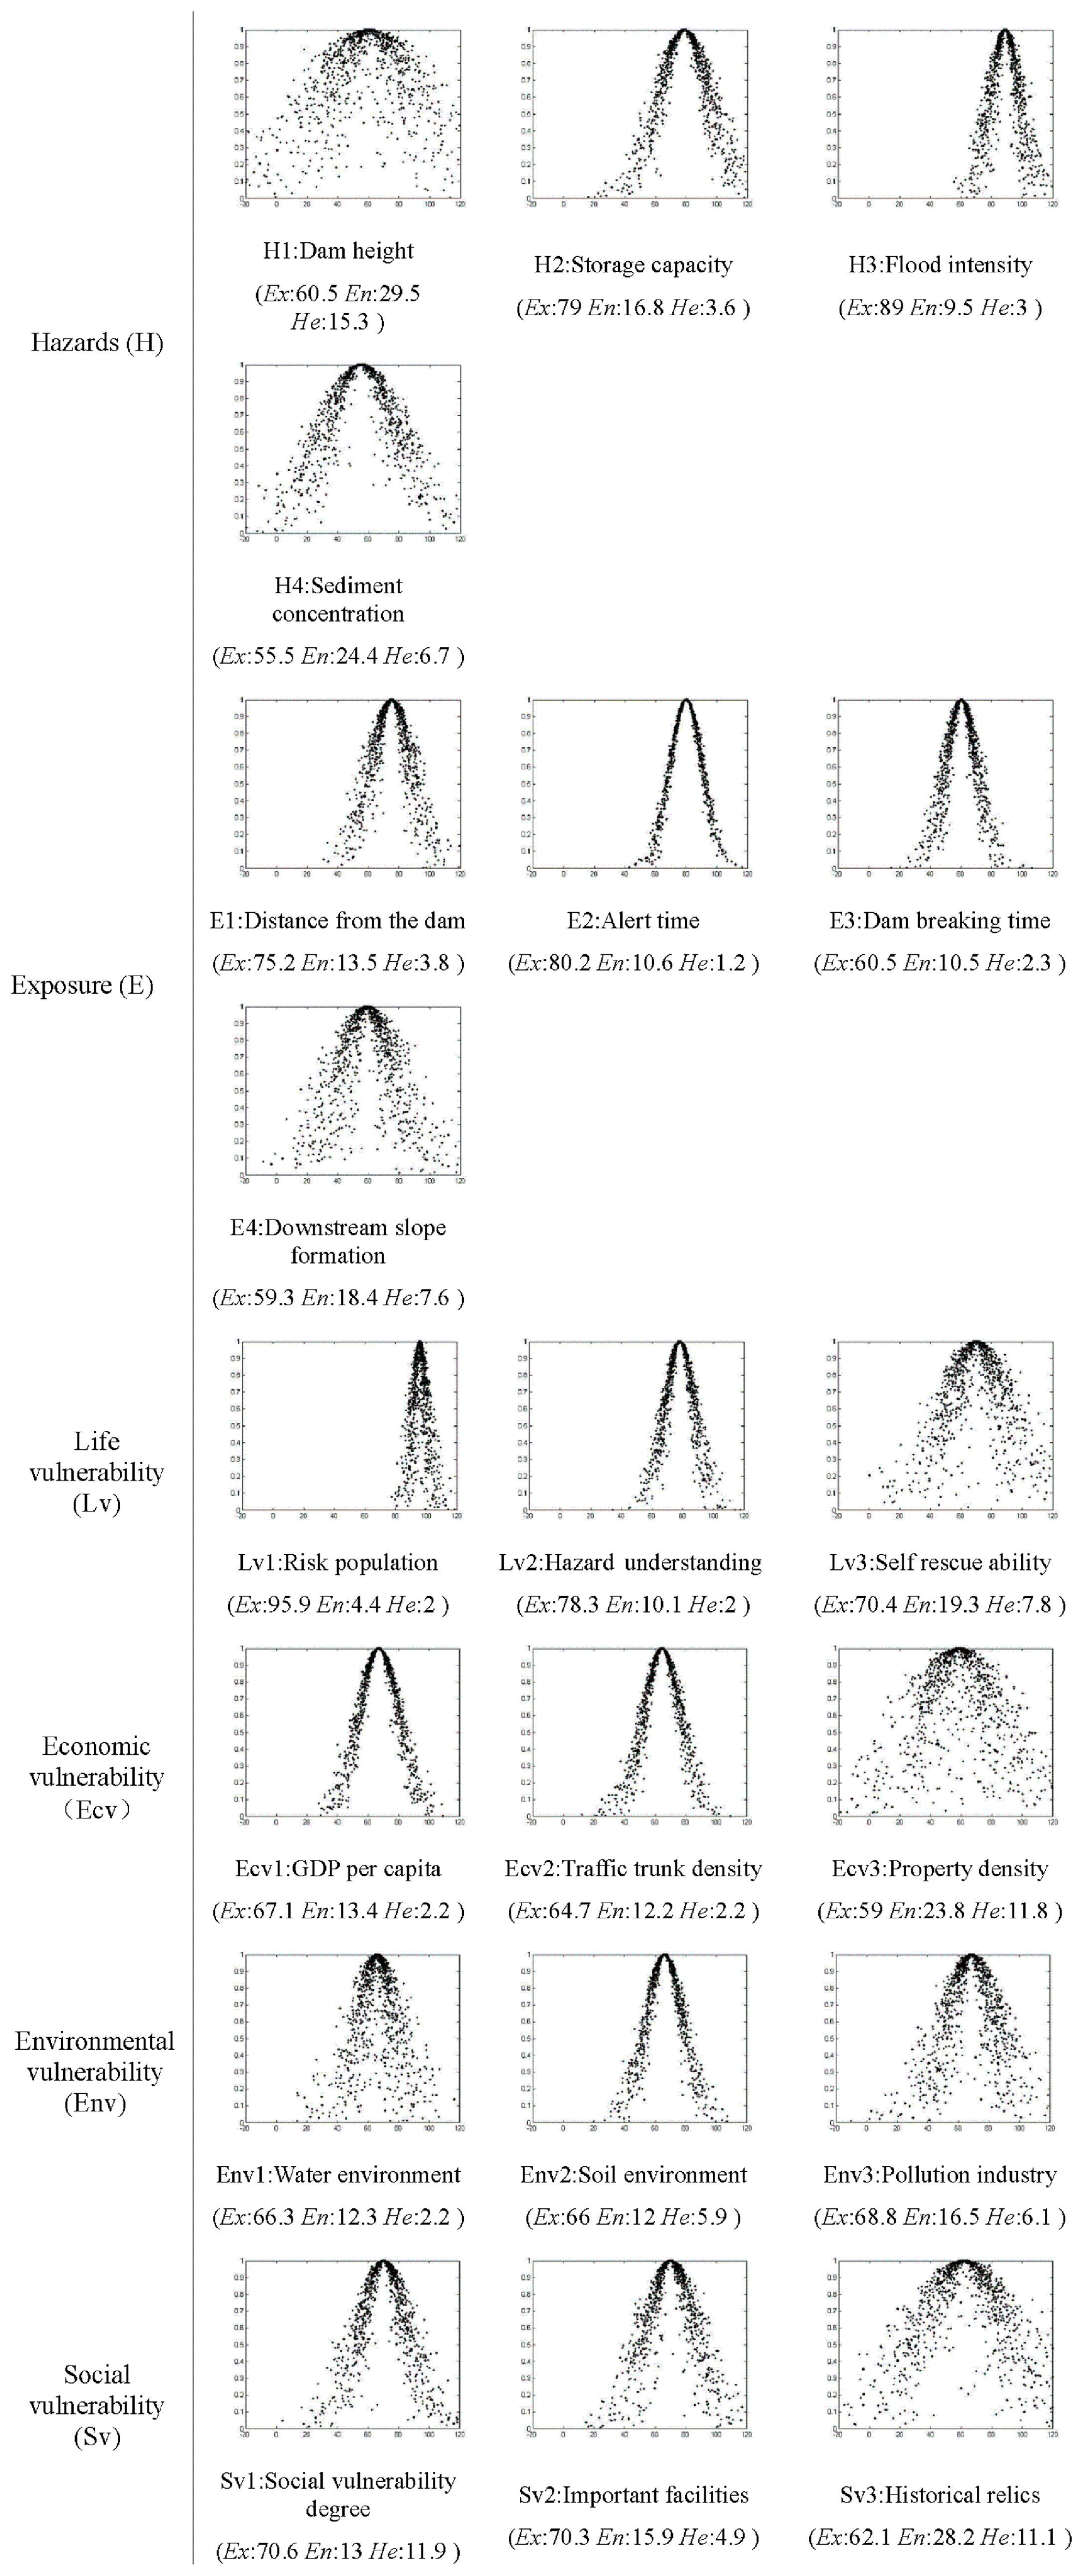
According to the requirement of data volume based on the entropy method, we invited 20 experts to score the index system. Each index scoring adopts a 100 integral point system, according to the importance without any comparison among each other. Scoring points should be scored from the perspective of comprehensive assessment of the risk consequences of the dam break in the same magnitude. This scoring method can obtain the most intuitive opinion from the expert without implying any preference of the factors and makes the scoring process easier. In accordance with the result of the score obtained by the backward cloud generator (Xu, 2016) based on Eqs. (1) to (3), Exj, Enj and Hej are obtained. In order to reflect the model characteristics of expert scoring more intuitively, the outstanding advantage of SCM, we present the sketch map of these 20 factors' membership cloud as in Fig. 3.
As shown in Fig. 3, the center vertex of the cloud is Ex, En represents the width of the cloud and He represents the degree of dispersion of cloud distribution, that is, the thickness of cloud lines. For instance, the closer Ex is to the right side of the axis, the higher the experts' score. The En of Lv3 is larger than that of Lv1; we can find the cloud is wider, and the He of E4 is larger than that of E2, so the distribution of the cloud is obviously thicker than E2. Thus, the membership cloud can obviously reflect the degree of divergence and randomness of expert opinions.
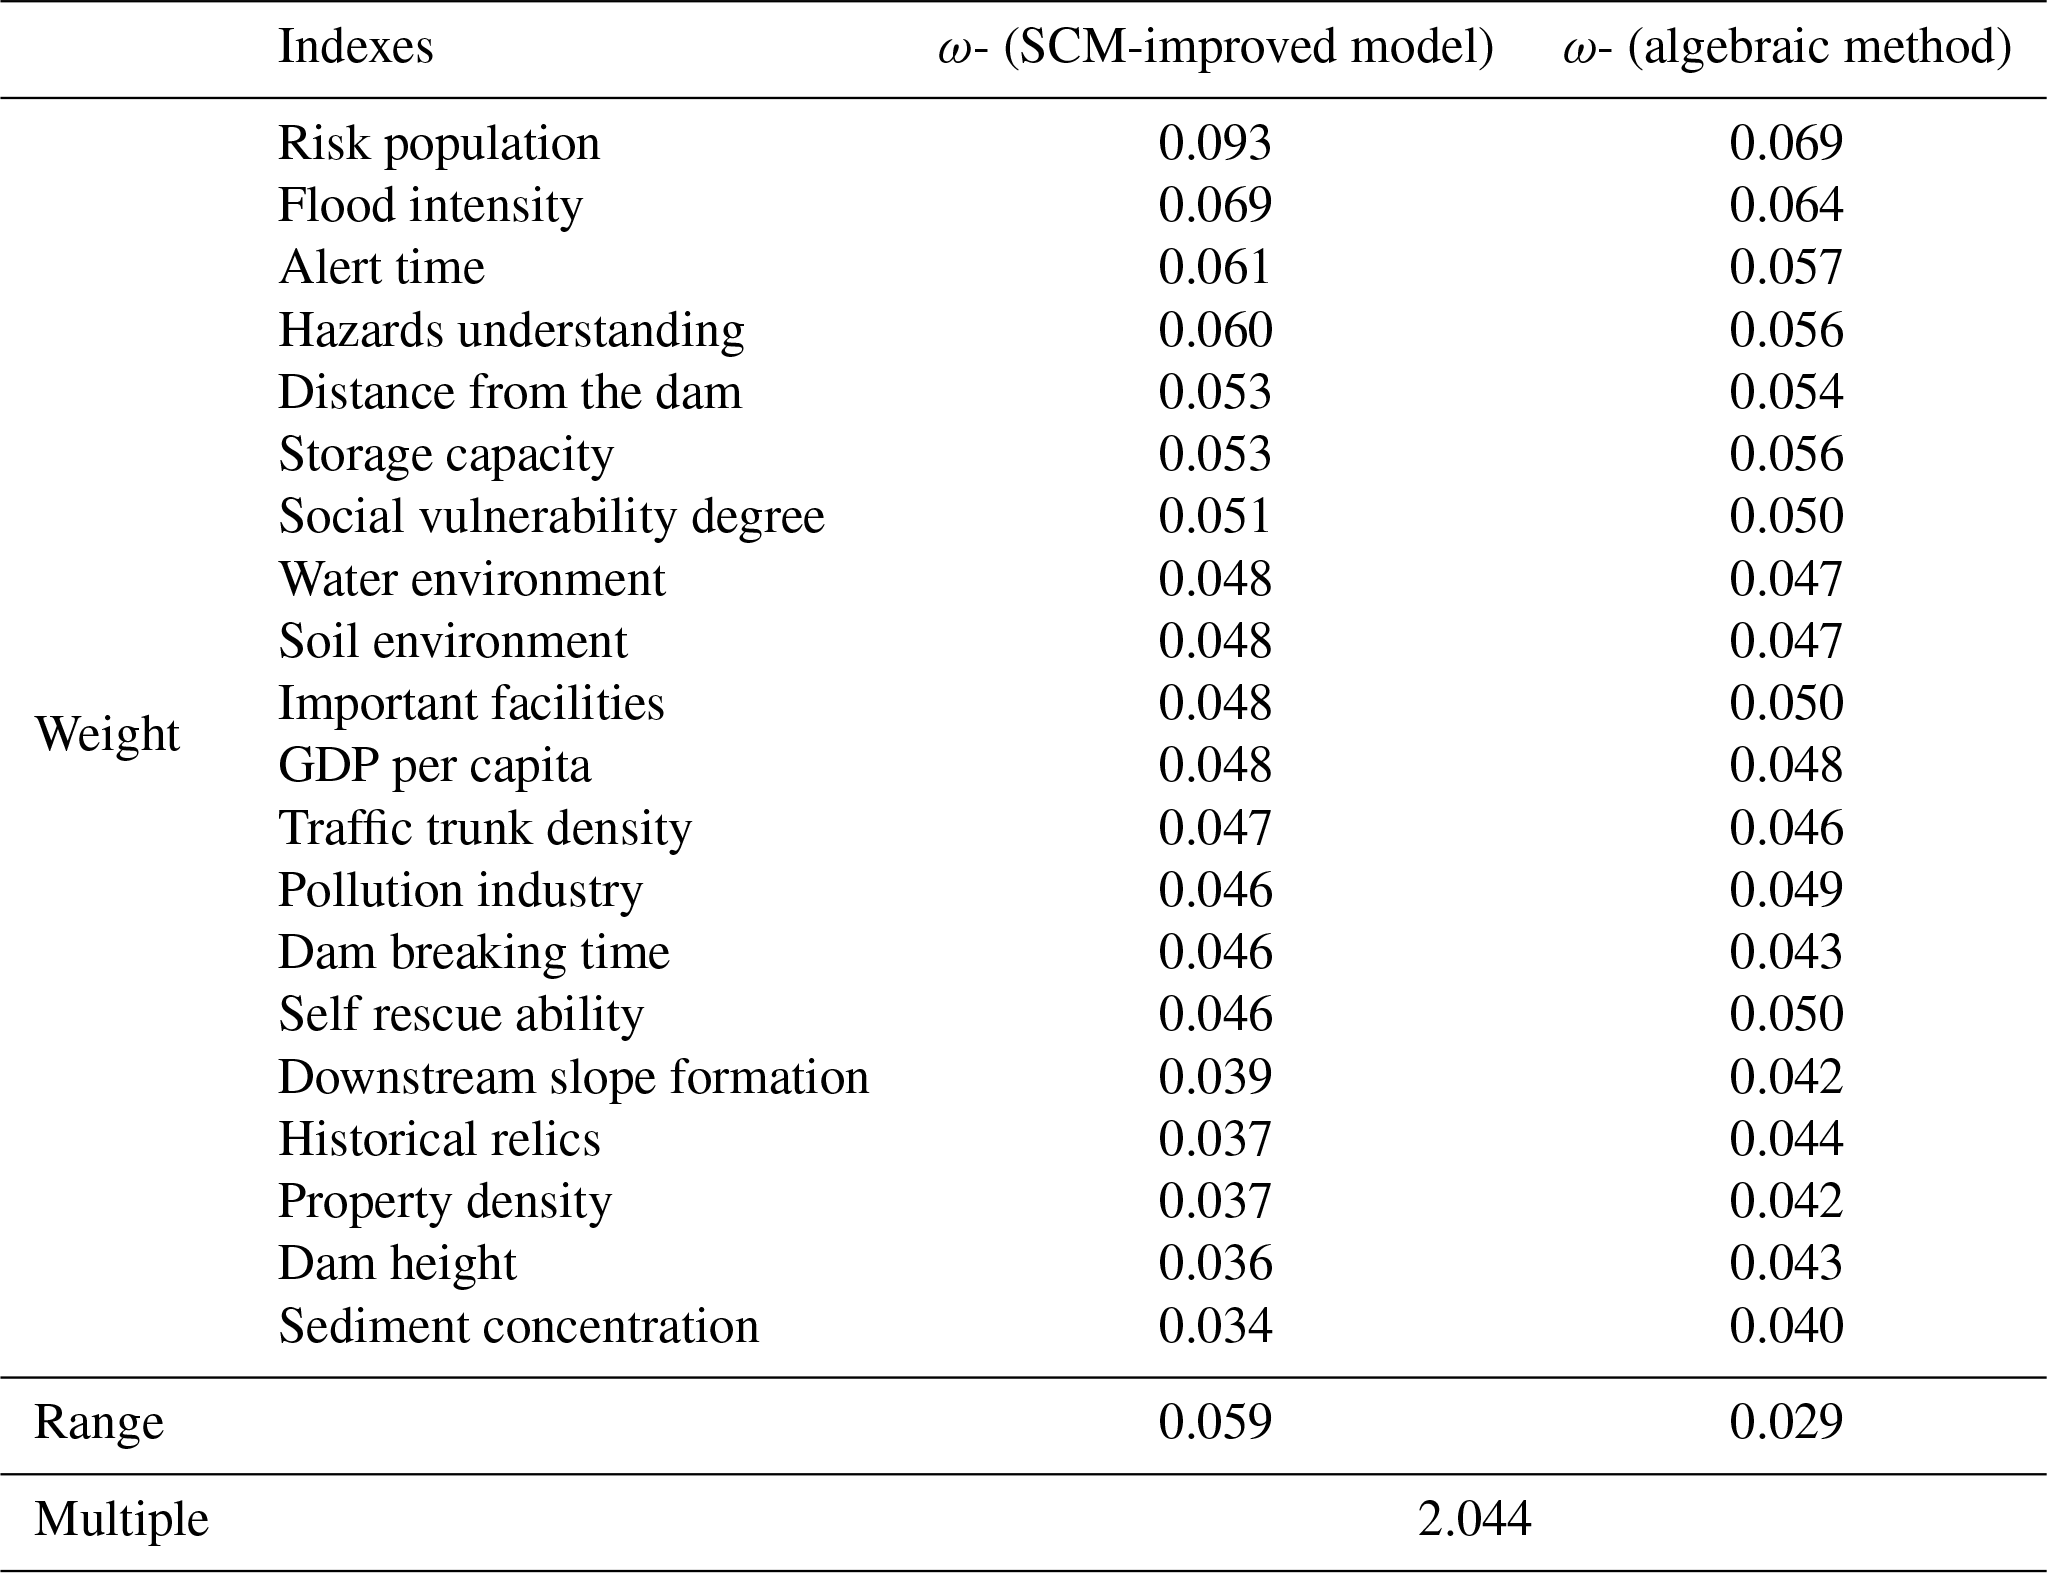
3.2 Weight calculation
After the result of the scoring is processed by the backward cloud generator according to Eqs. (1) to (3) and (5), the improved weight distribution result and result comparing the algebraic method are shown in Table 1.
3.3 Discussion
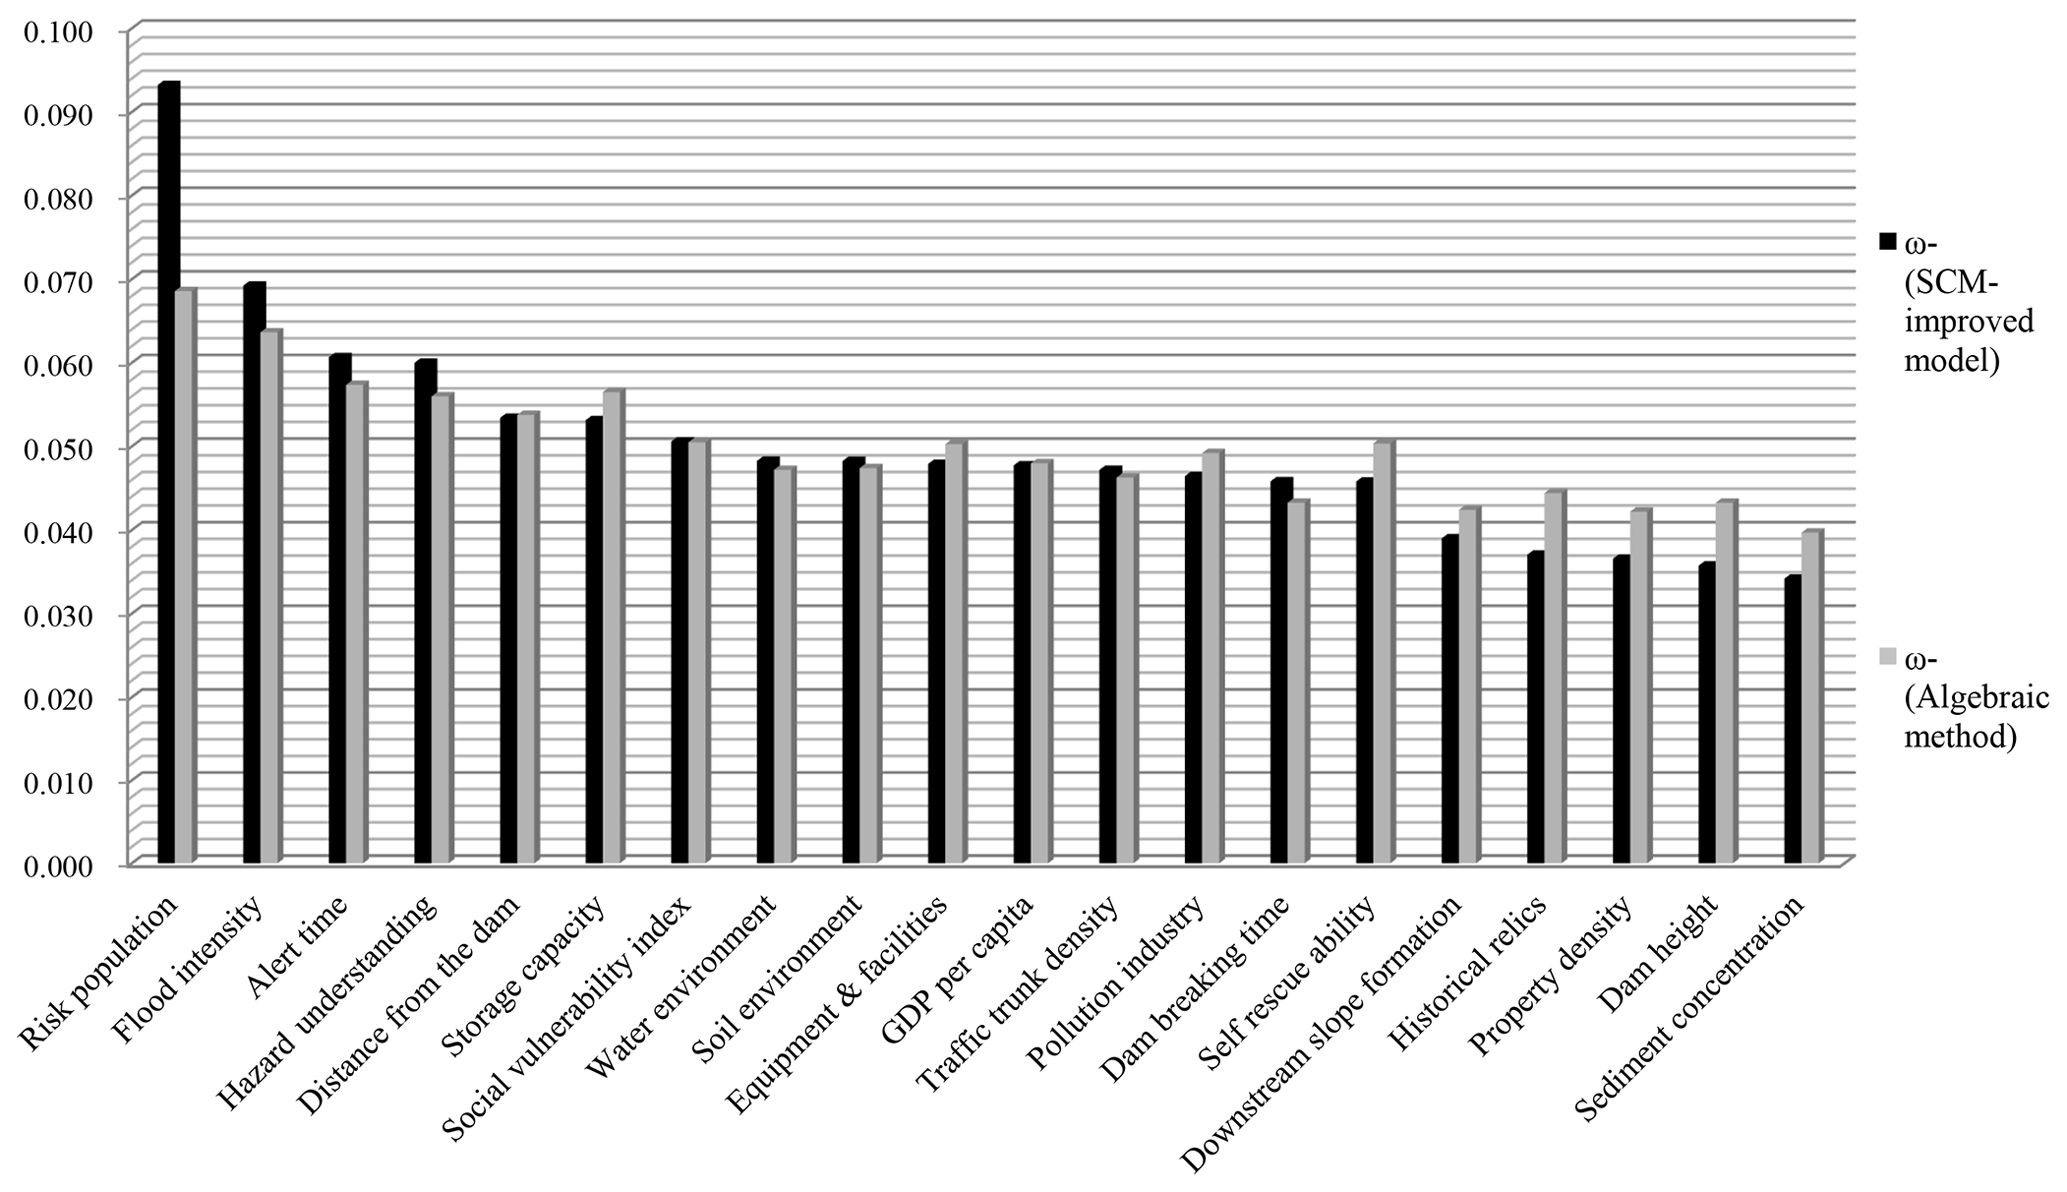
In order to verify the validity of the method, the results of the distribution contrast of the original and improved methods are drawn as Fig. 4.
According to Figs. 3, 4 and Table 1, the analysis of figures shows the following.
-
The top rankings have not changed after the adjustment and still maintain the consistency of ranking. All of these top-ranking factors are scored higher and the opinions are concentrated, which is in line with the objective situation. At the same time, the range increased by 2.04 times, avoiding the problem of decentralization of weight distribution.
-
The distribution of weights basically corresponds to the numerical value of Ex, reflecting the opinions of experts. At the same time, according to the adjustment of En, which reflects the difference of expert opinion, the weight of opinion-unified index is further enlarged. Several factors reduced the weight due to the large differences in opinions and the further reduction in adjusted weights. This reflects the validity of the entropy method in handling the weight distribution through the differences in opinions.
Thus, it can be seen that the SCM-improved entropy weight model is more in keeping with the general cognition of the people while ensuring the objective and fair data.
Dam break is a kind of low-probability and high-loss risk event with uncertainties. In this paper, risk factors are divided into hazards, exposure and vulnerability factors, and 20 factors are selected as the main influencing factors of dam break risk consequences. We used SCM to improve the entropy method, based on the idea that these two methods are dealing with the divergence. The fuzziness index of the information is generated by the backward cloud generator and then applied to the improved formula of the entropy weight calculation model. We establish the weight calculation model of influencing factors of dam break risk. The results indicate that (1) the result of weight calculation conforms to expert cognition; the main factors' weight ranking is basically consistent with the one calculated with the traditional algebraic method. (2) Under the condition of 20 factors, the average problem of weight distribution is overcome; the difference between the maximum and the minimum is 2 times larger. (3) This model has the advantages of extensive applicability, benefiting from the flexibility of index selection and the independence of expert scoring. The method can be applied not only to the weighting analysis of risk factors before the dam break, but also to the analysis of disaster loss after the dam break through the targeted selection of indicators. Meanwhile, in view of the commonality of risk indicators, experts from different countries can obtain the weight distribution applicable to them according to their specific tendencies. The understanding of weight can help stakeholders to take more targeted measures to control risk factors and to allocate the reinforcement fund more reasonably, thereby improving the effect of risk control and risk management. In a word, it is reasonable and feasible to apply this improved model to the weight analysis of dam break risk factors, providing a solid foundation for risk assessment and risk management theory.
The conversion computing program can be accessed in the references (Xu, 2016). The database for calculating the weight is in Fig. 3.
ZL and WG provided the funding acquisition and supervision. WL developed the model and wrote the original draft. WL prepared the paper with contributions from all co-authors.
The authors declare that they have no conflict of interest.
This article is part of the special issue “Flood risk assessment and management”. It is not associated with a conference.
This work was funded by National Natural Science Foundation of China (grant
nos. 51679222, 51709239, 51379192), China Postdoctoral Science Foundation
(grant no. 2018M632809), Science and Technology Project of Henan Province of
China (grant no. 182102311070), Key Project of Science and Technology
Research of Education Department of Henan Province of China (grant no.
18A570007) and Science and Technology Project of Water Conservancy of Henan
Province of China (grant no. GG201813). We also thank the four reviewers and
referees for insightful comments that improved an earlier version of this
paper.
Edited by: Dhruvesh
Patel
Reviewed by: one anonymous referee
Colomer Mendoza, F. J. and Gallardo, I. A.: Design of a model to assess the environmental risk of leachate dams, Waste Manage., 28, 2122–2133, 2008.
Daniell, J. E., Khazai, B., and Wenzel, F.: Chapter 6 – Indirect Loss Potential Index for Natural Disasters for National and Subnational Analysis, Risk Modeling for Hazards & Disasters, 139–173, https://doi.org/10.1016/C2015-0-01065-6, 2018.
Dong, Q., Ai, X., Cao, G., Zhang, Y., and Wang, X.: Study on risk assessment of water security of drought periods based on entropy weight methods, Kybernetes, 39, 864–870, 2010.
Dutta, D., Herath, S., and Musiake, K.: A mathematical model for flood loss estimation, J. Hydrol., 277, 24–49, 2003.
Ge, W., Li, Z., Liang, R. Y., Li, W., and Cai, Y.: Methodology for establishing risk criteria for dams in developing countries, case study of china, Water Resour. Manage., 31, 4063–4074, 2017.
Jonkman, S. N., Godfroy, M., Sebastian, A., and Kolen, B.: Brief communication: Loss of life due to Hurricane Harvey, Nat. Hazards Earth Syst. Sci., 18, 1073-1078, https://doi.org/10.5194/nhess-18-1073-2018, 2018.
Lee, J. S. and Noh, J. W.: The impacts of uncertainty in the predicted dam breach floods on economic damage estimation, KSCE J. Civ. Eng., 7, 343–350, 2003.
Li, D., Meng, H., and Shi, X.: Membership clouds and membership cloud generators, Journal of Computer Research & Development, 32, 16–21, 1995.
Li, D. Y., Liu C. Y., and Du, Y.: Artificial Intelligence with Uncertainty, Journal of Software, 15, 1583–1594, 2004.
Ling, H., Sun, Y. F., Wang, X. L., and An, J.: Environmental risk evaluation based on dam-break flood numerical simulation, Paper presented at the International Conference on Bioinformatics and Biomedical Engineering, 1–4, Beijing, China, 11–13 June 2009.
Liu, Y., Qin, Z., Hu, B., and Feng, S.: State fusion entropy for continuous andsite-specific analysis of landslide stability changing regularities, Nat. Hazards Earth Syst. Sci., 18, 1187–1199, https://doi.org/10.5194/nhess-18-1187-2018, 2018.
Mithas, S., Ramasubbu, N., and Sambamurthy, V.: How information management capability influences firm performance, Mis. Quart., 35, 237–256, 2011.
Ouyang, S. and Shi, Y. L.: A new improved entropy method and its application in power quality evaluation, Auto. Electr. Power Sys., 37, 156–159, 2013.
Ragas, A. M. J., Huijbregts, M. A. J., Jong, H. D., and Leuven, R. S. E. W.: Uncertainty in environmental risk assessment: implications for risk-based management of river basins, Integr. Environ. Asses., 5, 27–37, 2010.
Ren, Y., Yao, J., Xu, D., and Wang, J.: A comprehensive evaluation of regional water safety systems based on a similarity cloud model, Water Sci. Technol., 76, 594–604, 2017.
Smith, K.: Environmental Hazards: Assessing Risk and Reducing Disaster, 6th edn., Routledge, New York, 2013.
Su, H., Yang, M., and Wen, Z.: An approach using multi-factor combination to evaluate high rocky slope safety, Nat. Hazards Earth Syst. Sci., 16, 1449–1463, https://doi.org/10.5194/nhess-16-1449-2016, 2016.
Wagenaar, D. J., de Bruijn, K. M., Bouwer, L. M., and de Moel, H.: Uncertainty in flood damage estimates and its potential effect on investment decisions, Nat. Hazards Earth Syst. Sci., 16, 1–14, https://doi.org/10.5194/nhess-16-1-2016, 2016.
Wan, S. P., Xu, G. L., Wang, F., and Dong, J. Y.: A new method for Atanassov's interval-valued intuitionistic fuzzy MAGDM with incomplete attribute weight information, Information Sci., 316, 329–347, 2015.
Wang, J. and Chen, X.: Application of Set Pair Analysis Method Based on Entropy Weight in the Air Quality Assessment, Environ. Sci. Technol., 39, 177–180, 2016.
Wang, D., Liu, D., Ding, H., Singh, V. P., Wang, Y., Zeng, X., Wu, J., and Wang, L.: A cloud model-based approach for water quality assessment, Environ. Res., 148, 24–35, 2016.
Wang, M., Tang, D., Bai, Y., and Xia, Z.: A compound cloud model for harmoniousness assessment of water allocation, Environ. Earth Sci., 75, 1–14, 2016.
Wang, T., Chen, J., Wang, T. and Wang, S.: Entropy weight-set pair analysis based on tracer techniques for dam leakage investigation, Nat. Hazards, 76, 747–767, 2015.
Wisner, B. and Uitto, J.: Life on the Edge: Urban social vulnerability and decentralized, Citizen-Based Disaster Risk Reduction in Four Large Cities of the Pacific Rim, Springer, Berlin, Heidelberg, 2009.
Xu, D. L.: Drawing the Cloud Model by Matlab, Taiyuan Sci. Technol., 1, 108–110, 2016.
Yari, G. and Chaji, A. R.: Maximum Bayesian entropy method for determining ordered weighted averaging operator weights, Comput. Ind. Eng., 63, 338–342, 2012.
Yang, M. S. and Nataliani, Y.: A Feature-Reduction Fuzzy Clustering Algorithm Based on Feature-Weighted Entropy, IEEE T. Fuzzy Syst., 26, 817–835, 2018.
Zhang, J. Q., Okada, N., and Tatano, H. : Integrated natural disaster risk management: Comprehensive and integrated model and Chinese strategy choice, Journal of Natural Disasters, 15, 29–37, 2006.
Zhou, Z., Wang, X., Sun, R., Ao, X., Sun, X., and Song, M.: Study of the comprehensive risk analysis of dam-break flooding based on the numerical simulation of flood routing, Part II: Model application and results, Nat. Hazards, 72, 675–700, 2014.
Zou, Q., Zhou, J., Zhou, C., Song, L., and Guo, J.: Comprehensive flood risk assessment based on set pair analysis-variable fuzzy sets model and fuzzy AHP, Stoch. Env. Res. Risk A., 27, 525–546, 2013.