the Creative Commons Attribution 4.0 License.
the Creative Commons Attribution 4.0 License.
 | 18 Dec 2018
Rain attenuation prediction model for satellite communications based on the Météo-France ensemble prediction system PEARP
Isabelle Dahman
Philippe Arbogast
Nicolas Jeannin
Bouchra Benammar
This paper presents an example of the usage of ensemble weather forecasting for the control of satellite-based communication systems. Satellite communication systems become increasingly sensitive to weather conditions as their operating frequency increases to avoid electromagnetic spectrum congestion and enhance their capacity. In the microwave domain, electromagnetic waves that are conveying information are attenuated between the satellite and Earth terminals in the presence of hydrometeors (mostly rain drops and more marginally cloud droplets). To maintain a reasonable level of service availability, even with adverse weather conditions considering the scarcity of amplification power in spacecraft, fade mitigation techniques have been developed. The general idea behind those fade mitigation techniques is to reroute, change the characteristics or reschedule the transmission in the case of too-significant propagation impairments. For some systems, a scheduling on how to use those mechanisms some hours in advance is required, making assumptions on the future weather conditions affecting the link. To this aim the use of weather forecast data to control the attenuation compensation mechanisms seems of particular interest to maximize the performances of the communication links and hence of the associated economic value. A model to forecast the attenuation on the link based on forecasted rainfall amounts from deterministic or ensemble weather forecasting is presented and validated. In a second phase, the model's application to a simplified telecommunication system allows us to demonstrate the valuable contribution of weather forecasting in the system's availability optimization or in the system's throughput optimization. The benefit of using ensemble forecasts rather than deterministic ones is demonstrated as well.
- Article
(1993 KB) - Full-text XML
- BibTeX
- EndNote


Since a few decades ago, satellites have become absolutely essential in modern society. Their field of application is expanding constantly. Nowadays, they are widely used in various areas such as navigation, weather forecasting, disaster management or telecommunications. In fact, geostationary telecommunication satellites can offer global coverage, which makes them particularly attractive for bringing broadband Internet in isolated areas where the access to terrestrial networks remains very limited.
The data transmitted from satellites to Earth are conveyed by radio waves whose frequency is comprised between 1 and 40 GHz. Frequencies within this range are classified into frequency bands, dedicated to specific applications for satellite communications but also shared with other systems as fixed terrestrial wireless systems, microwave remote sensing instruments, radar or positioning systems. These frequency band labels (L, S, C, X, Ku, Ka and Q/V) are detailed in Table 1.
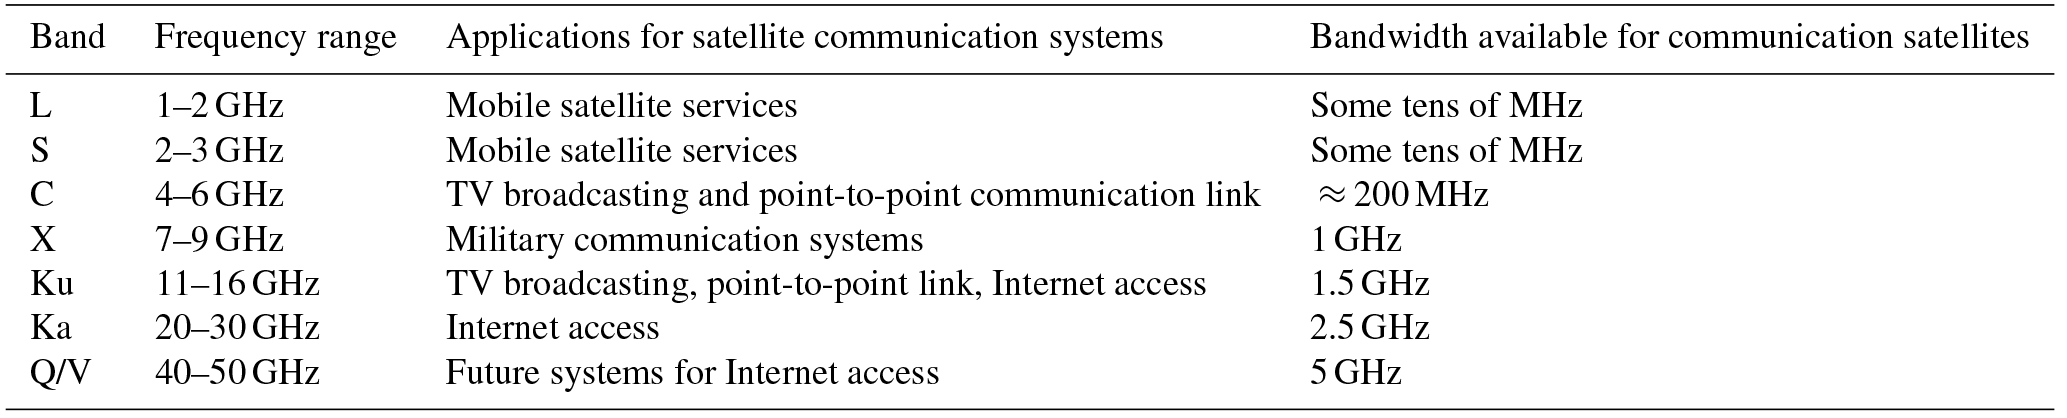
To increase the overall capacity of communication satellites (and hence the number of users of the system and/or the offered data rate), the use of the Ka and Q/V bands, for which large modulation bandwidths are available, is becoming widespread among operational systems. However, the possibility to transmit data at a given data transmission rate is also dependent on the power level of the electromagnetic wave received by the terminal. An insufficient power level will result in data loss. Power losses between the satellite and the Earth terminals are mostly caused by the dilution of the wave in space during its propagation and by some atmospheric phenomena. In particular, atmospheric gases and more importantly the presence of hydrometeors attenuates electromagnetic waves. The scattering theories (Rayleigh or Mie) tell us that the level of the attenuation depends on the ratio between the hydrometeor diameter and the wavelength (Gunn and East, 1954; Oguchi, 1983). This attenuation can reach several tens of decibels in the case of liquid precipitation. Furthermore, for a given atmospheric state the attenuation tends to increase significantly with the frequency. The occurrence of propagation losses higher than a given threshold, linked to the way the information is modulated, results in data loss. To quantify this probability of data loss, the ITU (International Telecommunication Union) has established a climatology of the probability of exceeding a given level of attenuation. The model strives to quantify the probability of the exceedance of tropospheric attenuation function of the radio-electrical characteristics of the link (frequency, elevation) and of the geographical position of the Earth terminal (ITU-R P.618-13, 2017). To this aim, climatological databases taking into account the rain regime (ITU-R P.837-7, 2017) are used. The height of the 0 ∘C isotherm (ITU-R P.839-04, 2013) is also useful since solid hydrometeors have a negligible impact on electromagnetic wave propagation in the RF (radio frequency) domain due to different electrical properties than liquid ones.
Figure 1 shows the attenuation due to rain that is statistically exceeded 0.1 % of the time as computed by the ITU for two different frequencies of transmission: 12 and 50 GHz. The difference between the two scenarios is significant. At 12 GHz, the rain attenuation that exceeded 0.1 % of the time is a few decibels for Europe, whereas it is several tens of decibels at 50 GHz. As the systems are usually designed to ensure a link availability larger than 99.9 %, the attenuation values presented in Fig. 1 represent the power margins required to cope with the atmospheric impairments and to comply with the availability requirement function of the geographical location of the receiving station.
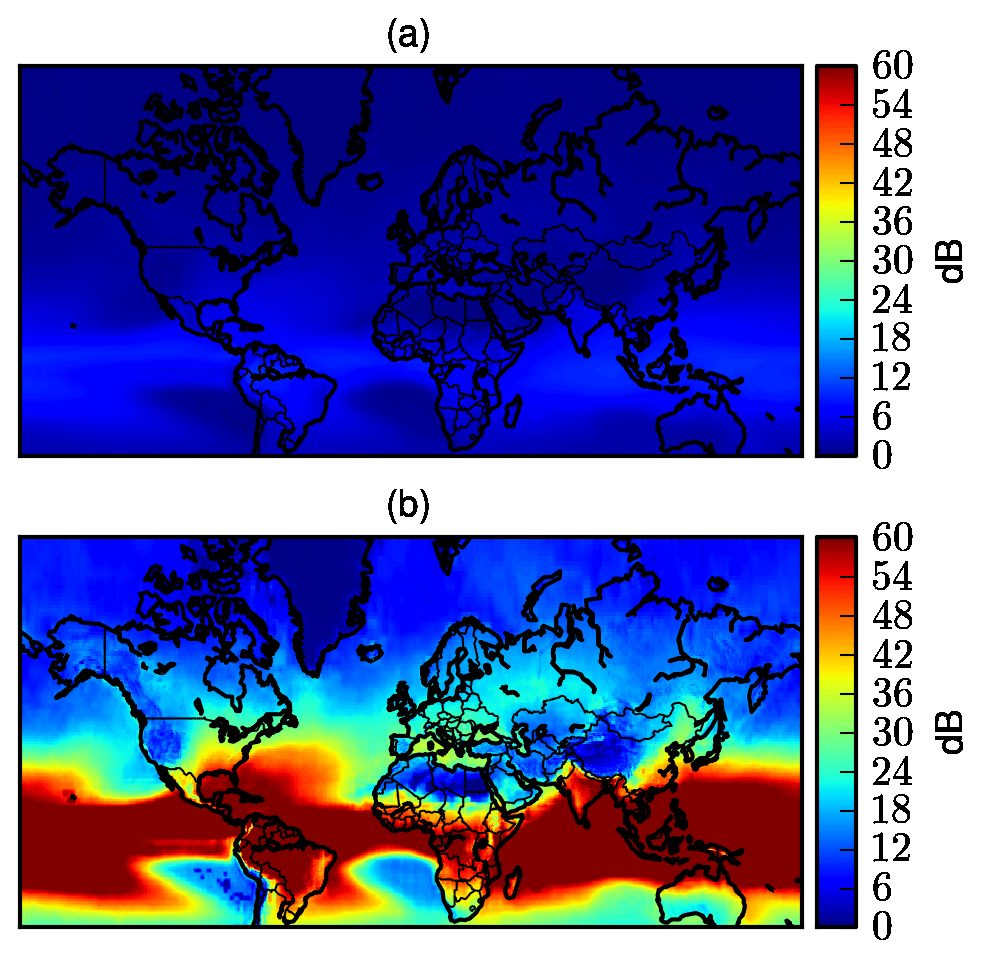
Figure 1Attenuation that exceeded 0.1 % of the time computed from ITU-R P.618-13 (2017) for a link with a geostationary satellite at 35∘ of elevation at 12 GHz (a) and 50 GHz (b).
The margins required in some areas to maintain the communication 99.9 % of the time can reach 30 dB at Q/V band in mid-latitude areas and even more in tropical areas. In other terms, it means that to ensure the availability of the link with a 99.9 % probability, a power 1000 times higher than the one required to maintain the link without rain is needed. As the power onboard of satellites is a scarce resource, techniques to adaptively mitigate the impairments have been developed (Panagopoulos et al., 2004) to allow the efficient use of Ka and Q/V bands for satellite communications. These techniques rely on signal rerouting (Jeannin et al., 2014) (i.e., using another station), delaying the transmission (Arapoglou et al., 2008), decreasing the data rate (Cioni et al., 2008) or some extent of payload reconfiguration (Paraboni et al., 2009; Resteghini et al., 2012). Some of them can be operated in a closed loop. In this case the state of the channel is analyzed in real time and the decision to activate one or another mechanism is taken in near real time. This is, for instance, the case of techniques using adaptive coding and modulation that aim at adjusting the data rate and, as a direct consequence, the robustness of the communication link to the attenuation experienced by the communication link. One of the consequences is that a return communication channel between the Earth terminals and the satellite is required to convey the feedback. It is not necessarily available (for instance in broadcasting systems) and is also a cost and security issue.
Other techniques require a forecast of the attenuation some hours in advance in order to prepare and to optimize the link configuration through the telecommand of the satellite. In this respect, the use of meteorological forecasts constitutes a promising approach to control the decision process associated with those fade compensation mechanisms. This has, for instance, been studied in Paraboni et al. (2009), Biscarini et al. (2016) and Jeannin et al. (2017) for different applications. One of the major difficulties highlighted by those studies is that the attenuation induced by rain on Earth–space links is not strongly correlated to the model outputs due to the model accuracy and its limited space and time resolutions. Hence, it has been found that the use of the microwave attenuation computed directly from model outputs in the decision process shows poor skill.
To increase the attenuation prediction skill, probabilistic precipitation forecasts based on ensemble predictions could be used as long as cost–loss models are known and available.
The objective of this paper is to propose and describe a fully probabilistic approach to forecast rain attenuation by forecasting the probability of exceeding a given rain attenuation level rather than a deterministic value. To this aim ensemble prediction systems (Descamps et al., 2015) will be shown to be particularly suited when using the probabilistic precipitation forecasts in the control loop of a simplified communication satellite.
The organization of the paper is the following. The first section is devoted to the description of the model, where the different steps to obtain rain attenuation probability distributions conditioned to ensemble forecasts from Météo-France are described. In the second section, various scores are analyzed to assess the relevance of the proposed attenuation model. In the last section, the performances of the forecasts to maximize either the link capacity, the link availability or both are analyzed, considering concurrently measured attenuation data and the simulation of a simplified communication system.
To develop the forecast model, it is needed to relate actual rain attenuation data to precipitation forecasts. The data used to this aim are detailed in a first part of this section. The elaboration and the development of the model is detailed in a second stage.
2.1 Data
2.1.1 Beacon data
The attenuation due to rain on an Earth–space link can be characterized by measurement on Earth of power fluctuations of beacon signals (unmodulated signals) emitted by satellites. As the signal transmitted by the satellite has a constant power, the fluctuations of the received power are linked to the fluctuations of the tropospheric fade undergone by the signal during its propagation. Furthermore, the temporal scales of variation of water vapor, oxygen, clouds and rain attenuations differ significantly, which allows us to discriminate the various contributors to the tropospheric attenuation. In particular, the rain attenuation by large dominates the total attenuation and can easily be deduced from the fluctuation of the beacon. Another possibility is to isolate the attenuation due to rain from the other components using concurrent radiometric measurements, which can be used to quantify clouds and gaseous attenuation.
ONERA conducts its own measurement campaigns analyzing the 20 GHz (Ka band) beacon signal of the Astra 3B geostationary satellite in various experimental facilities. Throughout the years 2014 and 2015, Ka band attenuation measurements were collected for two receiving sites located in Toulouse, France (latitude 43.5∘ N and longitude 1.5∘ E) (Boulanger et al., 2015) and in Salon-de-Provence, France (latitude 43.6∘ N and longitude 5.1∘ E). These attenuation measurements are sampled at 1 Hz but have been averaged on a 5 min basis to save computational resources. An illustration of the Ka band rain attenuation time series used in the study is given in Fig. 2.
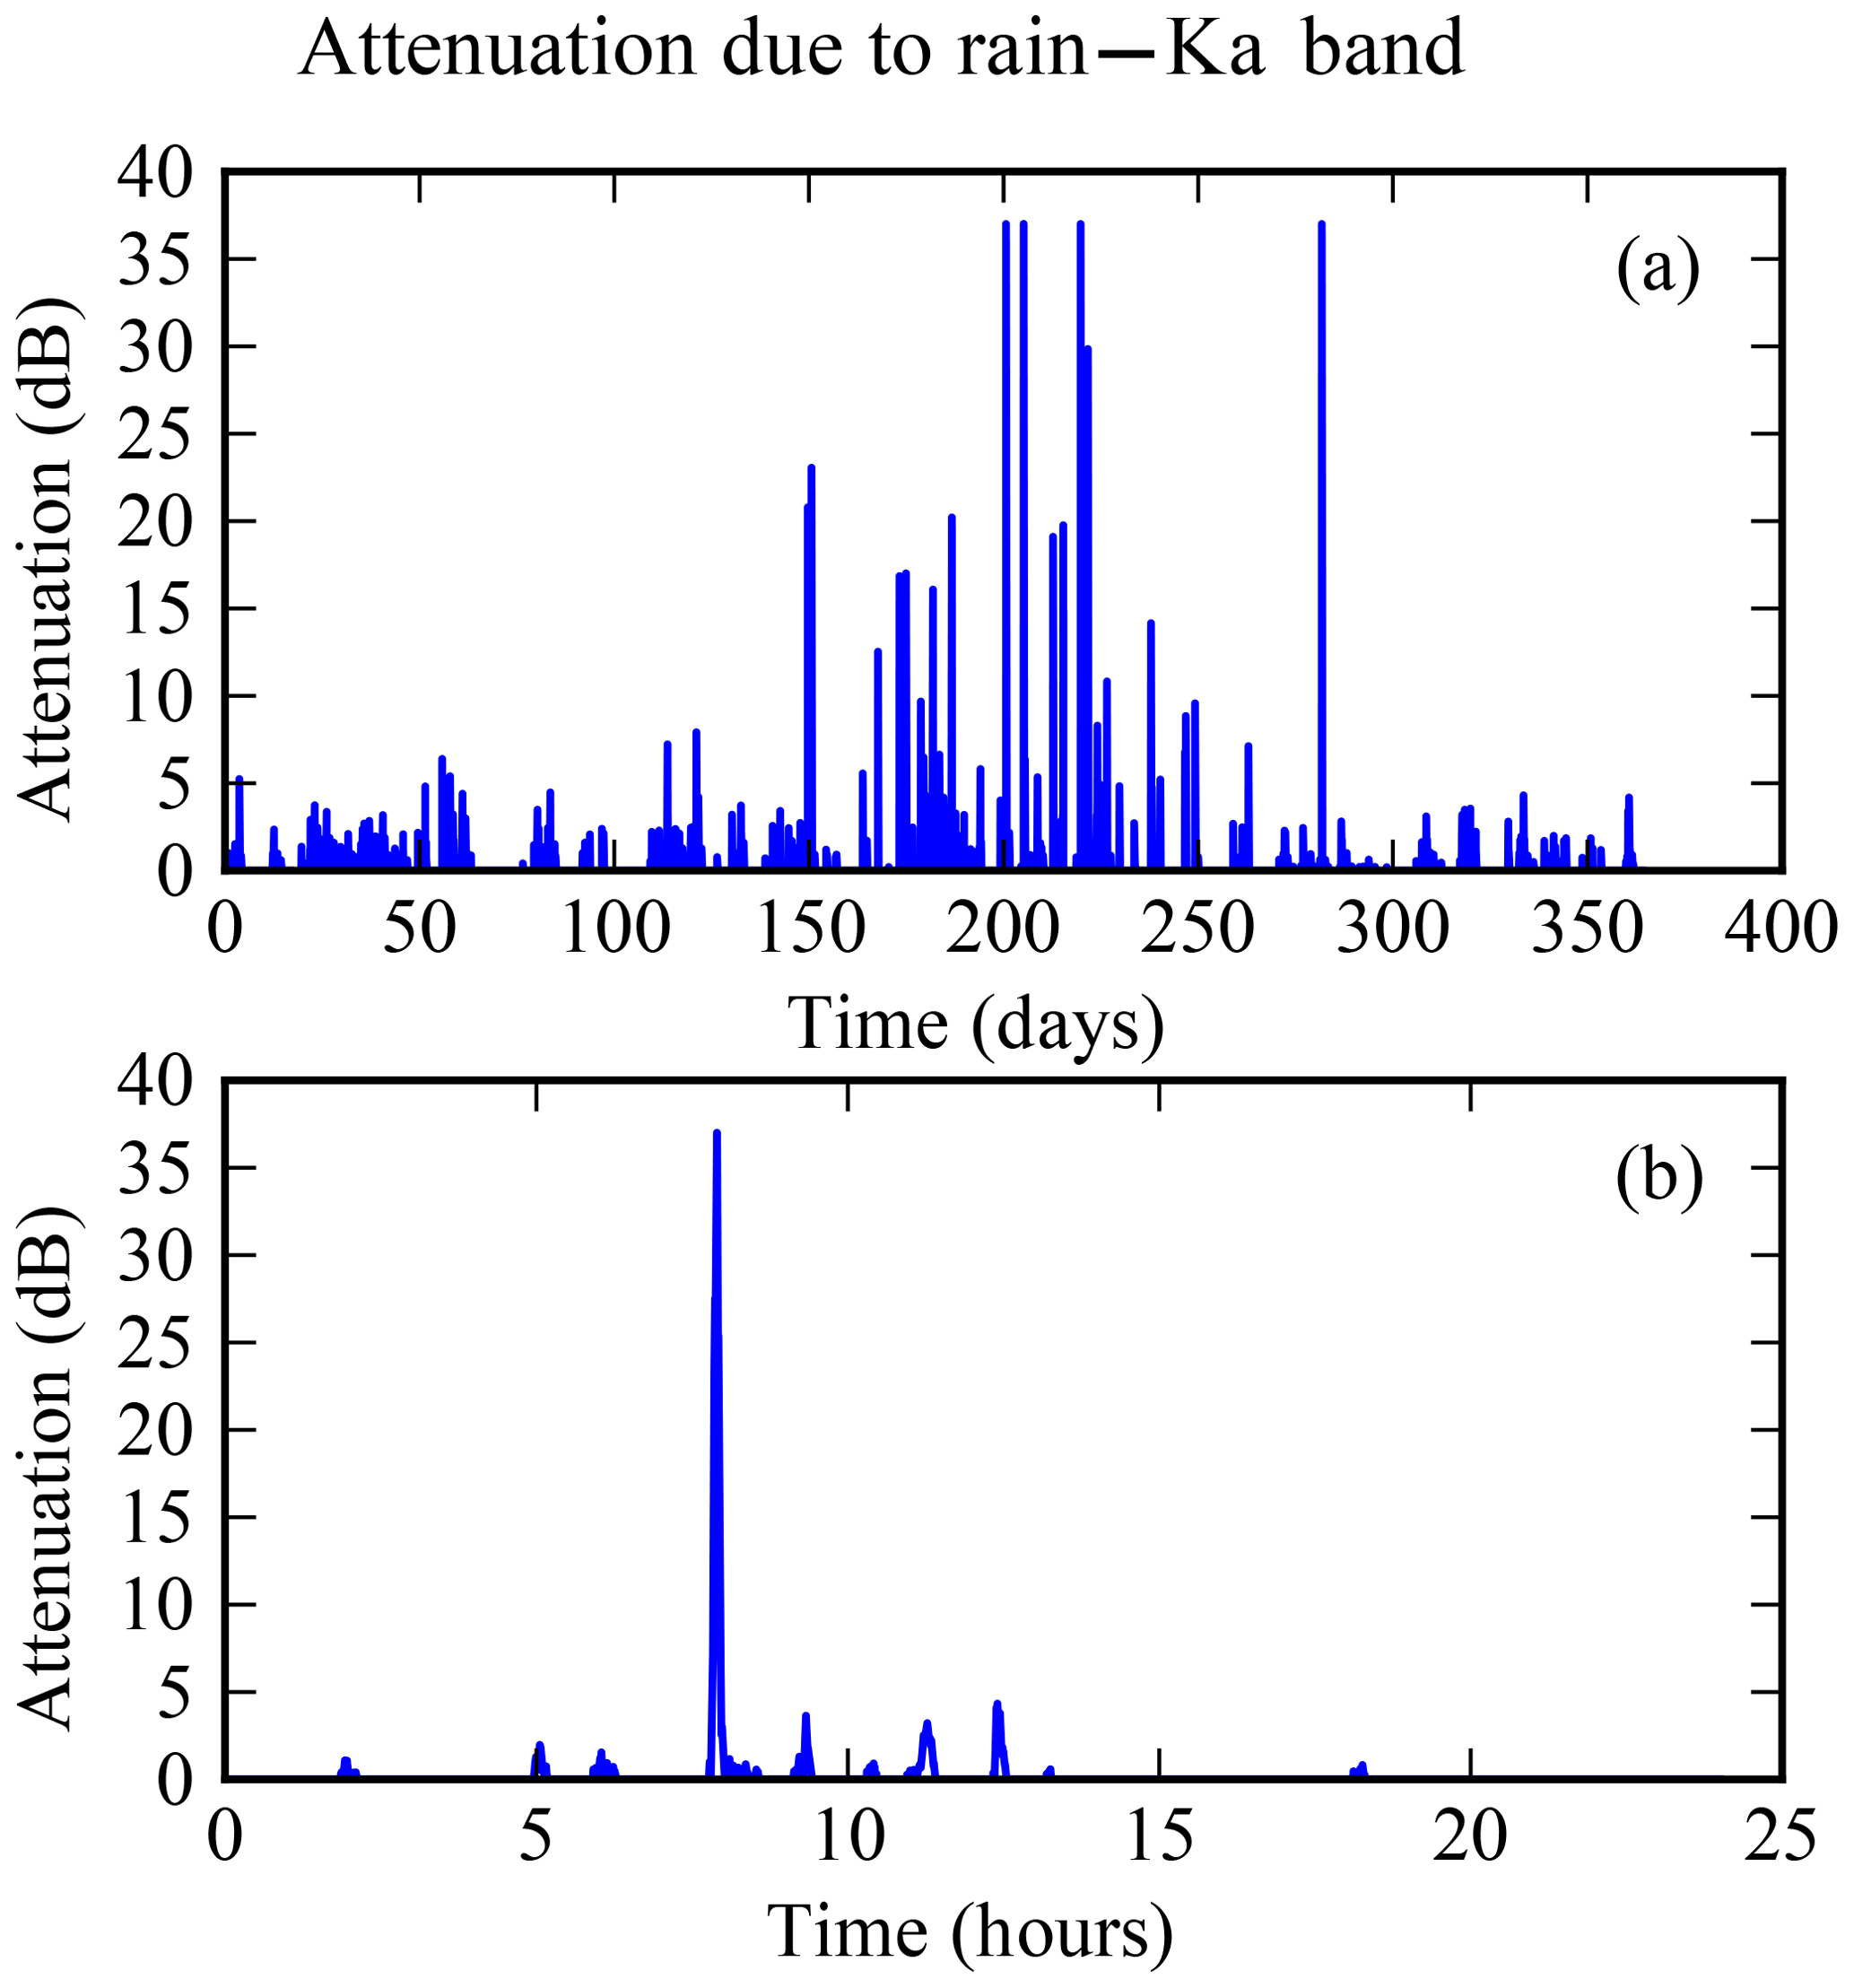
Figure 2Ka band attenuation measurements operated by ONERA in 2014 (a) for a link between the geostationary satellite Astra 3B and a receiving station located in Toulouse, France. Panel (b) focuses on 19 July 2014.
Those rain attenuations have been used as predictands in the statistical model discussed in Sect. 2 as well as the probabilistic precipitation forecasts described in the next subsection.
2.1.2 Weather forecast model
The probabilistic precipitation predictions are built upon the sampling using the French global ensemble PEARP (Descamps et al., 2015). The horizontal resolution is variable and is about 10 km over France (60 km on the opposite side of the globe). Initial condition uncertainties are sampled using singular vectors and an ensemble of 4DVar (Desroziers et al., 2014). The model error component is based on the multiphysics approach. For instance, we run two different deep convection schemes such as those described in Bougeault (1985) and in Piriou et al. (2007). Thirty-five members are calculated twice a day (at 06:00 and 18:00 UTC). Available archived data consist of 3 h cumulative rain rate forecasts. The daily PEARP forecasts archived in 2014 and 2015 are used on a grid in this study to build predictive attenuation distributions. Specifically, we build a super ensemble by using the 35 members of the 36 h forecast run at 18:00 UTC on day D together with the 35 members of the 24 h forecast run at 06:00 UTC on D+1. In the following sections, the ensemble forecast is denoted as F such as F = {member 1, member 2, …, member 70}, where each member constitutes an estimation of the rain amount expressed in millimeters per 3 h.
2.2 The attenuation statistical prediction model
The temporal variability of attenuation due to rain is high (5 min) compared to the time resolution of the model forecasts (3 h). It would not make sense to average rain attenuation data on a 3 h basis. Furthermore, this would dramatically reduce the size of the training dataset used to compute the complementary distribution function of attenuation conditioned to the PEARP forecasts. The strategy adopted in order to provide a statistical link between predicted rain amount and rain attenuation is the following. First, we select all members of the PEARP forecasts archived in 2014 and 2015 around the receiving station of interest. In some cases the weather forecast is realistic, but even a slight phase error may lead to the double-penalty problem (Nurmi, 2003). Therefore, we consider here a 100×100 km box around the attenuation observation site such as that in Theis et al. (2005). Second, these PEARP members are duplicated 36 times. Because there are 36 intervals of 5 min in 3 h, this allowed us to obtain an equal number of observations and forecast data. These forecasts are then classified into five categories, denoted c0 to c4 with mm per 3 h, mm per 3 h, mm per 3 h, mm per 3 h, mm per 3 h. Finally the members of the forecast are thus classified, and the attenuation observations are combined to compute the probabilities . These probabilities are memorized to predict, in the operative context, the overrun of an attenuation threshold ATh. Figure 3 gives an example of the complementary cumulative rain attenuation distribution conditioned to PEARP forecasts obtained from the previously described methodology.
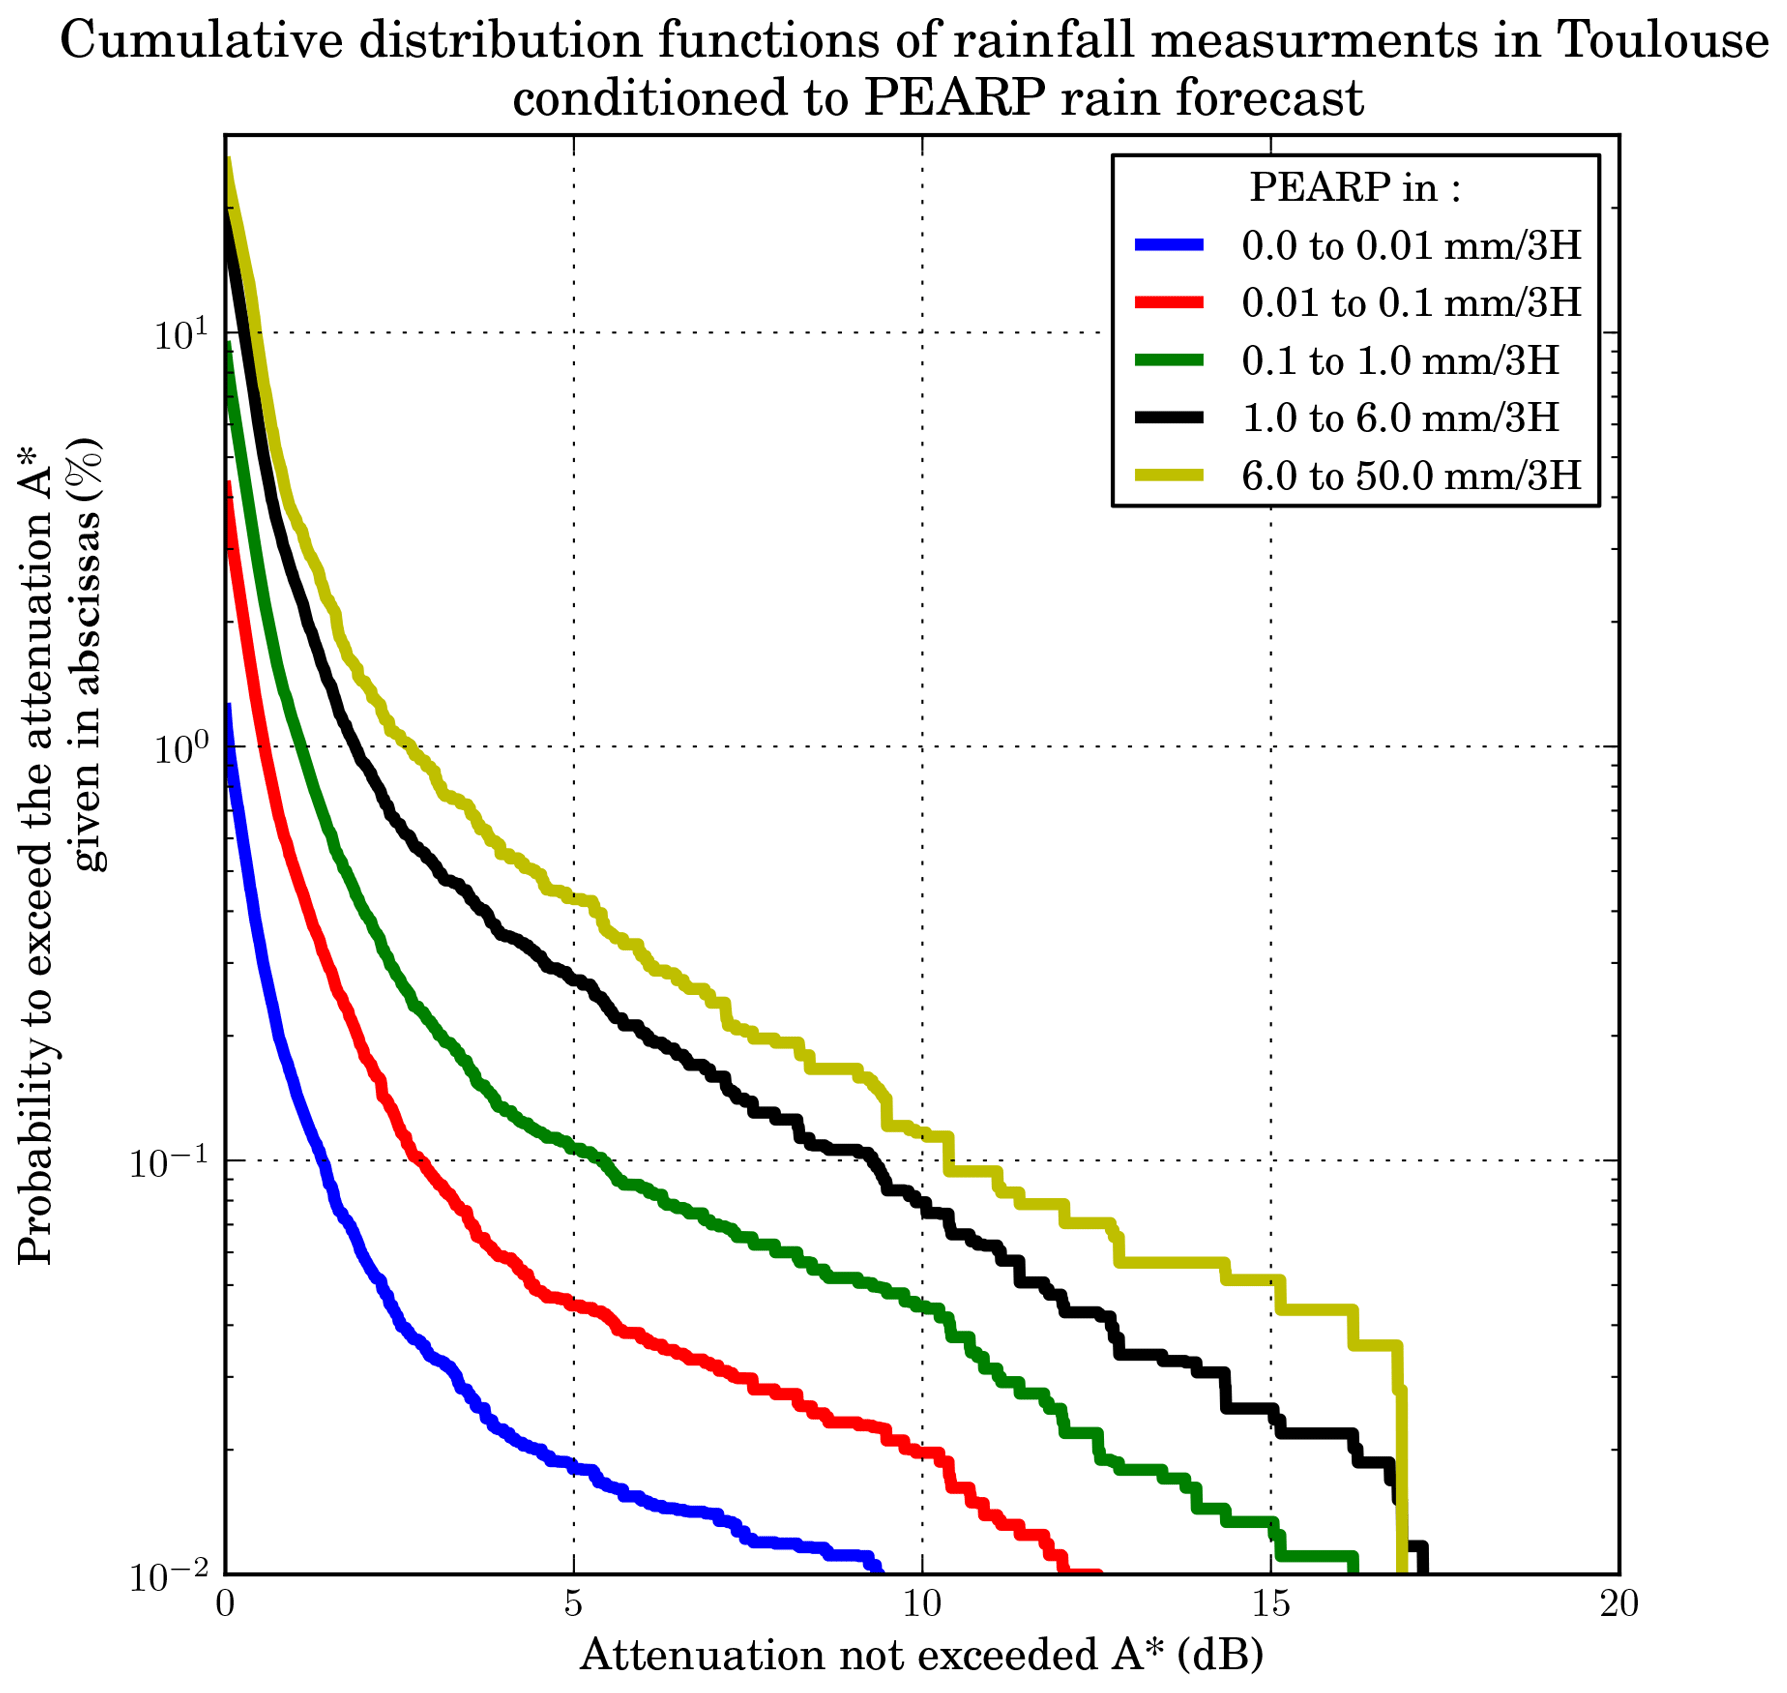
Figure 3Probability of exceeding the attenuation threshold given in abscissas based on data recorded in 2014 and 2015 in Toulouse, France.
In the operative context, the goal will be to represent the future state of the channel by a unique predictive attenuation distribution. Yet the PEARP forecasts are constituted of 70 members. Each of these members leads to the selection of a specific complementary distribution of rain attenuation. A methodology must be defined in order to obtain a single probabilistic estimation of the rain attenuation occurring in future. The formula of total probability is written as follows:
where ATh is the attenuation threshold, expressed in dB. F is the PEARP forecast with F = {member 1, member 2, …, member 70}. Categories c0 to cn are the PEARP classes previously described, with n being equal to 5. is the complementary cumulative distribution of attenuation, conditioned to the PEARP classes presented in Fig. 3. P(F∈ci) is the probability that, for a draw at a given time, the forecast belongs to a given class. This probability can be directly sampled by counting the members of the ensemble. For example, let us assume that, for a given time horizon, half of the PEARP members belong to the first PEARP class c0, and half belong to the second PEARP class c1. In such a case, , and .
This methodology is equivalent to averaging the 70 rain attenuation distributions. An illustration is presented in Fig. 4. For the sake of simplicity, we consider only two realizations of the forecast. Both members lead to a complementary cumulative distribution of attenuation (black and green lines) which, after averaging, leads to the probabilistic forecast of rain attenuation noted (gray line). ATh is the attenuation threshold exceeded in decibels, and F the PEARP forecast system. In this specific example mm per 3 h.
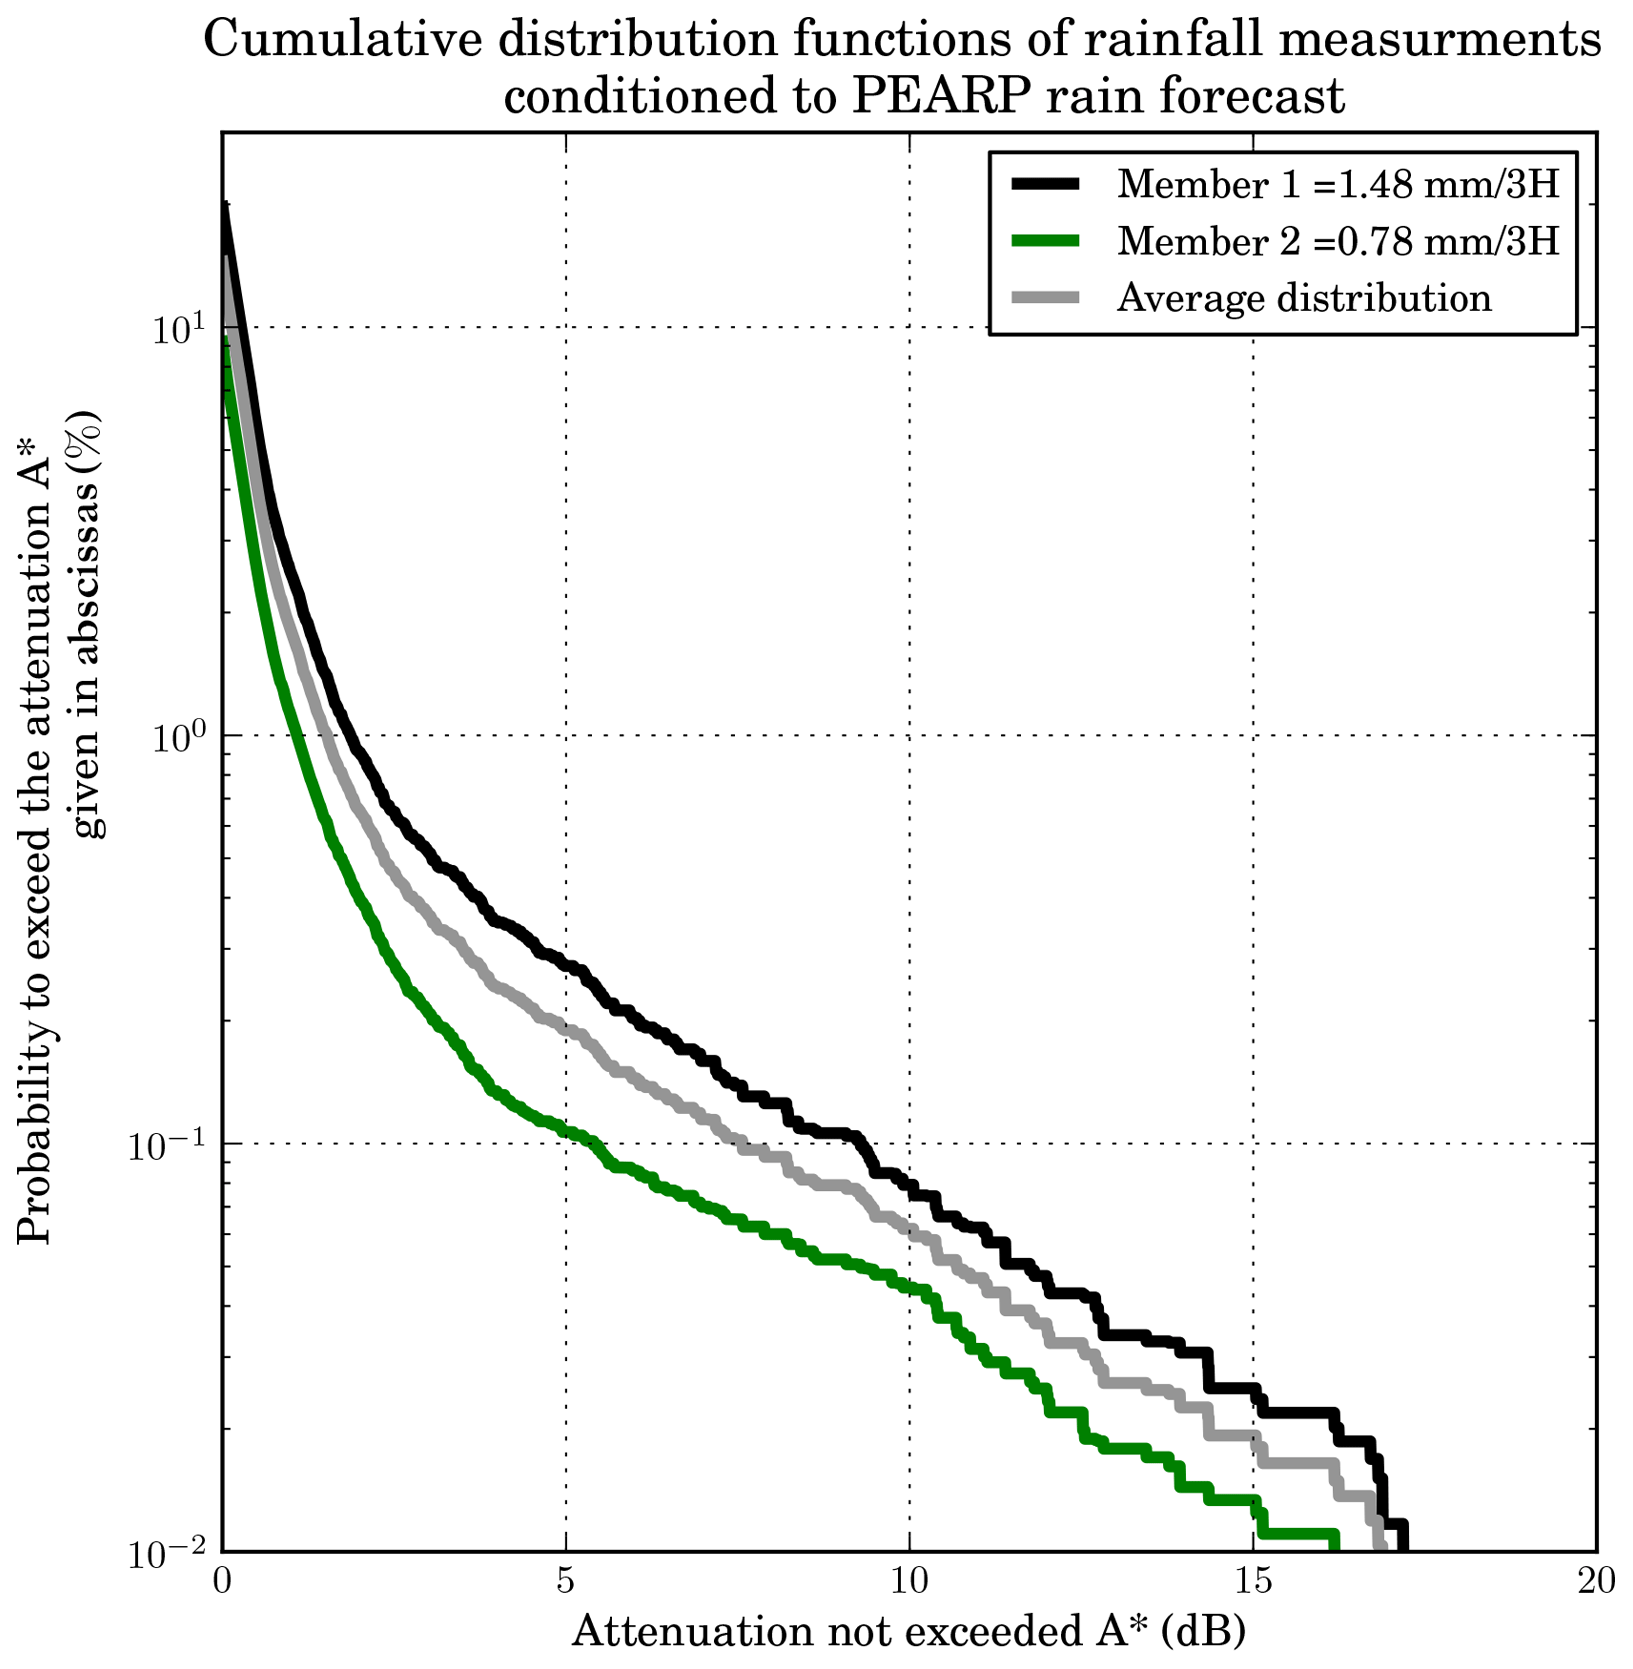
Figure 4Probability of exceeding the attenuation threshold given in abscissas. Two distributions are selected according to the value of two ensemble members (black and green lines). The gray line stands for the average of those two distributions.
The use made of this predictive attenuation distribution will depend on the application of interest. One possible use is to get the attenuation threshold exceeded to only 0.1 % of the time, which is the tolerated unavailability threshold. This attenuation threshold is equivalent to the power margin required to prevent inappropriate communication interruptions.
The low spatial and temporal resolutions of the PEARP archives used for the learning process may cast some doubt on the utility of the attenuation forecasts. An appropriate use of the model requires an evaluation of its potential as well as weaknesses. A probabilistic forecast model is expected to present reliability and resolution. The reliability assesses the ability of a model to provide a probabilistic prediction of a given event close to the observed frequency of the same variable. The resolution is the ability to discriminate between events and nonevents.
Only scores based on binary events are considered here. In the first stage, the reliability of the attenuation forecasts is addressed using the reliability diagram and the rank diagram, also known as the Talagrand diagram. Resolution is evaluated using receiver operating characteristic curves, referred to as ROC curves hereafter, and sharpness diagrams. The scores proposed here are computed using the available observations and model outputs over the 2-year period defined above. Nevertheless, in order to evaluate the possible overfitting of the statistical model, a bootstrapping approach is used: 6∕10 of the sample is taken for the learning step and the remaining 4∕10 for the score calculation. The procedure is repeated 100 times.
3.1 Model reliability assessment
The reliability of an ensemble model characterizes its ability to provide forecast frequencies consistent with the observed ones. For example, let us assume that the forecast system provides, for a particular event, a probability of occurrence of x %. Ideally, this event should be observed x % of the occasions on which such forecast is made.
The reliability diagram consists in plotting the observed frequencies against the forecast probabilities, previously classified into a few bins. For perfect reliability, the curve must merge with the diagonal line. A reliability curve located to the right of the diagonal line is typical of a model overestimating the probability of the event. Similarly, a model systematically underestimating the probability event presents a curve located to the left of the diagonal line. It is also conventional to represent the climatological probability of the event in the forecast by a vertical line and the climatological probability of the event in the observation by a horizontal line. The last one brings complementary information on the model resolution. A forecast which provides the effective climatological probability has no ability to discriminate between cases of event and cases of nonevents, and this means that it has no resolution.
In the following sections, a positive event will be defined as the overrun of an attenuation threshold ATh alternatively set to 1, 3 and 6 dB. The model developed provides the probability , which is the predictive probability that a positive event occurs as a function of the PEARP forecasts. By fixing the attenuation threshold ATh, one can compute, for a specific forecast F, the probability . From the time series of the PEARP forecasts archived in 2014 and 2015, the time series of have been computed for the three values of ATh. Time series of attenuation observations and predictive probabilities allowed us to create Fig. 5. The climatological probability is indicated by the dotted lines. The small windows show sharpness diagrams, which are discussed later.

Figure 5Reliability diagrams showing observed relative frequency as a function of forecast probabilities for attenuation thresholds 1 dB (blue), 3 dB (green) and 6 dB (red). Inset boxes indicate the frequencies of use of the forecasts. The dotted lines represent the climatological probability. By convention, the horizontal dashed line represents the climatological probability of the event in the observations. The vertical dashed line represents the climatological probability in the forecast.
First of all, high probabilities are rarely met for those precipitation thresholds. That is why only low probabilities are shown. The shape of the reliability curves meets the expectations: the observed frequencies grow with the forecast probabilities and the curves deviate little from the diagonal line. This reflects the reliability of the attenuation forecast model and confirms its value for the forecast of the exceedance of attenuation thresholds. However, the reliability of our statistical model is not perfect; while low probabilities tend to be underestimated, high probabilities tend to be overestimated.
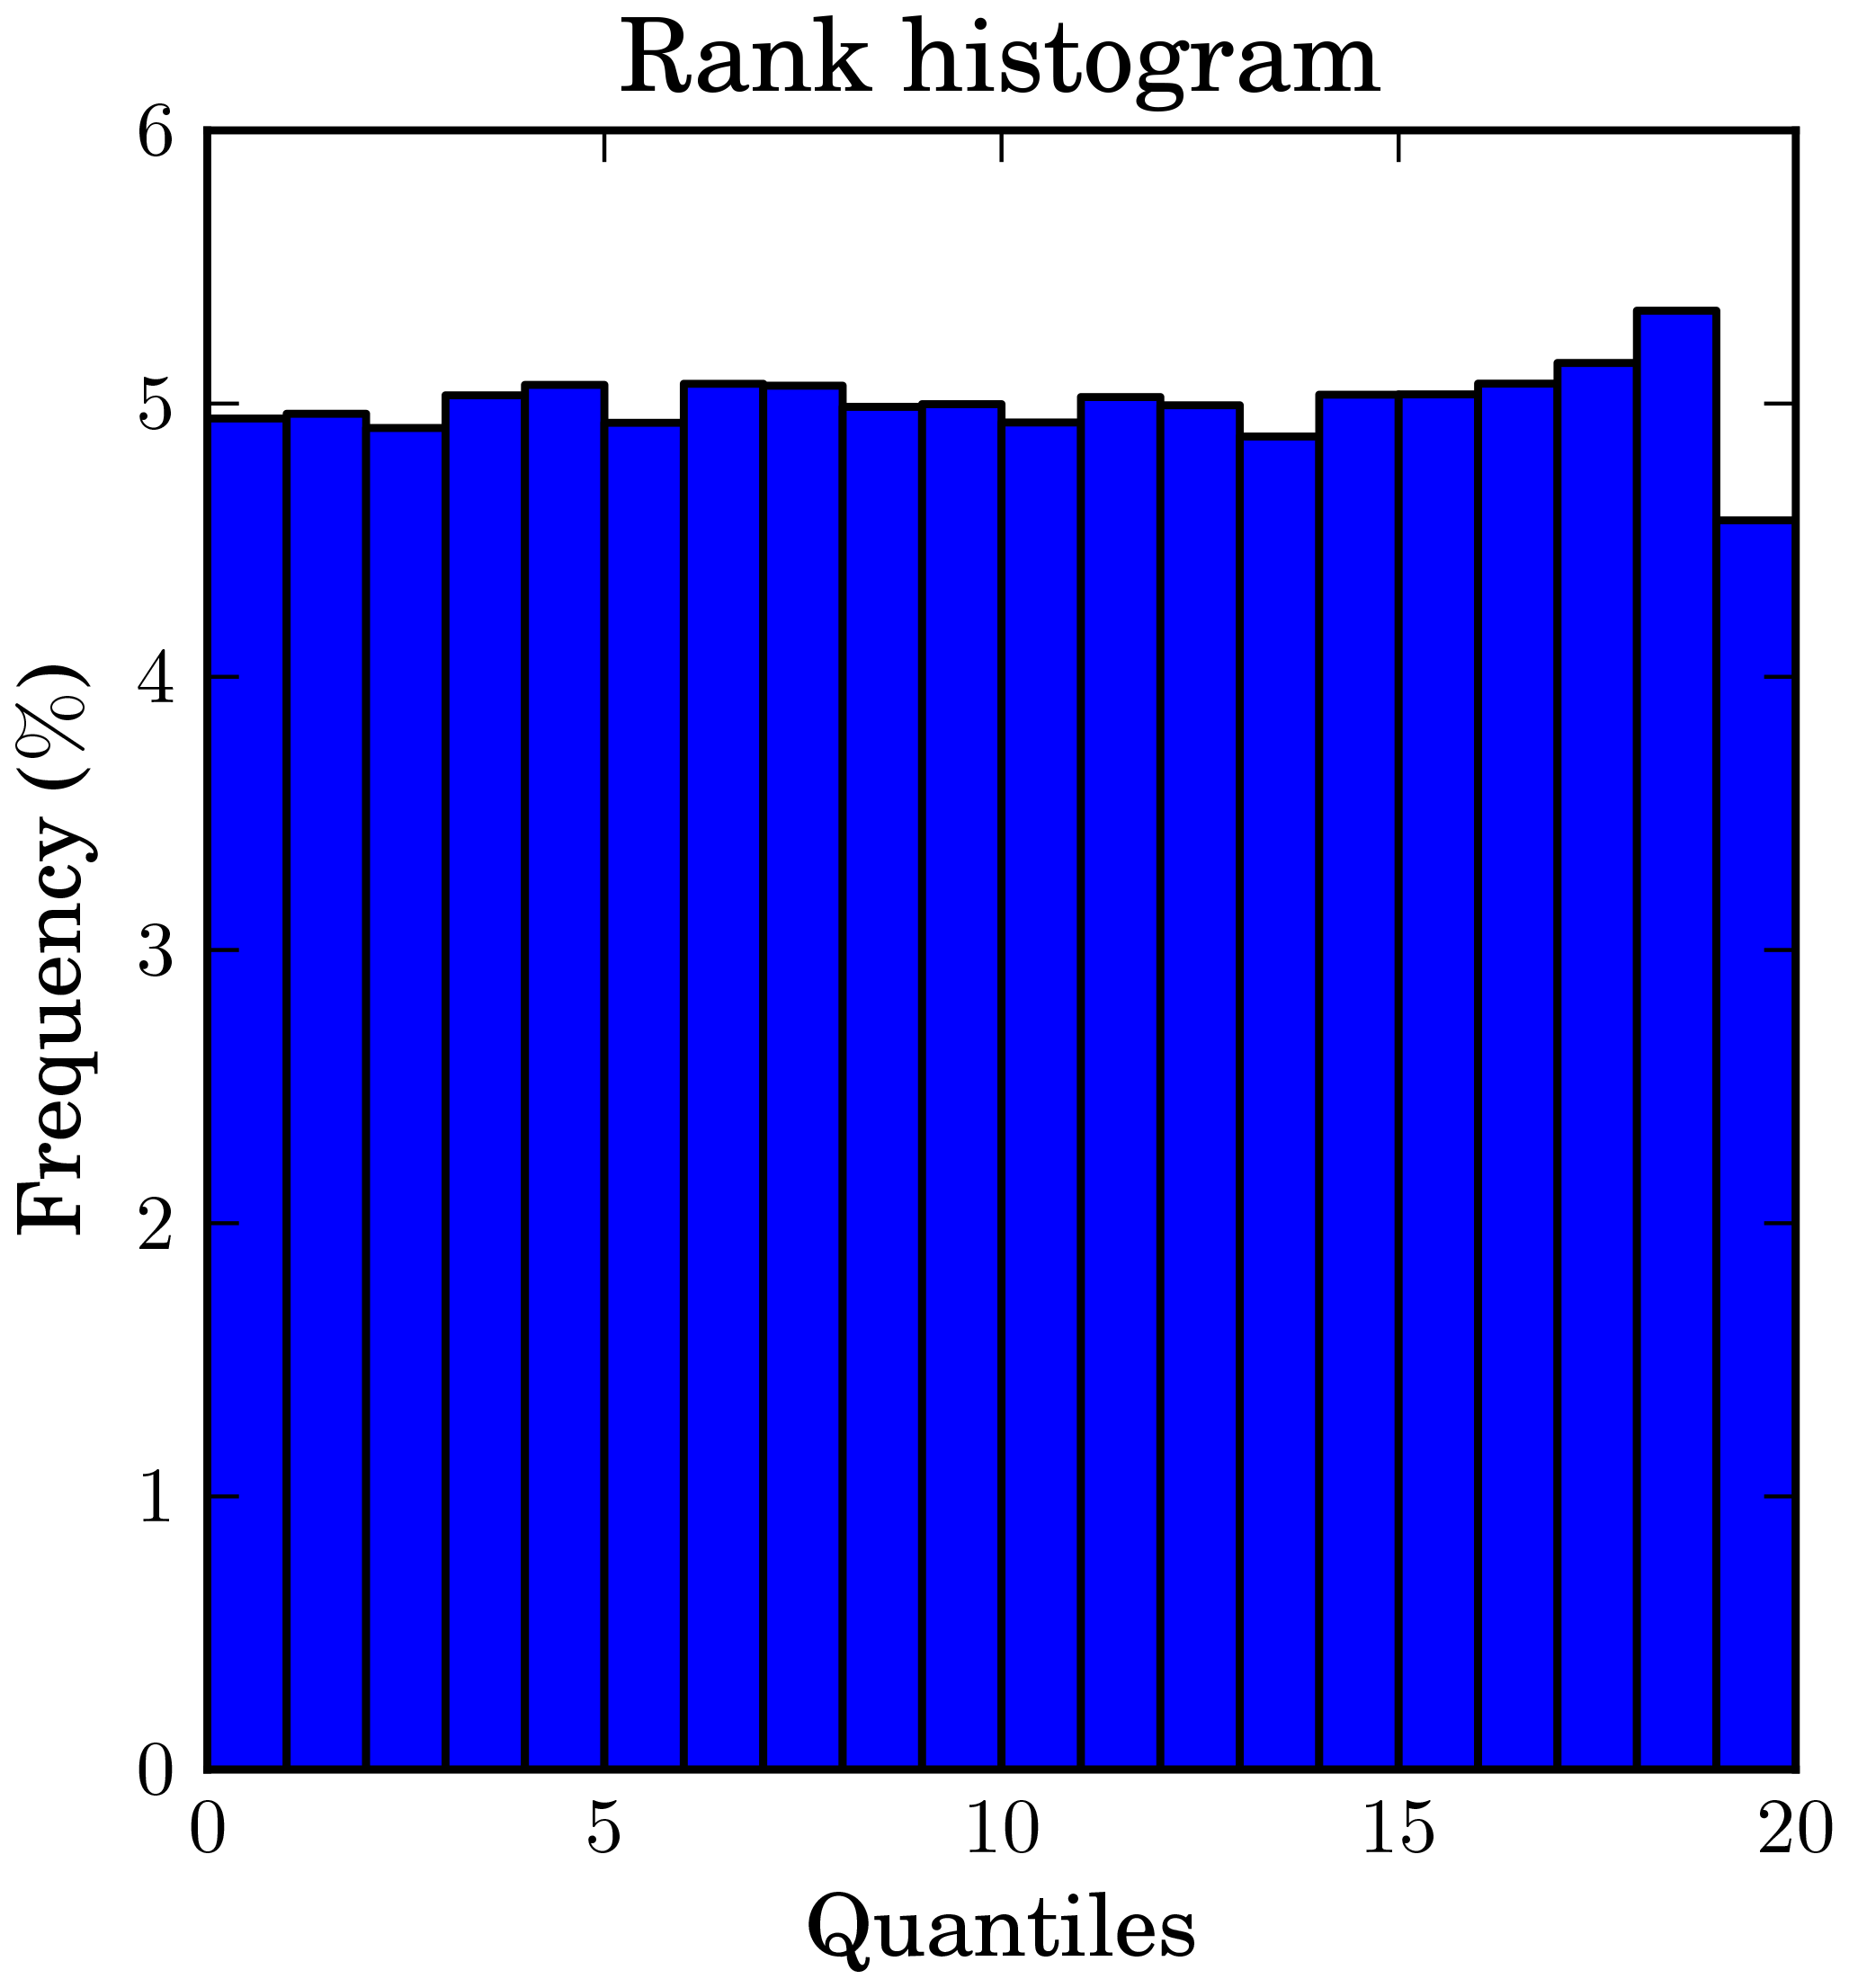
Figure 6Rank histogram, also called Talagrand diagram, of probabilistic attenuation forecasts.
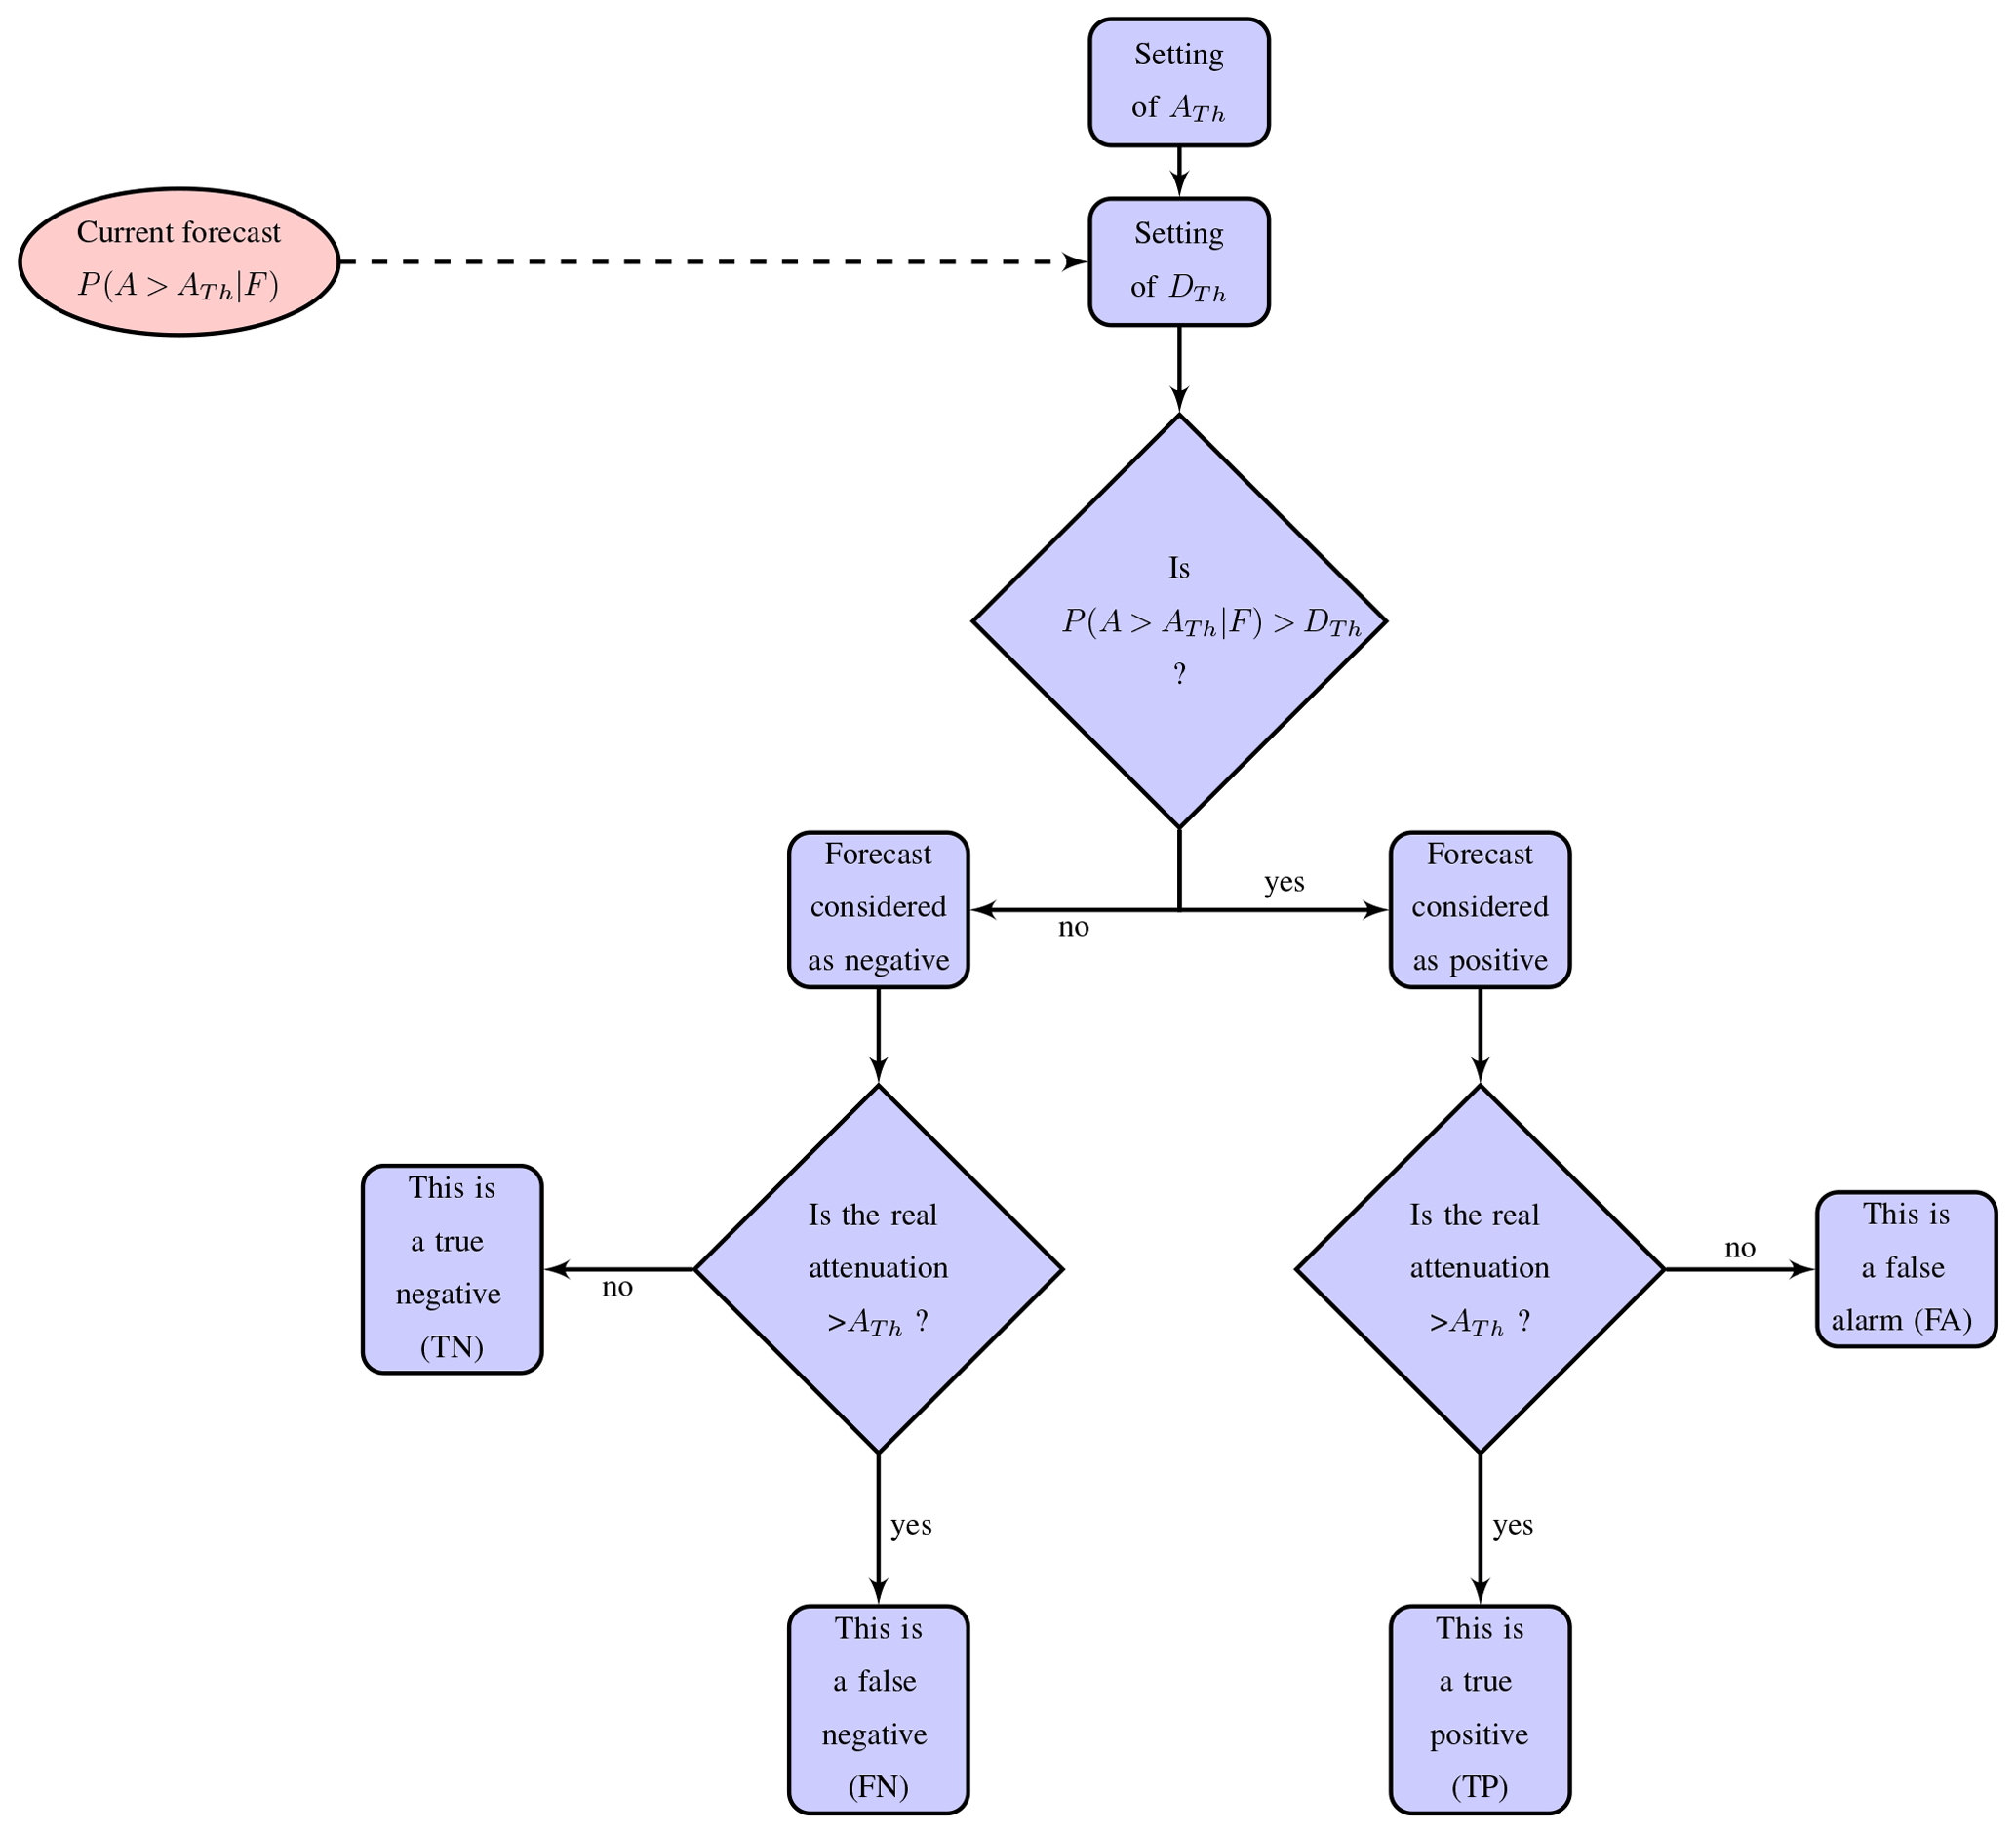
Figure 7Block diagram of the discrimination process between positive and negative forecasts.
Another useful tool for determining the model reliability without considering thresholds is the rank diagram, also known as the Talagrand diagram (Hamill, 2001). In the case of an ensemble prediction system, the rank histogram of the position of the verifying observation with respect to the predicted ensemble values provides a measure of reliability. When the ensemble is reliable, say the verification and the evaluated system are from the same distribution, the diagram is flat. If the diagram follows a U-shaped curve, then the observation is often outside the ensemble, suggesting the ensemble is under dispersive. Since we have access to the cumulative distribution function discretized in m quantiles rather than members, we attribute the observation to its quantile. With regard to this, the abscissa of the rank diagram shown in Fig. 6 is discretized in m bins as well. Nonzero values of precipitation (or attenuation) are often met for the few highest ranks only. Then, considering our sampling this diagram could be considered flat.
3.2 Resolution and sharpness
Resolution is another desired quality we expect from a probabilistic prediction. The Brier score decomposition tells us that resolution is the difference between the curves of Fig. 5 and the observation climatology represented by the horizontal dashed line. It turns out that the slope of our curves is steeper than the perfect reliability curve, suggesting pretty high resolution. Sharpness is a property of the forecast alone. Nevertheless, it is also an indication of resolution since only sharp predictive distributions show high resolution. Here, the shape of the diagrams is consistent with a good sharpness, although very low probabilities dominate.
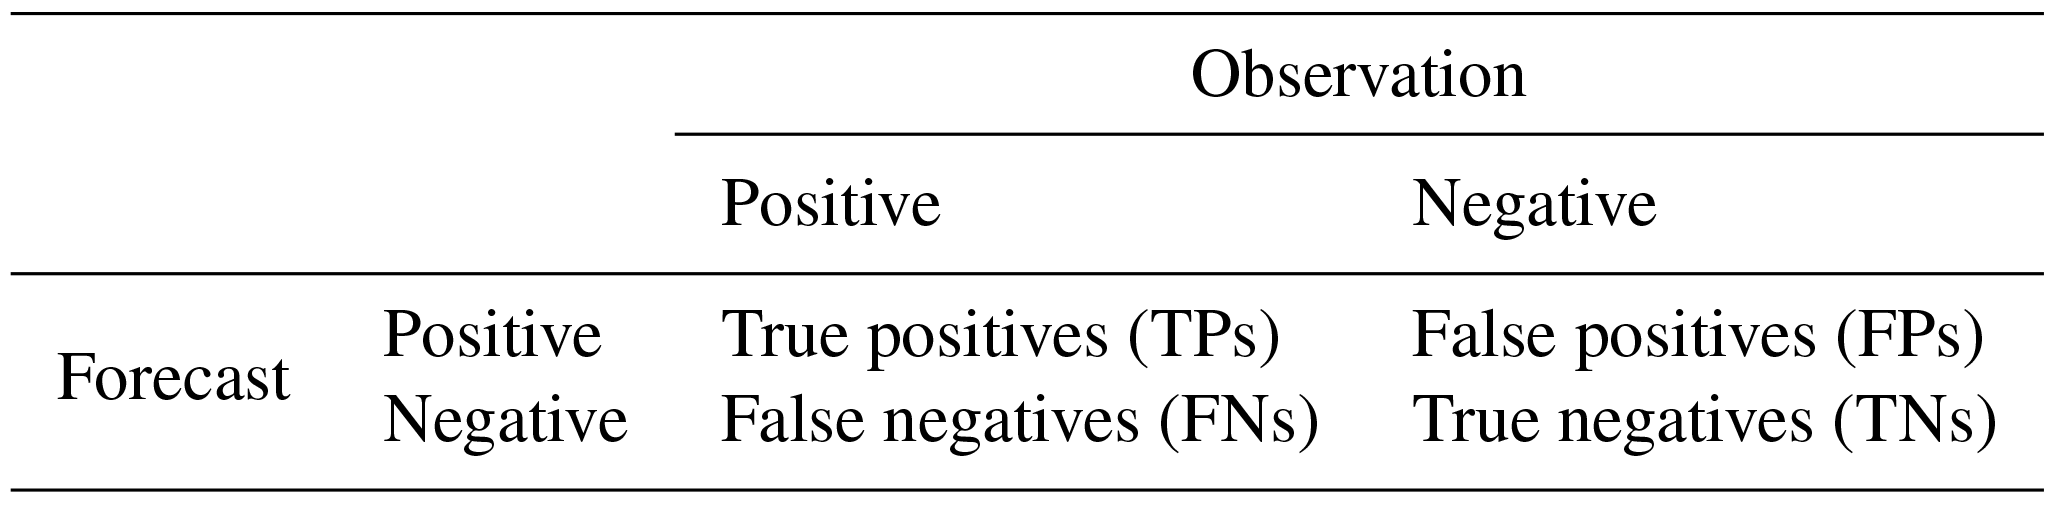
Another approach to address the resolution as well as the value of a probabilistic prediction is to draw receiver operating characteristic curves. ROC graphs are widely used, particularly in the area of medicine (Zweig and Campbell, 1993), to evaluate the power of discrimination of a classification model as a function of a decision threshold. These are of particular interest to evaluate and compare the performances of predictive models and are useful to determine the statistical decision-making thresholds (in terms of probability level) that will limit the impact of poor forecasting as well. As detailed in Fawcett (2006), the ROC analysis is based on the computation of the true positive and true negative rate for different classification thresholds. This method is applicable to binary classification problems only. The observation is considered as belonging either to the positive or to the negative class. As a function of the decision-making threshold set, the classifier also assigns the prediction to one of these two classes. The confusion matrix between observations and forecasts presented in Table 2 lists the four outcomes: true positives (TPs) and false positives (FPs) and true negatives (TNs) and false negatives (FNs).
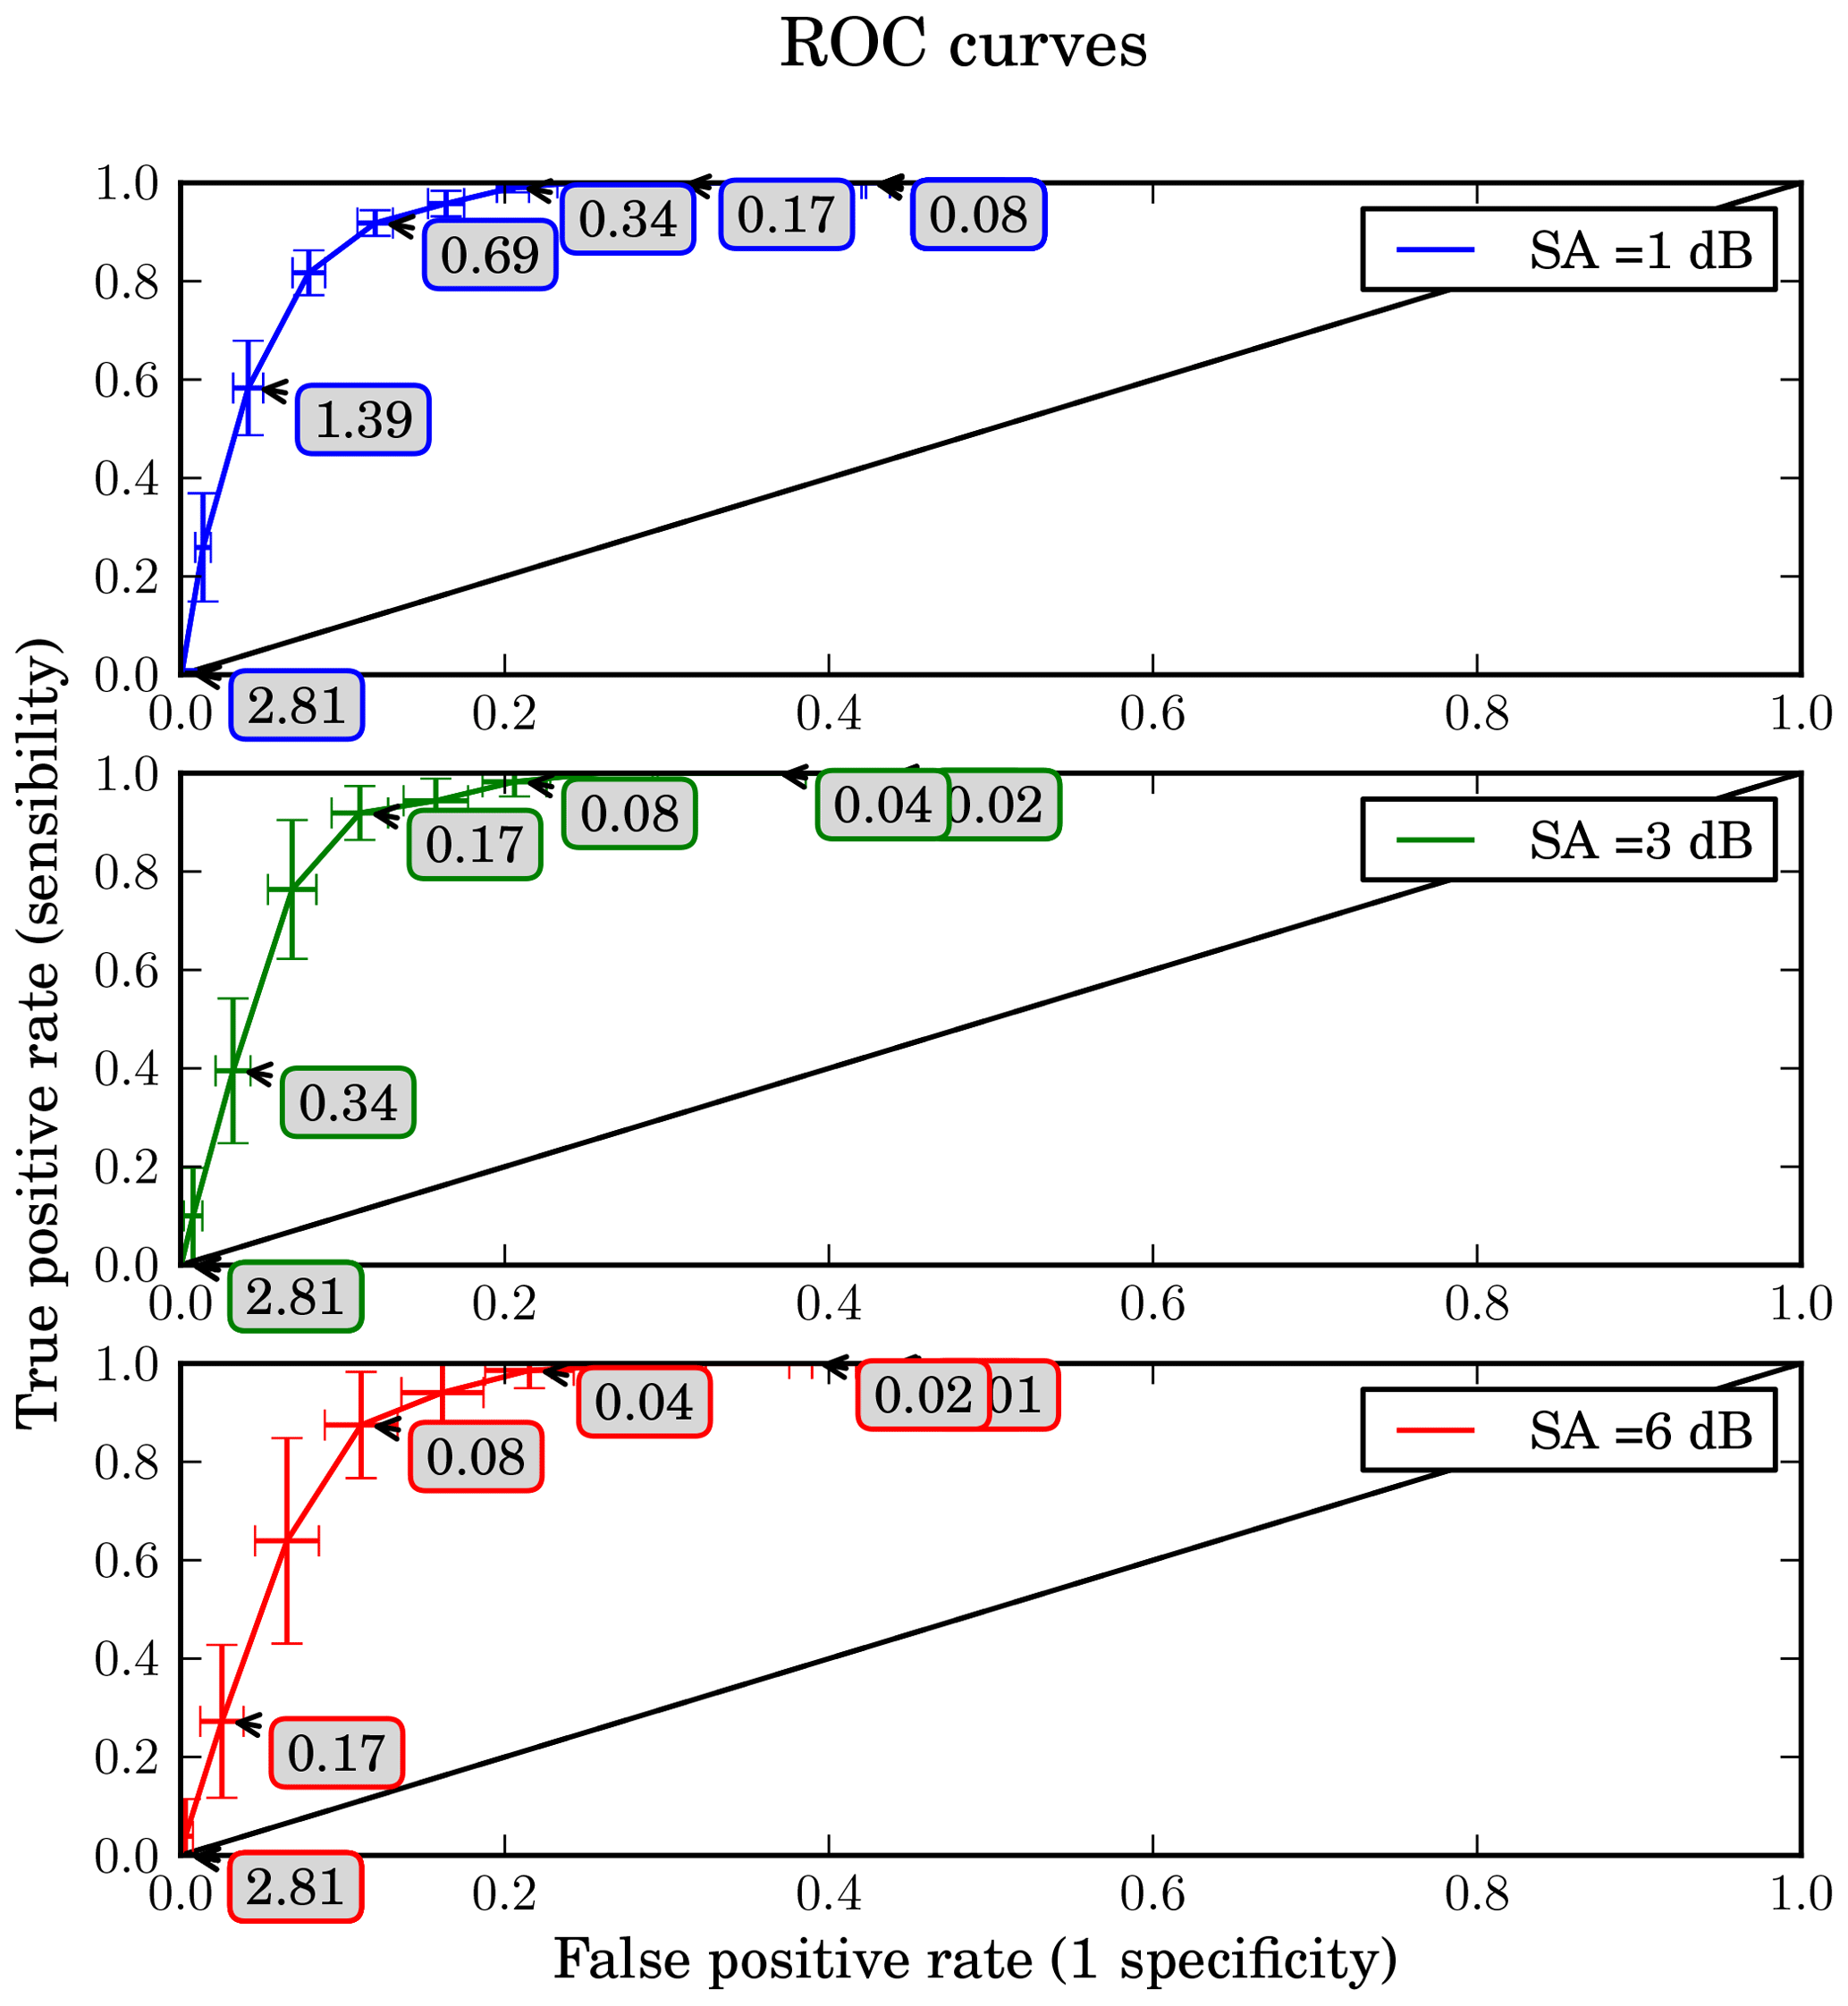
Figure 8ROC curve obtained averaging the 100-fold cross validation for attenuation thresholds set to 1 dB (blue), 3 dB (green) and 6 dB (red). The box plots indicate the standard deviation of each point. The diagonal line corresponds to random forecasts. If the curve is far from the diagonal, there is a high level of performance. The forecast probability DTh for each point (marked with an arrow) is indicated in the boxes in percent.
The true positive rate TPr represents the rate of true positive among the total numbers of positive. It characterizes the sensitivity of the model, meaning its ability to predict an event when the event occurs.
The false positive rate, also called the false alarm rate FAr, represents the rate of false positives among the total number of non-occurring cases.
The ROC curve is a plot of TPr against FAr for a range of decision thresholds. The point whose coordinates are (0, 0) is obtained for a classifier which systematically assigns the forecast to the negative class. Similarly, the point whose coordinates are (1, 1) refers to a classifier which systematically assigns the forecast to the positive class. The best algorithm for classification would yield a point in the upper left corner of the ROC space (coordinates: 0, 1). In fact, this point is associated with a zero rate of false alarm and a zero rate of false positives. On the contrary, a ROC curve approaching the diagonal from (0, 0) to (1, 1) indicates that the forecast skill is not better than chance level.
As described in Sect. 2.2, the model evaluates , the probability of exceeding ATh as a function of weather forecasts. The problem is as follows: from which probability threshold should the forecast be considered positive?
Figure 7 illustrates the decision process involved in identifying positive forecasts as well as the possible scenarios leading to true negative, false negative, false alarm and true positive events.
Let DTh be the decision threshold from which the predictive probability of exceeding a given attenuation threshold is considered significant enough for establishing protective measures (for example to reduce the link capacity). In other words, DTh is the probability threshold from which the forecast of the exceedance of a given attenuation threshold is considered positive.
Based on the process described in Fig. 7, false alarm and true detection rates have been computed for a range of DTh, from 0.01 to 3 %, and for three attenuation thresholds ATh respectively set to 1, 3 and 6 dB. A 100-fold cross validation has been performed (the original sample was randomly partitioned into 10 equally sized subsamples: 6 used as training data, 4 used as testing data). The average of the values computed in the loop leads to the solid lines in Fig. 8. The standard deviation of these data is given by the 2-D box plot as well. The curve's profile highlights the model's ability to exploit the information provided by the weather forecasts. The first observation that can be made is that the ROC curves are located above the diagonal line (in black). This means that the model allows improvements over a strategy of randomly guessing the state of the forecast. The model is thus able to detect, in a rather accurate way, the overrun of an attenuation threshold ATh, whether it is set to 1, 3 or 6 dB.
It should be stressed that the departure from the diagonal of the ROC curve is equivalent for the three used values of ATh. However, the standard deviation of the data appears to be highly dependent of ATh. It turns out that the highest attenuation rate considered here is a rather rare event, the strong variability being related to the poor sampling of the ROC calculation.
When the costs of false alarms and those of non-detection are in the same order of magnitude, DTh can be deduced from the ROC curves. The optimal DTh is then the one given by the left and uppermost point of the curve. Actually, the cost–loss ratio is here nontrivial. A methodology to optimally choose the decision threshold in the present context, based on the maximization of a predetermined economic value, will be discussed in Sect. 4.1.4.
In the previous part a methodology to develop a statistical forecast model of rain attenuation based on numerical weather forecasting has been detailed and evaluated. This final part is devoted to the description of methodologies for the optimization of the offered capacity or of the economic value for a predetermined user-oriented service offer. Both proposed methods use the attenuation forecast model outlined in Sect. 2.
4.1 Optimization of radio resource management algorithms using weather forecasts
4.1.1 Link adaptation algorithms to propagation impairments
As detailed in Sect. 1, satellite transmissions become particularly sensitive to weather propagation conditions with growing frequencies. Especially in Ka and Q/V bands, attenuation due to rain may sometimes reach critical levels and cause an interruption of the communication. In such context, adaptive power control systems are particularly costly and can compensate only a limited portion of the tropospheric fades. It is, however, essential for satellite operators to ensure a minimal availability to the final user, typically set to 99.9 % of the transmission time.
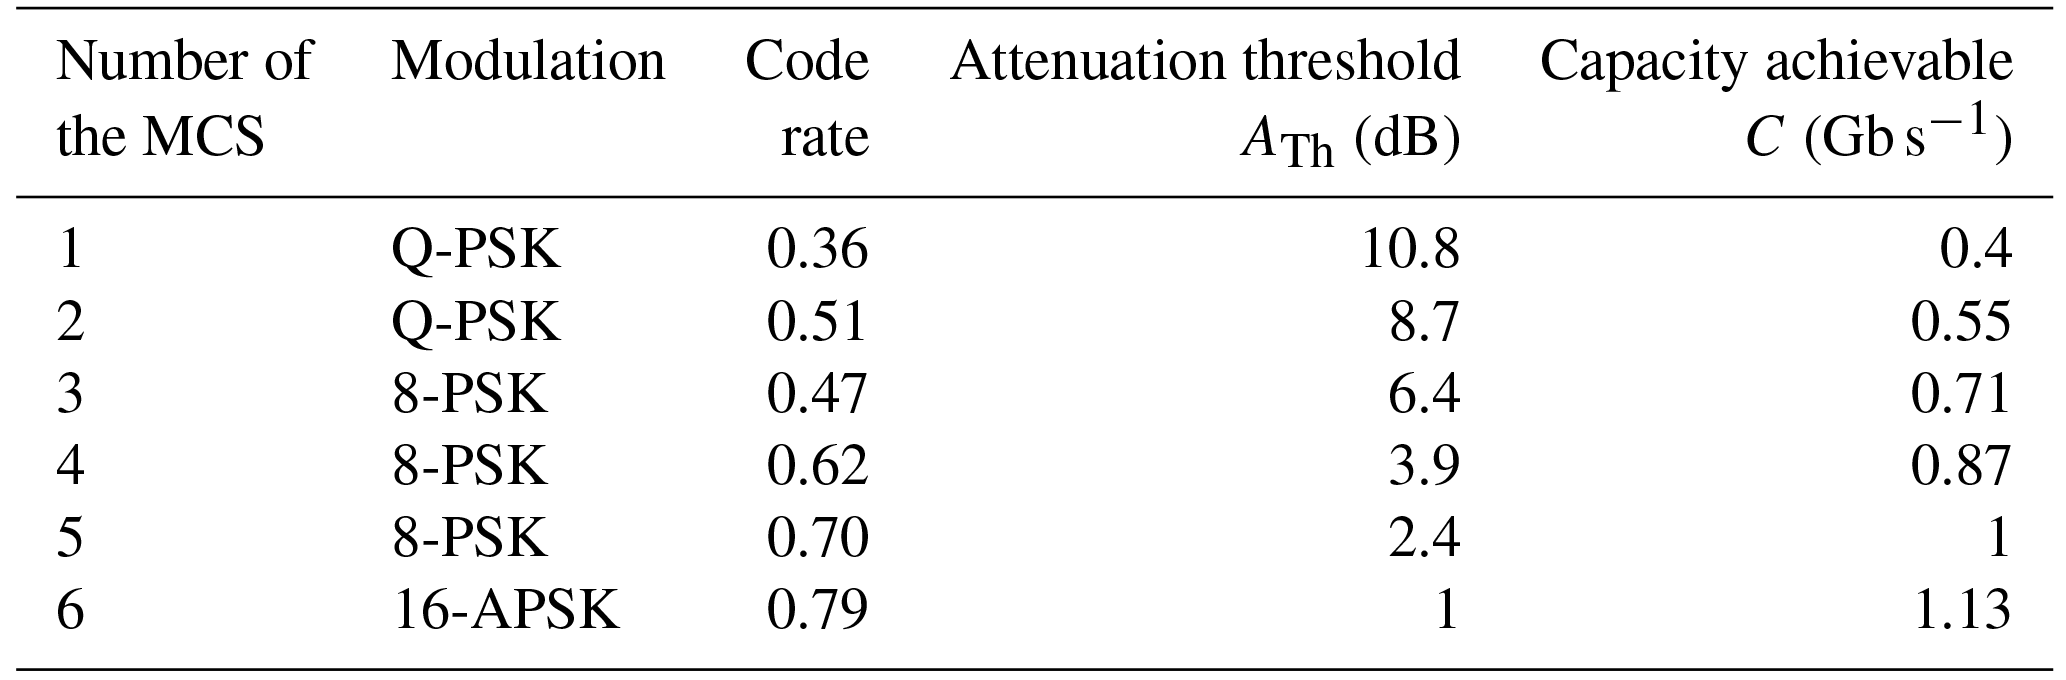
Table 3Extract of possible modulation and coding schemes (MCSs) as defined in the Digital Video Broadcasting – Satellite second-generation (DVB-S2X) standard (DVB, 2014) and of their operating characteristics.
In order to maintain the link even in adverse propagation conditions without the need of radiating more power, an alternative is to adapt the link data rate to the weather conditions. The idea is to modify the modulation and coding used to carry the information as the tropospheric attenuation is varying. Here, the purpose is not to detail the modulation and forward error correction coding techniques. More information can be found in Ziemer and Peterson (2001) and Watson et al. (2002). The whole point of this is that the nature of the modulation and coding combination used to transmit the information determines the achievable capacity of the link. Furthermore, the use of a specific modulation and coding combination is subject to propagation conditions. In fact, the most efficient combinations are also the less robust to signal degradation. The challenge is therefore to select the most efficient coding and modulation suitable to maintain the link, considering the experienced propagation conditions. Hereafter, the different combinations of modulation and coding available are referred to as the MCS (modulation and coding scheme).
The characteristics of some of the MCSs that are used in the following of the study are listed in the Table 3. The MCSs are labeled from 1 to 6. The achievable capacity C is given as a function of the selected MCS for a bandwidth of 540 MHz.
The capacity characterizes the data amount, in gigabit here, transmitted each second on the RF channel. An attenuation threshold ATh, indicating the maximal level of attenuation below which the MCS can be used to transmit the data stream without errors, is also given. Those thresholds of course depend on the characteristics of the link (bandwidth, wavelength) and of the communication equipment (radiated power, antenna gains and the figure of merit for the receiver).
To result in a valid transmission, the attenuation threshold noted ATh, associated with the MCS used, must be higher than the experienced attenuation on the link. For example, MCS no. 6 should not be used unless the tropospheric attenuation is lower than 1 dB whereas MCS no. 1 can be used up to 10.8 dB of attenuation, but the capacity of the link shrinks from 1.13 to 0.4 Gb s−1. More generally, the most robust MCS may be used even while the tropospheric attenuation is strong and thus guarantees the transmission in most of the experienced weather conditions. However, in that case the price of this resilience to adverse atmospheric conditions is a reduced capacity of the link. It is then preferable to adjust the MCS following weather conditions. For instance, an MCS offering high link capacities should be used under clear-sky conditions when the tropospheric attenuation is weak.
It is understood that an inaccuracy in the estimation of the tropospheric attenuation leads to an inadequate selection of the MCS, which can have significant consequences on the performances of the link. In case of overestimation of the tropospheric fading, a less efficient MCS than the one allowed by the real propagation conditions is selected. The difference between the capacity offered by the achievable MCS and the one used is lost. In case of underestimation, the selected MCS no longer guarantees the power margin required to face the propagation impairments. Such a scenario inevitably leads to the interruption of the communication, namely to the unavailability of the link and a null capacity. Therefore, it is clear that the underestimation of the attenuation is far more prejudicial than an overestimation.
To illustrate this it can be assumed that the attenuation of the link reaches 2 dB. According to the Table 3, MCS no. 5 should be used to carry the information. In this scenario, the capacity of the link can reach 1 Gb s−1. Now, assuming that the attenuation has been overestimated using the weather forecast, then MCS no. 4 would be selected instead. The provided capacity would only reach 0.87 Gb s−1. This mistake would result in a capacity loss of 0.23 Gb s−1. On the contrary, assuming for the same experienced attenuation conditions, an underestimation of the attenuation leading to the use of MCS no. 6 would lead the interruption of the communication and would result in a loss of 1 Gb s−1.
It is now clear that the efficiency and the availability of the satellite transmission is highly dependent on the MCS selection, based on the analysis of the propagation attenuation. Nonetheless, the propagation losses affecting the link are not always known as it requires a feedback. As a function of the available information on the state of the channel, different modulation and coding strategies can be applied. These are detailed in the next subsection.
4.1.2 Transmission strategies
The selection method of the MCS depends on the nature of the available information on the propagation channel. Four different scenarios have been considered with various assumptions on the type of information available to control the modulation and coding of the link:
-
The propagation channel is perfectly known.
-
The channel is unknown.
-
Probabilistic weather forecasts are available.
-
Deterministic weather forecasts are available.
Table 4Proposition of coding and modulation strategies as a function of the available information on the state of the channel.
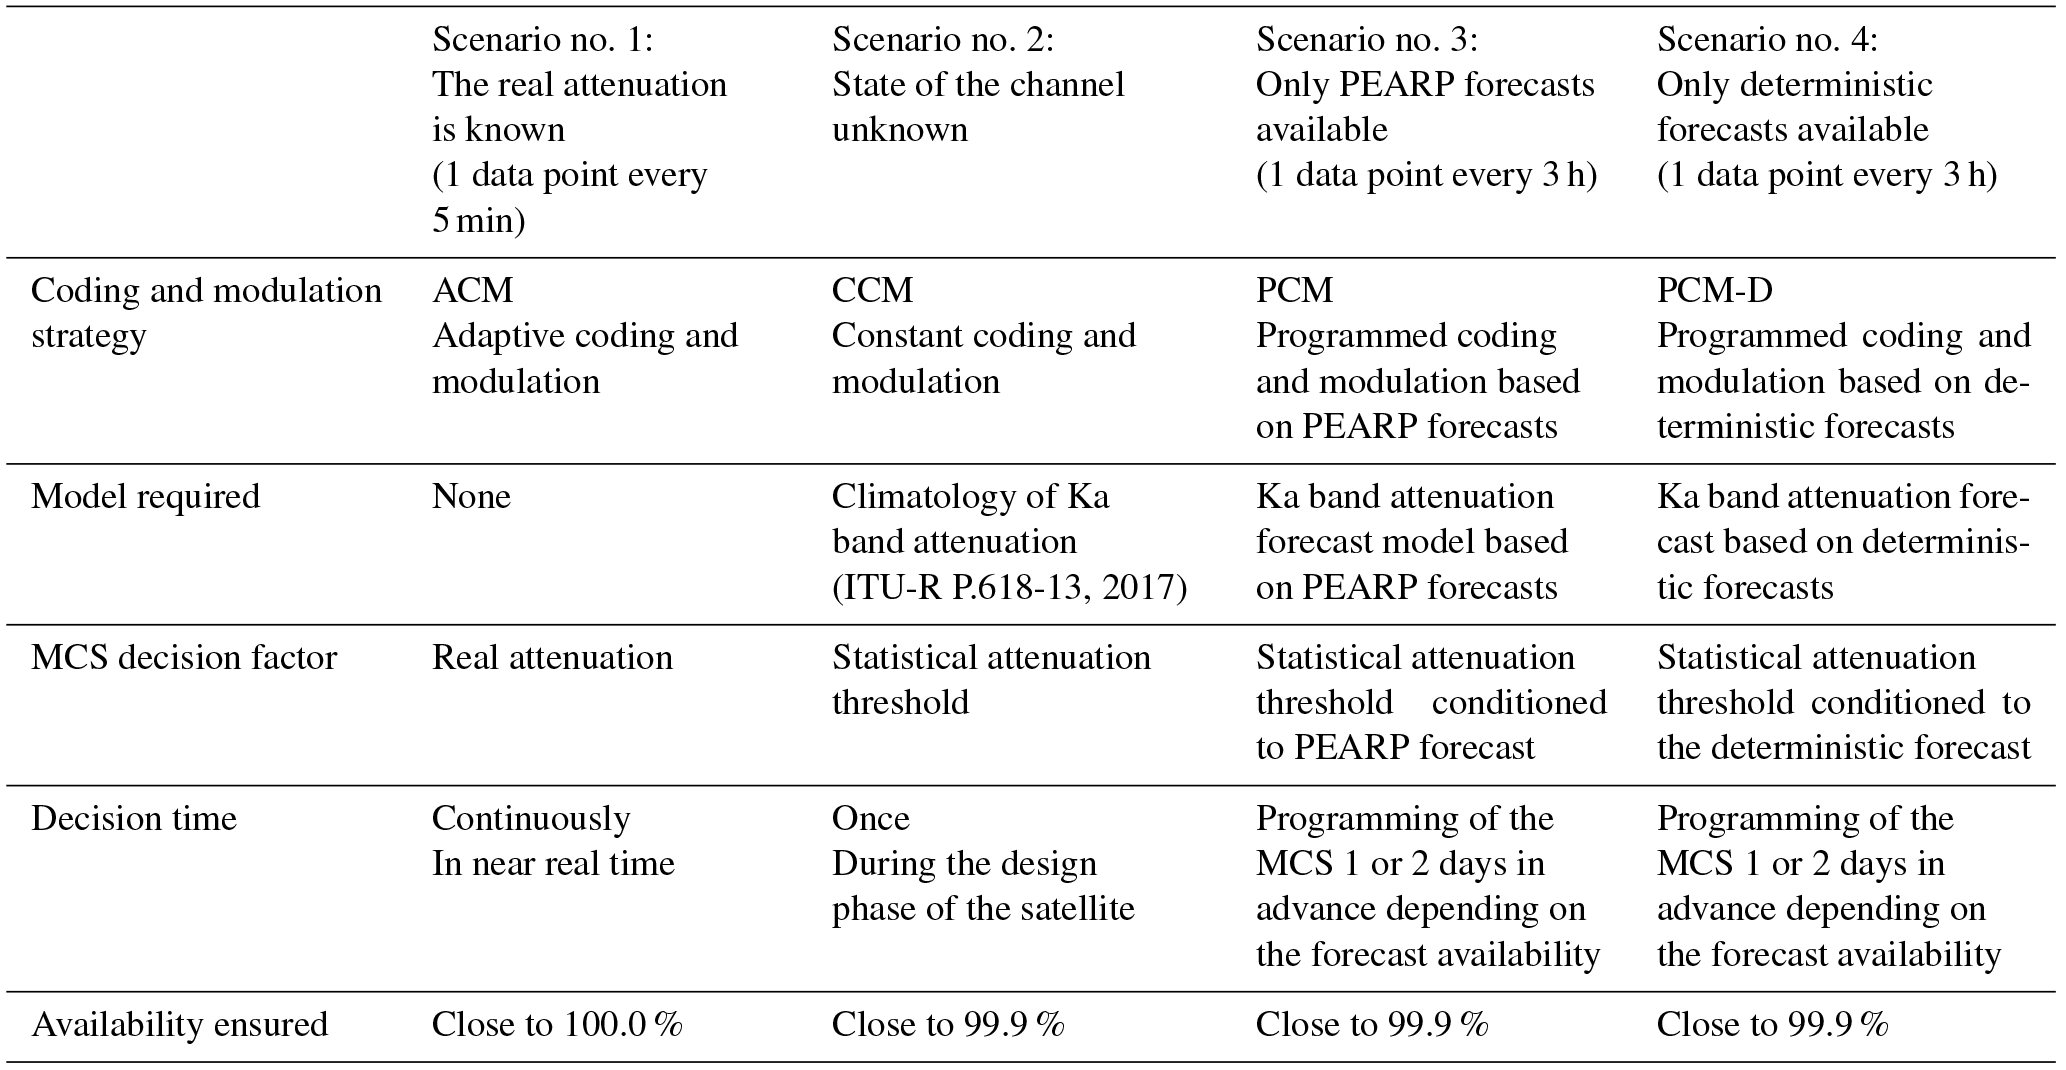
The characteristics of those scenarios are summarized in the Table 4.
In the first scenario, the attenuation experienced by the link is supposed to be known. The optimal strategy can be adopted, namely to dynamically select the most suitable MCS considering the current propagation conditions.
This strategy is referred to as ACM for adaptive coding and modulation (Zhu et al., 2006). The ACM technique is extremely efficient but requires a quasi-instantaneous feedback of the tropospheric attenuation affecting the channel to be sent to the modulator through a return channel. The existence of this return channel raises various issues in terms of payload complexity, security of the telecommand (TC) and required infrastructure. In particular, in the context data downlink of low Earth orbit (LEO) satellites, it would need significant developments before beginning operation.
The second scenario assumes the total absence of information about the propagation conditions. When it is impossible to implement ACM, a constant coding and modulation (CCM) scheme is applied to the transmission. The objective is to use the MCS that will be compatible with the targeted availability. From ITU-R P.618-13 (2017) the tropospheric attenuation that is not exceeded 99.9 % of the time, noted A99.9 %, can be computed. The CCM strategy consists in selecting the most efficient MCS satisfying the following condition: Ath<A99.9 %. For example, let us consider a satellite system configuration operating in Ka band, for which the tropospheric fading exceeds 8 dB for 0.1 % of the time. The CCM strategy would consist in applying a unique MCS (no. 2 in the Table 3). Only robust but relatively inefficient MCSs are able in the context of constant coding and modulation transmission to face the high tropospheric attenuations occurring in Ka and Q/V bands. An intermediate solution would be to schedule a plan of the MCS depending on the probabilistic attenuation forecasts.
The third scenario makes use of the weather forecasts. The model developed and described in Sect. 2 gives the attenuation distributions conditioned to the PEARP forecasts. From those distributions, the corresponding attenuation thresholds that exceeded 0.1 % of the time can be deduced. It is proposed to choose the MCS in advance as a function of these probabilistic attenuation forecasts. In the following sections, this strategy will be called PCM, for programmed coding and modulation. Such a strategy would provide a flexibility close to the one offered by an ACM link without the requirement of a constant return link between the receiving stations and the satellite. Let us consider the specific case of low Earth orbit satellites. Once or several times a day, LEO satellites become visible to the receiving stations for a few minutes. None are able to transmit information to the satellites. However, along their path, the satellites come in contact with a ground control station as well. Contrary to receiving stations, control stations are equipped with a telecommand link which allows the monitoring of the satellites' performance. This telecommand link could be used to program a plan of the MCS for the next orbit.
In order to assess the interest of using probabilistic forecasts over deterministic ones, a last scenario consisting in using deterministic forecasts instead of PEARP forecasts is investigated. This strategy is referred to as PCM-D strategy (PCM-Deterministic). In the following sections, the first member of the PEARP ensemble, called the control member, is arbitrarily chosen as the deterministic forecast.
The adaptive coding and modulation based scenario that relied on currently experienced attenuation is obviously the most favorable. In theory, the ACM strategy allows a perfect optimization of the capacity and highly limits the unavailability. Thus, the programmed coding and modulation strategy based on the PEARP forecasts is not expected to be as efficient as the ACM one. Here, the aim is rather to enhance the performances offered by a constant coding and modulation strategy that relies only on local climatology, without requirement of real attenuation measurements and a return link. This point is discussed in the following subsection.
4.1.3 Results
As explained, the PCM strategy would be particularly suitable for the management of low Earth orbit satellite transmissions, for which return links are only implemented at the level of the control station, not at the level of the receiving stations. However, the lack of Ka band measurements for low Earth orbit satellites prevents the model from being tested in this context. As a first step, an evaluation of the performances of the PCM strategy is thus proposed in the context of a geostationary satellite. A Ka band transmission line between the geostationary satellite Astra 3B and the receiving station located in Toulouse, France, has been simulated. The four scenarios listed in the Table 4 have been tested.
The mission parameters used for the simulation are the following: a bandwidth of 540 MHz, an elevation of the satellite of 35∘ and a EIRP+G/T of 80 dBW K−1. The EIRP, for effective isotropic radiated power, measures the ability of the transmission antenna to direct the power emitted in a given area. The term G/T is a figure of merit in the characterization of ground station antenna performance, where G is the antenna gain in decibels at the received frequency, and T is the equivalent noise temperature of the receiving system in kelvin.
The PEARP forecasts of 2014 and 2015 have been used as the input of the PCM and the PCM-D decision algorithm. The ACM strategy has been based on the Ka band measurements of the same years, assuming an idealized adaptation of the MCS to the channel state.
The target availability has been set to 99.9 % of the communication time. Here a bootstrapping approach has been used again. The available samples were partitioned in 10 subsets: 6 constituting the training dataset, 4 constituting the testing set. The procedure has been repeated 100 times and the capacities obtained have been averaged. The mean capacities obtained for ACM, CCM, PCM and PCM-D strategies are presented in Fig. 9.

Figure 9Mean capacities obtained for a target availability of 99.9 % considered from a geostationary satellite. Comparison of ACM, CCM, PCM and PCM-D deterministic strategies. The box plots indicate the standard deviation of the data.
As expected, the best performance has been obtained for the ACM strategy, which is an upper bound. Due to limited weather forecast predictability, the proposed PCM strategy is not able to offer the same level of capacity. Nevertheless, it is clear that, with an increase of the capacity close to 17 %, this technique significantly improves the throughput ensured by a constant coding and modulation technique without any prior knowledge on the instantaneous state of the propagation channel.
It also appears that the use of ensemble forecasts outperforms the use of deterministic forecasts. The results obtained are highly dependent on the systems parameters such as the satellite elevation, the ground station location or the transmission frequency. Furthermore, the use of higher frequencies (Q/V bands) or receiving stations located in tropical areas would inevitably result in even more noticeable differences in the achievable throughputs.
So far, the methodology proposed, consisting in programming the modulation and coding using weather forecasts in advance, requires us to set a level of target availability. In fact, the MCSs are chosen in order to ensure this availability. Without this constraint, the number of perspectives would certainly be increased. In the next part, a more general approach is adopted. A decision process based on the optimization of an economic value, taking into account both capacity and availability offered, is proposed.
4.1.4 Economic value of the forecast
When it comes to the use of a probabilistic forecast, the decision to change the link MCS or not amounts to searching the forecasted probability above which the forecast is considered positive. In this context the issue is to find the forecast probability above which it is considered that the attenuation threshold ATh is exceeded, and consequently an action must be taken.
So far, the required availability of the link has been set to 99.9 % in order to respond to the operator's needs. In such a context, the probabilistic attenuation forecast has to be considered positive when the chance of exceeding the attenuation threshold of interest ATh is higher than or equal to 0.1 %, which is the value of the tolerated unavailability. In fact, the choice of a decision threshold higher than 0.1 % would not allow us to bring the required availability. On the contrary, a lower decision threshold would result in a capacity loss.
This requirement of 99.9 % of availability is typical for communication satellites, since the tolerance of the final users to communication outages is highly limited. However, it is easy to imagine further applications for which both availability and mean capacity have to be optimized without prerequisites on any of these parameters. The challenge in this case is to determine the optimal decision threshold, noted DTh in the following sections.
As an example, still considering the particular case of an Earth observation satellite. The images acquired by the satellite on its path must be transmitted on Earth as soon as a receiving station is visible. The visibility periods of the Earth's stations are limited to a few minutes. Especially under rainy conditions, it could happen that the data sent by the satellite do not reach the receiving station. In this case, data are definitively lost. It might then be sometimes more careful to temporarily store the data in the onboard memory while waiting for the next contact with the ground. This strategy has been evaluated in Jeannin and Dahman (2016). In this context the probabilistic attenuation forecasts could be of great value to decide for either the data transmission or data storage in advance, provided that the decision threshold is chosen carefully.
A methodology to determine DTh, defined here as the forecast probability from which the data storage is preferred to the data transmission, is now proposed. The optimal value of DTh is the one that allows both the maximization of the amount of transmitted data and the minimization of the amount of lost data. For the sake of simplicity, it is considered that the data sent can only be received if the attenuation does not exceed a given attenuation threshold ATh. A perfect decision algorithm would result in data transmission when the real attenuation is lower than ATh and in data storage otherwise.
The ROC curves introduced in Sect. 3 could be used to determine the probability forecast threshold that minimizes the false alarm rate while maximizing the true detection rate (Greiner et al., 2000). Such a method shows its limitations once it is required to penalize either the false negative or false positive events. We rather propose here a decision process based on the optimization of an economic value that one could adapt as a function of the needs of the systems targeted.
To account for the high cost of lost data and for the successfully transmitted ones, the economic value to be maximized, noted EV, is defined in Eq. (4):
where C is the total amount of transmitted data, and L is the ratio of total lost data over total transmitted data.
Decreasing the value of DTh limits the amount of transmitted data as well as the amount of lost data and thus impacts the economic value.
In Fig. 10, we illustrate the evolution of the mean EV on a 2-year period simulation (2014 and 2015) as a function of DTh for several attenuation thresholds ATh.
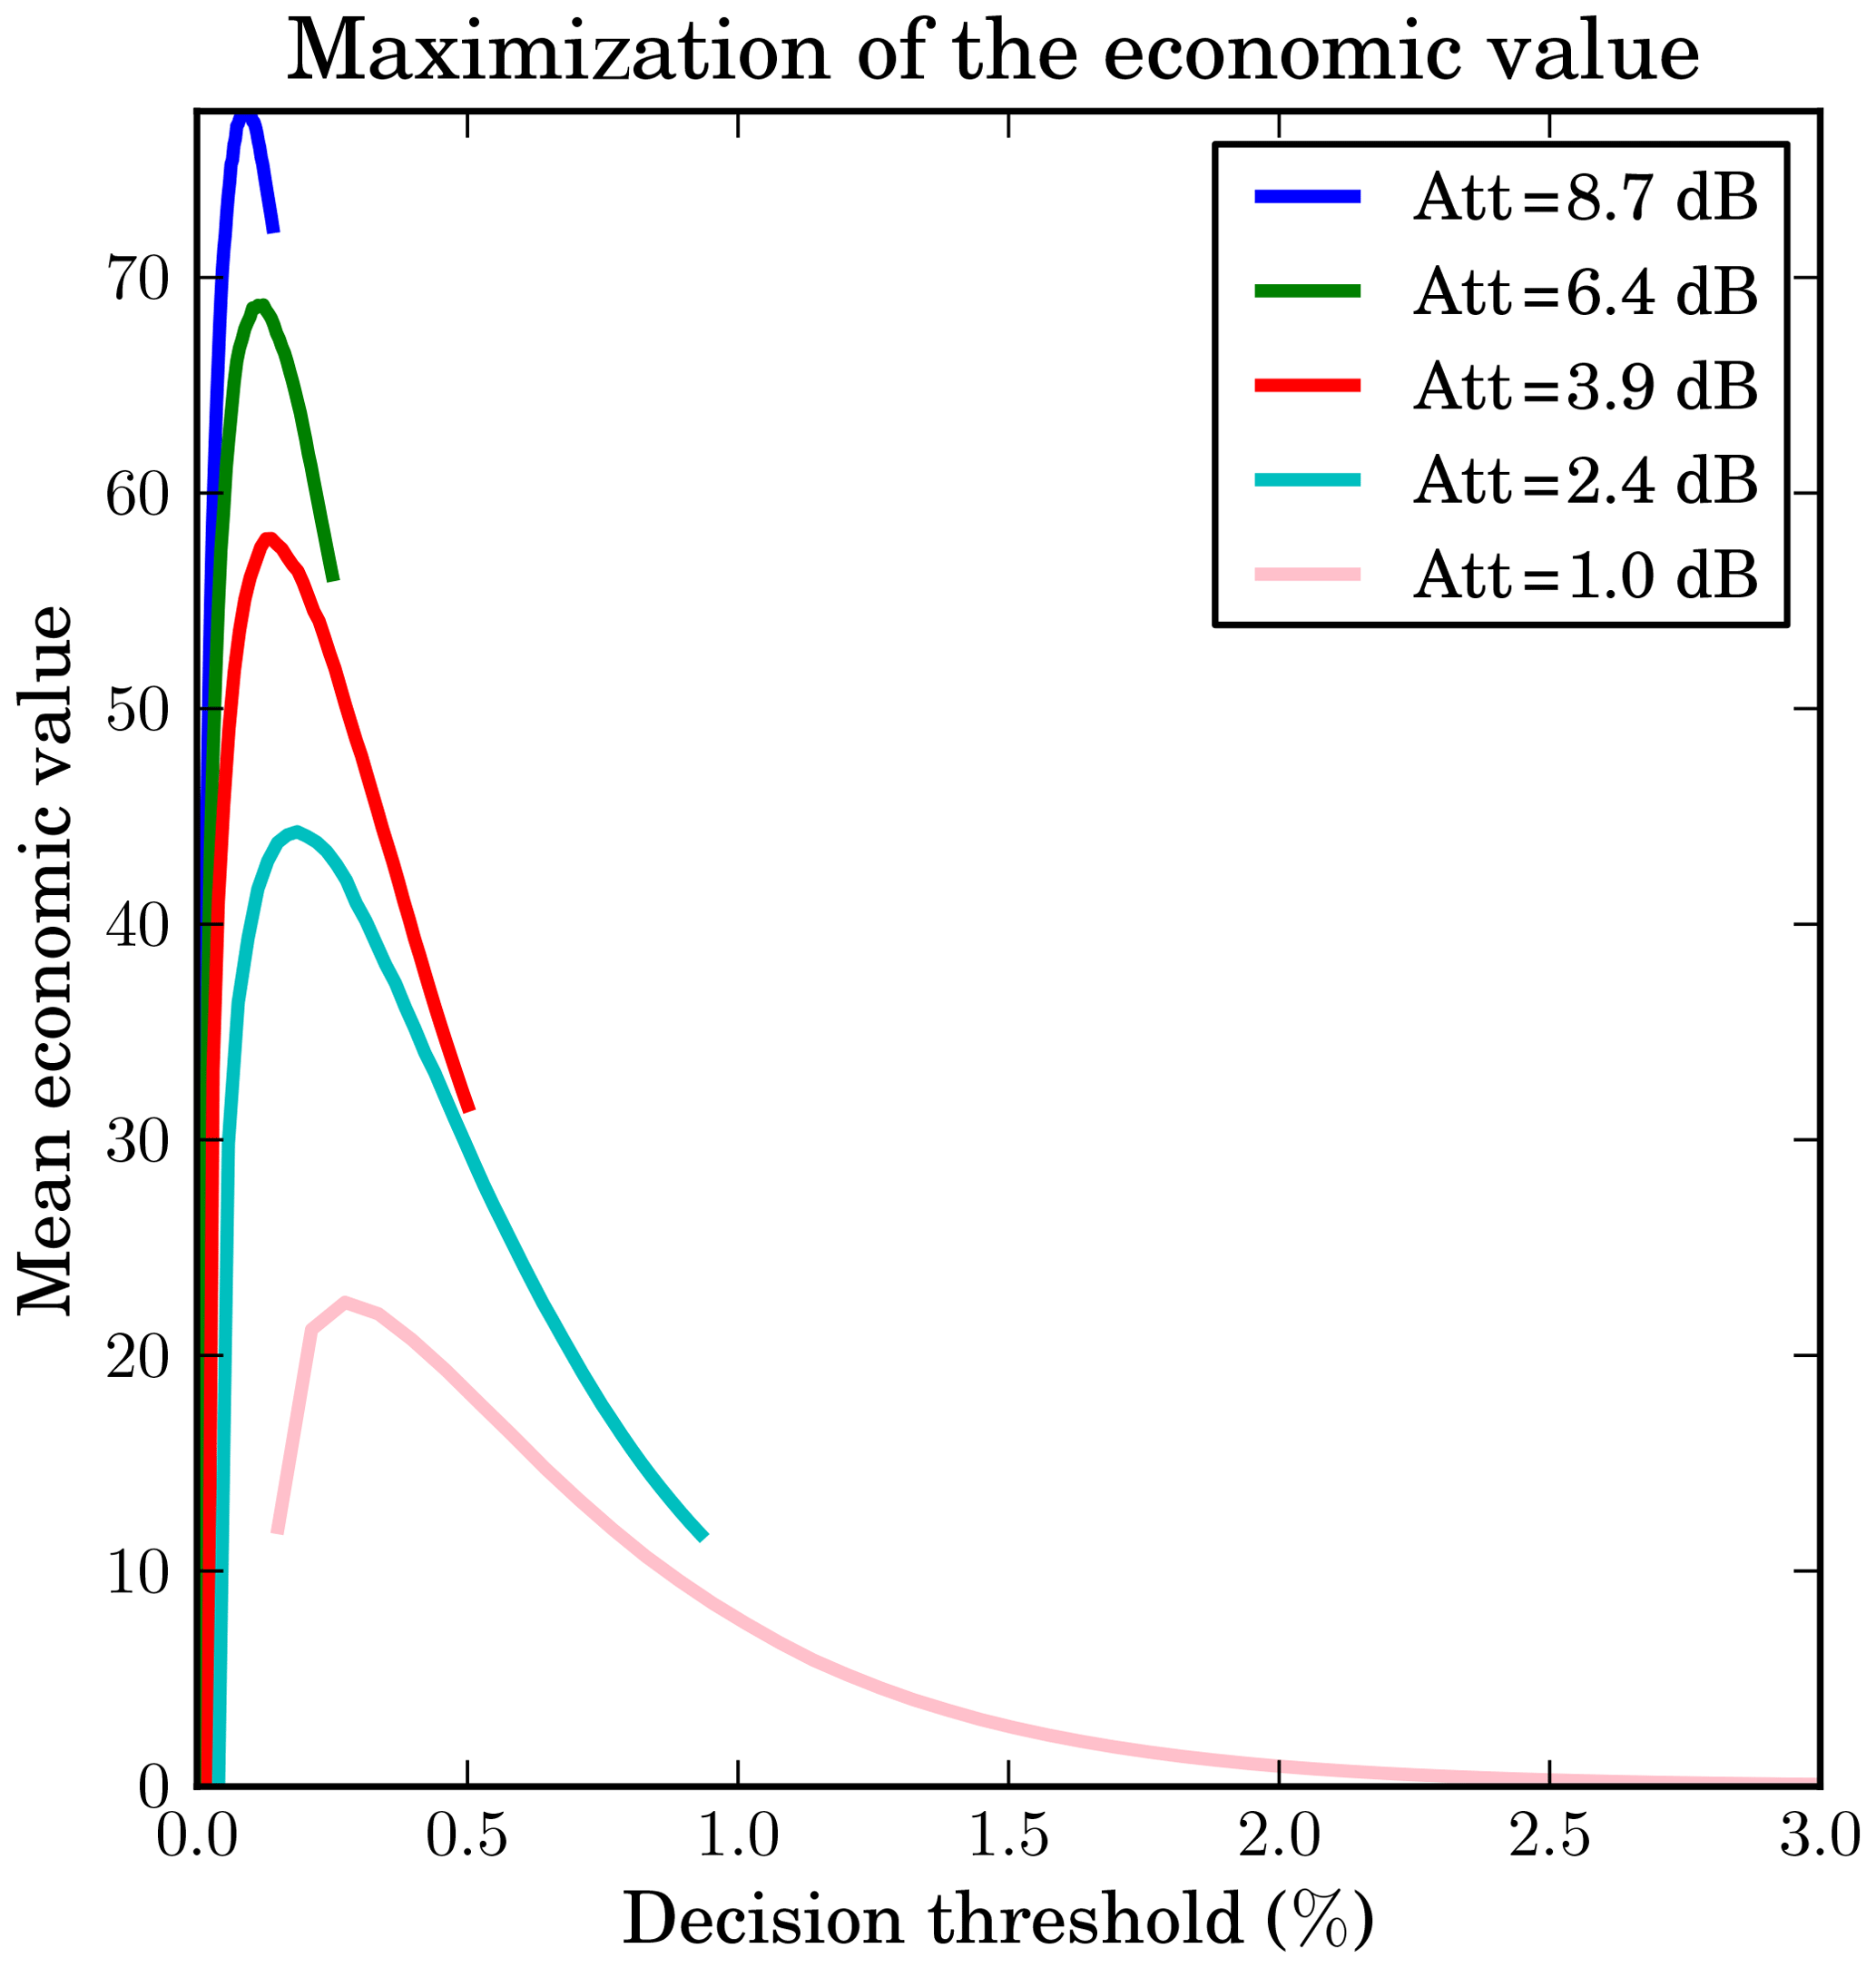
Figure 10Evolution of the mean economic value as a function of the decision threshold used to discriminate between positive and negative forecasts. The mean economic values have been obtained averaging the economic values computed following Eq. (4) for a simulation period of 2 years (2014–2015).
It appears in Fig. 10 that, for all attenuation thresholds, an optimal threshold DTh can be found. It should be used for deciding between either the data transmission or the data storage. As example, for an attenuation threshold of 1.0 dB, the optimal decision threshold is 0.24 %. This means that when the tropospheric attenuation is tolerated up to 1.0 dB, the appropriate strategy would consist in transmitting data only when the probability is below 0.24 %. Otherwise the data should be stored. It was noted that, for a same attenuation threshold the ROC curves in Fig. 8 indicate a decision threshold comprised between 0.7 % and 1.4 %. The difference between the results is because the cost of misdetection is larger than the cost of false alarm. The ROC curves do not integrate this information.
This study has presented a methodology for predicting the rain attenuation which affects the satellite transmissions. The sensitivity of satellite transmission to rain becomes particularly sensitive with the ongoing trend to use high-frequency bands, from 20 to 50 GHz. The proposed model exploits the probabilistic rain forecasts of the Météo-France short-range ensemble prediction system PEARP and delivers probabilistic attenuation forecasts at 20 GHz. In particular due to the inhomogeneity (in terms of temporal resolution) of the predictand used for the model's learning process, a bias into the model was expected. It turns out that reliability diagrams show forecast frequencies close to the observed ones. The figures obtained suggest that the statistical model shows only a small remaining bias. For a more complete assessment, rank diagrams and ROC curves demonstrate the model's ability to discriminate between event and nonevent cases and to give forecast frequencies different from the climatology ones. Consequently, it can be concluded that the model shows satisfactory reliability resolution and sharpness.
In satellite communication, the main concerns are the link availability and capacity. The primary hypothesis tested in the study was that the probabilistic weather forecasts could be very helpful to maintain the high availability required by the satellite operators while optimizing the capacity as far as possible. It has been shown that conditioning the type of waveform (modulation and coding scheme) used to transmit the information to probabilistic weather forecasts allows an increase of the mean capacity of the link while ensuring the availability of 99.9 % that is usually required. It has also been proven that the benefit is higher using probabilistic weather forecasts over deterministic ones.
The link availability and capacity are highly interdependent. Within a certain limit, increasing one of these parameters is detrimental to the other one. The request of high availability inevitably results in a limitation of the capacity, which may be particularly unfortunate in some contexts. It would then be sometime profitable to be able to find the least expensive combination of these two parameters.
In the last stage, a strategy to maximize the economic value accounting for the transmitted data volume as well as for the fraction of successfully transmitted data has been proposed. This economic value could be adapted to the targeted application. For this initial attempt to optimize high-frequency band satellite transmissions from ensemble weather forecast systems, encouraging results have been obtained. It should be stressed that the application to the forecast of rain attenuation around 50 GHz, or to more sensitive ground station locations such as in tropical regions, could show more value. Unfortunately, we do not have any attenuation observations for those contexts.
It also has to be mentioned that the horizontal resolution and the temporal resolution of the PEARP forecast are non-negligible drawbacks as well. It would make sense to replace the global ensemble PEARP by the regional mesoscale ensemble prediction system AROME (Bouttier et al., 2011) in the attenuation prediction process. The authors would like to stress the fact that the time resolution of the model output used for the prediction process should be higher than 3 h, and probably even higher than 1 h, according to the large time-variability of attenuation observations.
As a conclusion, though perfectible, the model developed allows us to demonstrate the benefit of using ensemble weather forecasts in the field of satellite communications. The wide range of applications of the model developed includes the following particularly relevant weather-dependent applications, which could be addressed in further publications:
-
site diversity (Jeannin et al., 2014), for which an anticipation of the attenuation would allow advanced scheduling the switching from the ground station under unfavorable propagation conditions to redundant ones.
-
deep space links (Biscarini et al., 2016), for which an anticipation of the attenuation would allow the scheduling of the data transmission when the propagation conditions are the most favorable.
Data are available from the authors upon request.
ID performed the study. PA gave guidance on the use of the ensemble weather forecasts and on the statistical evaluation of the model. NJ and BB gave guidance on the modeling of the propagation and Satcom system.
The authors declare that they have no conflict of interest.
We sincerely thank the anonymous referees for the comments and suggestions on
the earlier draft of this discussion paper.
Edited by: Vassiliki
Kotroni
Reviewed by: two anonymous referees
Arapoglou, P.-D. M., Panagopoulos, A. D., and Cottis, P. G.: An analytical prediction model of time diversity performance for earth-space fade mitigation, Int. J. Antenn. Propag., 2008, 142497, https://doi.org/10.1155/2008/142497, 2008. a
Biscarini, M., Marzano, F., Montopoli, M., De Sanctis, K., Iess, L., Montagna, M., Mercolino, M., and Lanucara, M.: Optimizing Data Volume Return for Ka-Band Deep Space Links Exploiting Short-Term Radiometeorological Model Forecast, IEEE T. Antenn. Propag., 64, 235–250, https://doi.org/10.1109/TAP.2015.2500910, 2016. a, b
Bougeault, P.: A simple parameterization of the large-scale effects of cumulus convection, Mon. Weather Rev., 113, 2108–2121, 1985. a
Boulanger, X., Gabard, B., and Casadebaig, L. C.: Four Years of Total Attenuation Statistics of Earth-Space Propagation Experiments at Ka-Band in Toulouse, IEEE T. Antenn. Propag., 63, 2203–2214, https://doi.org/10.1109/TAP.2015.2407376, 2015. a
Bouttier, F., Nuissier, O., Vié, B., and Raynaud, L.: Convective-scale ensemble prediction experiments with the AROME model, in: EMS Annual Meeting Abstracts, Vol. 8, p. 804, 11th EMS/10th ECAM, 2011. a
Cioni, S., De Gaudenzi, R., and Rinaldo, R.: Channel estimation and physical layer adaptation techniques for satellite networks exploiting adaptive coding and modulation, Int. J. Satell. Comm. N., 26, 157–188, https://doi.org/10.1002/sat.901, 2008. a
Descamps, L., Labadie, C., Joly, A., Bazile, E., Arbogast, P., and Cébron, P.: PEARP, the Météo-France short-range ensemble prediction system, Q. J. Roy. Meteor. Soc., 141, 1671–1685, https://doi.org/10.1002/qj.2469, 2015. a, b
Desroziers, G., Camino, J.-T., and Berre, L.: 4DEnVar: link with 4D state formulation of variational assimilation and different possible implementations, Q. J. Roy. Meteor. Soc., 140, 2097–2110, https://doi.org/10.1002/qj.2325, 2014. a
DVB: Second Generation Framing Structure, Channel Coding and Modulation Systems for Broadcasting, Interactive Services, News Gathering and Other Broadband Satellite Applications; Part 2: S2Extensions (DVBS2X), Vol. ETSIEN302307-2, Digital Video Broadcasting (DVB) Standard, 2014. a
Fawcett, T.: Introduction to ROC analysis, 27, 861–874, https://doi.org/10.1016/j.patrec.2005.10.010, 2006. a
Greiner, M., Pfeiffer, D., and Smith, R.: Principles and practical application of the receiver-operating characteristic analysis for diagnostic tests, Prev. Vet. Med., 45, 23–41, 2000. a
Gunn, K. L. S. and East, T. W. R.: The microwave properties of precipitation particles, Q. J. Roy. Meteor. Soc., 80, 522–545, https://doi.org/10.1002/qj.49708034603, 1954. a
Hamill, T. M.: Interpretation of rank histograms for verifying ensemble forecasts, Mon. Weather Rev., 129, 550–560, 2001. a
IEEE: IEEE Standard Letter Designations for Radar-Frequency Bands, IEEE Std 521-2002 (Revision of IEEE Std 521-1984), 0_1–3, https://doi.org/10.1109/IEEESTD.2003.94224, 2003. a
ITU-R P.618-13: Propagation data and prediction methods required for the design of Earth-space telecommunication systems, available at: https://www.itu.int/rec/R-REC-P.618/fr (last access: 11 December 2018), 2017. a, b, c, d
ITU-R P.837-7: Characteristics of precipitation for propagation modelling, 2017. a
ITU-R P.839-04: Rain height model for prediction methods, 2013. a
Jeannin, N. and Dahman, I.: Sizing and optimization of high throughput radio-frequency data down link of earth observation satellites, Int. J. Satell. Comm. N., 34, 231–250, https://doi.org/10.1002/sat.1115, 2016. a
Jeannin, N., Castanet, L., Radzik, J., Bousquet, M., Evans, B., and Thompson, P.: Smart gateways for terabit/s satellite, Int. J. Satell. Comm. N., 32, 93–106, https://doi.org/10.1002/sat.1065, 2014. a, b
Jeannin, N., Castanet, L., Dahman, I., Pourret, V., and Pouponneau, B.: Smart gateways switching control algorithms based on tropospheric propagation forecasts, Int. J. Satell. Comm. N., 37, 43–55, https://doi.org/10.1002/sat.1233, 2017. a
Nurmi, P.: Recommendations on the verification of local weather forecasts, Shinfield Park, Reading, available at: https://www.ecmwf.int/en/elibrary/11401-recommendations-verification-local-weather-forecasts (last access: 11 December 2018), 2003. a
Oguchi, T.: Electromagnetic wave propagation and scattering in rain and other hydrometeors, P. IEEE, 71, 1029–1078, https://doi.org/10.1109/PROC.1983.12724, 1983. a
Panagopoulos, A. D., Arapoglou, P. D., and Cottis, P. G.: Satellite Communications at KU, KA, and V Bands: Propagation Impairments and Mitigation Techniques, Commun. Surveys Tuts., 6, 2–14, https://doi.org/10.1109/COMST.2004.5342290, 2004. a
Paraboni, A., Buti, M., Capsoni, C., Ferraro, D., Riva, C., Martellucci, A., and Gabellini, P.: Meteorology-Driven Optimum Control of a Multibeam Antenna in Satellite Telecommunications, IEEE T. Antenn. Propag., 57, 508–519, https://doi.org/10.1109/TAP.2008.2011238, 2009. a, b
Piriou, J.-M., Redelsperger, J.-L., Geleyn, J.-F., Lafore, J.-P., and Guichard, F.: An Approach for Convective Parameterization with Memory: Separating Microphysics and Transport in Grid-Scale Equations, J. Atmos. Sci., 64, 4127–4139, https://doi.org/10.1175/2007JAS2144.1, 2007. a
Resteghini, L., Capsoni, C., Nebuloni, R., Gabellini, P., Maggio, F., Martellucci, A., and Rinous, P.: Effect of non-ideal components on the performance of a reconfigurable on-board antenna for broadcasting applications, in: 2012 6th European Conference on Antennas and Propagation (EUCAP), 1487–1490, https://doi.org/10.1109/EuCAP.2012.6206205, 2012. a
Theis, S. E., Hense, A., and Damrath, U.: Probabilistic precipitation forecasts from a deterministic model: a pragmatic approach, Meteorol. Appl., 12, 257–268, https://doi.org/10.1017/S1350482705001763, 2005. a
Watson, M., Luby, M., and Vicisano, L.: Forward Error Correction (FEC) Building Block, RFC, 3452, 1–16, 2002. a
Zhu, P., Tong, W., and Royer, C. C.: Adaptive coding and modulation, uS Patent 7.043.210, 2006. a
Ziemer, R. E. and Peterson, R. L.: Introduction to digital communication, Vol. 2, Prentice Hall Upper Saddle River, NJ, 2001. a
Zweig, M. H. and Campbell, G.: Receiver-operating characteristic (ROC) plots: a fundamental evaluation tool in clinical medicine, Clin. Chem., 39, 561–577, 1993. a