the Creative Commons Attribution 4.0 License.
the Creative Commons Attribution 4.0 License.
Indirect seismic economic loss assessment and recovery evaluation using nighttime light images – application for Wenchuan earthquake
Jianfei Wang
Jingfa Zhang
Lixia Gong
Qiang Li
Dan Zhou
Indirect seismic economic loss not only impacts regional economic recovery policies but is also related to economic assistance at the national level. Due to cross-regional economic activities and the difficulty of obtaining data, it is difficult for the indirect economic loss survey to cover all economic activities. However, nighttime light in an area can reflect the economic activity of the region. This article focuses on the indirect economic losses caused by the 2008 Wenchuan earthquake and evaluation of the progress of restoration and reconstruction based on nighttime light images. First, the functional relationship between GDP and nighttime light parameters is established based on pre-earthquake data. Next, the indirect loss of the earthquake is evaluated by the nighttime light attenuation in the disaster area after the earthquake. Then, the capacity recovery, which is characterized by the brightness recovery process of the light area, is evaluated. Lastly, the process of light expansion in the disaster area is analyzed to evaluate the speed and efficiency of economic expansion.
- Article
(15686 KB) - Full-text XML
- BibTeX
- EndNote
Following the accelerated pace of global economic integration and the rapid growth of population and social wealth, the large damage caused by earthquake disasters is characterized by far-reaching effects and long recovery periods (Pielke et al., 2008). Economic recovery and reconstruction are important targets for post-earthquake economic policies (Lyles et al., 2014). However, due to the lack of detailed post-disaster economic recovery tracking data, economic policy planning is divided based on the amount of direct economic losses, which results in insufficient policy sustainability (Song et al., 2017). When planning the allocation of post-disaster aid funds and medium- and long-term economic policies, decision makers mainly rely on the current market value of production data in the disaster area and the reconstruction cost of the production environment. Insufficient estimates of indirect losses are likely to result in gaps between aid funds and actual demand, even overlooking relatively remote disaster areas (Ge et al., 2010). Therefore, it is important for post-disaster macroeconomic policies to insure that indirect economic losses and economic recovery in the affected areas are accurately assessed.
The 2008 Wenchuan earthquake (Ms=8.0) is the biggest earthquake event in China since the 1970s. This earthquake struck Sichuan Province, China, on 12 May 2008. It killed nearly 70 000 people, 18 000 people were missing, and more than 370 000 people were injured. Millions of people lost their homes to the quake, the cost of which was estimated at USD 86 billion (Kenneth and John, 2018). In the 3 years after the disaster, the Chinese government spent CNY 865.8 billion to complete 29 692 aid projects (Gu, 2018).
There is much research about the recovery of the disaster area after the Wenchuan earthquake, which can be generally classified into three categories. Firstly, research focused on the assessment of vegetation and environmental carrying capacity in the disaster area. For instance, Zhao et al. (2009) evaluated soil loss after the Wenchuan earthquake and converted the losses into monetary values based on environmental economics principles. Zhao et al. (2014) and Yang et al. (2018) assessed the restoration of vegetation in the areas affected by the Wenchuan earthquake by comparing remote-sensing data with GVG (GPS; video and geographic information system, GIS) agricultural sampling data. Secondly, research concentrated on the evaluation of the disaster area macroeconomic losses. For example, Zhu et al. (2018) assessed the seismic economic losses based on the GDP (gross domestic product) growth model, and Wu et al. (2012) considered the impact on activities within the economic activity system after the earthquake and then assessed the indirect economic losses of the Wenchuan earthquake using the adaptive regional input–output model (ARIO). The third is the assessment of post-disaster community and social resilience. Liu et al. (2018) assessed the restoration of buildings and infrastructure in the Wenchuan disaster area using remote-sensing and actual interview data, and Lin et al. (2017) assessed the perception of recovery of the Wenchuan-earthquake-affected area using house recovery condition, family recovery power and reconstruction investment based on a structural equation model. Current post-disaster economic monitoring is mainly based on manual surveys and regional statistical data, which are inefficient and have a large spatial scale, while remote sensing and GIS have significant advantages in the fineness of measurements and spatial distribution of post-disaster loss and recovery assessments.
Because of the obvious advantages of periodic economic monitoring (Zhou et al., 2015; Li et al.,2017; Tan,2017), nighttime light has been widely recognized in the field of regional economic monitoring (Li and Li, 2015; Fu et al., 2017). The application of nighttime light in earthquake disasters is mainly divided into two parts. In the first part, nighttime light can be used to identify earthquake-affected areas and to assess disaster losses. The nighttime light was first applied to identify earthquake-affected areas in the 1999 Marmara earthquake. Hashitera et al. (1999) evaluated the impact of earthquakes in the disaster area based on a series of DMSP Operational Linescan System (OLS) data, which contain pre-earthquake and post-earthquake nighttime light images. Fan et al. (2018) determined the disaster level and area of the disaster based on the brightness changes of VIIR nighttime light images from 3 months before the earthquake to 3 months after the earthquake in the disaster area. Kohiyama et al. (2004) developed the Early Damaged Area Estimation System (EDES) disaster-stricken area determination system, which is based on the DMSP OLS nighttime light images, to delineate the earthquake-affected areas quickly within 24 h after the disaster. In the second part, nighttime light can be used for post-disaster economic recovery monitoring. Zhang (2018) focused on the relationship between nighttime light and the number of deaths, missing persons, and building collapse rates in the earthquake-affected areas of the Wenchuan earthquake in 2003–2013. Gillespie et al. (2014) tracked the changes of nighttime light from 2004 to 2008 and then studied the relationship between the brightness changes and some indicators such as per capita consumption, energy consumption and economic recovery capacity at the community level, thus evaluating the recovery after earthquake in Indonesia. Andersson et al. (2015) evaluated the recovery of post-disaster economic activity in southern Thailand by monitoring the recovery of nighttime light in Southeast Asia from 2005 to 2006. The School of Economics and Finance (2018) also assessed the long-term economic impact of the New Zealand earthquake based on the changes of nighttime light intensity. It has been widely proven that there is a close relationship between nighttime light and economic activity in the disaster area. We believe that the changes of nighttime light after an earthquake can reflect the earthquake production capacity of the disaster area and can therefore be used for indirect seismic economic loss assessment.
In terms of recovery and reconstruction, it is very important to understand the indirect economic loss and recovery assessment of the Wenchuan Ms=8.0 earthquake, which is a significant earthquake in recent years. This study chose Sichuan Province as the research area. In order to avoid the impact of the 2013 Lushan earthquake, this paper focuses on the indirect economic impact of the Wenchuan earthquake on Sichuan Province from 2008 to 2012.
2.1 Data sources
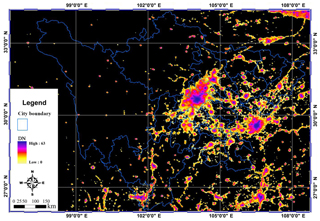
The GDP data were obtained from the Sichuan Provincial Bureau of Statistics (http://www.sc.stats.gov.cn/, last access: November 2018), which publishes the Sichuan Statistical Yearbook every year. The nighttime light obtained from the National Oceanic and Atmospheric Administration (NOAA, http://www.noaa.gov, last access: November 2018) and the nighttime light images (Fig. 1) obtained with the OLS of the Defense Meteorological Satellite Program (DMSP) from 2000 to 2012 were used in this study. The satellite altitude of DMSP is approximately 830 km, its swath is 3000 km, and its revisit cycle is approximately 101 min, and the satellite can orbit the earth 14 times per day and obtain four global coverage maps. DMSP OLS can be used to detect city lighting, auroras, lightning, fishing, fire, etc. The NOAA provides three types of nighttime light data. “cf_cvg” is the total amount of brightness observation under cloud-free conditions, “avg_vis” is the average observed brightness under cloud-free conditions and “stable_lights.avg_vis” is the average brightness of stable light sources under cloud-free conditions. This paper selected the average brightness of stable light sources under cloud-free conditions.
2.2 Radiation correction
The DMSP OLS nighttime light images during 2000–2012 came from the F15, F16 and F18 satellites. Due to the differences in satellite and other imaging conditions, radiation correction is required before quantification of nighttime light images of different times.
This paper used the invariant region method proposed by Cao et al. (2015), who give the logistic radiation correction model of the Chinese region's nighttime light image. All images were calculated following Eq. (1):
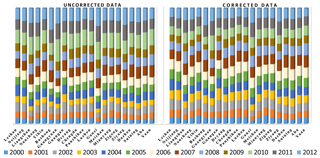
where DNcal is the corrected image value, DN is the original image value to be corrected, and a and b represent two different constants. The correction effect is shown in Fig. 2.
The radiation correction greatly increases the smoothness from 2003 to 2004 and from 2010 to 2011; this indicates that the radiation correction is very effective.
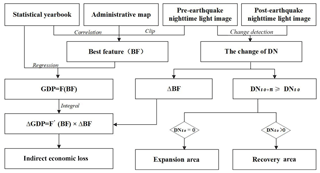
The seismic direct economic loss refers to the damage to existing production materials and the environment by the earthquake, which mainly reflects the impact of earthquake disasters on economic stock. However, the indirect seismic economic loss is a systematic manifestation of losses in the chain of economic activities, which focuses on the far-reaching impact of disasters on economic flows. On the one hand, there are many studies that show that nighttime light can be used as a proxy for economic activity. Chen and Nordhaus (2011) have proven nighttime luminosity could be used to improve estimates of output at the regional level, Bruederle and Hodler (2018) conclude that nighttime lights are a good proxy for human development at the local level and Ma et al. (2014) proved that nightlight data could be indicative of demographic and socioeconomic dynamics in China's cities. Therefore, this paper proves that the changes in post-earthquake nighttime light can reflect changes in the regional economic system. On the other hand, in order to ensure the fairness of disaster relief assistance, the government should avoid the problem of the benefits of developed regions covering up the economic difficulties of less developed regions by using the transfer payment system. This paper defines light recovery and lighting expansion in the disaster area as two different processes. The economic recovery evaluation model only compares increasing light intensity of the disaster area with light before the earthquake. The economic expansion evaluation model only considers increasing light intensity of the disaster area without light before the earthquake. The technical flowchart is shown in Fig. 3.
Firstly, the pre-earthquake earthlight image is clipped according to the administrative areas, counting the DN-related parameters in each administrative area, and then its correlation with GDP is analyzed, and the parameter with the highest correlation is selected as the BF (best feature). Secondly, we establish the function of BF and GDP, differentiate the function, and then obtain the function of ΔBF (the change of BF) and ΔGDP (the change of GDP). Thirdly, we compared pre-earthquake and post-earthquake nighttime light image and counted the ΔDN (the change of DN) in each administrative area. The indirect economic losses are evaluated by the function of step 2. Lastly, the areas where the post-earthquake DN is higher than the pre-earthquake DN are extracted. The expansion areas are where the pre-earthquake DN is equal to 0, and the recovery areas are where the pre-earthquake DN is higher than 0.
3.1 Indirect seismic economic loss assessment model
The pre-earthquake nighttime light images were clipped according to the administrative divisions of Sichuan Province; then the statistics of every administrative district's DN parameters, which include night lighting area, total brightness of light, average brightness of lighting area, and average brightness of administrative area, were collected. Through the correlation analysis of characteristic parameters and GDP, the most relevant characteristic parameter, which was defined as the parameter BF, was extracted. This established the function F(BF) as Eq. (2):
where GDP is the gross domestic product of each pre-earthquake administrative region, and BF is the most relevant parameter. It is assumed that the productivity conversion efficiency, which can be regarded as the integral function of F(BF), is relatively close in adjacent areas. Therefore, the integral function of F(BF) can be used to calculate the GDP changes caused by the change of the annual total lights in each administrative district. It can be expressed as Eq. (3):
3.2 Economic recovery evaluation model
It is easy to ignore those areas with weak economic foundations, but it may make reconstruction funds concentrated in the areas with higher economic levels. However, this approach is not in line with the principle of fairness in disaster assistance. It is assumed that the nighttime light of the human activity area will not disappear under normal conditions, and the pixel whose DN value decreases after an earthquake is the area to be restored. When the brightness of the pixel reaches the level of before the earthquake, it can be assumed that the economic level of the area has recovered. The earthquake disaster economic recovery assessment model is as in Eqs. (4) and (5):
where ARm is the proportion of the cumulative recovery area in m years after the earthquake, YRn is the proportion of recovery area in the nth year after the earthquake, Rn is the matrix of recovery area in the nth year after the earthquake, is the damaged area, i is the rows of a matrix, and j is the column of the matrix. Therefore, Rn and are Boolean matrices and can be calculated following Eqs. (6) and Eq. (7):
The in Eq. (6) refers to the value of the ith row and jth column in PRt_0(i,j). DN is the pre-earthquake nighttime light. In this paper, the value of t0 is 2007, and DN is the value of the nighttime light image. Rn(i,j) in Eq. (7) refers to the value of the ith row and jth column in Rn, DN is the nighttime light in the nth year after the earthquake, and the symbol * indicates that the corresponding elements in the two matrices should be multiplied.
3.3 Economic expansion evaluation model
Economic expansion of the earthquake-affected areas in the post-earthquake period occurred in two ways. On the one hand, the earthquake destroyed the inefficient industrial structure and a more advanced scientific industrial structure was built in its place, which has led to the expansion of the regional economy. The Overall Plan for Wenchuan Earthquake Recovery and Reconstruction formulated by the Chinese government requires that disaster reconstruction should focus on technological innovation, it should promote structural adjustment and transformation of development modes, and it should improve the self-development capacity of stricken areas. On the other hand, the needs of recovery and reconstruction expanded the market for many industries. According to the Statistics Bureau of Sichuan Province, the GDP of nine stricken counties in 2014 (CNY 52.12 billion) reached 2.32 times that of 2008 (CNY 22.47 billion). This paper evaluated the economic expansion post-earthquake based on the new nighttime light area. The evaluation model is as in Eqs. (8) and (9):
YEn is the nighttime light growth matrix in the nth year after the earthquake, is the non-light area in the (n−1)th year after the earthquake, DNn is the value of nighttime light in the nth year after the earthquake, DNn−1 is the value of nighttime light in the (n−1)th year after the earthquake, and AEm is total light expansion in m years after the earthquake.
4.1 Indirect economic loss of Wenchuan earthquake
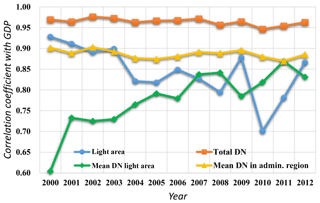
The total pre-earthquake DN of Sichuan is the best parameter to establish a regression model with GDP. Firstly, the correlation between the total GDP and the DN-related parameters, which include the lighting area, total DN, mean DN in light area, and mean DN in the administrative region of Sichuan, was analyzed (Fig. 4). On the one hand, the light area and the mean DN in the light area have an unstable correlation curve with GDP. During the post-earthquake period, the correlation between light area and GDP decreased, while the correlation between the mean DN in the light area and GDP increased. On the other hand, the total DN and the mean DN in the administrative region has a stable correlation curve with GDP, and the total DN have a higher correlation with GDP than the mean DN in the administrative region. It is obvious that the correlation coefficient between the total DN and the GDP is the highest, which is basically greater than 0.95 in each year. Therefore, the total brightness is selected as the DN parameter. Secondly, the largest value of Chengdu was removed from the sample. Then, the scatter plots of the two sets of data samples were compared (Fig. 5), the blue point shows the pre-earthquake relationship between the total DN and GDP, and the orange point shows the post-earthquake relationship. It shows that the pre-earthquake relationship between the two parameters is strong and the post-earthquake relationship between the two parameters is poor.
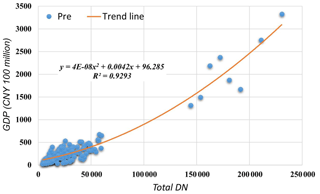
Third, we established a regression function of GDP and total brightness (Fig. 6), which is Eq. (10):
The DN in Eq. (10) is the total DN in the administrative region. Equation (10) is differentiated based on Eq. (3); then the economic losses can be expressed as Eq. (11):
The total DN of each administrative area after Wenchuan earthquake is shown in Table 1. Then the indirect economic losses of Sichuan Province after the Wenchuan earthquake are assessed using Eq. (11); the loss is shown in Table 2.
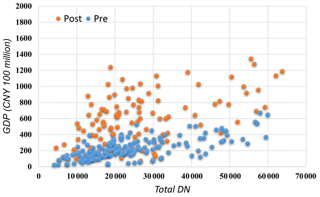
Figure 5DN–GDP scatter plots of before and after the earthquake in Sichuan (maxima have been excluded).
4.2 Economic recovery progress in Sichuan Province
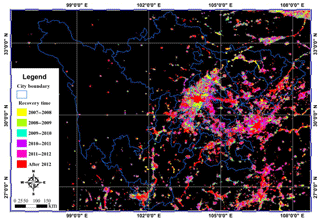
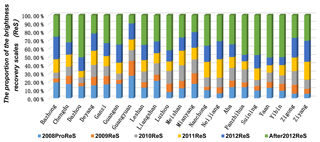
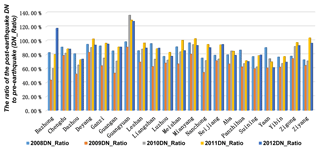
The brightness of the nighttime light image of 2007 is used as a reference; when the brightness returns to the 2007 level of brightness, the area is considered to be economically recovered (Fig. 7). Yellow represents the area that recovered to the pre-earthquake level during the first year, green stands for the area that recovered to the pre-earthquake level during the second year, cyan represents the area that recovered to the pre-earthquake level during the third year, purple represents the area that recovered to the pre-earthquake level during the fourth year, fuchsia represents the area that recovering to the pre-earthquake level during the fifth year and red represents the area that has not yet recovered even in the fifth year. On the one hand, the post-earthquake annual economic recovery areas were assessed (Fig. 8) based on the proportion of the brightness recovery scales. The recovery area in Zhangzhou, Nanchong, Neijiang, Suining, Yibin, Zigong and Ziyang was small in 2008 but grew quickly in the next years. By contrast, the recovery area in other cities was larger in 2008 but grew slowly over the next years. While the recovery areas were about 60 %–70 % of stricken areas, they were still not fully recovered in 5 years. On the other hand, the economic recovery was evaluated by the ratio of post-earthquake DN to pre-earthquake (DN_ratio) (Fig. 9). The economy in most of the recovery areas showed a significant retreat in 2009, and except for Dazhou, Zhangzhou, Aba, Panzhihua, Suining, Ya'an and Yibin, the other cities' economies were restored to 80 % in 2012. In summary, our results indicate that the economic recovery in Sichuan Province will take more than 5 years, which is far more than the time spent on reconstruction (Yang, 2018).
4.3 Expansion of new economic zone
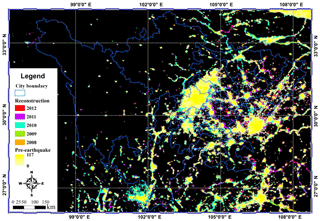
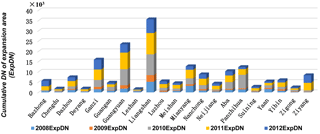
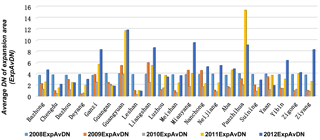
The nighttime light image of 2007 was defined as the reference to assess the expansion of the new economic zone (Fig. 10). Yellow represents the area that was covered by nighttime light before the earthquake, orange represents the expansion area of nighttime light in 2008, green represents the expansion area of nighttime light in 2009, cyan represents the expansion area of nighttime light in 2010, purple represents the expansion area of nighttime light in 2011 and red represents the expansion area of nighttime light in 2012. First, the ExpDN (cumulative DN of expansion area) was used to measure the cumulative capacity of the new economic zone after the earthquake (Fig. 11); this shows that the cumulative capacity of cities is extremely uneven. The new economic area of Liangshan, Guangyuan and Ganzi had a relatively high cumulative capacity, while other cities had a relatively low capacity. The cumulative capacity of all new economic zones increased significantly in 2010 and 2011, but it has declined since 2012. Second, the ExpAvDN (average DN of expansion area) was used to measure the capacity utilization of the new economic zone (Fig. 12). The higher the ExpAvDN, the higher the annual average economic output in the region, which is also called capacity utilization. It is obvious that the capacity utilization of cities in 2008 is similar. The capacity utilization of Ganzi, Guangyuan, Liangshan, Mianyang and Nanchong increased and that of the other regions declined in 2009. Most regions' capacity utilization increased again in 2011, and the capacity utilization of Ganzi, Guangyuan, Liangshan, Panzhihua and Ziyang was relatively high in 2012. In summary, the new economic zones in the south and east, which have a high cumulative capacity, declined significantly in 2010 and then grew rapidly.
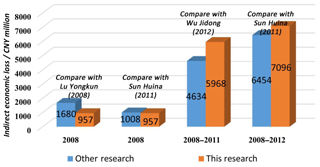
Compared with statistical data, nighttime light can not only reflect the spatial difference of economic expansion and recovery but also guarantee the accuracy of assessment. In terms of short-term economic loss, the economic loss of this model in 2008 is CNY 95.7 billion, which is closer to the results of Sun (2011) (CNY 100.8 billion) but lower than the results of Lu et al. (2008) (CNY 168 billion). The reason why this difference exists is that although these models take into account the capacity reduction caused by earthquakes, the model of Lu et al. (2008) assumed that the affected department was completely shut down during a period of time, while this paper's model and that of Sun (2011) assumed that the production capacity was gradually restored. In terms of mid- to long-term economic loss, the economic loss of this model from 2008 to 2011 is CNY 596.8 billion, which is more than the results of Wu et al. (2012) (CNY 463.4 billion), and the economic loss of this model from 2008 to 2012 is CNY 709.6 billion, which is closer to the results of Sun (2011) (CNY 645.4 billion). The reason for this difference is that although both models measured the impact of input changes on output after the earthquake, the ARIO model of Wu et al. (2012) and the Harrod–Domar model of Sun (2011) predicted the output based on government public expenditure, while this paper's model measured the output based on the total investment in society, which could be reflected by nighttime lights. Generally, the indirect economic loss assessments in this paper are close to most of the evaluation results in other papers (Fig. 13).
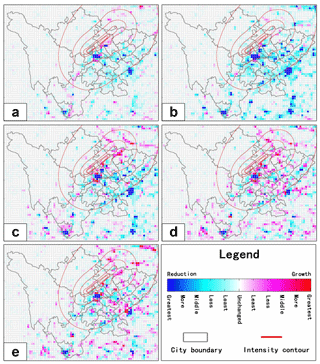
Figure 14The economic change path in the disaster area: (a) the path of 2008, (b) the path of 2009, (c) the path of 2010, (d) the path of 2011, (e) the path of 2012.
The quantitative relationship between nighttime light and economic statistics in the post-earthquake years is abnormal. It is the result of the joint action of economic suppression, which was caused by the earthquake damage, economic promotion and the reconstruction of the disaster area. The reasons for the economic shocks in earthquake-stricken areas are twofold. On the one hand, due to the bullwhip effect of disasters, the main impact of direct losses on the industrial chain will take longer to show up. Due to the suppression caused by the earthquake, the purchasing power of the victims was reduced. In order to reduce losses, suppliers should try reducing inventory as possible. Further, when suppliers were also affected by earthquake, they tended to adopt conservative strategies, and the reduction was magnified. It takes 1 year for the changing information about supply and demand to be transmitted to the economic system. Then, the gap was magnified and caused a turbulent change in the indirect economic loss in the next years. This explains why the economic recovery shows a significant decline in 2009. On the other hand, relief and reconstruction stimulates the market in the disaster area. With the end of the relief activities, the market development of the disaster area will fall to a certain extent. Lots of new economic zones developed significantly in 2010. The areas with rapid economic expansion are mainly distributed in the western Sichuan eco-economic zone, the northeast economic zone, and the Panxi economic zone. The pillar industries in these regions are mainly tourism, building materials and energy. The policy of reconstruction in 2008–2010 developed these industries in the short term. Then, the faster regions gradually declined in 2012, which may be the result of the post-disaster recovery policy. China's reconstruction policy was basically finished (Gu, 2018) in 2010, and the demand for construction, energy and other industries was reduced. Therefore, the production capacity of the new economic zone in Guangyuan, Liangshan and Panzhihua began to reduce after 2011.
The path of economic change in the disaster area after the earthquake gradually spread from the northeast to the southeast (Fig. 14). The economy level for 5 years after the earthquake in the disaster area (2008–2012) was compared to the level of 2007. We found that in the first year (Fig. 14a), the economic decline is mainly concentrated in the disaster area, and the city's economic decline is serious. In the second year (Fig. 14b), the economic slowdown area began to spread to some major cities in the southeast of the disaster area. It was not until the third year (Fig. 14c) that the disaster area began to recover, and the earliest recovery area was not the area where the economy was reduced seriously after the disaster but rather some cities located near these areas in the northeast. Recovery gradually spread from north to south during 2010–2012 (Fig. 14c–e). Eventually, some cities were developed farther outside the disaster area (Fig. 14e). This explains the path of the Chinese government's aid funds from the north to the southwest and its radiation effects on the surrounding areas.
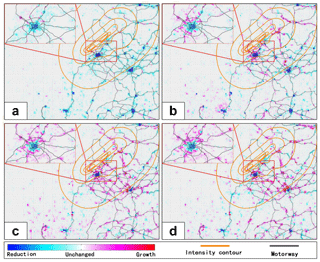
Figure 15Economic recovery process in the disaster area: (a) economic recovery area in 2009, (b) economic recovery area in 2010, (c) economic recovery area in 2011, (d) economic recovery area in 2012.
The area along the road or around the city began to recover first (Fig. 15). Previous analysis had proved that the economic recovery in the disaster area began around 2010. Therefore, the process of economic recovery can be studied by comparing the economic level of the disaster area from 2009 to 2012 with the level of 2008. In 2009 (Fig. 15a), except for a few areas along several roads close to the disaster area, there was only small economic growth elsewhere. However, in 2010 (Fig. 15b), the economy of the areas along most roads showed significant growth, and the surrounding areas of cities, which were seriously affected by the earthquake, showed an increasing trend. By 2011 (Fig. 15c), the trend in economic growth in the disaster areas had spread to neighboring cities, and the urban economy had also begun to recover from the periphery to the center. As of 2012 (Fig. 15d), the economy of the disaster area showed an interesting development pattern. On the one hand, there were few recovery areas in the urban economy with severe recession; on the other hand, significant growth was shown in the surrounding areas. This phenomenon is helpful for us to distinguish the industrial layout of the disaster-stricken areas after the disaster. Secondary industries such as construction and manufacturing took a dominant place in the economically active areas after the earthquake, while tertiary such as service and entertainment industry took a dominant place in the slowly recovering areas.
Due to the uneven distribution of aid funds and the adjustment of regional development strategies, the model of economic recovery and expansion differed from those before the earthquake in the study area. Using the nighttime light data of DMSP OLS, indirect economic losses within 5 years after the Wenchuan earthquake were evaluated. Then the economic recovery progress of Sichuan Province was evaluated. The results are shown as follows.
-
The GDP has a quadratic function relationship with the total nighttime lights under normal conditions, and the indirect economic loss obtained with the function is consistent with the results obtained using economic statistical methods.
-
The path of economic change in the disaster area after the earthquake gradually spread from the northeast to the southeast; meanwhile, it takes 1–2 years to show the main impact of the earthquake on the economic system. Therefore, the economy of the disaster area after the earthquake was unstable and turbulent. Tourism, building materials and the energy industry experienced a short-lived expansion after the earthquake and then a significant decline in the 3–4 years following the disaster.
-
The economy of the areas along the road or around the city recovered first, and the economic recovery time was longer than the planned 5 years. Compared with the new economic zone, the capacity recovery of the earthquake site is slower. The recovery area is only approximately 60 % of affected areas, and the production capacity can be restored to approximately 80 % in 5 years.
In summary, nighttime light has significant advantages in long-term economic monitoring in earthquake-stricken areas. Nighttime light shows the geographical differences in economic development and growth mode in earthquake-stricken areas, and it also provides the basis for macro-control of earthquake recovery and reconstruction.
The GDP data were obtained from Sichuan Provincial Bureau of Statistics (http://www.sc.stats.gov.cn/tjcbw/tjnj/, Sichuan provincial bureau of statistics, 2018). The nighttime light obtained from the National Oceanic and Atmospheric Administration (https://ngdc.noaa.gov/eog/dmsp/downloadV4composites.html, National oceanic and atmospheric administration, 2018).
JW designed the general idea and wrote the text content, JZ was the technical director in chief, LG completed radiometric correction of the nighttime light images, QL analyzed the economic data of the disaster area, and DZ collected the economic data of the disaster area. All authors discussed the editors' opinions and revised the paper.
The authors declare that they have no conflict of interest.
This work is supported by The Key Program of Institute of Crustal Dynamics,
China Earthquake Administration (ZDJ2017-29). We are also very grateful to
Ma Yannan of Xuchang University and Xie Quancai of the Institute of Engineering
Mechanics for revision of the article.
Edited by: Paola Reichenbach
Reviewed by: Magnus Andersson and one anonymous referee
Andersson, M., Hall, O., and Bustos, M. F. A.: Assessing Recovery from the 2004 Indian Ocean Tsunami: An Application of Night-time Light Data and Vegetation Index, Geogr. Res., 4, 436–450, 2015.
Bruederle, A. and Hodler, R.: Nighttime lights as a proxy for human development at the local level, PLoS ONE, 13, e0202231, https://doi.org/10.1371/journal.pone.0202231, 2018.
Cao, Z., Wu, Z., Kuang, Y., and Huang, N.: Correction of DMSP/OLS Night-time Light Images and Its Application in China, J. Geoinform. Sci., 9, 1092–1102, 2015.
Chen, X. and Nordhaus, W. D.: Using luminosity data as a proxy for economic statistics, P. Natl. Acad. Sci. USA, 108, 8589–8594, 2011.
Fan, X., Nie, G., Deng, Y., An, J., Zhou, J., and Li, H.: Rapid detection of earthquake damage areas using VIIRS nearly constant contrast night-time light data, Int. J. Remote Sens., 24, 1–24, https://doi.org/10.1080/01431161.2018.1460512, 2018.
Fu, H., Shao, Z., Fu, P., and Cheng, Q.: The Dynamic Analysis between Urban Nighttime Economy and Urbanization Using the DMSP/OLS Nighttime Light Data in China from 1992 to 2012, Remote Sensing, 9, 1–19, 2017.
Ge, Y., Gu, Y., and Deng, W.: Evaluating china's national post-disaster plans: The 2008 Wenchuan Earthquake's recovery and reconstruction planning, Int. J. Disaster Risk Sci., 1, 17–27, 2010.
Gillespie, T. W.,Frankenberg, E., Chum, K. F., and Thomas, D.: Nighttime lights time series of tsunami damage, recovery, and economic metrics in Sumatra, Indonesia, Remote Sens. Lett., 3, 286–294, 2014.
Gu, L. S.: Ten Years of Wenchuan Earthquake: China's “Reconstruction Better” Program [N], South review weekly, 13 May 2018.
Hashitera, S., Kohiyama, M., Maki, N., Hayashi, H., Matsuoka, M., and Fujita, H.: Use of DMSP-OLS Images for Early Identification of Impacted Areas Due to the 1999 Marmara Earthquake Disaster, Proceedings of the 20th Asian Conference on Remote Sensing, 2, 1291–1296, 1999.
Kenneth, P. and John, P. R.: Sichuan earthquake of 2008 [EB/OL], available at: https://www.britannica.com/event/Sichuan-earthquake-of-2008, last access: 10 September 2018.
Kohiyama, M., Hayashi, H., Maki, N., Higashida, M., Kroehl, H. W., Elvidge, C. D., and Hobson, V. R.: Early damaged area estimation system using DMSPOLS night-time imagery, Int. J. Remote Sens., 11, 2015–2036, 2004.
Li, D. and Li, X.: Overview on Data Mining of Nighttime Light Remote Sensing, Acta Geodaet. Cartogr. Sin., 6, 591–601, 2015.
Li, D., Yu, H., and Li, X.: The Spatial-Temporal Pattern Analysis of City Development in Countries along the Belt and Road Initiative Based on Nighttime Light Data, Geomatics and Information Science of Wuhan University, 6, 711–720,2017.
Lin, L., Wang, Y., and Liu, T.: Perception of recovery of households affected by 2008 Wenchuan earthquake: A structural equation model, PLoS ONE, 8, 1–16, 2017.
Liu, J., Lu, D., Wang, Y., and Shi, Z.: A measurement framework of community recovery to earthquake: a Wenchuan Earthquake case study Authors Authors and affiliations, J. Hous. Built Environ., 3, 1–16, 2018.
Lu, Y., Zhou, G., An, X., and Du, J.: Assessment of Indirect Economic Loss in Sichuan Caused by the Wenchuan Ms8.0 Earthquake, J. Seismol. Res., 31, 521–524, 2008.
Lyles, L. W., Berke, P., and Smith, G.: Do planners matter? Examining factors driving incorporation of land use approaches into hazard mitigation plans, J. Environ. Plan. Manage., 5, 792–811, 2014.
Ma, T., Zhou, C. H., Pei, T., Haynie, S., and Fan, J. F.: Responses of Suomi-NPP VIIRS-derived nighttime lights to socioeconomic activity in China's cities, Remote Sens. Lett., 5, 165–174, 2014.
National oceanic and atmospheric administration: Version 4 DMSP-OLS nighttime lights time series [EB/OL], available at: https://ngdc.noaa.gov/eog/dmsp/downloadV4composites.html, last access: 6 December 2018.
Pielke, R., Gratz, J., Landsea, C. W., Collins, D.,Saunders, M. A., and Musulin, R.: Normalized Hurricane Damage in the United States: 1900–2005, Nat. Hazards Rev., 1, 29–42, 2008.
School of Economics and Finance: Measuring the impact of insurance on urban recovery with light – The 2011 New Zealand earthquake [EB/OL], available at: http://www.victoria.ac.nz/sef/research/sef-working-papers, last access: 16 June 2018.
Sichuan provincial bureau of statistics: Statistical yearbook of Sichuan province [EB/OL], available at: http://www.sc.stats.gov.cn/tjcbw/tjnj/, last access: 6 December 2018.
Song, Y., Li, C., Olshansky, R., Zhang, Y., and Xiao, Y.: Arewe planning for sustainable disaster recovery? Evaluating recovery plans after the Wenchuan earthquake, J. Environ. Plan. Manage., 1, 1–25, 2017.
Sun, H.: Major Natural Disaster Statistics and Indirect Economic Loss Assessment: Based on the Study of Wenchuan Earthquake, Doctoral dissertation, Southwestern University of Finance and Economics, Chong Qing, 2011.
Tan, M.: An Intensity Gradient/Vegetation Fractional Coverage Approach to Mapping Urban Areas From DMSP/OLS Nighttime Light Data, IEEE J. Select. Top. Appl. Earth Obs. Remote Sens., 10, 95–103, 2017.
Wu, J., Li, N., Hallegatte, S., Shi, P., Hu, A., and Liu, X.: Regional indirect economic impact evaluation of the 2008 Wenchuan Earthquake, Environ. Earth Sci., 65, 161–172, 2012.
Yang, S. J.: The Basic Completion of Reconstruction Tasks [EB/OL], available at: http://www.gov.cn/jrzg/2010-10/25/content_1729845.htm, last access: 10 September 2018.
Yang, W., Qi, W., and Zhou, J.: Decreased post-seismic landslides linked to vegetation recovery after the 2008 Wenchuan earthquake, Ecol. Indicat., 89, 438–444, 2018.
Zhang, B.: Analysis of the Inter-annual Variation of Nighttime Lights in the Most Affected Area of Wenchuan Earthquake from 2003 to 2013, J. Catastrophol., 1, 12–18, 2018.
Zhao, D., Zhang, M., Yu, M.,Zeng, Y., and Wu, B.: Monitoring agriculture and forestry recovery after the Wenchuan Earthquake, J. Remote Sens., 4, 958–970, 2014.
Zhao, Q., Luo, M., Cao, S., and Liu, X.: Research on the Recovering Measures and Economic Loss Evaluation of Soil Erosion and Water Loss in Wenchuan-Earthquake-hit areas of Sichuan Province, J. Sichuan Univers., 3, 289–293, 2009.
Zhou, N., Hubacek, K., and Roberts, M.: Analysis of spatial patterns of urban growth across South Asia using DMSP-OLS nighttime lights data, Appl. Geogr., 63, 292–303, 2015.
Zhu, Y., Wang, Y., Liu, T., and Sui, Q.: Assessing macroeconomic recovery after a natural hazard based on ARIMA – a case study of the 2008 Wenchuan earthquake in China, Nat. Hazards, 91, 1025–1038, 2018.


