the Creative Commons Attribution 4.0 License.
the Creative Commons Attribution 4.0 License.
 | 03 Dec 2018
Numerical and remote techniques for operational beach management under storm group forcing
Verónica Morales-Márquez
Alejandro Orfila
Gonzalo Simarro
Lluís Gómez-Pujol
Amaya Álvarez-Ellacuría
Daniel Conti
Álvaro Galán
Andrés F. Osorio
Marta Marcos
The morphodynamic response of a microtidal beach under a storm group is analyzed, and the effects of each individual event are inferred from a numerical model, in situ measurements and video imaging. The combination of these approaches represents a multiplatform tool for beach management, especially during adverse conditions. Here, the morphodynamic response is examined during a period with a group of three storms. The first storm, with moderate conditions (Hs∼1 m during 6 h), eroded the aerial beach and generated a submerged sandbar in the breaking zone. The bar was further directed offshore during the more energetic second event (Hs=3.5 m and 53 h). The third storm, similar to the first one, hardly affected the beach morphology, which stresses the importance of the beach configuration previous to a storm. The volume of sand mobilized during the storm group is around 17.65 m3 m−1. During the following months, which are characterized by mild wave conditions, the aerial beach recovered half of the volume of sand that is transported offshore during the storm group (). The analysis of beach evolution shows two different characteristic timescales for the erosion and recovery processes associated with the storm and mild conditions, respectively. In addition, the response depends largely on the previous beach morphological state. The work also stresses the importance of using different tools (video monitoring, modeling, and field campaign) to analyze beach morphodynamics.
- Article
(6508 KB) - Full-text XML
- BibTeX
- EndNote


Evolution of sandy coasts at temporal scales (from minutes to years) has been a topic of wide interest over the past decades since sandy beaches and dune systems are the first natural lines of coastal defense against flooding and erosion hazards (Callaghan and Roshanka, 2009; Hallegatte et al., 2013) while at the same time being attractive environments in terms of leisure activities and tourism economy (Bosello et al., 2012; Jiménez et al., 2011; Luijendijk et al., 2018). The maintenance of these areas is crucial for coastal defense and, at the same time, coastal tourism seems to be one main target for beach erosion management (Semeoshenkova and Newton, 2015). For instance, in Spain, beaches represent only 0.01 % of the land surface, producing up to 10 % of its gross domestic product (Yepes and Medina., 2005). Beach management tends to be reactive rather than proactive, solving the problems as they appear and without long-term planning.
Mitigation of coastal erosion and preservation of coastal areas represent essential aspects of the Protocol on Integrated Coastal Zone Management in the Mediterranean and are included in the objectives of most countries' national regulations and policies in Europe (Semeoshenkova and Newton, 2015). It is already known that decisions concerning coastal management actions should be made using the best available science, and new tools that take into account physical, natural and socioeconomic characteristics of beaches should be developed (Ariza, 2010; Tintoré et al., 2009). This makes it necessary to transfer the knowledge from scientists to managers in an effective way, which is a challenge today.
For coastal management it is crucial to have continuous measurements of waves and shoreline (Ferreira et al., 2017). One of the main issues in coastal erosion is the response of coastlines to both individual storms and storm groups since the behaviors are quite different (i.e., Loureiro et al., 2012; Vousdoukas et al., 2012; Houser, 2013; Coco et al., 2014; Masselink and van Heteren, 2014; Senechal et al., 2015; Masselink et al., 2016). Single storms can result in significant beach erosion within a few hours, whereas a sequence of storms can have a large and complex impact on beach morphology, the final effects of which remain difficult to quantify and to predict (Ferreira, 2005; Frazer et al., 2009).
Storm waves and their associated water-level conditions are key drivers in shoreline dynamics. Shoreline response to successive storms can be dependent on storm energy thresholds as well as on the feedback mechanisms associated with the beach morphology and the presence or absence of former impacts (Ciavola and Stive, 2012). There are many examples that have shown that shorelines can recover relatively well from erosion triggered by storms and that this recovery can be quick, from a few days or weeks (Birkemeier, 1979; Vousdoukas et al., 2012) to a couple of months (Wang et al., 2006). Therefore, the resilience of beaches, understood as their capacity to recover from a major storm, is related to the combination of sediment reservoirs, arrangement of three-dimensional beach morphology (i.e., sand bar type and location, beach slope) and the beach memory (Jara et al., 2015).
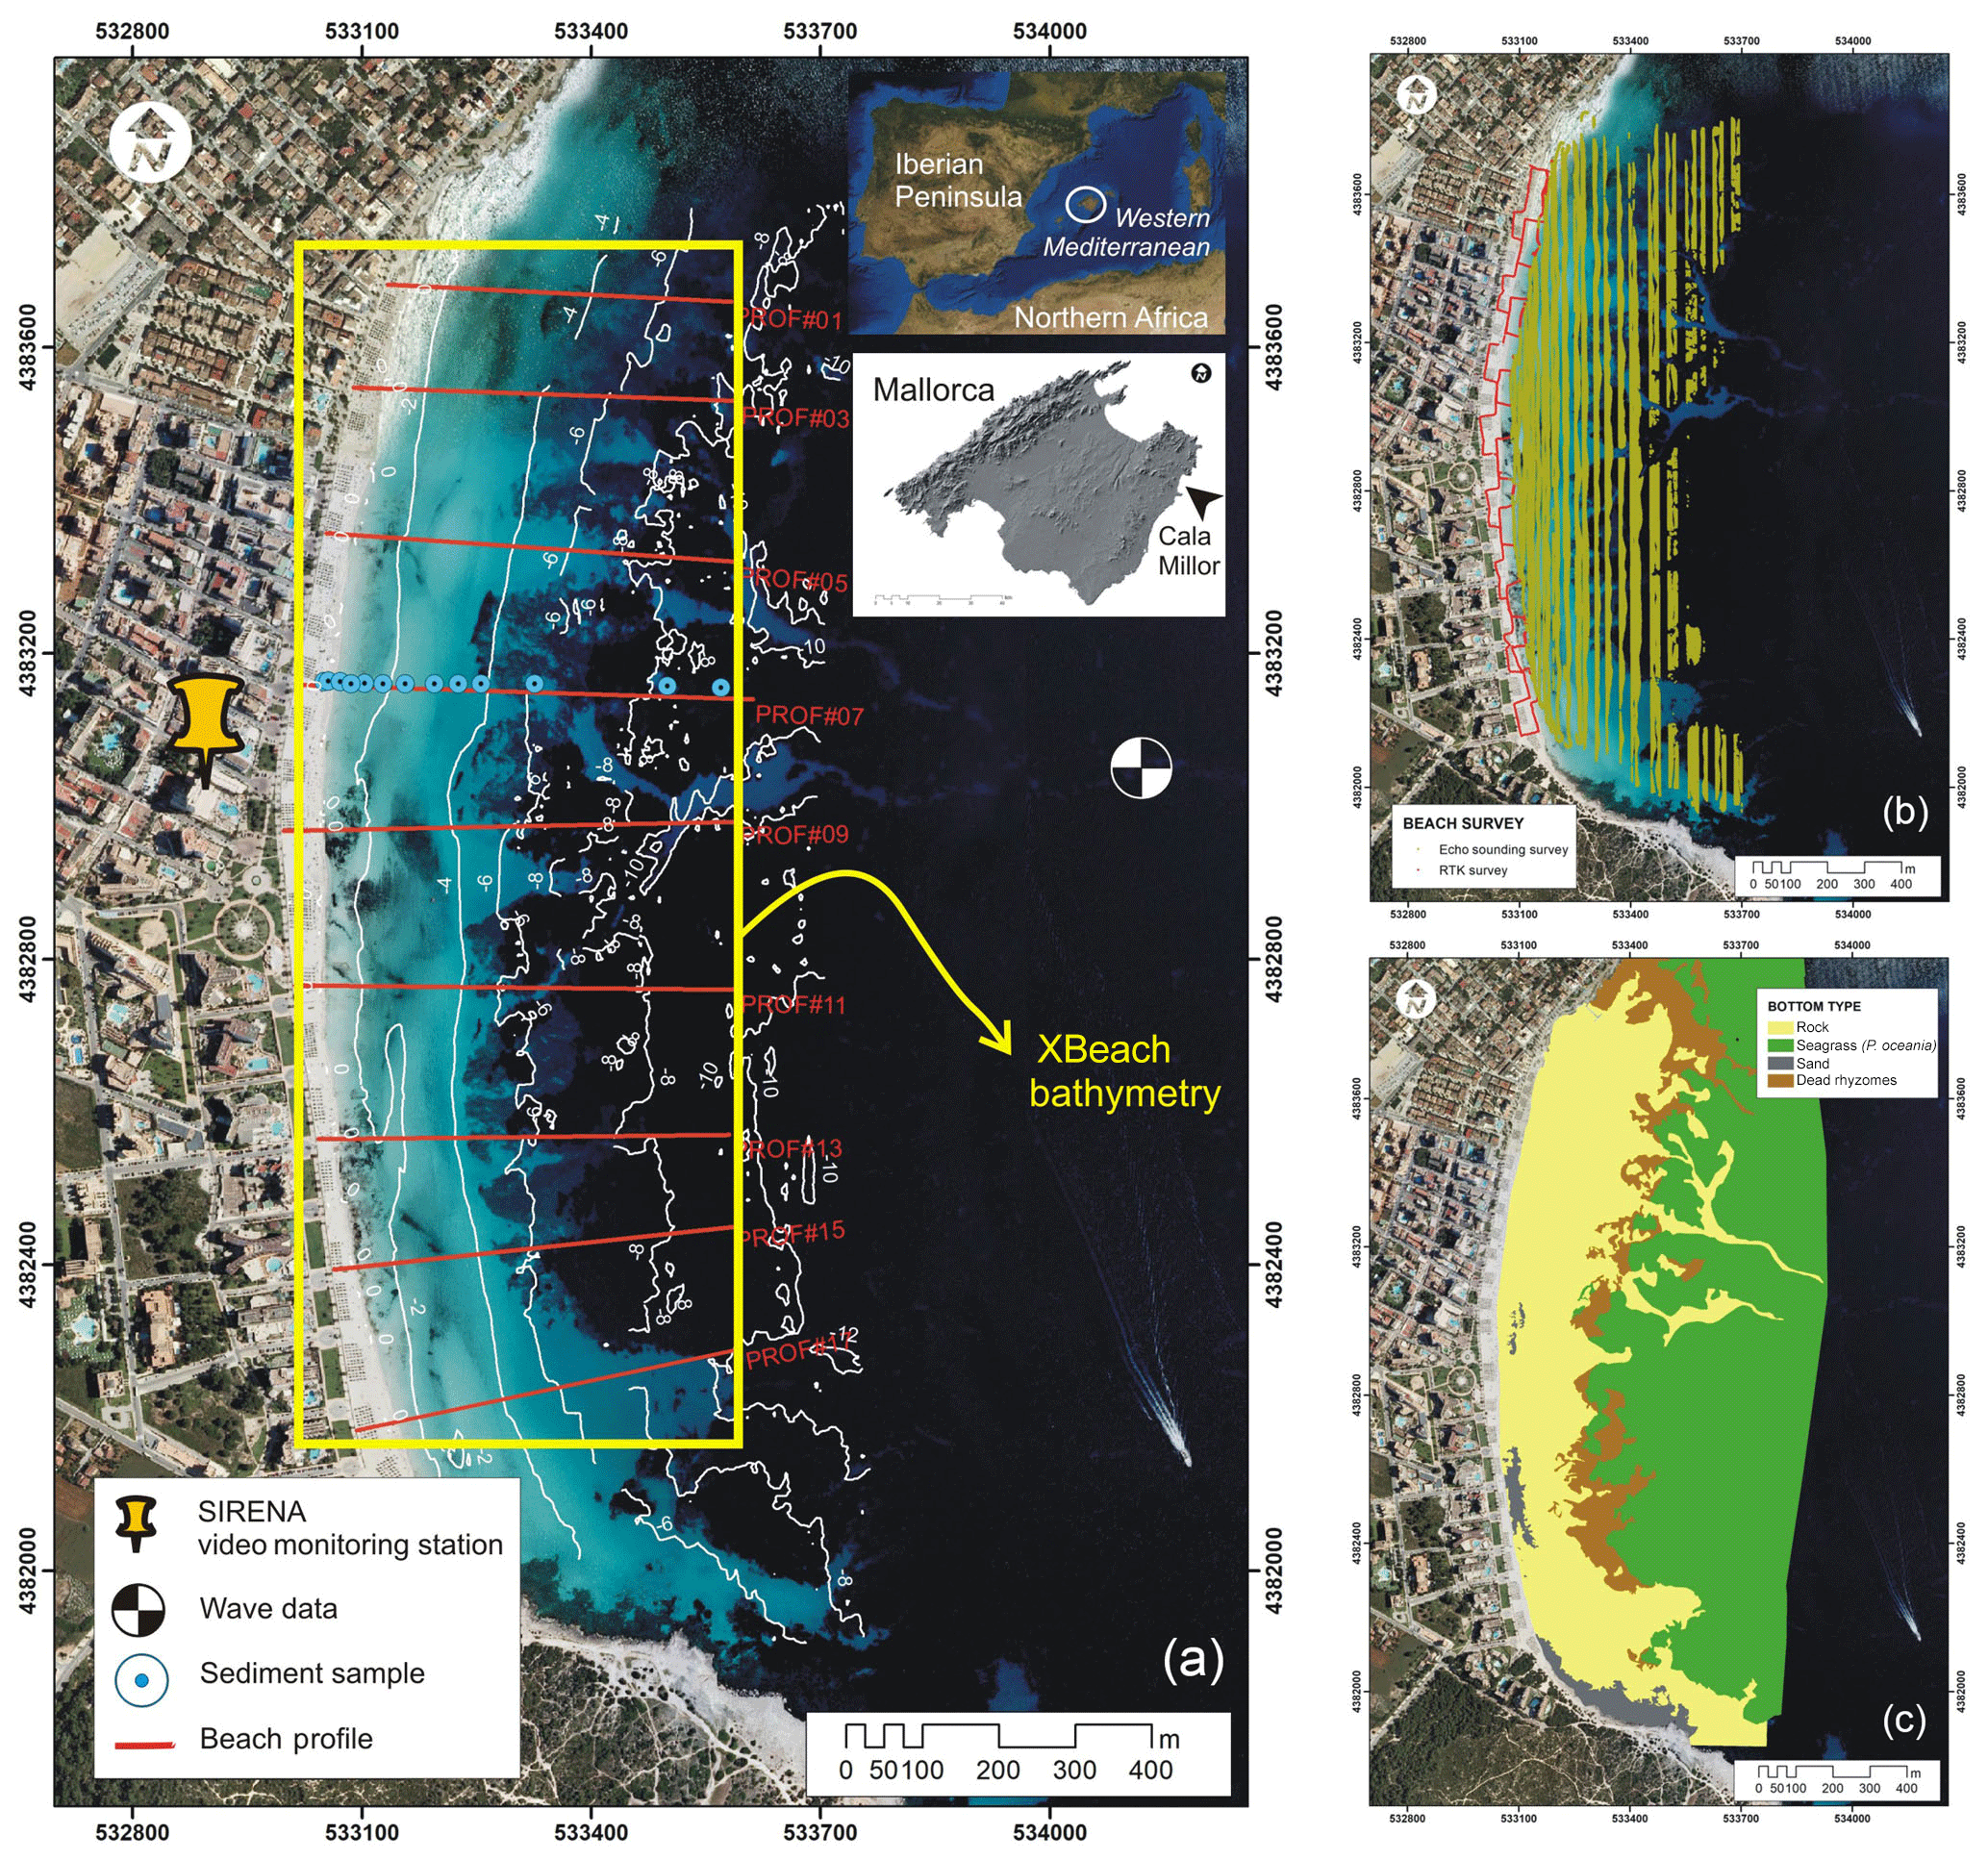
Figure 1Study site location (a) and major features of Cala Millor. (b, c) White dashed lines correspond to the bathymetric survey (isoline equal distance of 2 m); the yellow frame covers the bathymetry area obtained by means of XBeach, and red lines correspond to the beach profile described in text. The bottom orthophoto is provided by the Govern de les Illes Balears-SITIBSA (June 2008). Panel (b) shows the combination of multibeam bathymetric survey (green points) and RTK–GPS survey for dry beach and very shallow submerged beach (red points). (c) Bottom type at Cala Millor.
Recent works, such as the study by Vousdoukas et al. (2012), have shown that the observed morphological change during consecutive storms has a strong dependence on the initial beach morphology. These authors, departing from field experiments in southern Portugal, stated that beach recovery did not maintain pace with storm frequency and that storms can have a dramatic impact on erosion if they occur in groups. In addition, other works dealing with storm impact on shoreline dynamics in the Bay of Biscay (SE France) have suggested that energetic events are probably not the only drivers of erosion processes since significant beach erosion has been characterized under very calm conditions following energetic events (Senechal et al., 2015). In a similar way, observations from a detailed field campaign involving daily beach surveys at Truc Vert beach (Bordeaux, France) during a sequence of storms demonstrated that a sequence of extreme storms does not necessarily result in cumulative erosion, possibly because of the interplay among water levels, the angle of wave approach and the preexisting beach face conditions (Coco et al., 2014).
The goal of this contribution is to study the effect of a storm group on the morphology of a beach system and to advance a multiplatform methodology for effective decision-making regarding beach erosion management according to the available data and numerical models. Here, we present the explanation of temporal patterns of beach accretion and erosion under consecutive storm events at an intermediate microtidal carbonate beach by using the dataset available on the studied beach, high-frequency data on shoreline positions and cross-shore profiles extracted from coastal video monitoring techniques, real-time kinematic (RTK) and echo sounding surveys, concurrent hydrodynamic measurements, and the use of numerical models widely validated in order to fill gaps in the dataset.
Cala Millor is a semi-embayed beach 1.7 km in length and ranging between 15 and 30 m in beach width. It is located on the northeastern coast of Mallorca (western Mediterranean Sea, Fig. 1). Sediments are mainly composed of well-sorted medium to coarse biogenic carbonate sand with a grain diameter D50 between 0.3 and 0.6 mm changing along the cross-shore distance, according to the depth (Gómez-Pujol et al., 2011). The beach area is around 1.4 km2 with a bottom colonized by the endemic Posidonia oceanica meadow at depths from 6 to 35 m (Infantes et al., 2009). This meadow increases bottom roughness, reducing near-bed velocity and thus modifying the sediment transport (Infantes et al., 2009, 2012; Koch et al., 2007) and increasing wave attenuation (Luhar et al., 2013).
From a morphodynamic point of view, Cala Millor is an intermediate beach with a highly dynamic configuration of longitudinal sinuous-parallel bars and troughs, presenting intense variations in the bathymetry related to sandbar movement (Gómez-Pujol et al., 2011; Álvarez-Ellacuría et al., 2011).
Tides are negligible (the tidal amplitude is less than 0.25 m) although other surge components such as those induced by wind or atmospheric pressure can increase the sea level by up to 1 m (Orfila et al., 2005). The beach is open to the east and, due to the semi-enclosed configuration, is well exposed to waves from the NNE to the SE (Enríquez et al., 2017). Significant wave height (Hs) at deep waters is usually below 0.9 m with a peak period (Tp) between 4 and 7 s, although frequent storms account for 2 % of time increase Hs up to 5 m with a Tp higher than 10 s, with a return period of 1.5 years (Tintoré et al., 2009).
Cala Millor is one of the most important tourist resorts created on the eastern coast of Mallorca – more than 60 000 visitors during the summer period – and has a long history of sand nourishment and coastal management approaches (Tintoré et al., 2009).
Since November 2010 the Balearic Islands Coastal Observing and Forecasting System (SOCIB) has been monitoring Cala Millor by means of coastal video monitoring, moored instruments and a periodic program of beach profile and sediment characterization (Tintoré et al., 2013). Along Cala Millor beach, over short temporal scales, shoreline position changes are not always homogeneous (Fig. 2a) and it is possible to appreciate some different behaviors and responses to the wave climate. Cala Millor has experienced at least 19 events with significant wave height at 25 m in depth of over 2 m between November 2010 and January 2017 (Fig. 2b). Some of these events are isolated storms (e.g., April 2013), while others act in groups (e.g., January 2015). Figure 2a shows the alongshore anomaly of shoreline distances for the period between November 2010 and January 2017. The correlation between beach face response and sea conditions is not clear: there are storms that, even though Cala Millor is not a pocket beach, give rise to apparent temporary rotation, whereas others appear as a general shoreline advance or retreat. Nevertheless, from the averaged alongshore shoreline width anomaly (Fig. 2c) a clear change in beach behavior since April 2014, just after a group of storm events that will be analyzed below, can be inferred. Despite that the beach eventually recovers the former alongshore width, a net shoreline recession is observed.
In March 2014, just a few days before the storm group event, a field experiment was carried out in Cala Millor in order to characterize the beach morphology. This experiment produced detailed bathymetries, and beach profiles were measured before the storms and wave recorders were also installed at different depths. Later, in June 2014, another detailed beach survey and bathymetry belonging to the SOCIB's periodic beach monitoring program were carried out (Tintoré et al., 2013). Unfortunately, even though the April 2014 storm group seems to be critical for the beach width evolution, there are no bathymetric data available immediately after the storms. Nevertheless, the number of available data before and after the storm group impacts makes this an opportunity to validate and generate numerical proxies that contribute to unraveling the beach response to the storm group.
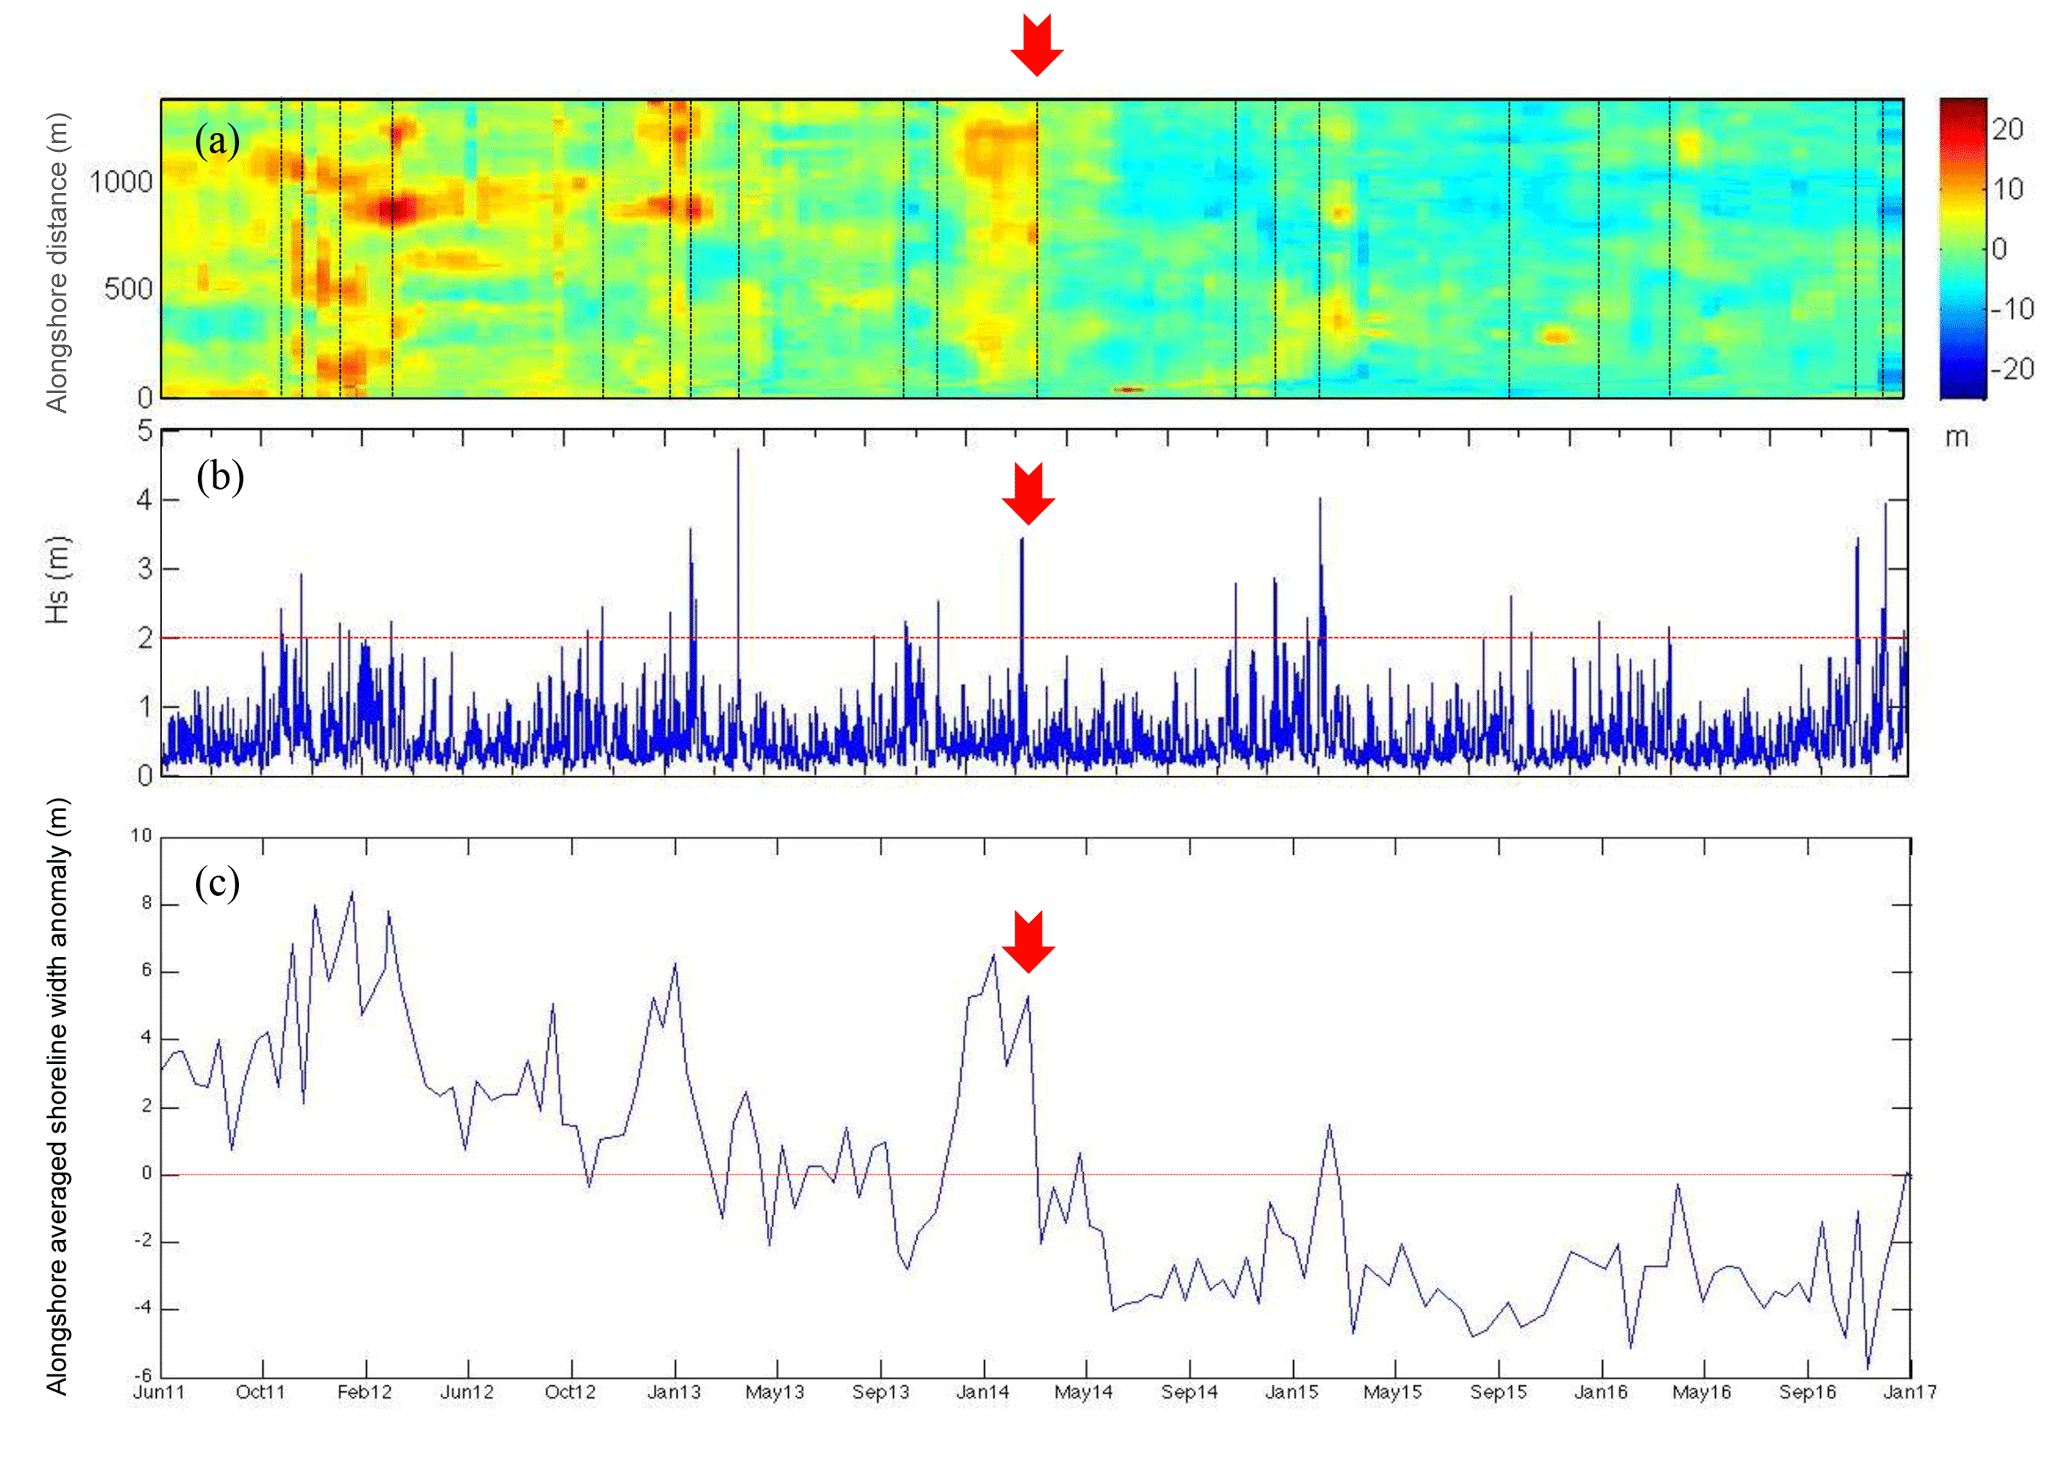
Figure 2(a) Alongshore shoreline width anomaly at Cala Millor from November 2010 to January 2017. Red colors indicate shoreline advance, whereas blue ones indicate shoreline recession. The dashed black lines show the sea storm events larger than 2 m. (b) Wave significant height from a wave recorder located at −17 m in the middle of the Cala Millor embayment. (c) Alongshore averaged shoreline width anomaly at Cala Millor. The red arrows highlight the storm group event at April 2014.
This paper partially deals with datasets produced during the Riskbeach experiment, performed by the SOCIB, the Mediterranean Institute for Advanced Studies (IMEDEA) and the Institute of Marine Sciences (ICM-CSIC) in Cala Millor from 17 to 26 March 2014. This experiment was designed to study the response and recovery of an intermediate beach to usual (1-year return period) storm conditions and the related sediment transport processes and morphological changes. During the experiment, some instruments, detailed in Fig. 1, were installed in a central section of the beach to obtain high-resolution sediment and hydrodynamical data. In this paper we employ the wave and current recorder data (acoustic wave and current meter, AWAC) moored at 25 m in depth. Measurements are completed with bathymetric surveys, sediment samples and video monitoring products. After the experiment (just from 26 March) large waves resulted in a significant morphological change of the beach, once the field survey was finished and the echo sounding equipment was dismantled. To assess the effects of these storms we combine numerical modeling with video monitoring techniques to infer the beach profiles that help us to understand the changes in the beach morphology before and after the storm group.
Figures 1 and 3 summarize the approach developed in this study, showing which data are from different instrumental approaches (i.e., direct measurements from bathymetric and differential GPS–real-time kinematic (DGPS–RTK) surveys) and which ones are inferred from numerical modeling and video images (indirect measurements). According to Fig. 3, field wave, sediment and beach morphology data, before the storm event, are required in order to start up numerical model tools. The obtained results when field campaign data are available have to be validated with field bathymetric data. The numerical model validation ensures that the results obtained during the storm period are accurate. In addition, the product acquired by video monitoring, once the cameras have been calibrated with field bathymetric data, will provide the “proxy” of the measured data. Results will be organized in two sections: first, profiles obtained by direct methods and, second, the results related to the use of these data sources for unraveling the beach erosion and recovery timescales.
We have wave mooring data that we use, through statistical analyses, in order to describe the wave climate and the storms that occurred in Cala Millor. We also have bathymetric data, obtained with DGPS–RTK and echo sounding beach surveys. With the wave climate parameters, the bathymetric initial data of the beach and the grain size distribution (taken with sediment sampling), we can simulate the situation of the Cala Millor beach in the XBeach model. The obtained results must be validated with field bathymetric data during the period of time that we can recollect them. When the field campaign is impossible, we will be able to know the conditions of the beach thanks to the simulation of XBeach (once it has been validated). In addition, we can have another source of data, the video monitoring. Through image analysis we can obtain the beach profile. Once this tool is calibrated and validated against the model and field data, it will act as an independent technique in order to know the state of the beach.
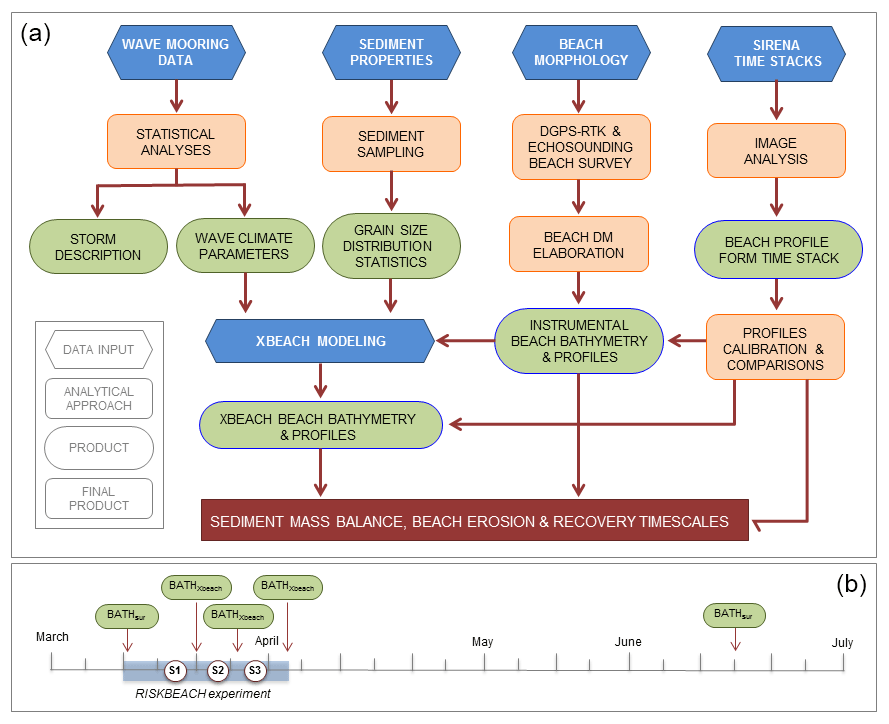
Figure 3(a) Workflow of the approach followed in the study. (b) Calendar showing the date for the samples used in the study.
In this way, we can obtain an approximation of the sediment mass balance and the erosion and recovery timescales of the beach.
3.1 Wave conditions
Offshore wave conditions (significant wave height, Hs, peak period, Tp, and wave direction at 50 m in depth every 3 h) are obtained from a reanalysis of a 60-year wave model output produced by the Spanish Harbor Authority (http://www.puertos.es/es-es/oceanografia/Paginas/portus.aspx, last access: 29 November 2018). The mean Hs for the period of study is 0.9 m with a mean peak period (Tp) of 6 s. During the experiment (17 to 26 March 2014), wave conditions were measured with an AWAC system moored at deep waters (25 m in depth) in the central part of the beach.
Deep water wave conditions show three storms during the period of study (Fig. 4). Here we define storm as sustained wave conditions during at least 6 h with Hs>1 m. Gómez-Pujol et al. (2011) suggested this threshold as the condition required to generate a significant impact along beach morphology and sediment properties. When such an event is not isolated but becomes a succession of events, we refer to it as a group of storms. These episodes can cause larger damage on the beach with smaller wave heights since the beach does not have enough time to recover its initial morphodynamic state. The experiment started on 17 March after a period of moderate conditions with Hs close to 1 m that did not result in significant morphological changes. The first storm, S1 (see Fig. 4a), occurred on 26 March, just after the instruments were moved away, with a maximum significant wave height Hs=1.5 m and Tp=9.9 s from the SE (Fig. 4c) and a duration of 7 h. The second storm, S2, beginning on 28 March, lasted 53 h and peaked during the evening of 29 March with a maximum Hs of 3.4 m and Tp of 10.4 s. The estimated return period for the S2 storm is around 1.2 years. Nevertheless, the return period just refers to the significant wave height threshold, despite that the storm duration and persistence of wave height was 38 h with Hs>2 m, which is unusual. Wave conditions started to build up again on 2 April 2014 after a short period of relatively small waves (Hs<1 m). The third storm, S3, from 2 to 3 April, peaked 4 days after the former storm with maximum Hs of 1.3 m and Tp of 7.8 s (Fig. 4a and b) during 48 h. The following 2 months were characterized by mild conditions, which will be used to study the beach recovery after the storm groups.
3.2 Beach morphology
The topographic surveys were performed from 17 to 26 March using a DGPS–RTK with submetrical resolution (having a horizontal accuracy of around 8 mm and a vertical accuracy of around 15 mm) for both the aerial (the area located over the mean sea level) and the submerged beach (from deep waters up to 1 m in depth). Additionally, for submerged beach, bathymetric data were obtained using a Biosonics DE-4000 echo sounder with a DGPS, which allowed dense mapping from 0.5 to 10. m in depth. On 17 March, an initial bathymetry was acquired. In addition, nine cross-shore profiles were taken daily between 18 and 26 March (see Fig. 1). An additional bathymetry was performed on 12 June for control purposes. Elevations were referenced to the Balearic Islands ordinance survey mean sea level and the horizontal position referenced to the UTM coordinate system (Gómez-Pujol et al., 2011). These data cover the area between the boulevard sea wall and the lower shoreface (ca. 8 m in depth).
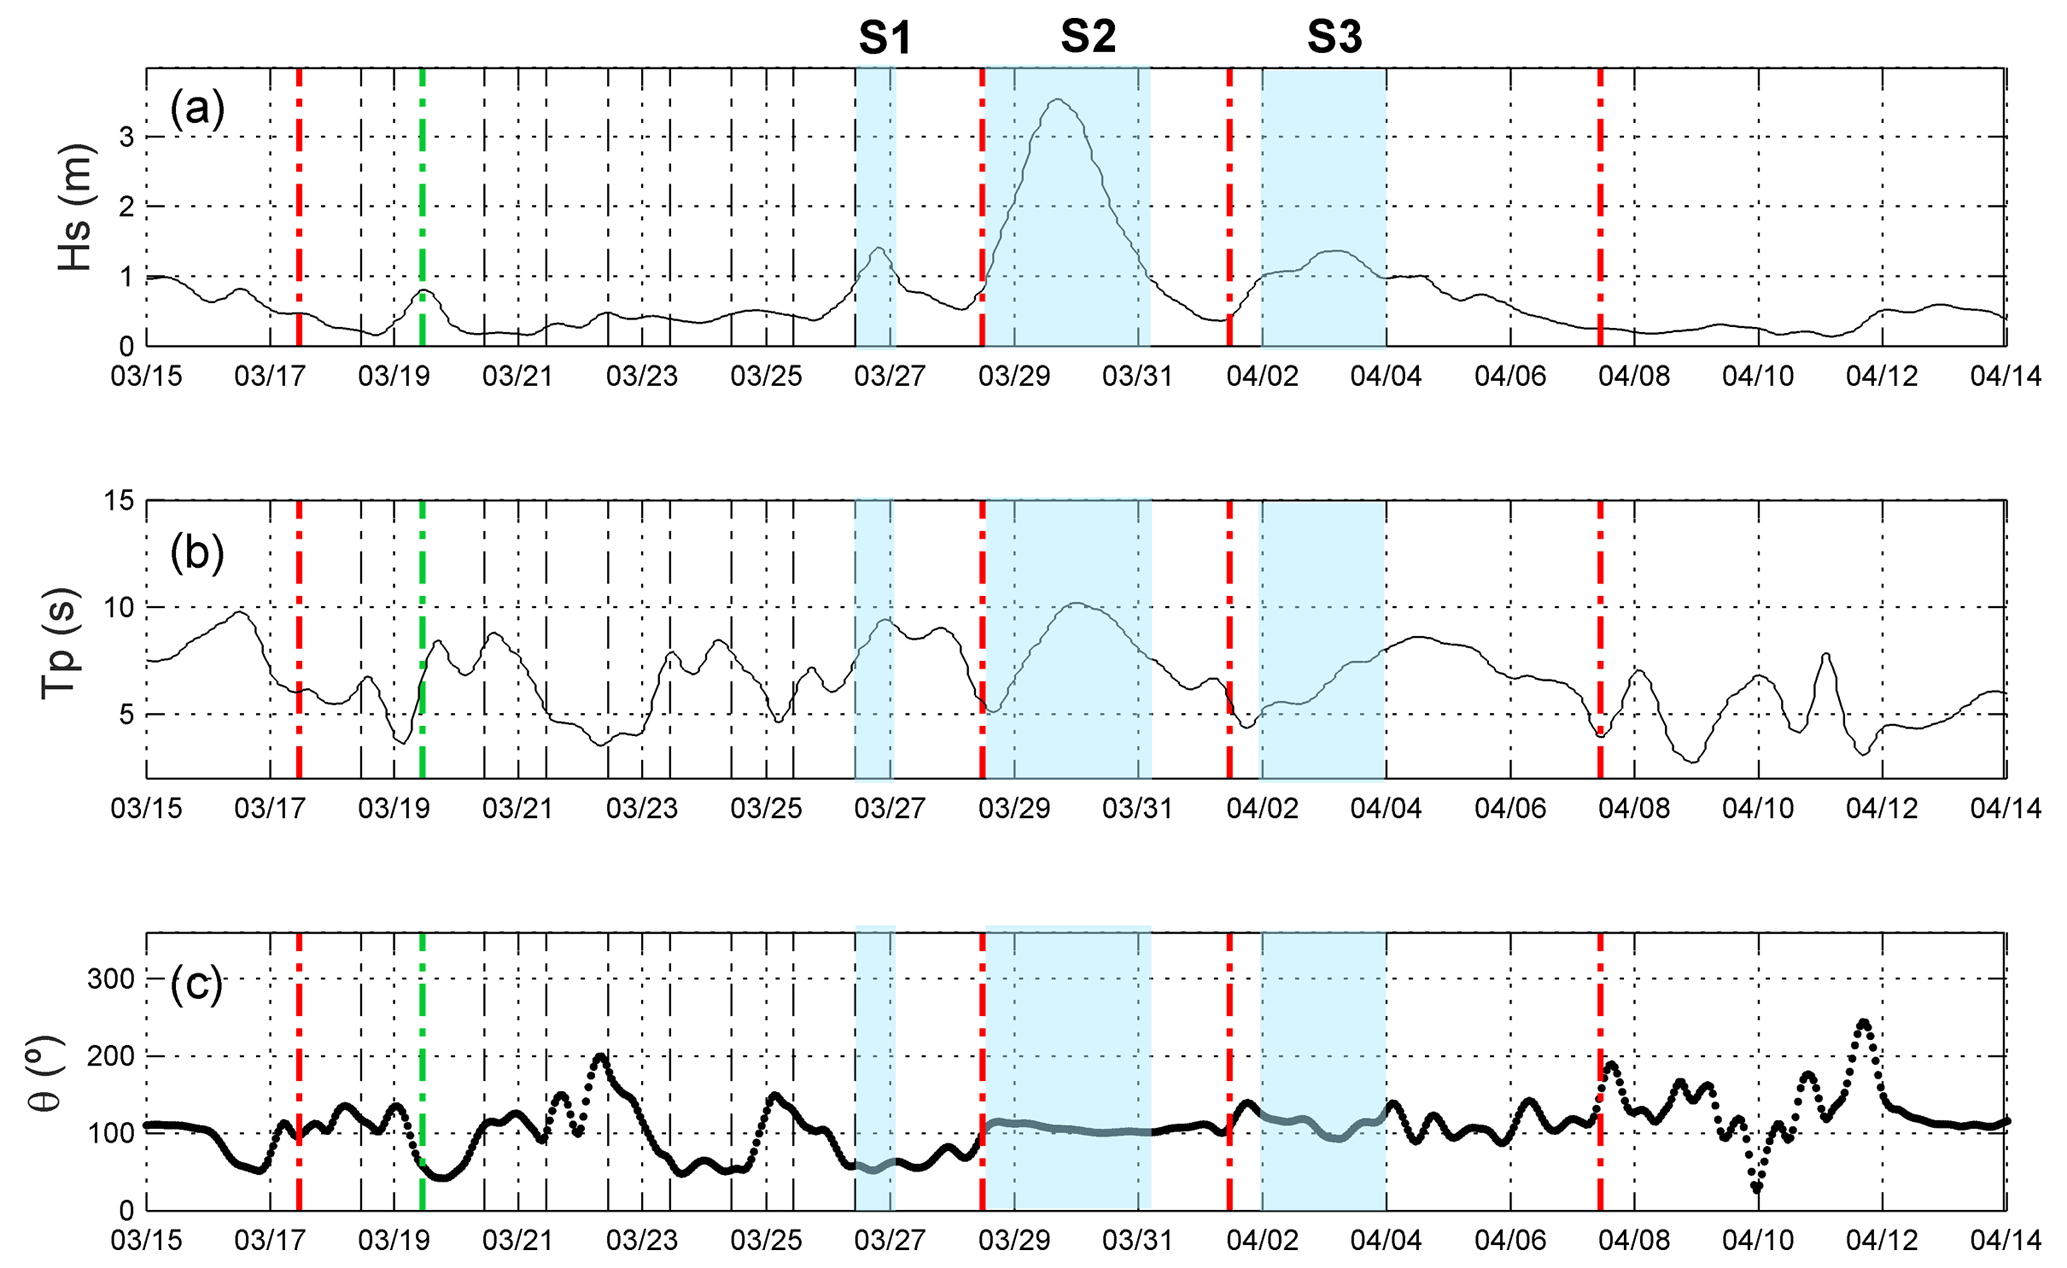
Figure 4(a) Hs (m) at 25 m in Cala Millor between 15 March and 14 April 2014. (b) Tp (s). (c) Wave direction. The blue shading shows the period corresponding to the storms. Vertical red dotted lines indicate the initial bathymetry obtained while dashed dotted lines indicate the dates when cross-shore profiles were measured. Vertical green dotted lines state the day when the model was validated using the corresponding shore profiles. Vertical red lines show the date when bathymetry inferred from XBeach was used for comparison among storms.
3.3 Sediment characteristics
Sediment samples were collected from aerial beach (+2 m) to 6 m in depth at one of the central cross-shore transects (profile 07, Fig. 1). Sediments in the aerial beach and up to 1 m in depth were collected by dragging a plastic bag inserted in an oval metallic frame on the bottom with a vertical penetration of about 2–4 cm, and for greater depths we threw a clamshell bucket from a boat. The weight of samples ranged from 200 to 500 g. After collection, samples were soaked in fresh water for 4 h and drained before being dried for 24 h. Sediment was analyzed using a laser granulometer and grain size obtained through the method described by Folk and Ward (1957) using GRADISTAT software (Blott and Pye, 2001).

Figure 5(a) Time stack image for 19 March at 09:00 UTC + 1 for the central camera. The abscissa corresponds to the cross-shore direction and the ordinate for the time. (b) Reconstruction for the same date assuming a constant wave height using the Fourier mode of the detected period (i.e., ).
3.4 Video monitoring
Coastal monitoring using video images is a practical and widely used technique since the advent of Argus (Holland et al., 1997). Since then, several systems (Cam-era, Horus, Cosmos, Beachkeeper, Ulises, etc.) mimic the Argus philosophy with the objective of providing continuous measurements of coastal processes in an unsupervised and autonomous procedure. Here, we use one such approach, SIRENA/Ulises (Nieto et al., 2010; Simarro et al., 2017), which has been operating since 2009 in Cala Millor. The system is composed of five charge-coupled device (CCD) cameras connected to a server acquiring daily images (Gómez-Pujol et al., 2013). The five cameras encompass an alongshore distance of around 1.7 km, largely including the monitored area. We use the time stacks, consisting of pseudo-images built with all pixel observation taken at 7.5 Hz at a predefined cross-shore transect during the first 10 min of each hour, to infer the beach profile with the inversion of the wave dispersion relationship. The underlying idea in the inversion method is that the wave speed for progressive waves can be measured from its visible signature at consecutive snapshots to estimate the bathymetry using linear wave theory at the observed cross-shore transect (Stockdon and Holman, 2000).
Adopting the linear wave theory, the wave celerity c for shallow water waves (, where k is the wave number and h the local water depth) is
where g is the gravitational acceleration.
Time stack images (Fig. 5a) are preprocessed to convert the RGB data to a tractable intensity matrix. First, original time stacks, with spatial and temporal dimensions , are resampled by removing pixels at the aerial beach as well as at the outer domain (intermediate waters) where each pixel corresponds to large distances that are not useful for measuring hydrodynamic processes. Final images have spatial and temporal dimensions of . A quadratic filter with a time window of 3 s is applied to smooth the intensity timewise, and for each cross-shore position the temporal mean is subtracted. From the intensity matrix I(x,t), the wave frequency is obtained as the main component of the fast Fourier transform (FFT) in the time domain, which is constant along the cross-shore dimension. A FFT is performed for each of the 460 cross-shore time series and the wave frequency, f, found as the mode of all resulting peaks (Fig. 5b).
Once f is known, the spatial component of the wave phase function (Fig. 5b) is evaluated following Stockdon and Holman (2000) as
and the wave celerity is obtained as
The beach profile is finally obtained from Eq. (1).
3.5 Numerical modeling
Morphological evolution is assessed using the XBeach (eXtreme Beach behavior) model (Roelvink et al., 2009), which resolves the hydrodynamic processes of both the short waves (refraction, shoaling and breaking) and the long waves (generation, propagation and dissipation). We use version 4920 for 64 bits. The model has been extensively validated with laboratory data as well as with field observations to study the morphological response of beach and sandy dunes, mostly under storm conditions. Here, we apply the model to analyze the storm group period with the surf beat mode that resolves the 2-D averaged equations.
The initial bathymetry (of 17 March) is discretized in an orthogonal rectangular grid evenly spaced with a resolution of Δx=7.44 m in the cross-shore direction and with Δy=15.86 m in the alongshore direction. Hourly JONSWAP spectra, generated through the measured data with the AWAC at 25 m in depth, are propagated from the seaward boundary to the coast for the period of 17 March to 8 April, after S3 (summing up 528 runs of 1 h of real time). The seaward boundary is imposed as the absorbing–generating (weakly reflective) boundary condition and the lateral boundaries as Neumann type, for which the alongshore gradients are set to zero. The incoming wave directions in almost all simulations come from the east perpendicular to the shoreline (Fig. 4c).
Sediment characteristics measured before the experiment (D50 and D90) are interpolated along the sampled profile and then they are extrapolated alongshore according to the depth of each grid point. The dimensionless porosity of the sediment is set to 30 % and the density considered to be 2650 kg m−3.
4.1 Bathymetry extraction from model and video images
The analyses based on XBeach and on time stacks are used to obtain the bathymetry and beach profiles to address changes in sediment mass balance. The initial bathymetry was measured before the storms (17 March). The numerical model is run for the period between 7 March and 8 April, as stated. For each day a model-derived bathymetry is obtained and nine profiles are extracted at the same locations of the measured cross-shore profiles. Table 1 shows the error parameters between measured profiles and the XBeach modeled profiles from 17 to 26 March. The computed error parameters are the correlation coefficient (R2), the scatter index (SCI) normalized with the maximum of the RMS of the data and the absolute value of the mean of the data, and the relative bias (RB) normalized in the same way as the scatter index, used in Roelvink et al. (2009):
where m is the field data and c the modeled results.
Table 1Error statistics for the simulated profiles by XBeach compared with the measured profiles during Riskbeach.

The profiles derived from the model compare well with the measured ones from the aerial beach (h=2 m) to the depth of closure (, according to the Hallermeier, 1981, formulation). The minimum R2 is 99.31 %, the maximum SCI is 0.11 and the maximum RB is 0.03 in the central profile. Therefore the modeled bathymetries (XBeach) can be considered an efficient and reliable tool for unraveling the beach storm effects.
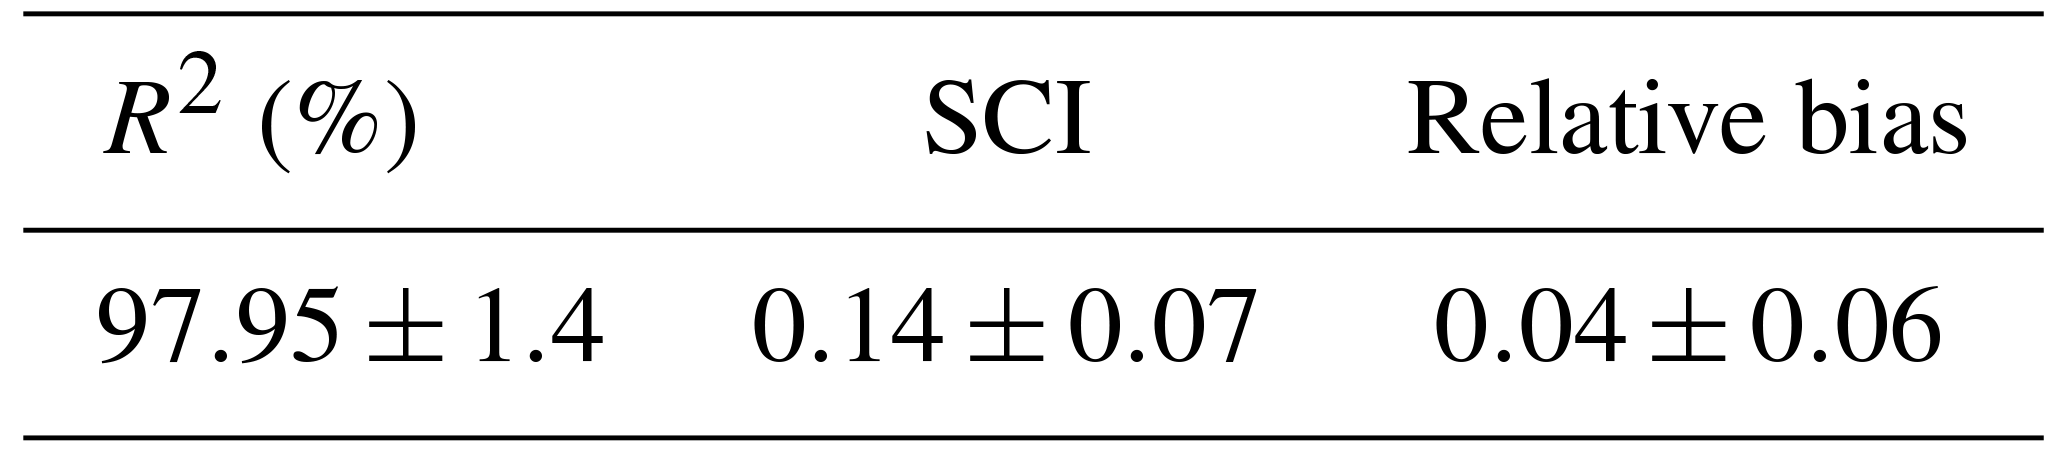
As an additional source of data, a cross-shore seabed profile in the SIRENA/Ulises central camera (Fig. 6) is obtained following the above-described methodology. Table 2 compares the cross-shore profiles derived from time stacks against the instrumental measured profiles for the period between 19 March and 26 April (there are not time stacks available for 17 and 18 March). Since the time stack is defined in a cross-shore transect located between profiles 07 and 09, in situ measurements are interpolated daily to the time stack transect for comparison purposes. Error parameters from in situ measurements and from video images are shown in Table 2, with a R2 value of 97.95 %, SCI of 0.14 and RB of 0.04. The largest differences tend to be located at deep profile positions where the model is known to perform worse since the accepted assumption on Eq. (1) is only valid for shallow waters. In general, there is a good agreement between both sets of data.
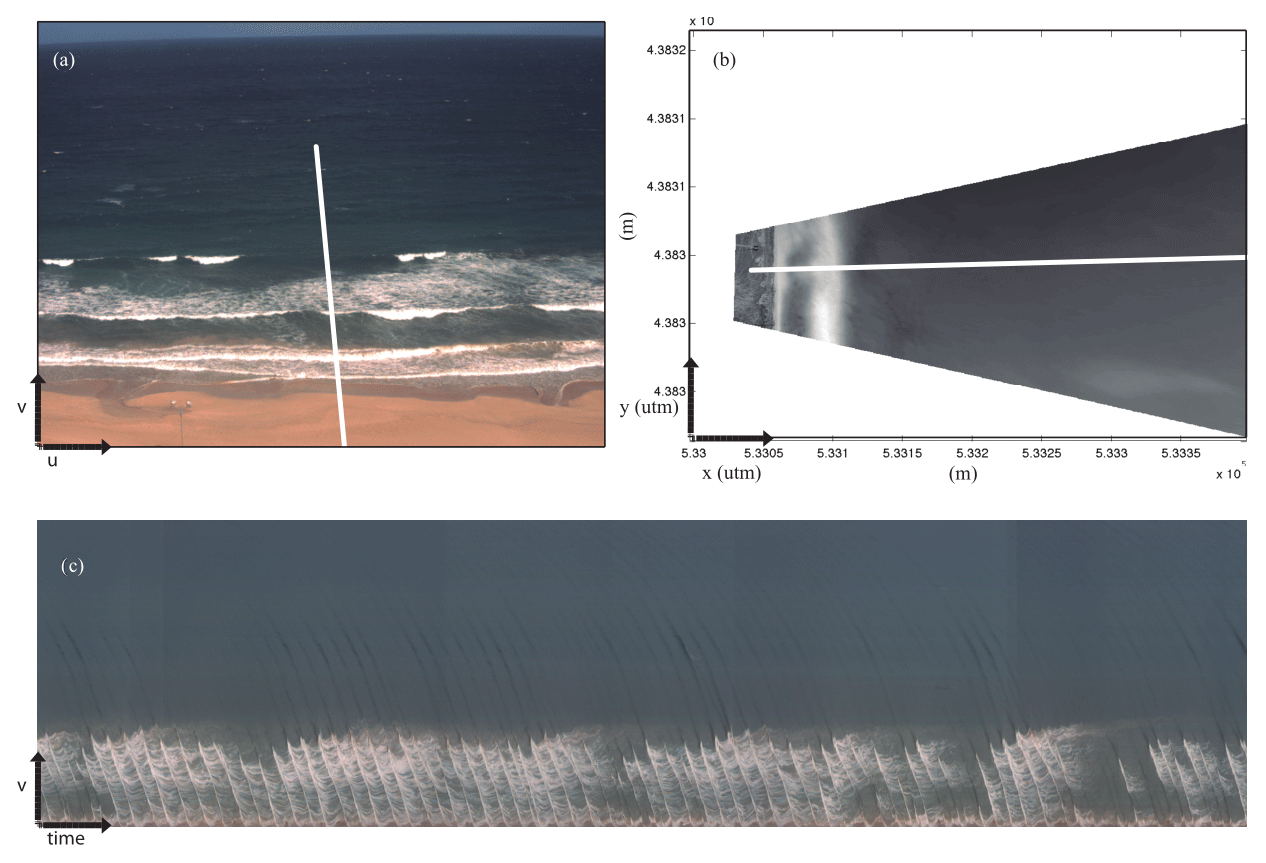
Figure 6(a) Cross-shore transect defined for the time stack image on camera no. 3. The figure shows the original image in the (u,v) ≡ pixel coordinate system. (b) The same after rectification in the (x,y) ≡ UTM coordinate system. (c) Resulting time stack for 19 March at 10:00 UTC + 1.
Table 2Error statistics for the estimated profile from time stacks compared with the measured profiles during Riskbeach.
Both comparisons, XBeach vs. instrumental and time stack vs. instrumental, present the same order of magnitude as that obtained in Roelvink et al. (2009). This allows us to compare beach sediment mass balance before and after the storm group as well as during the longer period of calm after the storms using different datasets and different techniques. This would allow a correct management of the beach, avoiding unnecessary engineering works between tourist seasons.
4.2 Beach morphological response to storms and recovery
Although the individual storms are not exceptional in terms of intensity, their occurrence as a storm group has a significant imprint on the beach morphology. The initial bathymetry, performed before the storm group (on 17 March 2014), shows a sinuous-parallel and patchy bar at −1 m and a cross-shore profile with attenuated secondary forms with a mean slope of 2.6 %, whereas the bathymetry obtained for 8 April 2014 from XBeach shows a marked dissipative configuration. This is consistent with the obtained timex images through the SIRENA video monitoring station (see Fig. 7). The seabed variation after the storm group (S1, S2 and S3, in Fig. 4a) is presented in Fig. 8a. This morphological change is obtained as the difference between the bathymetry obtained with XBeach after storm S3 (8 April) and the initial bathymetry. The effect of consecutive storms is to mainly erode the aerial beach, mobilizing the sediment from the berm to depths of between −1 and −5 m, forming a bar (around 100 m from the shoreline, Fig. 8a). The sediment mobilized to the bar is around 2.69×10⁴ m3 and comes from the aerial beach, where the volume loss is estimated as 3.01×10⁴ m3. This approximation of the sediment transport is calculated as the variation in depth at each spatial grid point between the initial bathymetry on 17 March and the simulated bathymetry for 8 April. All grid points are finally summed to obtain an approximated value of the sediment transport. The same methodology is applied to determine the sediment volume during the recovery period, but in this case the initial bathymetry is simulated by XBeach on 8 April and the final one is the one measured during 12 June. The redistribution can also be examined by analyzing the profile at the center of the beach using video images. Figure 9a shows the beach profile change using video images from 19 March (the selection of 19 March is made since no images are available for the previous days) to 8 April (after S3).
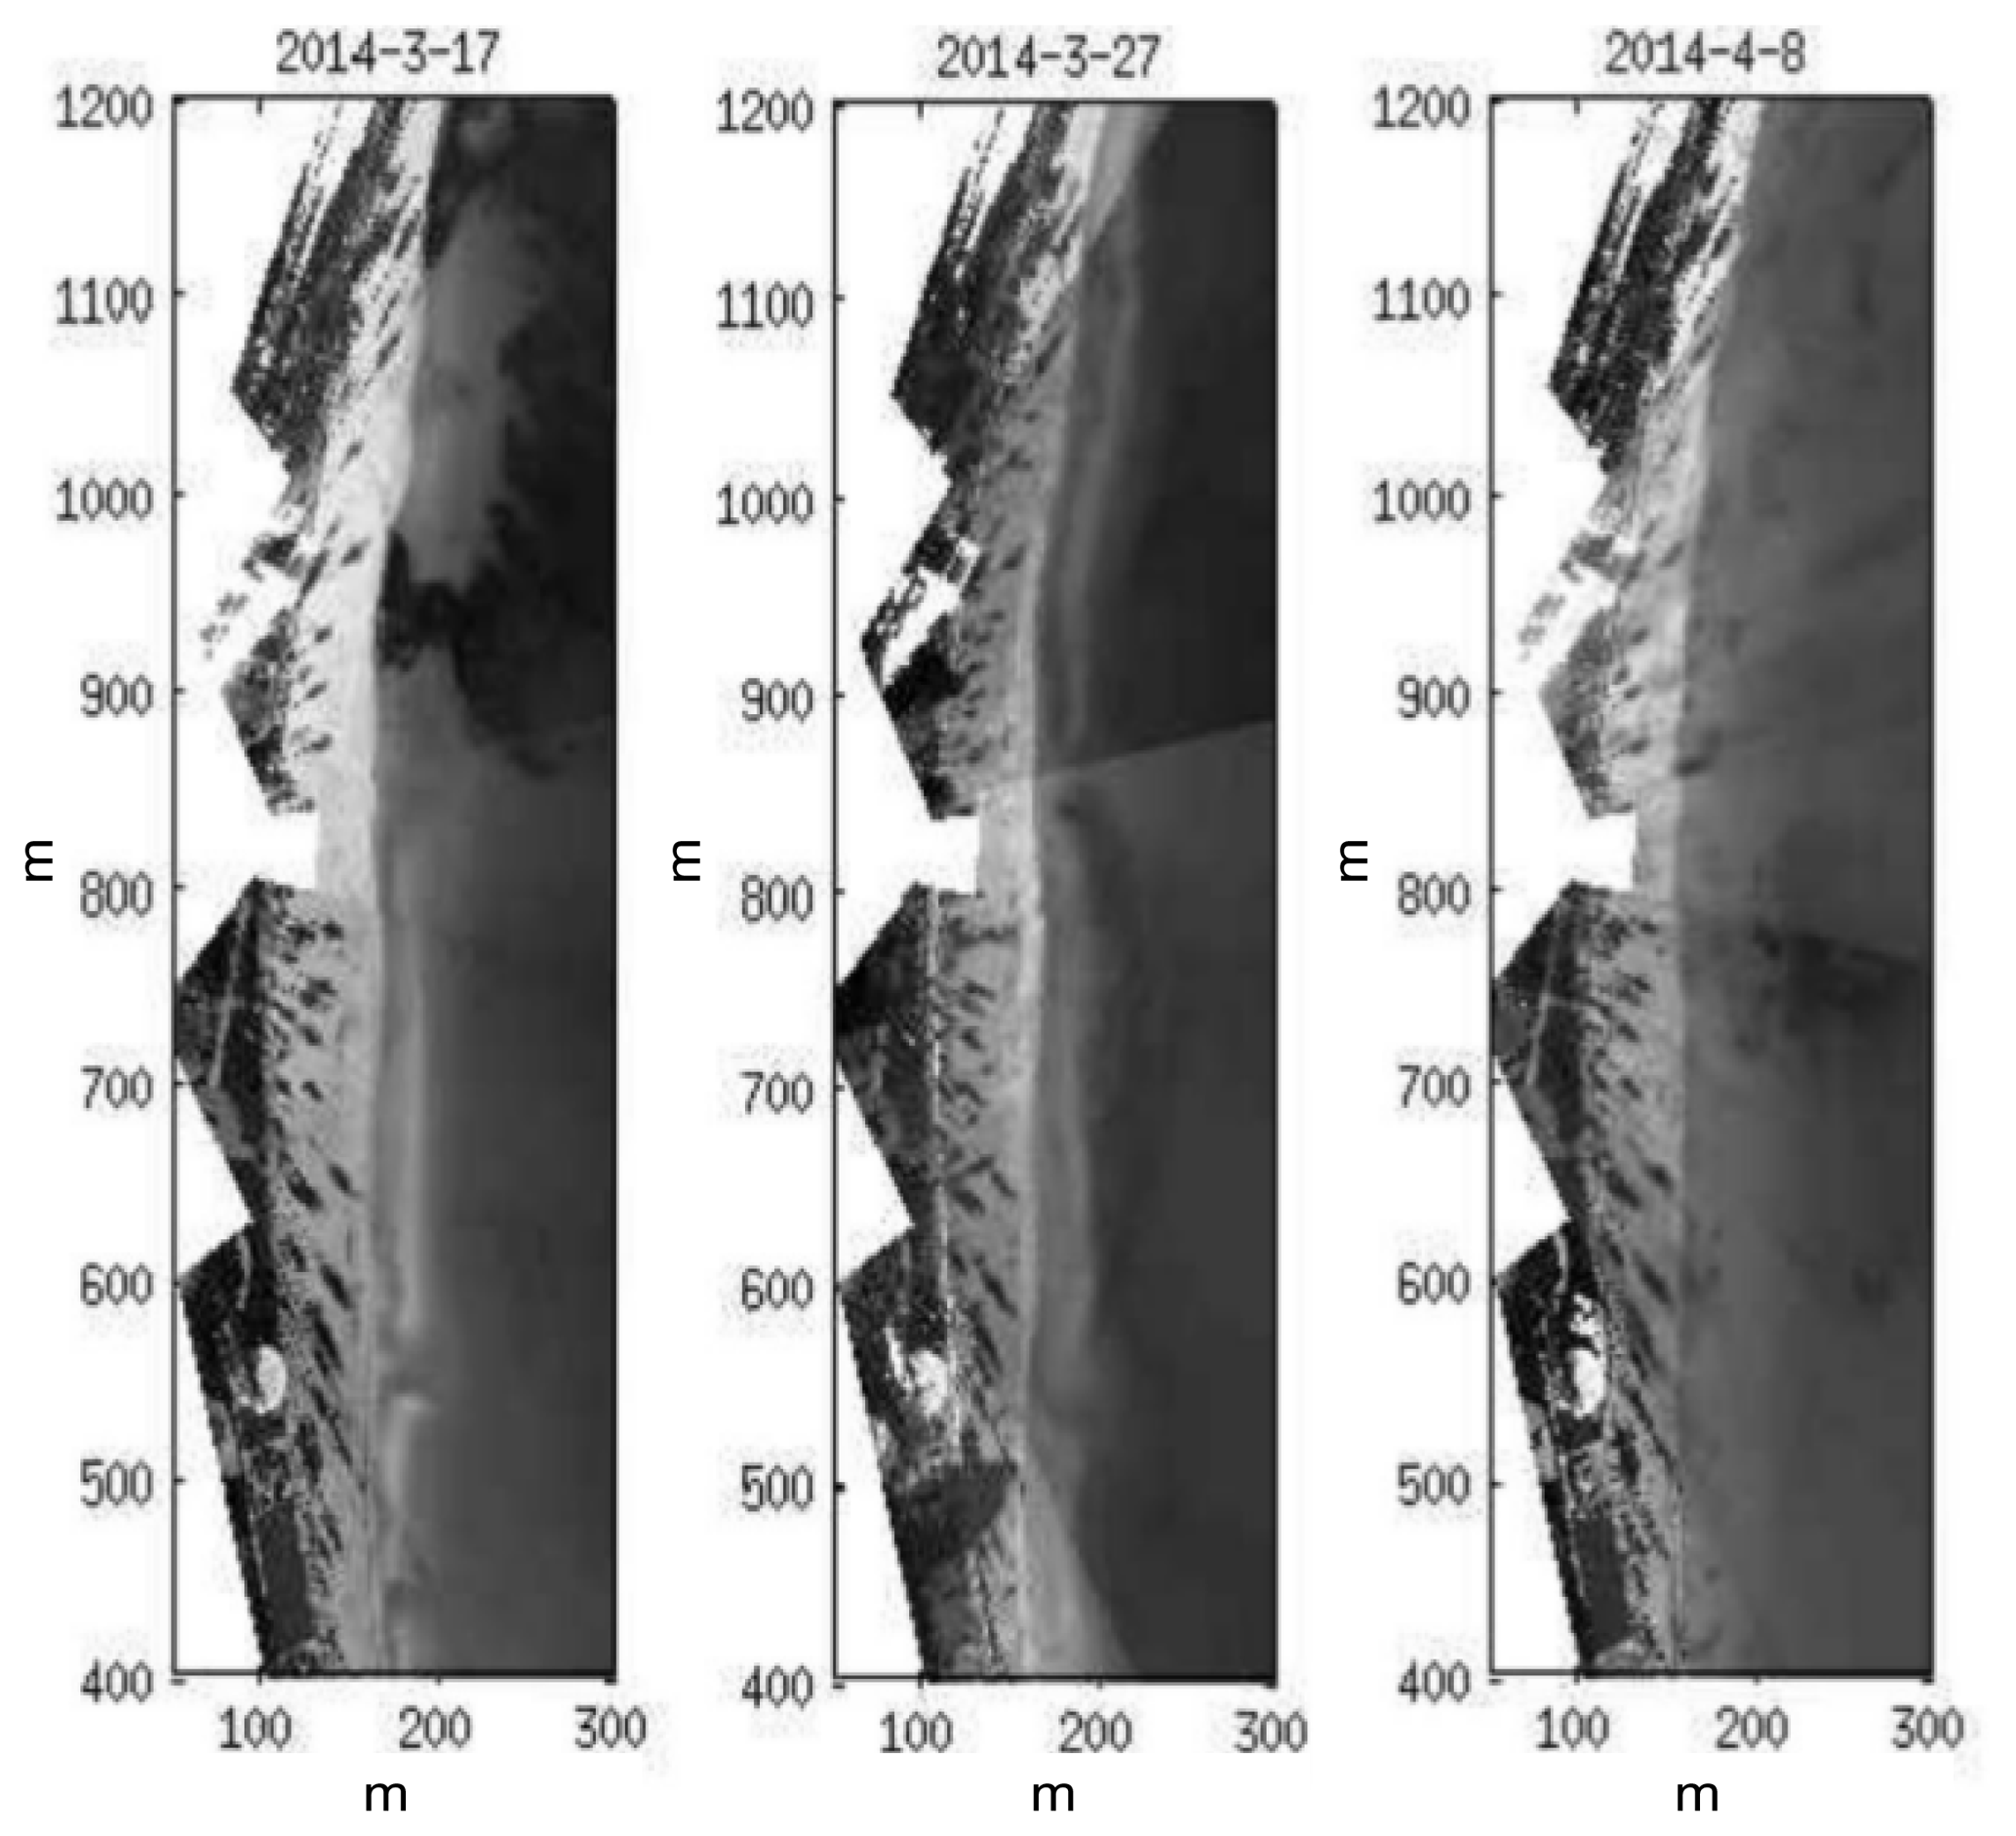
Figure 7Timex images with dates referred to in each image. Notice the intermediate configuration with a sinuous parallel bar along the coast (ca. 180 m) for 17 and 27 March and the dissipative scenario without a bar for 8 April.

Figure 8Depth variation estimated from XBeach and from measurements. (a) Bottom variation during the storm group (17 March to 8 April). (b) Bottom variation for the period of calms (8 April to 12 June).
We analyze the differences between the initial bathymetry (17 March 2014, preceding S1) and the bathymetries after storms S1, S2 and S3 (28 March, 1 and 8 April, respectively) obtained from XBeach. Figure 10 shows the differences, i.e., the impact of each of the storms. The first storm, S1, with moderate Hs and short duration, produces erosion at the beach face (volume loss of 1.18×10⁴ m3), accumulating large volumes of sand between −1 and −2 m (not shown in Fig. 10). During the second storm, S2, which is the most energetic, the beach face suffers a new episode of intense erosion, with depth variations between 1 and 1.5 m and movement of the bar offshore (Fig. 10b). The gain in volume in the bar zone is around 1.51×10⁴ m3. Finally, the third storm (S3), with moderate wave heights but with long duration, continues eroding the aerial beach with little change in the submerged beach (Fig. 10c). This indicates that a sequence of storms does not necessarily result in cumulative erosion, supporting previous findings by Birkemeier et al. (1999) and Coco et al. (2014). The eroded sediment that is transported offshore but not lost has the capacity to modify the cross-shore morphology and promote the wave attenuation contributing to the sediment transport feedback.
The three-dimensional beach response to three successive storms highlights the importance of the storm duration in the sedimentary budget. This has been recently addressed in different studies (Coco et al., 2014; Ruiz de Alegria-Arzaburu and Masselink, 2010; Senechal et al., 2015; Vousdoukas et al., 2012) and particularly for the Mediterranean by Jiménez et al. (2008). This scenario fits with the usual “storm–post storm” behavior model (Archetti et al., 2016; Stive et al., 2002) and highlights the need for more research, especially in the physical description and numerical modeling, in order to improve our knowledge of the characterization of the temporal scales associated with the beach sedimentary budget. Here, we found evidence that recovery times, jointly with antecedent morphology, play a crucial role in shoreline and beach dynamics as stated by Senechal et al. (2015) or Jara et al. (2015).
After the S3 storm the beach experienced relatively calm conditions. A new bathymetry was performed on 12 June 2014, allowing us to address the behavior of the beach during this period. Figure 8b shows the differences between the bathymetry on 12 June and the post-storm bathymetry obtained with numerical modeling for 8 April 2014. As can be seen, 2 months after the storm group, there is an opposite scenario. The sand reservoir below feeds up the shoreface again but also redistributes sediment along the beach at different depths. The sand volume recovered at the aerial beach during this period is 1.58×10⁴ m3, which is half of the volume lost during the storm period. This behavior is confirmed from the analysis of the beach cross-shore profile obtained from the time stack video image. Figure 9b shows the difference between the summer profile (12 June 2014) and the beach profile after S3 (8 April 2014), supporting a recovery of the upper part of the beach.
The proposed approach aims to be a tool to assist in beach management, especially during adverse conditions when field surveys are not possible. The combination of numerical models, video monitoring and in situ data provides alternatives for the lack of data, especially during adverse conditions. This approach follows the change in the paradigm in ocean studies in which multiplatform approaches are being developed across the globe in order to fill spatial and temporal gaps in the measured time series.
On the studied beach, the results show that the beach is able to recover the lost sediment on a larger scale than the erosion and that it is crucial to know the beach configuration at any time in order to know its evolution in front-specific wave climate episodes.
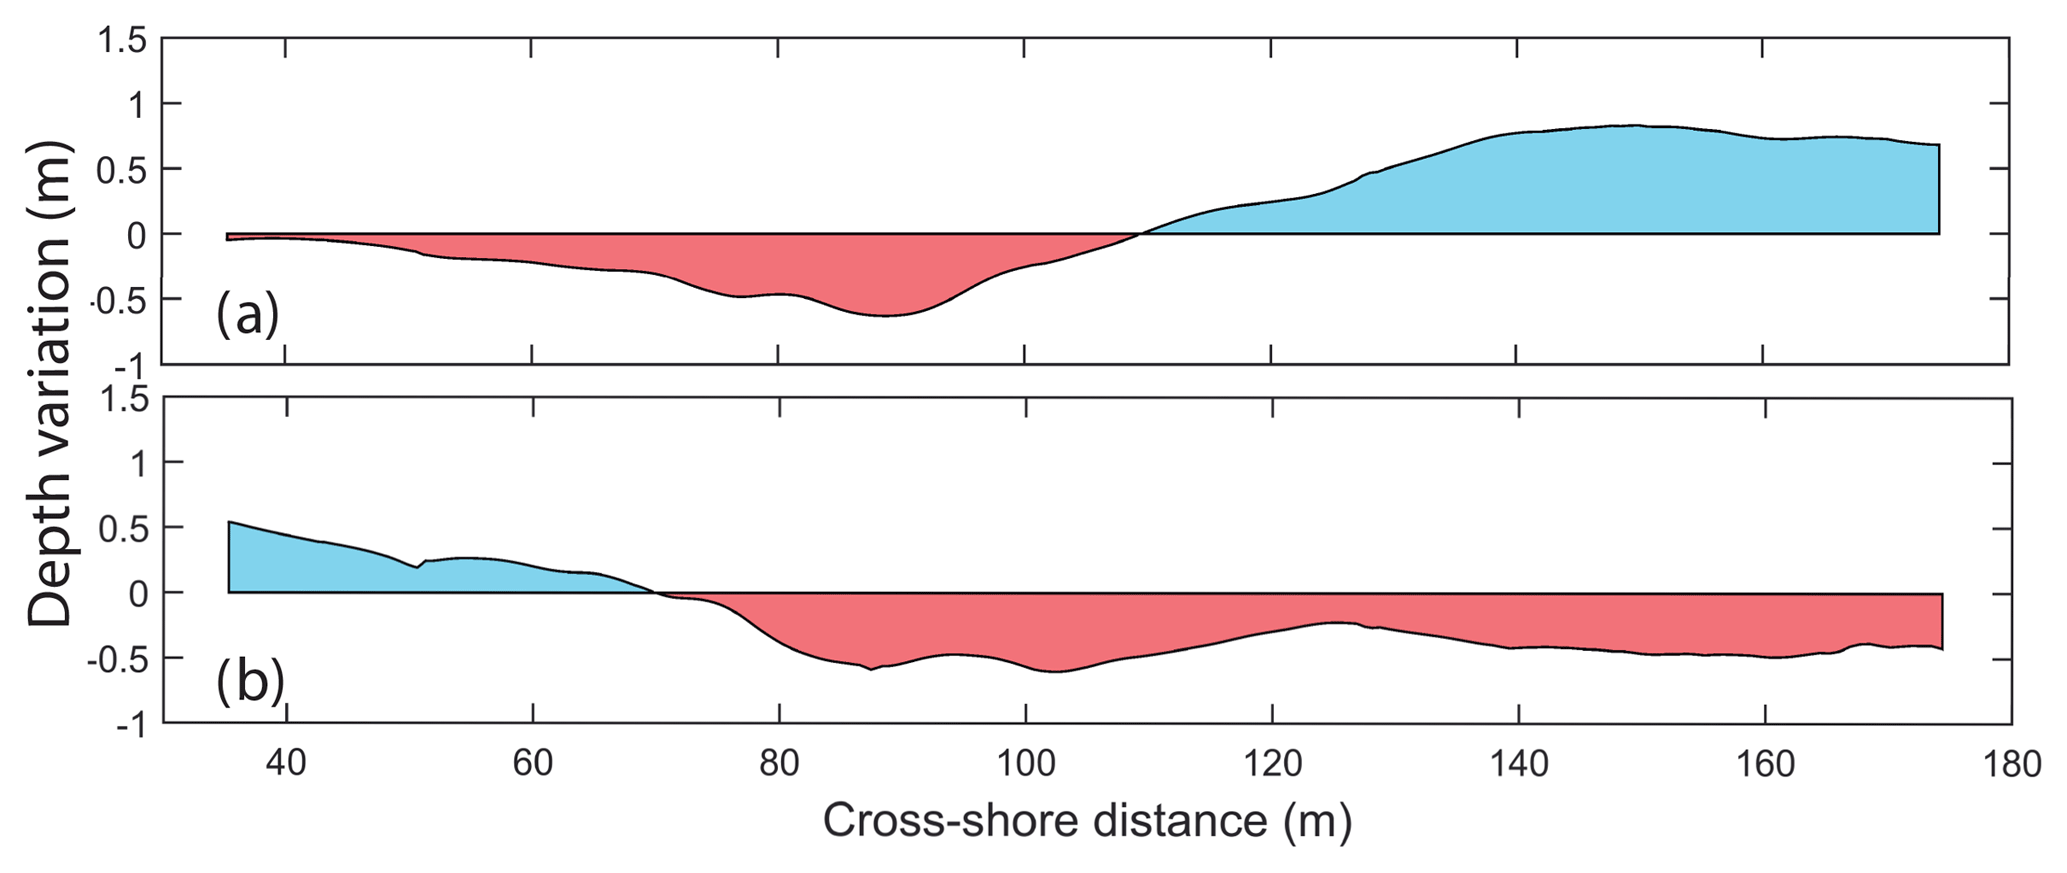
Figure 9Depth variation estimated from bathymetry inversion of the time stack during storm conditions; (a) between 8 April and 20 March (storm conditions); (b) between 12 June and 8 April (calm conditions).
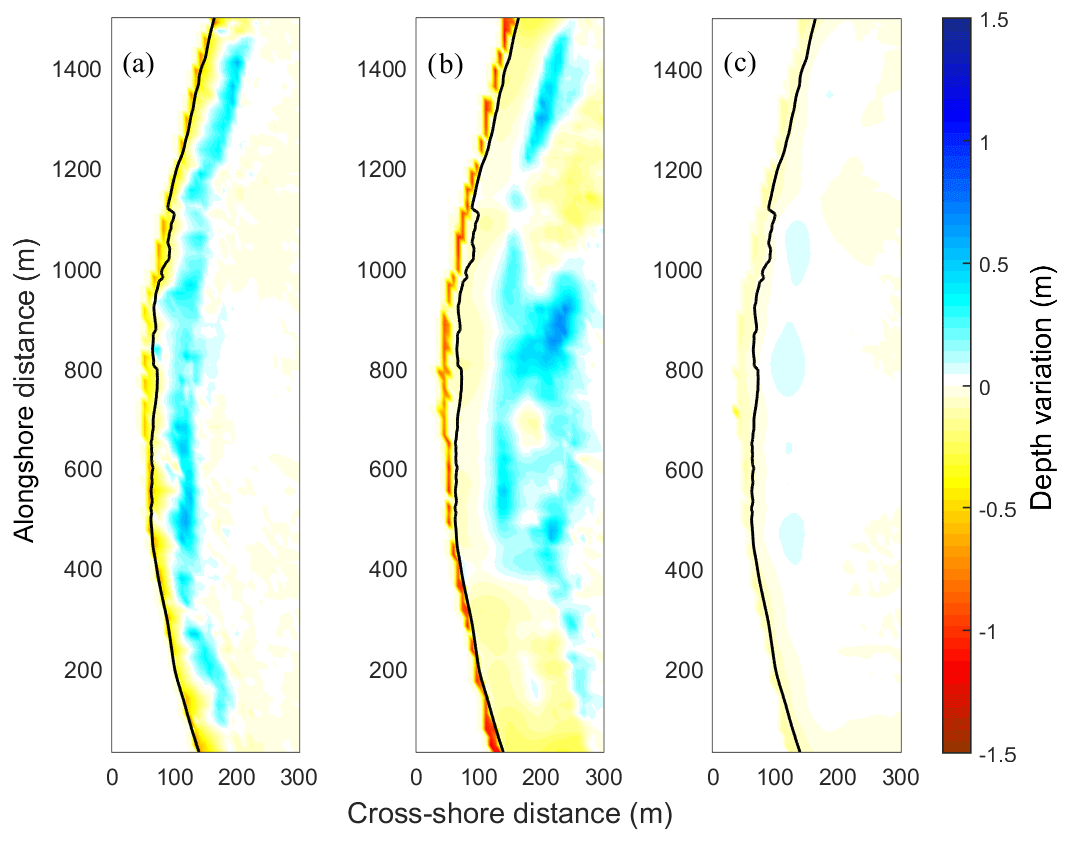
Figure 10Depth variation estimated from XBeach and from measurements. (a) Bottom variation between 17 and 28 March (storm S1). (b) Depth variation between 28 March and 1 April (storm S2). (c) Depth variation between 1 and 8 April (storm S3).
The response of a low-energy microtidal beach in front of storm groups on timescales related to processes of beach erosion and accretion is studied. For this purpose, different techniques and approaches including DGPS–RTK and bathymetry surveys, modeling, and video monitoring are combined. The observations confirm that the previous morphological conditions are crucial for controlling the sediment exchange and the morphological response of the beach.
Focusing on the effect of individual storms, the first storm mobilizes sand mostly from the aerial area, generating a parallel bar at depths of ∼1 m and modifying the beach profile from near reflective to more dissipative. The effect of S2, lasting for more than 30 h, is to mobilize a large volume of sediment, redistributing the profile along the whole beach and generating a large submerged sandbar at depths of (∼100 m from the shoreline). This profile is very efficient in protecting the beach from the third storm, which has a duration of 48 h, with the sediment mobilized during this event being almost negligible. The largest changes in sediment mobilization occur in the transition from the reflective to the dissipative states, when the beach adjusts its profile to the incoming wave conditions. The combined effects of this storm group confirm that in low-energy systems such as the one analyzed here, it is necessary to know the previous morphological state in order to properly assess the new beach conditions.
Results highlight the different well-known temporal scales for erosion and accretion in low-energy systems. While offshore sand migration is produced at storm timescales, the onshore sediment transport has a much slower characteristic timescale. In particular, a group of relatively energetic storms has the capacity to generate significant erosion in 3 days. Despite the moderate conditions and the lack of storms during the next 2 months, only half of the sediment is recovered. In this study the recovery of the beach is not documented, either in sediment mass balance or in shoreline width. Nevertheless, from Fig. 2a it can be seen that the aerial beach remains relatively stable and the beach width slightly increases at the end of 2014. Then in December 2014 and early January 2015, a new set of storm group events affect the beach, and since then the beach shoreline width has not recovered to former conditions, despite some advance in shoreline position.
Time recovery after storms is a key issue for local beach managers who are pressed by tourism stakeholders to nourish the beach after energetic processes in order to reach the quality standards required by beach users. The combined use of remote-sensing data, in situ observations and numerical models should already be integrated into management tools to make short-term decisions, such as those concerning beach nourishment, based on reliable physical data.
AO conceived the idea of the study with the support of VM, LGP, GS and MM; AO, GS and VM developed the methodology with the support of AA and DC; VM produced the results with the support of AO and DC; AA, GS and LGP analyzed the results with the support of AO and VM. All authors contributed to writing the paper.
Alejandro Orfila is a member of the editorial board of Ocean Dynamics and Frontiers in Marine Sciences. Marta Marcos is a member of the editorial board of Frontiers in Marine Sciences.
This work has been possible thanks to the IMEDEA–SOCIB collaboration. Authors
acknowledge financial support from MINECO/FEDER through projects
MORFINTRA/MUSA (CTM2015-66225-C2-2-P) and CLIMPACT (CGL2014-54246-C2-1-R). Verónica Morales-Márquez is supported by an FPI grant from the Ministerio de
Economía, Industria y Competitividad of the Spanish government associated
with MORFINTRA/MUSA. Daniel Conti is supported by a PhD fellowship (FPI/1543/2013)
granted by the Conselleria d'Educació, Cultura i Universitats from the
Government of the Balearic Islands co-financed by the European Social Fund.
The authors thank the four anonymous referees for their valuable support.
Edited by: Maria Ana Baptista
Reviewed by: four anonymous referees
Álvarez-Ellacuría, A., Orfila, A., Gómez-Pujol, L., Simarro, G., and Obregon, N.: Decoupling spatial and temporal patterns in short-term beach shoreline response to wave climate, Geomorphology, 128, 199–208, 2011. a
Archetti, R., Paci, A., Carniel, S., and Bonaldo, D.: Optimal index related to the shoreline dynamics during a storm: the case of Jesolo beach, Nat. Hazards Earth Syst. Sci., 16, 1107–1122, https://doi.org/10.5194/nhess-16-1107-2016, 2016. a
Ariza, E.: An analysis of beach management framework in Spain, Study case: the Catalonian coast, J. Coast. Conserv., 15, 445–455, 2010. a
Beach monitoring facility (SOCIB): Beach Monitoring, available at: http://apps.socib.es/beamon/?locale=es, last acces: 30 November 2018. a
Birkemeier, W. A.: The effects of the 19 December 1977 coastal storm on beaches in North Carolina and New Jersey, 47, Coastal Engineering Research Center, 1979. a
Birkemeier, W. A., Nicholls, R. J., and Lee, G.-H.: Storms, storm groups and nearshore morphologic change, in: Coastal Sediments, 1109–1122, ASCE, 1999. a
Blott, S. J. and Pye, K.: Gradistat: a grain size distribution and statistics package for the analysis of unconsolidated sediments, Earth Surf. Proc. Land., 26, 1237–1248, 2001. a
Bosello, F., Nicholls, R. J., Richards, J., Roson, R., and Tol, R. S.: Economic impacts of climate change in Europe: sea-level rise, Clim. Change, 112, 63–81, 2012. a
Callaghan, D. P. and Roshanka, R.: Quantifying the storm erosion hazard for coastal planning, Coast. Eng., 56, 90–93, 2009. a
Ciavola, P. and Stive, M.: Thresholds for storm impacts along European coastlines: introduction, Geomorphology, 143, 1–2, 2012. a
Coco, G., Senechal, N., Rejas, A., Bryan, K., Capo, S., Parisot, J., Brown, J., and MacMahan, J.: Beach response to a sequence of extreme storms, Geomorphology, 204, 493–501, 2014. a, b, c, d
Enríquez, A. R., Marcos, M., Álvarez-Ellacuría, A., Orfila, A., and Gomis, D.: Changes in beach shoreline due to sea level rise and waves under climate change scenarios: application to the Balearic Islands (western Mediterranean), Nat. Hazards Earth Syst. Sci., 17, 1075–1089, https://doi.org/10.5194/nhess-17-1075-2017, 2017. a
Ferreira, Ó.: Storm groups versus extreme single storms: predicted erosion and management consequences, J. Coast. Res., 42, 221–227, 2005. a
Ferreira, Ó., Viavattene, C., Jimenez, J. A., Bolle, A., das Neves, L., Plomaritis, T. A., McCall, R., and van Dongeren, A. R.: Storm-induced risk assessment: Evaluation of two tools at the regional and hotspot scale, Coast. Eng., 134, 241–253, 2017. a
Folk, R. L. and Ward, W. C.: Brazos river bar: a study in the significance of grain size parameters, J. Sediment. Res., 27, 3–26, 1957. a
Frazer, L. N., Anderson, T. R., and Fletcher, C. H.: Modeling storms improves estimates of long-term shoreline change, Geophys. Res. Lett., 36, https://doi.org/10.1029/2009GL040061, 2009. a
Gómez-Pujol, L., Orfila, A., Alvarez-Ellacuría, A., and Tintoré, J.: Controls on sediment dynamics and medium-term morphological change in a barred microtidal beach (Cala Millor, Mallorca, Western Mediterranean), Geomorphology, 132, 87–98, 2011. a, b, c, d
Gómez-Pujol, L., Orfila, A., Álvarez-Ellacuría, A., Terrados, J., and Tintoré, J.: Posidonia oceanica beach-cast litter in mediterranean beaches: a coastal videomonitoring study, J. Coast. Res., 2, 1768–1773, 2013. a
Hallegatte, S., Green, C., Nicholls, R. J., and Corfee-Morlot, J.: Future flood losses in major coastal cities, Nat. Clim. Change, 3, 802–806, 2013. a
Hallermeier, R. J.: Terminal settling velocity of commonly occurring sand grains, Sedimentology, 28, 859–865, 1981. a
Holland, K. T., Holman, R. A., Lippmann, T. C., Stanley, J., and Plant, N.: Practical use of video imagery in nearshore oceanographic field studies. IEEE J. Ocean. Eng., 22, 81–92, 1997. a
Houser, C.: Alongshore variation in the morphology of coastal dunes: Implications for storm response, Geomorphology, 199, 48–61, 2013. a
Infantes, E., Terrados, J., Orfila, A., Cañellas, B., and Álvarez-Ellacuria, A.: Wave energy and the upper depth limit distribution of Posidonia oceanica, Bot. Mar., 52, 419–427, 2009. a, b
Infantes, E., Orfila, A., Simarro, G., Terrados, J., Luhar, M., and Nepf, H.: Effect of a seagrass (Posidonia oceanica) meadow on wave propagation, Mar. Ecol.-Prog. Ser., 456, 63–72, 2012. a
Jara, M., González, M., and Medina, R.: Beach memory related to cross-shore processes, Coastal Sediments 2015: The Proceedings of the Coastal Sediments, 2015. a, b
Jiménez, J. A., Guillén, J., and Falqués, A.: Comment on the article “Morphodynamic classification of sandy beaches in low energetic marine environment” by Gómez-Pujol, L., Orfila, A., Cañellas, B., Alvarez-Ellacuria, A., Méndez, F. J., Medina, R., and Tintoré, J. Mar. Geol., 242, 235–246, 2007. Mar. Geol., 255, 96–101, 2008. a
Jiménez, J. A., Gracia, V., Valdemoro, H. I., Mendoza, E. T., and Sánchez-Arcilla, A.: Managing erosion-induced problems in nw mediterranean urban beaches, Ocean Coast. Manage., 54, 907–918, 2011. a
Koch, E. W., Ackerman, J. D., Verduin, J., and van Keulen, M.: Fluid dynamics in seagrass ecology–from molecules to ecosystems, in: Seagrasses: biology, ecologyand conservation, 193–225, Springer, 2007. a
Loureiro, C., Ferreira, Ó., and Cooper, J. A. G.: Extreme erosion on high-energy embayed beaches: influence of megarips and storm grouping, Geomorphology, 139, 155–171, 2012. a
Luhar, M., Infantes, E., Orfila, A., Terrados, J., and Nepf, H. M.: Field observations of wave-induced streaming through a submerged seagrass (Posidonia oceanica) meadow, J. Geophys. Res.-Oceans, 118, 1955–1968, 2013. a
Luijendijk, A., Hagenaars, G., Ranasinghe, R., Baart, F., Donchyts, G., and Aarninkhof, S.: The State of the World's Beaches, Scientific reports, 8, 2018. a
Masselink, G. and van Heteren, S.: Response of wave-dominated and mixed-energy barriers to storms, Mar. Geol., 352, 321–347, 2014. a
Masselink, G., Scott, T., Poate, T., Russell, P., Davidson, M., and Conley, D.: The extreme 2013/2014 winter storms: hydrodynamic forcing and coastal response along the southwest coast of england, Earth Surf. Proc. Land., 41, 378–391, 2016. a
Nieto, M. A., Garau, B., Balle, S., Simarro, G., Zarruk, G. A., Ortiz, A., Tintoré, J., Álvarez-Ellacuría, A., Gómez-Pujol, L., and Orfila, A.: An open source, low cost video-based coastal monitoring system, Earth Surf.-Proc. Land., 35, 1712–1719, 2010. a
Orfila, A., Jordi, A., Basterretxea, G., Vizoso, G., Marbà, N., Duarte, C. M., Werner, F. E., and Tintoré, J.: Residence time and Posidonia oceanica in Cabrera Archipelago National Park, Spain, Cont. Shelf Res., 25, 1339–1352, 2005. a
Roelvink, D., Reniers, A., van Dongeren, A., van Thiel de Vries, J., McCall, R., and Lescinski, J.: Modelling storm impacts on beaches, dunes and barrier islands, Coast. Eng., 56, 1133–1152, 2009. a, b, c
Ruiz de Alegria-Arzaburu, A. and Masselink, G.: Storm response and beach rotation on a gravel beach, Slapton Sands, UK, Mar. Geol., 278, 77–99, 2010. a
Senechal, N., Coco, G., Castelle, B., and Marieu, V.: Storm impact on the seasonal shoreline dynamics of a meso-to macrotidal open sandy beach (Biscarrosse, France), Geomorphology, 228, 448–461, 2015. a, b, c, d
Semeoshenkova, V. and Newton, A.: Overview of erosion and beach quality issues in three Southern European countries: Portugal, Spain and Italy, Ocean Coast. Manage., 118, 12–21, 2015. a, b
Simarro, G., Ribas, F., Alvarez, A., Guillen, J., Chic, O., and Orfila, A.: Ulises: An open source code for extrinsic calibrations and planview generations in coastal video monitoring systems, J. Coast. Res., 33, 1217–1227, 2017. a
SOCIB Data centre: THREDDS Data Server, available at: http://thredds.socib.es/thredds/catalog/mooring/waves_recorder/mobims_playadepalma/L1/2014/catalog.html, last acces: 30 November 2018. a
Stive, M. J., Aarninkhof, S. G., Hamm, L., Hanson, H., Larson, M., Wijnberg, K. M., Nicholls, R. J., and Capobianco, M.: Variability of shore and shoreline evolution, Coast. Eng., 47, 211–235, 2002. a
Stockdon, H. F. and Holman, R. A.: Estimation of wave phase speed and nearshore bathymetry from video imagery, J. Geophys. Res.-Oceans, 105, 22015–22033, 2000. a, b
Tintoré, J., Medina, R., Gómez-Pujol, L., Orfila, A., and Vizoso, G.: Integrated and interdisciplinary scientific approach to coastal management, Ocean Coast. Manage., 52, 493–505, 2009. a, b, c
Tintoré, J., Vizoso, G., Casas, B., Heslop, E., Pascual, A., Orfila, A., Ruiz, S., Martínez-Ledesma, M., Torner, M., Cusí, S., et al.: Socib: The balearic islands coastal ocean observing and forecasting system responding to science, technology and society needs, Mar. Technol. Soc. J., 47, 101–117, 2013. a, b
Vousdoukas, M. I., Almeida, L. P. M., and Ferreira, Ó.: Beach erosion and recovery during consecutive storms at a steep-sloping, meso-tidal beach, Earth Surf. Proc. Land., 37, 583–593, 2012. a, b, c, d
Wang, P., Kirby, J. H., Haber, J. D., Horwitz, M. H., Knorr, P. O., and Krock, J. R.: Morphological and sedimentological impacts of Hurricane Ivan and immediate poststorm beach recovery along the Northwestern Florida barrier-island coasts, J. Coast. Res., 22, 1382–1402, 2006. a
Yepes, V. and Medina, J. R.: Land use tourism models in Spanish coastal areas, A case study of the Valencia region J. Coast. Res., 49, 83–88, 2005. a