the Creative Commons Attribution 4.0 License.
the Creative Commons Attribution 4.0 License.
 | 29 Nov 2018
Field survey of Typhoon Hato (2017) and a comparison with storm surge modeling in Macau
Chuan-Yao Lin
Constance Ting Chua
Yu Wang
Kuifeng Zhao
Yun-Ta Wu
Philip Li-Fan Liu
Adam D. Switzer
Kai Meng Mok
Peitao Wang
Dongju Peng
On 23 August 2017 a Category 3 hurricane, Typhoon Hato, struck southern China. Among the hardest hit cities, Macau experienced the worst flooding since 1925. In this paper, we present a high-resolution survey map recording inundation depths and distances at 278 sites in Macau. We show that one-half of the Macau Peninsula was inundated, with the extent largely confined by the hilly topography. The Inner Harbor area suffered the most, with a maximum inundation depth of 3.1 m at the coast. Using a combination of numerical models, we simulate and reproduce this typhoon and storm surge event. We further investigate the effects of tidal level and sea level rise on coastal inundations in Macau during the landfall of a “Hato-like” event.
- Article
(19117 KB) - Full-text XML
-
Supplement
(1134 KB) - BibTeX
- EndNote


On 23 August 2017, at approximately 12:50 local time Typhoon Hato made landfall near Zhuhai, which is located on the southern coast of Guangdong Province, China (Fig. 1). With an estimated 1 min sustained wind speed of 185 km h−1 near its center and a minimum central pressure of 945 hPa, Typhoon Hato was a Category 3 hurricane on the Saffir–Simpson scale. Typhoon Hato was one of the strongest typhoons to affect the coastal areas of the Pearl River Delta (PRD) in southern China over the last several decades. It caused widespread coastal flooding in the PRD area (ESCAP/WMO Typhoon Committee, 2017). Major cities in the northeast quadrant of the typhoon track, including Macau, Zhuhai and Hong Kong, were severely affected. The resulting maximum storm surge heights (water level above the astronomical tide) reached 1.62 m at A-Ma station in Macau, the highest since water level recording began in 1925. Elsewhere in the PRD area, a maximum storm surge of 2.79 m was recorded at Zhuhai, and 1.18, 1.65 and 2.42 m at Quarry Bay, Tai Po Kau and Tsim Bei Tsui in Hong Kong, respectively (HKO, 2017) (Fig. 1b). The extreme flooding in Macau was historically unprecedented in terms of the inundation depth as well as the extent, and more than half of the Macau Peninsula was inundated. Typhoon Hato's strong wind and the associated flooding resulted in 22 fatalities and caused USD 3.5 billion direct economic losses (Benfield, 2018).
Macau (and Hong Kong) commonly experiences about 5–6 typhoons per year (Lee et al., 2012) and as a result, the low-lying area in the western part of the Macau Peninsula has been frequently flooded by storm surges during major typhoons. Relatively recent typhoons such as Becky (1993), Hagupit (2008), Koppu (2009) and Vicente (2012) all generated storm surges that produced maximum inundation depths > 1 m in Macau, while the unnamed historical typhoons in 1927 and 1948 and Typhoon Gloria (1957) generated storm surges > 1.15 m (see historical flood records at http://www.smg.gov.mo/smg/database/e_stormsurge_historicalRec.htm, last access: 2 July 2018). Although frequently affected by storm surges, the extreme inundation brought by Typhoon Hato still caught Macau unprepared. Consequently, the local government has declared Typhoon Hato as the worst-case scenario and will use it as a criterion for designing new engineering measures for coastal protection.
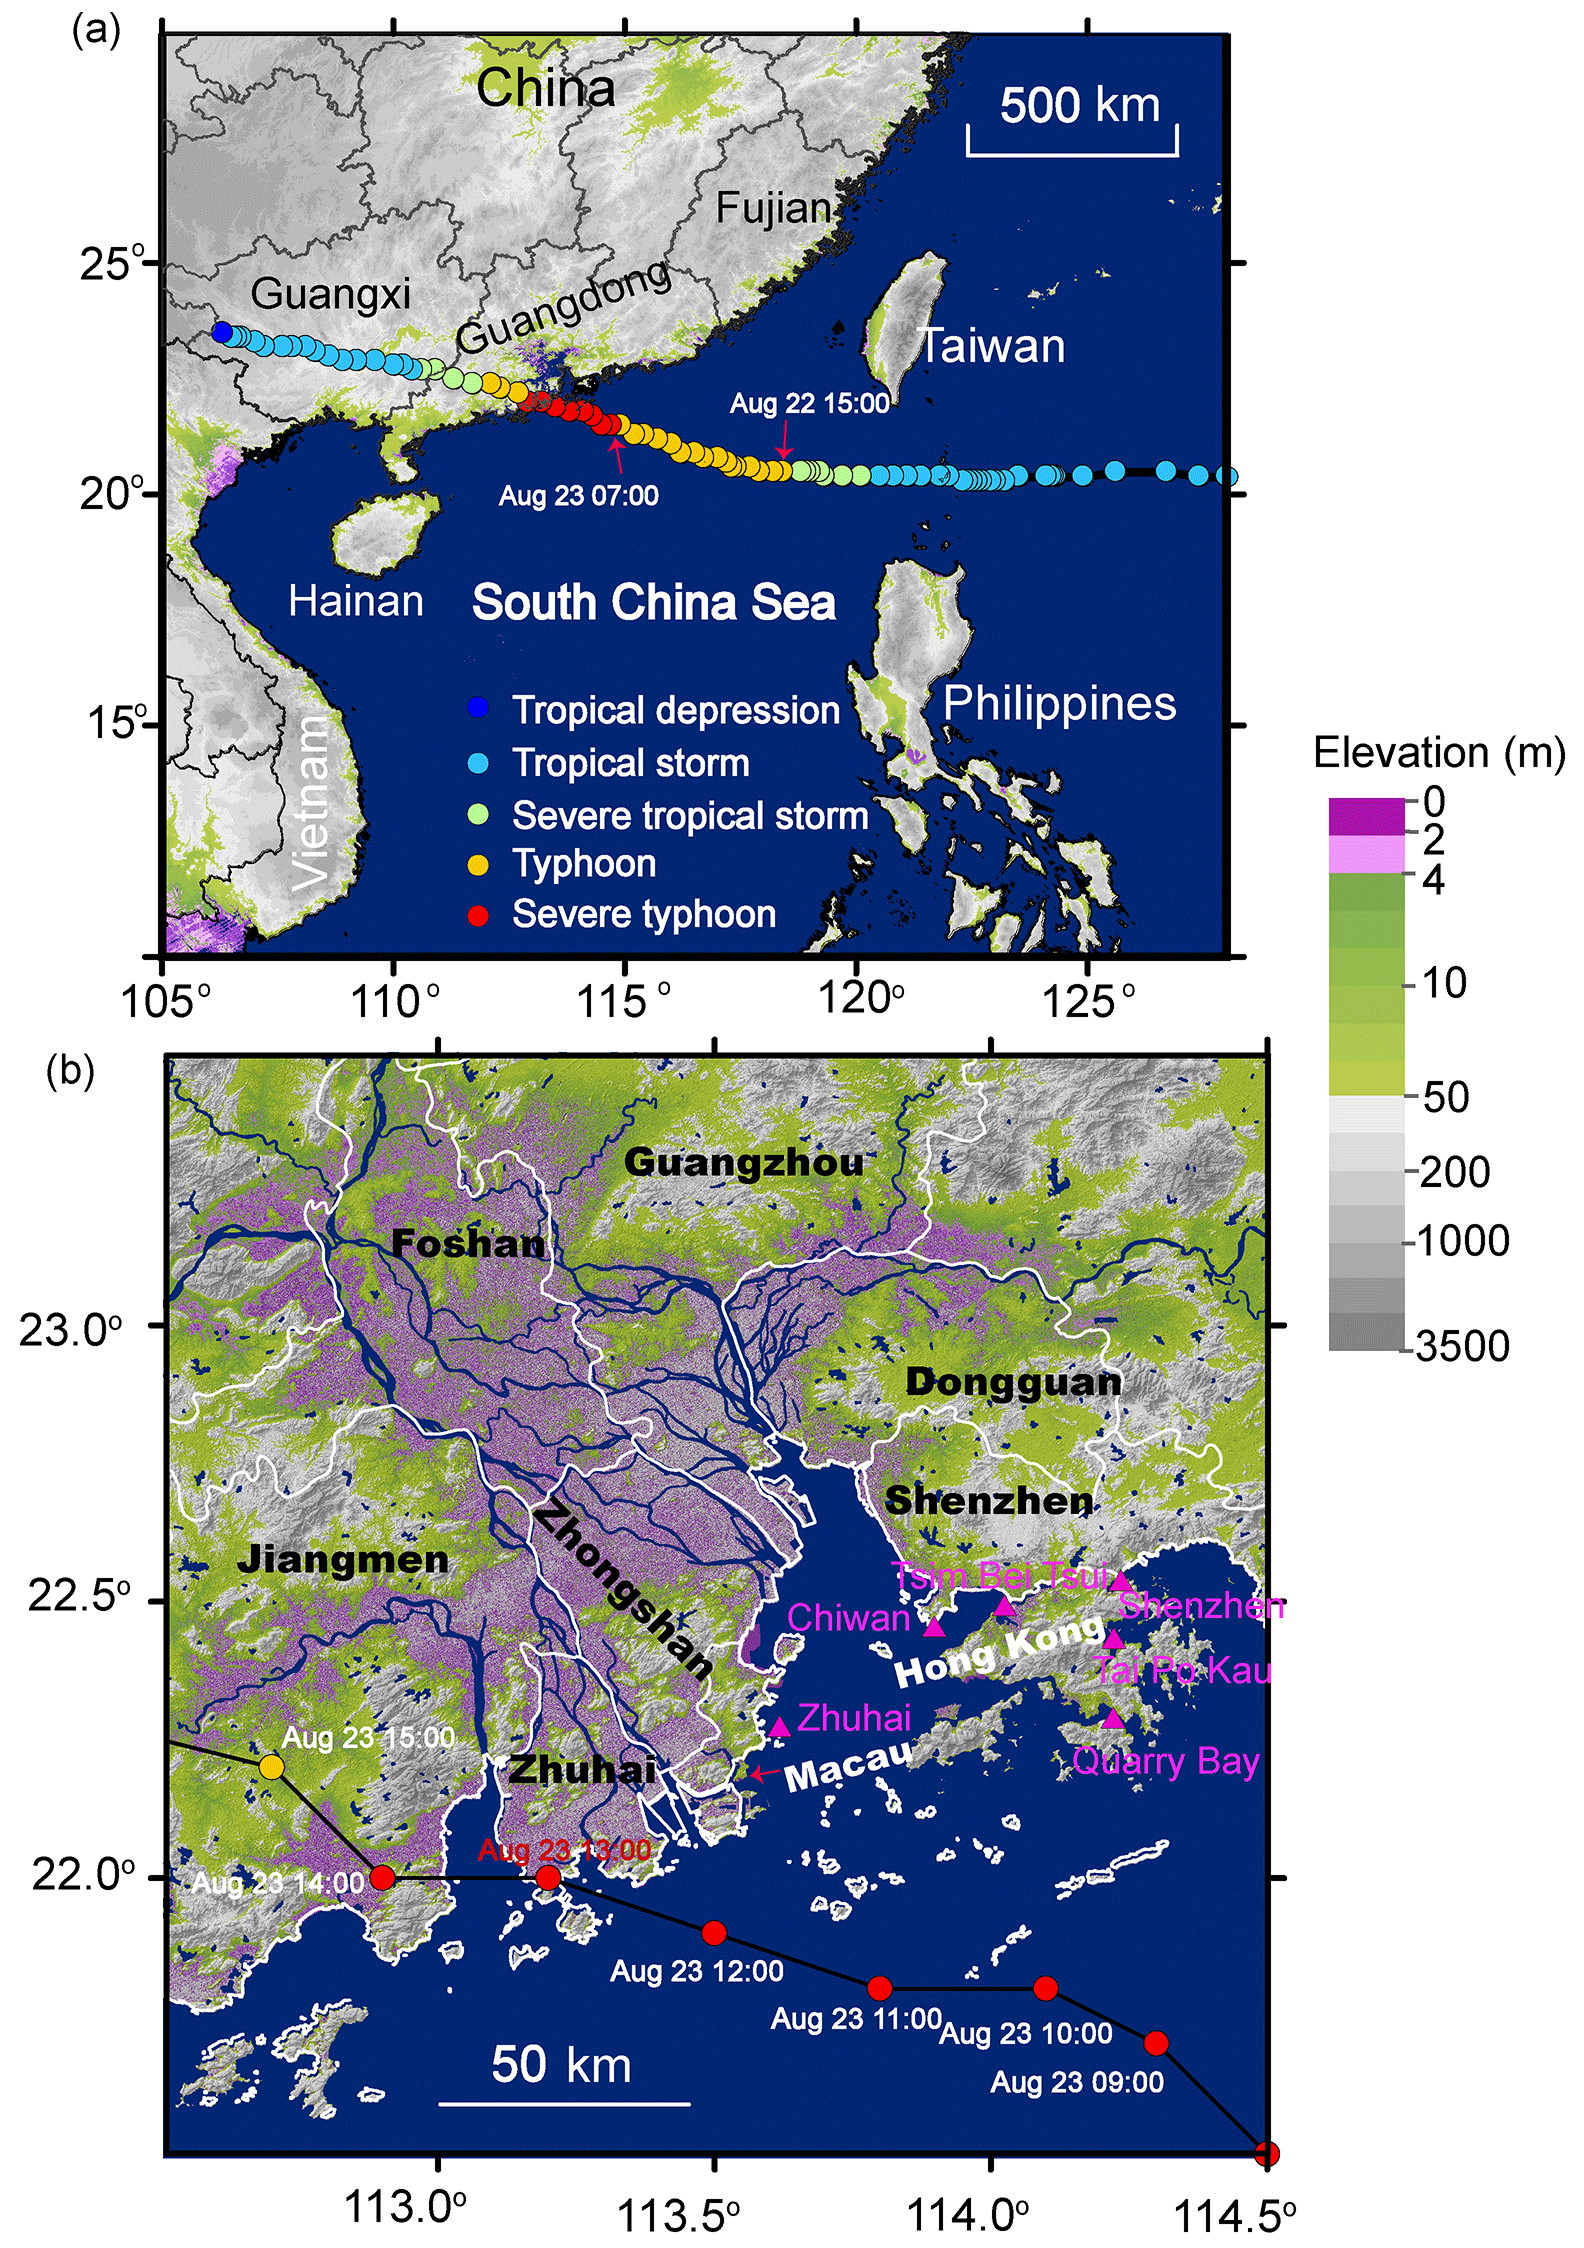
Figure 1Typhoon Hato track data from the Chinese typhoon weather website (http://typhoon.weather.com.cn/, last access: 30 June 2018). (a) Typhoon Hato took an extremely dangerous path to the PRD. It became a typhoon over the South China Sea at 15:00 on 22 August 2017 (local time) and further intensified into a severe typhoon at 07:00 on 23 August, before making landfall at 12:50 in the southern part of Zhuhai, China. (b) A close-up shows the landfall location and the affected cities in the PRD. Purple colors denote land elevation lower than 4 m above mean sea level.
While Typhoon Hato has caused the worst flood events in Macau's history, the key flood parameters (e.g., the water depth and inundation distance) have not been properly documented. Although Macau has 2 tidal gauge stations and 17 inland water gauge stations distributed in the areas susceptible to flooding (http://www.smg.gov.mo/smg/ftgms/e_ftgms.htm, last access: 5 July 2018), unfortunately, they all failed to record the peak water level due to breakdown or electrical interruption of devices during Hato (SMG, 2017). Therefore, post-event surveys of key flood parameters become essential for better understanding storm surge dynamics and inundation characteristics (e.g., Fritz et al., 2007; Tajima et al., 2014; Takagi et al., 2017; Soria et al., 2016). For this reason, our field survey team was deployed to Macau and Zhuhai on 26 August 2017 and collected flood and damage information for 5 days. Here, the survey data have been analyzed and used to produce a high-resolution inundation map of Macau.
Qualitatively speaking, several factors contributed to the exceptional damage during Typhoon Hato. (1) Typhoon Hato occurred during the second day of a lunar month and the landfall time roughly coincided with the astronomical high tide. (2) According to records, Typhoon Hato's wind speed was the strongest among all the typhoons in Macau since 1953. The peak wind gust reached 217.4 km h−1 at Taipa Grande station and broke the record of 211.0 km h−1 set by Typhoon Ruby in 1964 (SMG, 2017; Shan et al., 2018). (3) The translation wind speed of Typhoon Hato exceeded 30 km h−1 (Takagi et al., 2018) before its landfall, which is unusually high compared with the average transitional speed of 10–15 km h−1 in the South China Sea (SCS; Shan et al., 2018). (4) According to the Hong Kong Observatory, Typhoon Hato momentarily became a super typhoon during its approach towards the PRD in the morning of 23 August (HKO, 2017). The sudden intensification occurred because of the low vertical wind shear and the high sea surface temperature (SST) of ∼31 ∘C in the northern portion of the SCS (HKO, 2017).

It is well known that the tide during a typhoon's landfall plays a significant role in the severity of the storm-surge-induced inundation. In the case of Typhoon Hato, the coincidence of astronomical high tide and the landfall time is thought to be the major factor causing the widespread flooding in Macau. However, using the OSU TPXO-atlas8 tide model (Egbert and Erofeeva, 2002) and the tide gauge location (113.551∘ E, 22.167∘ N) in Macau, we estimated that the peak tidal level on the day of Hato's landfall occurred at 10:00 on 23 August 2017, with a tide level of 0.927 m above mean sea level (a.m.s.l.), while the estimated tidal level was only 0.470 m a.m.s.l. at the reported landfall time of Typhoon Hato at around 12:50 on 23 August 2017. Thus, Typhoon Hato actually made landfall almost 3 h after the peak tidal level, while the tidal level differences are almost 0.5 m. Thus, it is intriguing to ask the following: if Typhoon Hato had occurred at a different time with a lower or higher tidal level, how would the inundation areas change?
To provide a quantitative answer for the question posed above, a numerical simulation tool must be validated first. In this paper, the tide–surge–wave coupled hydrodynamic model, SCHISM (Semi-implicit Cross-scale Hydroscience Integrated System Model) (Zhang et al., 2016) is combined with the Weather Research and Forecasting (WRF) model (Skamarock et al., 2008) to simulate the entire Typhoon Hato event. High-resolution bathymetric data in the PRD and topographic data in Macau are employed for calculating coastal flooding. Model–data comparisons are performed to ensure that the wind fields are reproduced well by the WRF model. The field survey data (e.g., inundation depth and area) are used to check the accuracy of the storm surge model. Once the numerical model is validated, we can use it to conduct a series of numerical experiments to assess the possible impact of a “Hato-like” typhoon occurring at different tidal levels. Then looking at such a hazard event and its countermeasures from a long-term perspective, we examined the effect of sea level rise (SLR) on the inundation areas.
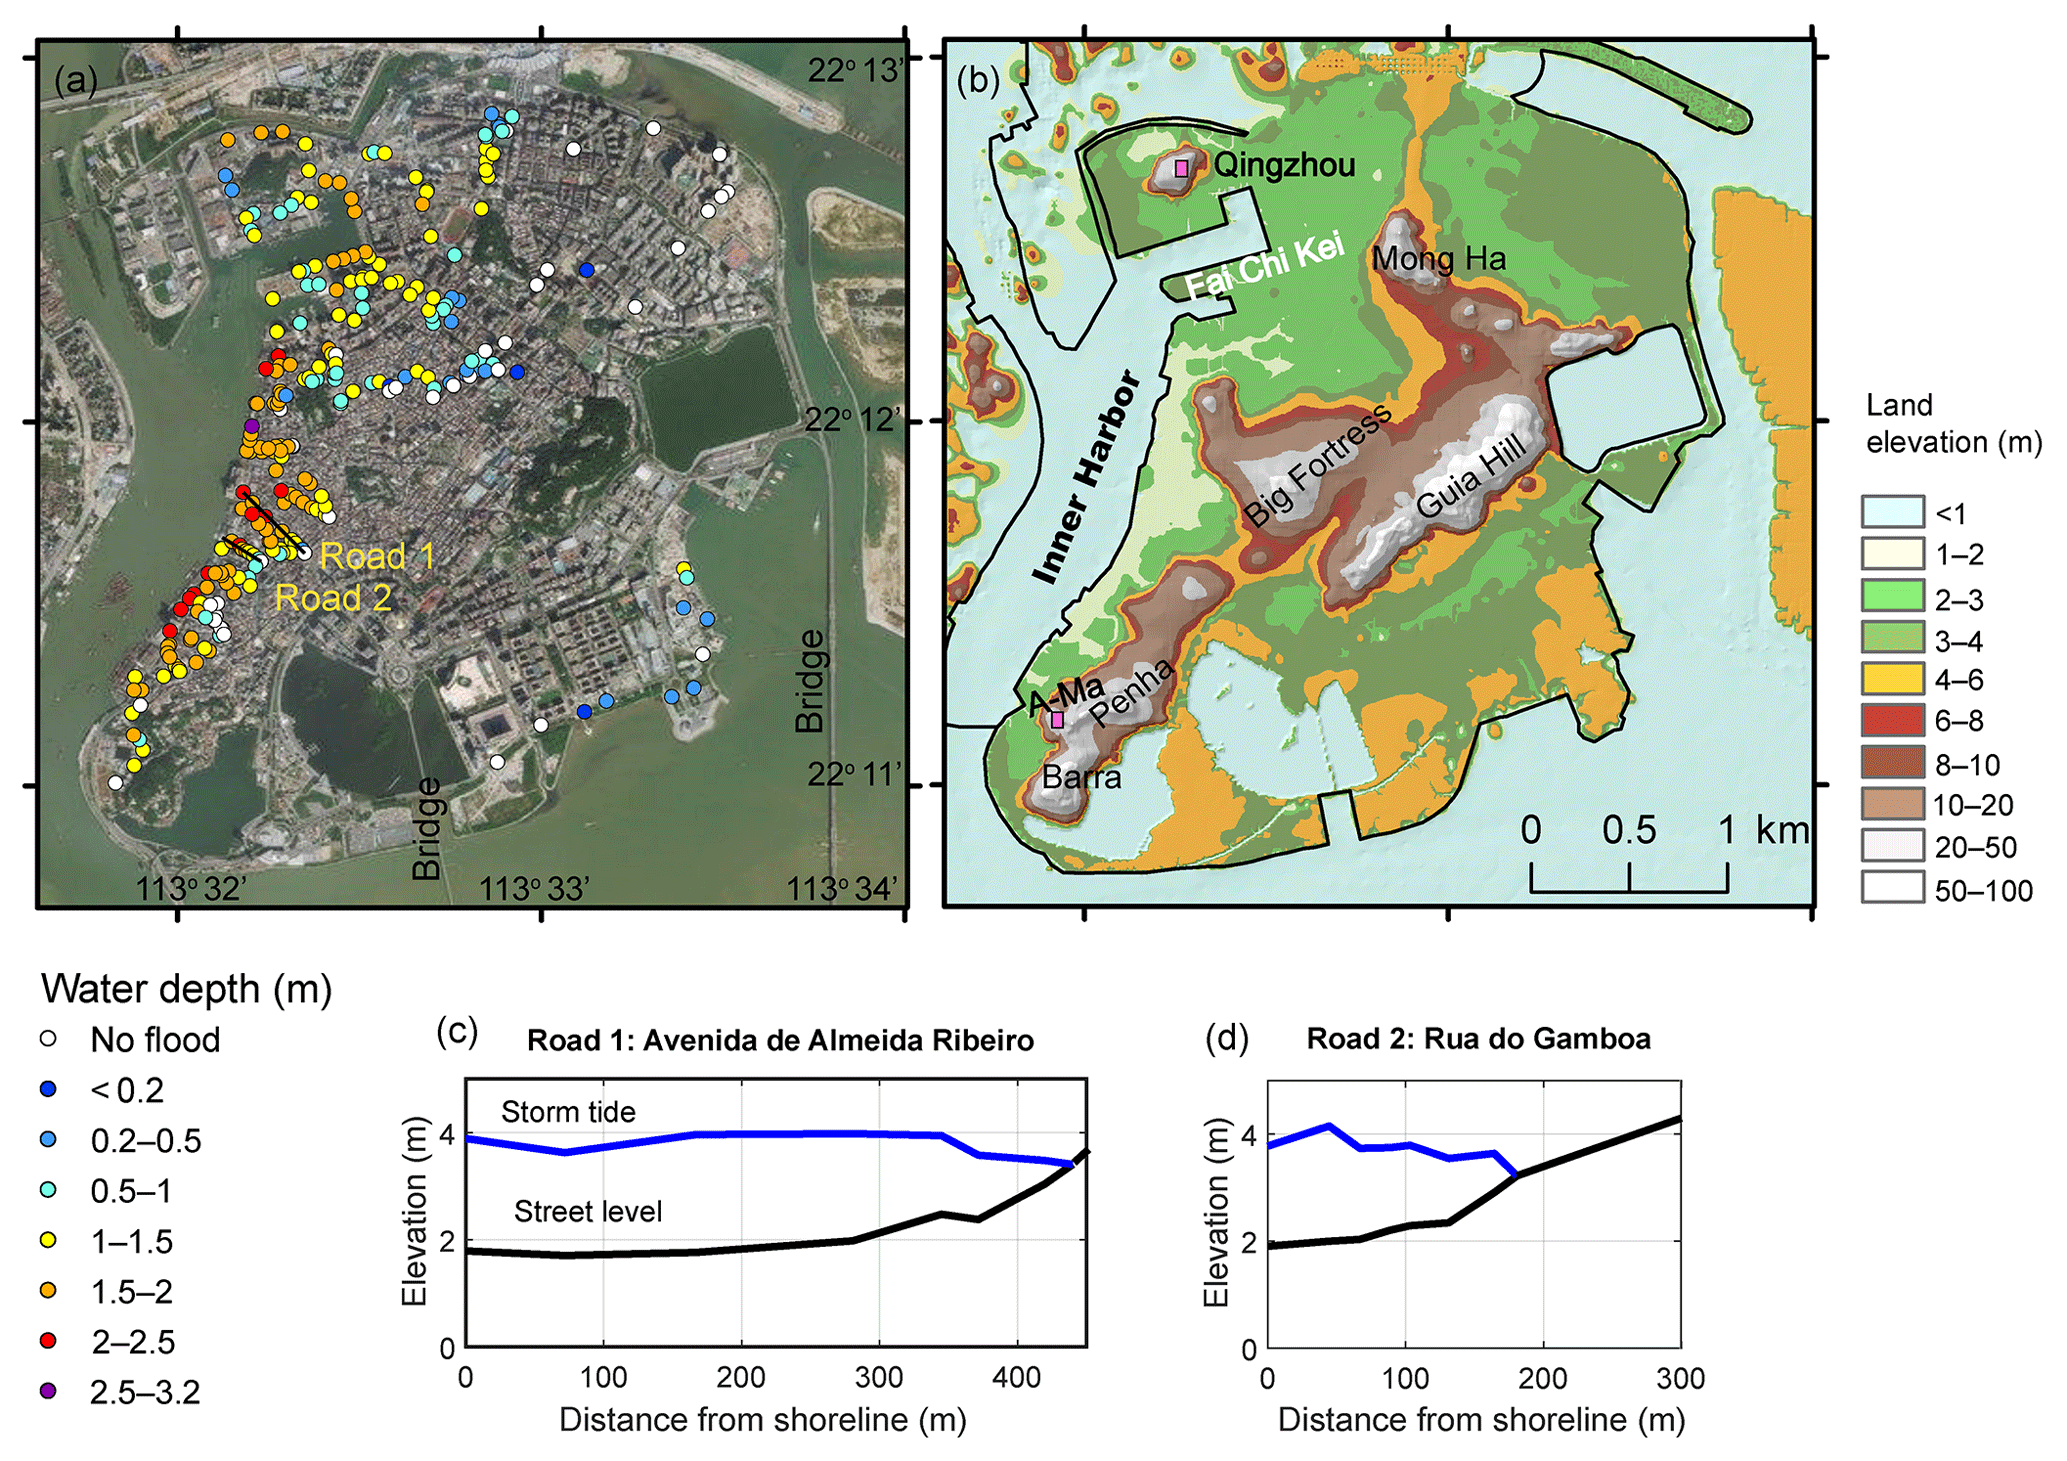
Figure 3(a) Measured inundation depths on the Macau Peninsula shown on a Google Earth image. (b) High-resolution bare ground elevation with marked locations. Panels (c) and (d) show profiles of surveyed inundation water depths along two main roads: Avenida de Almeida Ribeiro and Rua do Gamboa.
The paper is presented in the following order. We first report a high-resolution inundation map of Macau based on our field measurements and observations. Then we describe each component of the numerical simulation package, followed by the simulation results of Typhoon Hato. Finally, we discuss the effect of tidal level and SLR through the results of numerical experiments.
On 26 August 2017, 3 days after Typhoon Hato made landfall, our survey team arrived at Macau, where they surveyed ∼300 sites in Macau Peninsula, measuring flow depths (water depth above street level), maximum run-up and inundation distances (Table S1 in the Supplement). The team also recorded building damage. The team was able to conduct interviews with many shopkeepers, homeowners and security officers, who witnessed this flood event. The maximum inundation depths were mainly determined by using watermarks as indicators and where possible confirmed by eyewitnesses. Watermarks identified on glass panels, iron gates and light colored walls were photographed (Fig. 2) and located using GPS. Inundation extent was determined by tracing watermarks from the coastline to the inundation limit along streets perpendicular to the coastline. Distances between two surveyed sites were about 20–25 m apart to ensure the high resolution of this survey map. In total, 278 inundation depths were recorded and eyewitnesses confirmed 96 (35 %) of them (Table S1).
Figure 3a shows the surveyed inundation depths on the Macau Peninsula. Names of the locations are marked on a high-resolution bare ground elevation map in Fig. 3b. The Inner Harbor area, which starts from A-Ma Temple in the southwest and ends at Qingzhou in the northwest of the Macau Peninsula, was completely flooded to a depth of 3.1 m at Ponte Pou Heng (purple dot in Fig. 3a). Along the coastal roads of the Inner Harbor, inundation depth reached 2.0–2.5 m in many low-lying places. When tracing the watermarks along the two major streets, Avenida de Almeida Ribeiro and Rua do Gamboa, we observe that, as the seawater penetrated inland, the inundation depth gradually decreased from > 2 to ∼1 m (Fig. 3c–d). The inundation extent was clearly confined by the hilly topography (Fig. 3a–b). From south to north, the steep topography of the local hills acted as a natural barrier, limiting flood propagation. In contrast, the relatively flat (2–3 m a.m.s.l.) northwest area surrounding Fai Chi Kei experienced inundation distances of up to ∼1.3 km inland (Fig. 3a–b). The coastal area in the northeast was largely spared due to the seawall protection and slightly higher elevation, while the southeast coastal area was slightly flooded by less than 1 m surge with limited inundation distance (< 50 m). Considering the size of the Macau Peninsula, which is ∼3 km E–W and ∼4 km N–S, nearly half of the peninsula was inundated during Typhoon Hato (Fig. 3a).
Notably, many eyewitnesses commented that this flooding event was characterized by a rapid rising speed; shopkeepers in the Inner Harbor area stated that seawater rose quickly from ankle level to chest-high in less than 20 min, leaving them no time to rescue property or possessions on the ground floor. The ground floors of most buildings in Macau are used for commercial purposes, which partly explains why Macau suffered from economic loss exceeding USD 1.42 billion (HKO, 2017). Although residents who live in the Inner Harbor area are experienced in battling chronic flooding caused by storm surges, the extreme flood caused by Typhoon Hato still came as a surprise for them in many ways (e.g., its speed, depth and extent). In one of the interviews, an elderly resident who lives on Rua do Gamboa used the length of his body as a yardstick to describe the height of floodwater from previous events. He explained that Typhoon Becky (1993) had resulted in approximately 1.4 m floodwater where he lives, 1.2 m during Typhoon Hagupit (2008) and 0.3 m during Typhoon Vicente (2012), and this time Typhoon Hato had resulted in a 2.1 m flood height.
The survey data presented in this study are complementary to the data provided by an earlier study (Takagi et al., 2018) in terms of the number of surveyed locations and spatial coverage. Takagi et al. (2018) provided 12 data points in Macau and Hong Kong, while our 278 data points are concentrated in Macau, with the purpose of constructing a measured high-resolution inundation map. Such a map provides not only valuable documentation of such a rare and extreme event, but also validation data for numerical modelers.
The WRF model (version 3.8.1) (Skamarock et al., 2008) is used to generate the wind and pressure fields of Typhoon Hato. The initial and meteorological boundary conditions for WRF were obtained from the National Center for Environmental Prediction (NCEP) Global Forecast System (GFS) with analysis data sets at a 6 h interval. The time-varying SST was obtained from the 0.5∘ NCEP real-time global data set. The planetary boundary layer of the Yonsei University boundary layer scheme (Hong et al., 2006) was used with the revised MM5 similarity surface layer scheme (Jiménez et al., 2012) and the unified Noah land surface model (Tewari et al., 2004) over land. The single-moment five-class microphysics scheme (Hong et al., 2004), the updated Kain–Fritsch scheme (Kain, 2004) with a moisture-advection-based trigger function (Ma and Tan, 2009) and the Rapid Radiation Transfer Model for Global Circulation Models (RRTMG) shortwave and longwave schemes (Iacono et al., 2008) are also adopted in this study. The horizontal resolution of the model is 3 km and the grid box had 921×593 points in both E–W and N–S directions. There were 45 vertical levels with the lowest level approximately 50 m above the surface. The output time interval of wind and pressure fields is 10 min.
The output wind and pressure fields from the WRF results are then used to drive the storm surge simulation in the tide–surge–wave coupled hydrodynamic model SCHISM (Zhang et al., 2016), which is a derivative code of the original SELFE (Semi-implicit Eulerian–Lagrangian Finite Element) model. The SCHISM system has been extensively tested against standard ocean and coastal benchmarks and applied to several regional estuaries for storm surge inundation modeling (Krien et al., 2017; Wang et al., 2014). In this study, the model is used in the 2DH barotropic mode, which solves nonlinear shallow water equations on unstructured meshes for storm surges. To track the coastline movements, the model includes an efficient wetting–drying algorithm by using semi-implicit time stepping and the Eulerian–Lagrangian method for advection (Zhang and Baptista, 2008).
The bottom shear stress is modeled by Manning's formula, with the Manning coefficient being set to 0.025 for the inland area (area above mean sea level) and 0.01 for the offshore area. The values of the Manning coefficient are informed by previous studies (e.g., Martyr et al., 2013; Garzon and Ferreira, 2016). We choose a relatively low Manning value for the estuary and open sea area as the sediment in the PRD is dominated by very fine sand (mainly silt clays) (Jiang et al., 2014). The drag coefficient for the surface wind stress is computed according to Pond and Pickard (1998). The model is forced by applying tidal elevation series on nodes along open ocean boundaries, which are extracted from the OSU TOPEX/Poseidon Global Inverse Solution model TPXO-atlas8 (Egbert and Erofeeva, 2002).
To capture the effects of wind waves in the storm surge simulation, the spectral Wind Wave Model (WWMIII) is employed. WWMIII solves the wave action equations in the frequency domain on the same unstructured grid as SCHISM. Physical processes including wave growth and energy dissipation due to whitecapping, nonlinear interaction in deep and shallow waters and wave breaking are all considered in the simulations. The WWMIII is dynamically coupled with SCHISM every 600 s. The radiation stress is estimated according to Roland (2008) based on the directional spectra itself. The radiation stresses computed in WWMIII are transferred to SCHISM at each step to update water level and velocity, which are sent as reverse feedback.
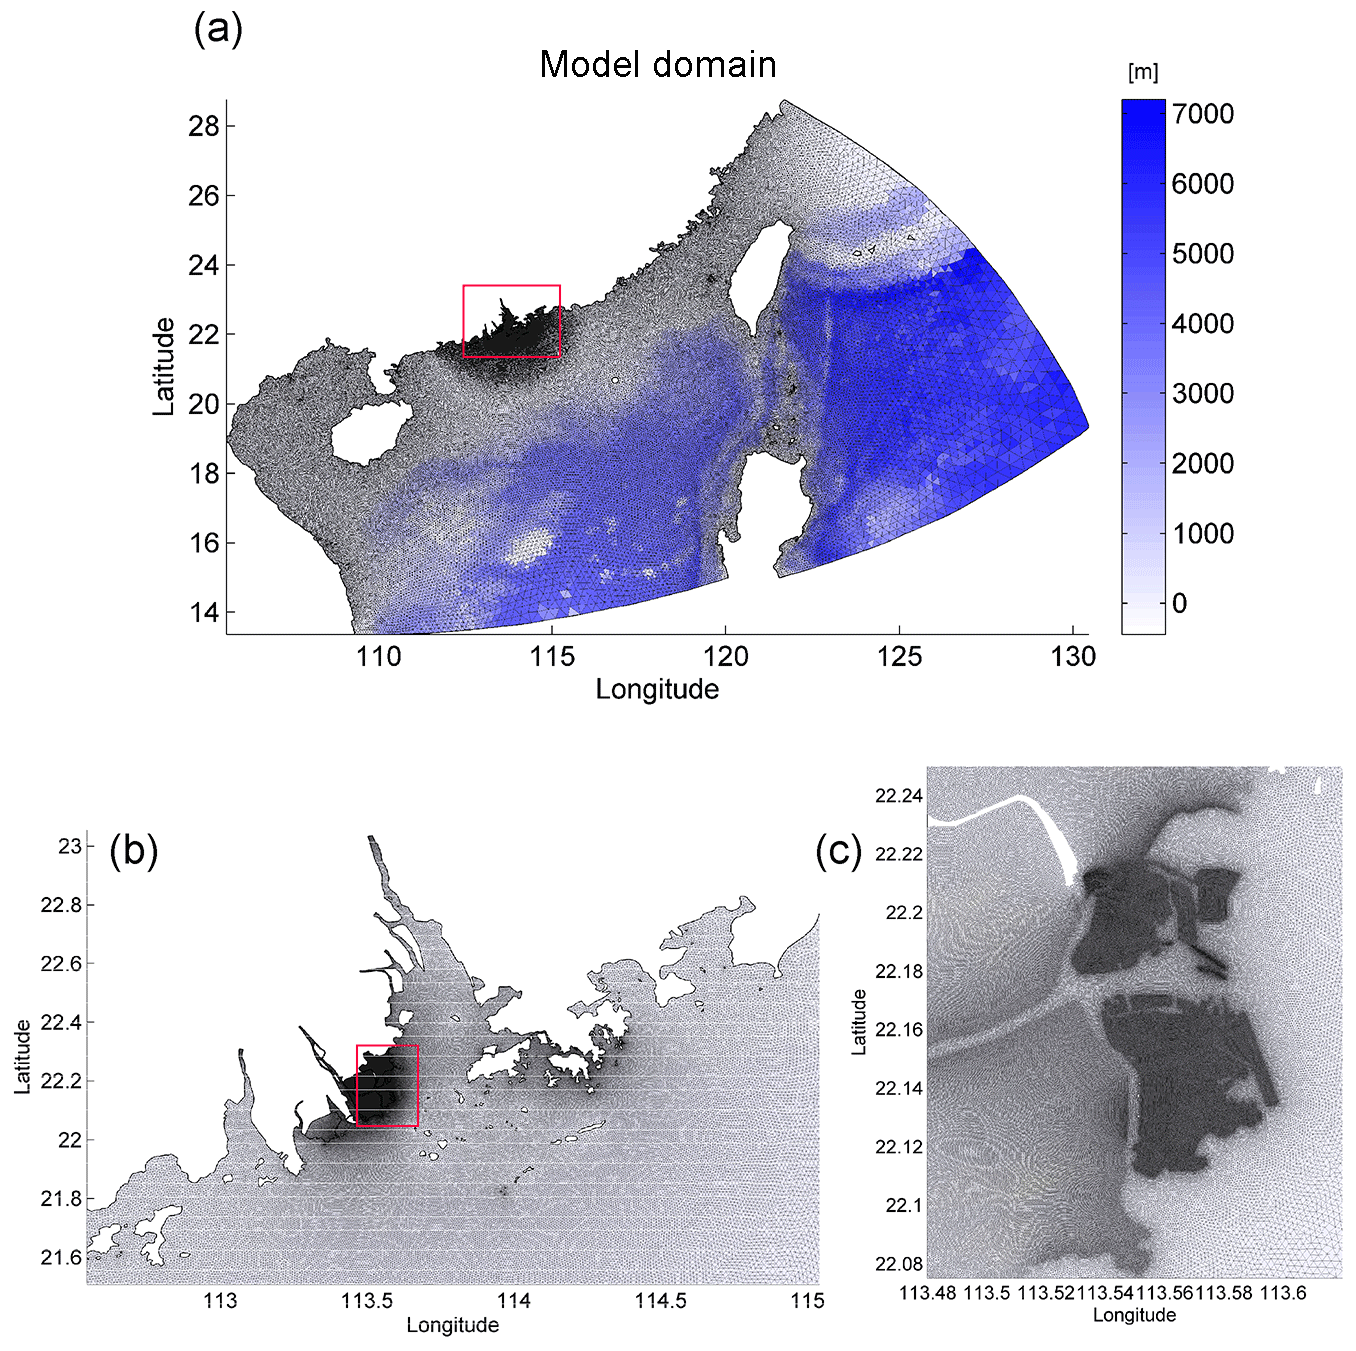
Figure 4(a) The numerical simulation domain for SCHISM–WWMIII, with close-ups showing (b) the mesh in the PRD and (c) the mesh near Macau.
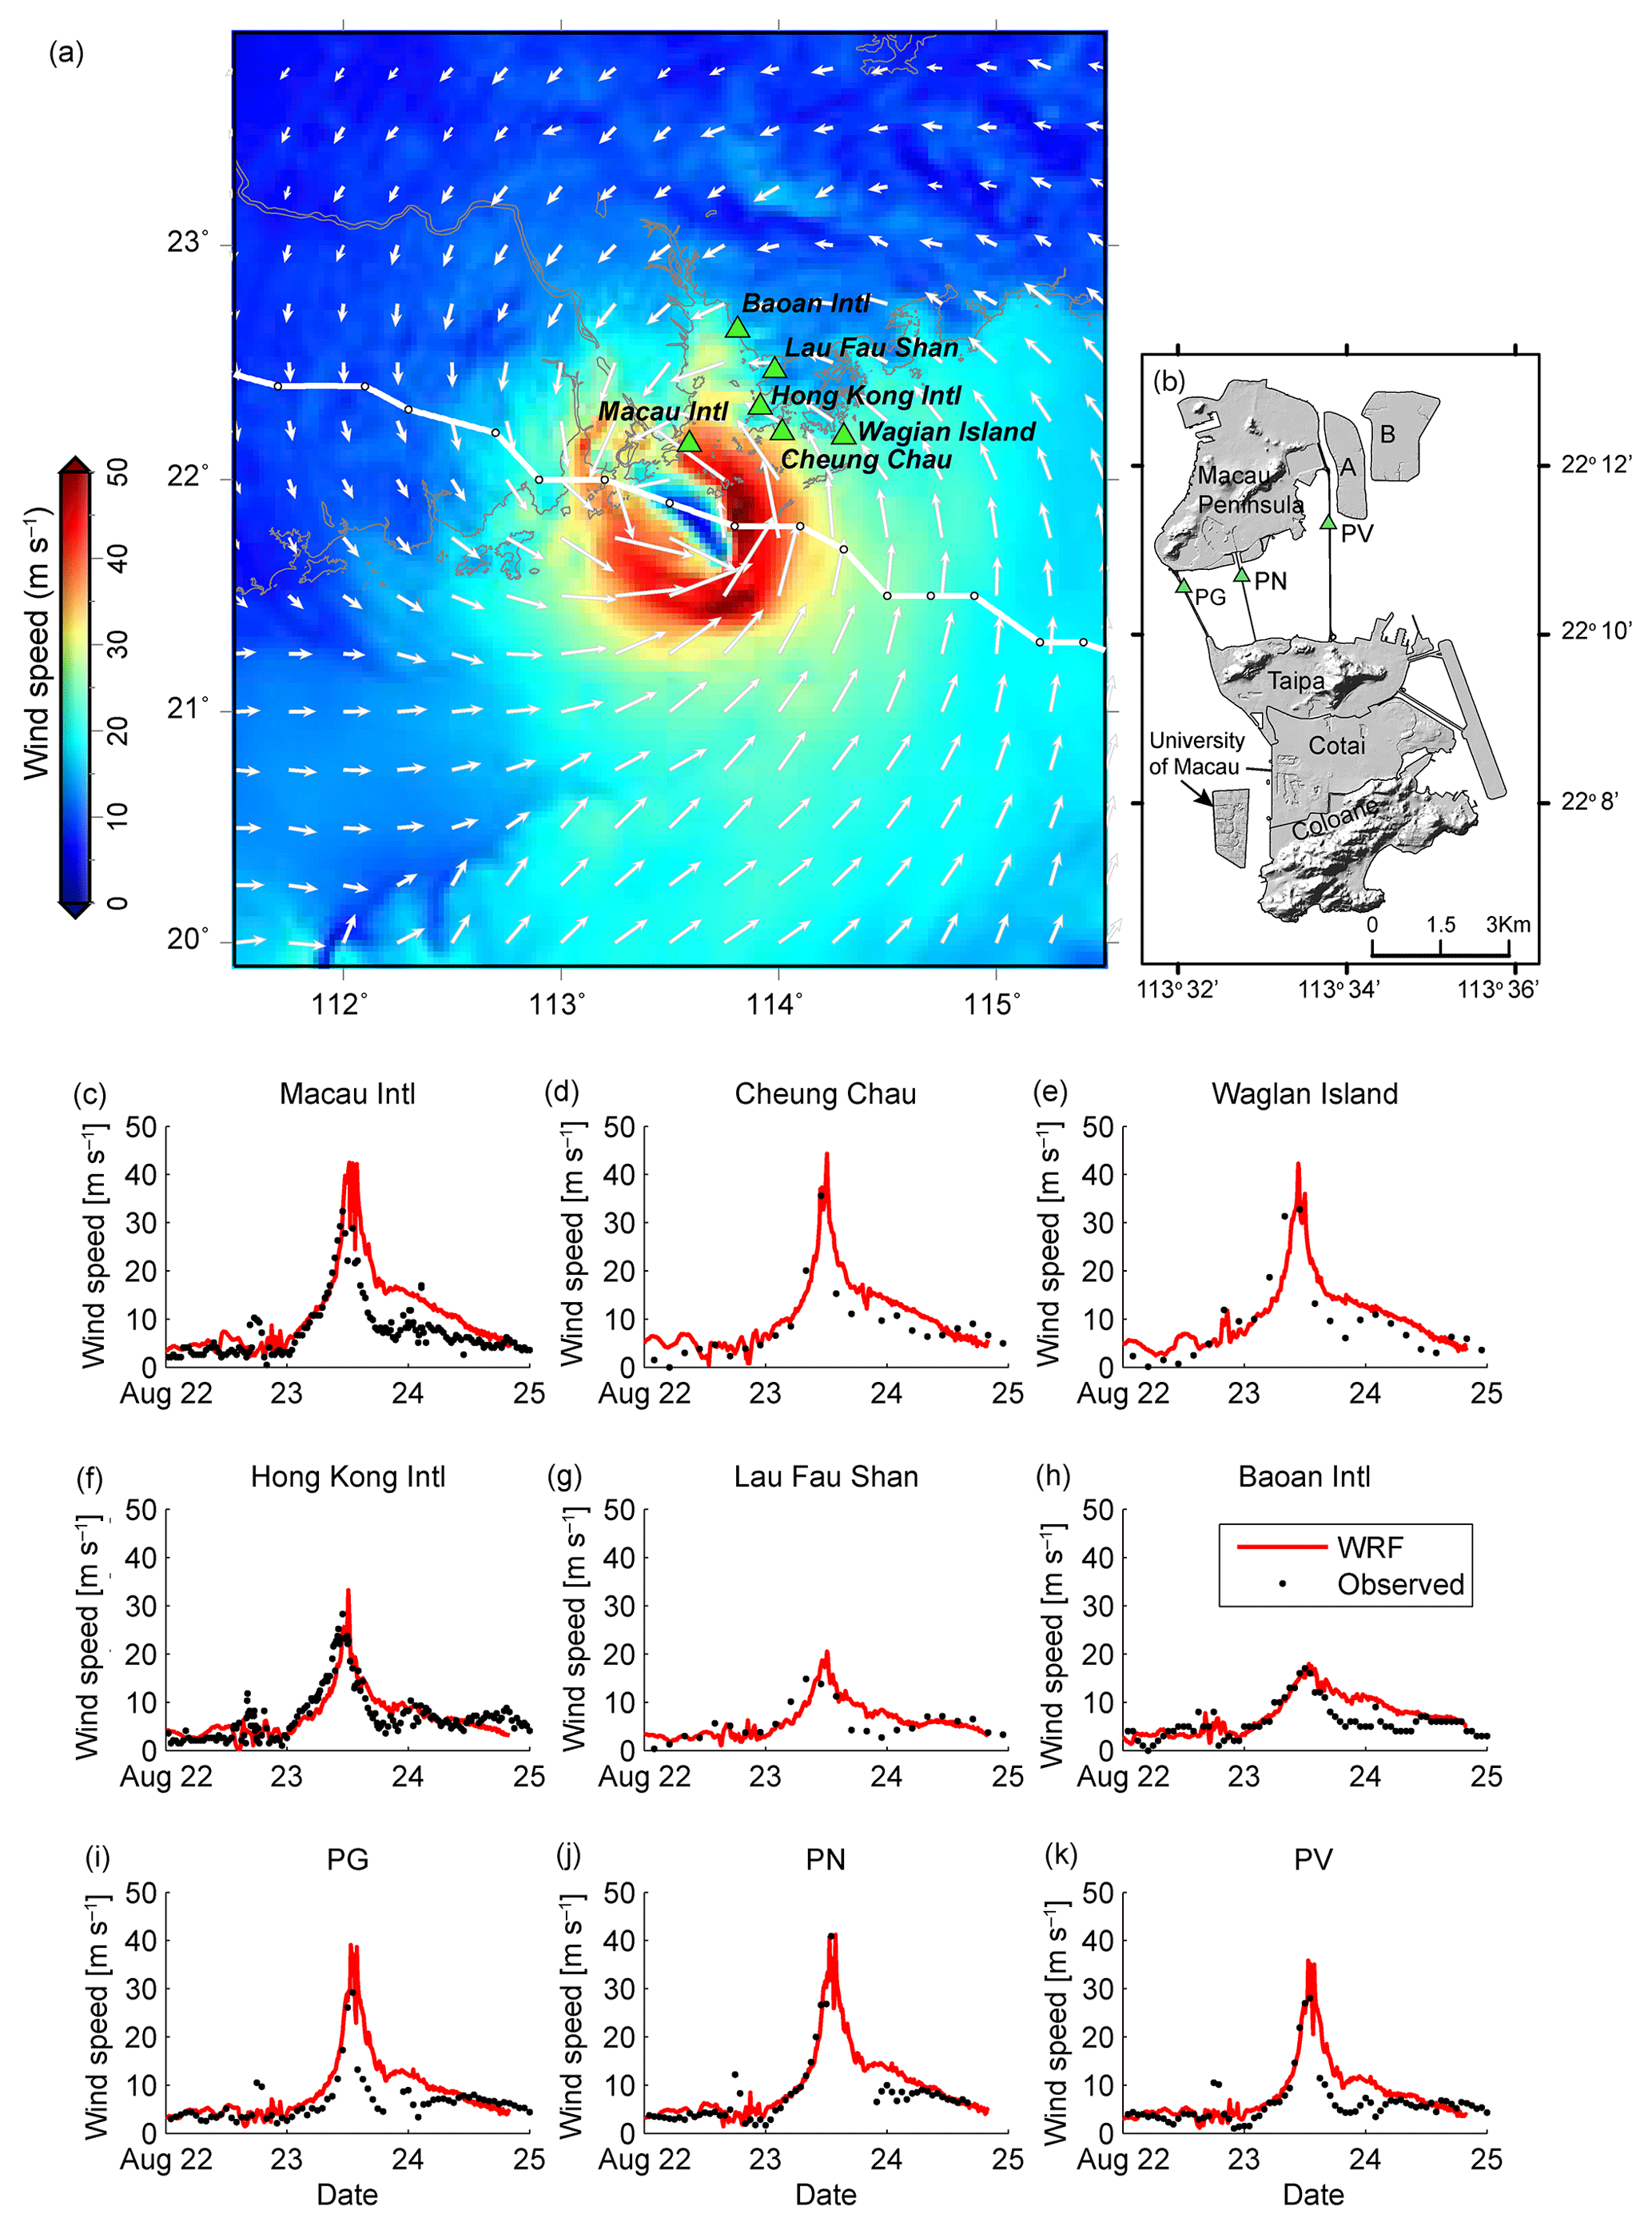
Figure 5Wind fields generated by the WRF model (a) in the PRD at 12:50 on 23 August, (b) the wind gauge locations of PG, PN and PV in Macau and (c)–(k) comparisons of numerical results (WRF) with measured wind speed at different locations. Locations and names of wind gauges (c)–(h) are shown in Fig. 5a.
For Typhoon Hato, the simulation domain covers the northern part of the South China Sea (Fig. 4a). We create an unstructured grid with horizontal resolution varying from 50 km in the deep sea, ∼1 km over the shelf to ∼20 m in the vicinity of Macau (Fig. 4b–c). To ensure the accuracy and reliability of the simulation results, we integrated as many available topographic and bathymetric data as possible. (1) The bathymetric data in the PRD are integrated from 36 nautical charts, with scales ranging from 1:5000 to 1:250 000. (2) High-resolution topographic data for Macau are purchased from the Macau Cartography and Cadastre Bureau. (3) The 1-arc Shuttle Radar Topography Mission (SRTM) data covering the PRD are used. (4) The 5 m elevation is specified for the two artificial islands on the eastern side of the Macau Peninsula, which are still under construction. The topographic and bathymetric data were complemented by 30 arcsec General Bathymetric Chart of the Oceans (GEBCO) data and integrated into one data set after being adjusted to mean sea level (m.s.l.). Using this model setting, we validated the tidal current model performs well when comparing the simulated tidal cycle with measured data from 1 to 30 November 2014 (Fig. S1 in the Supplement).
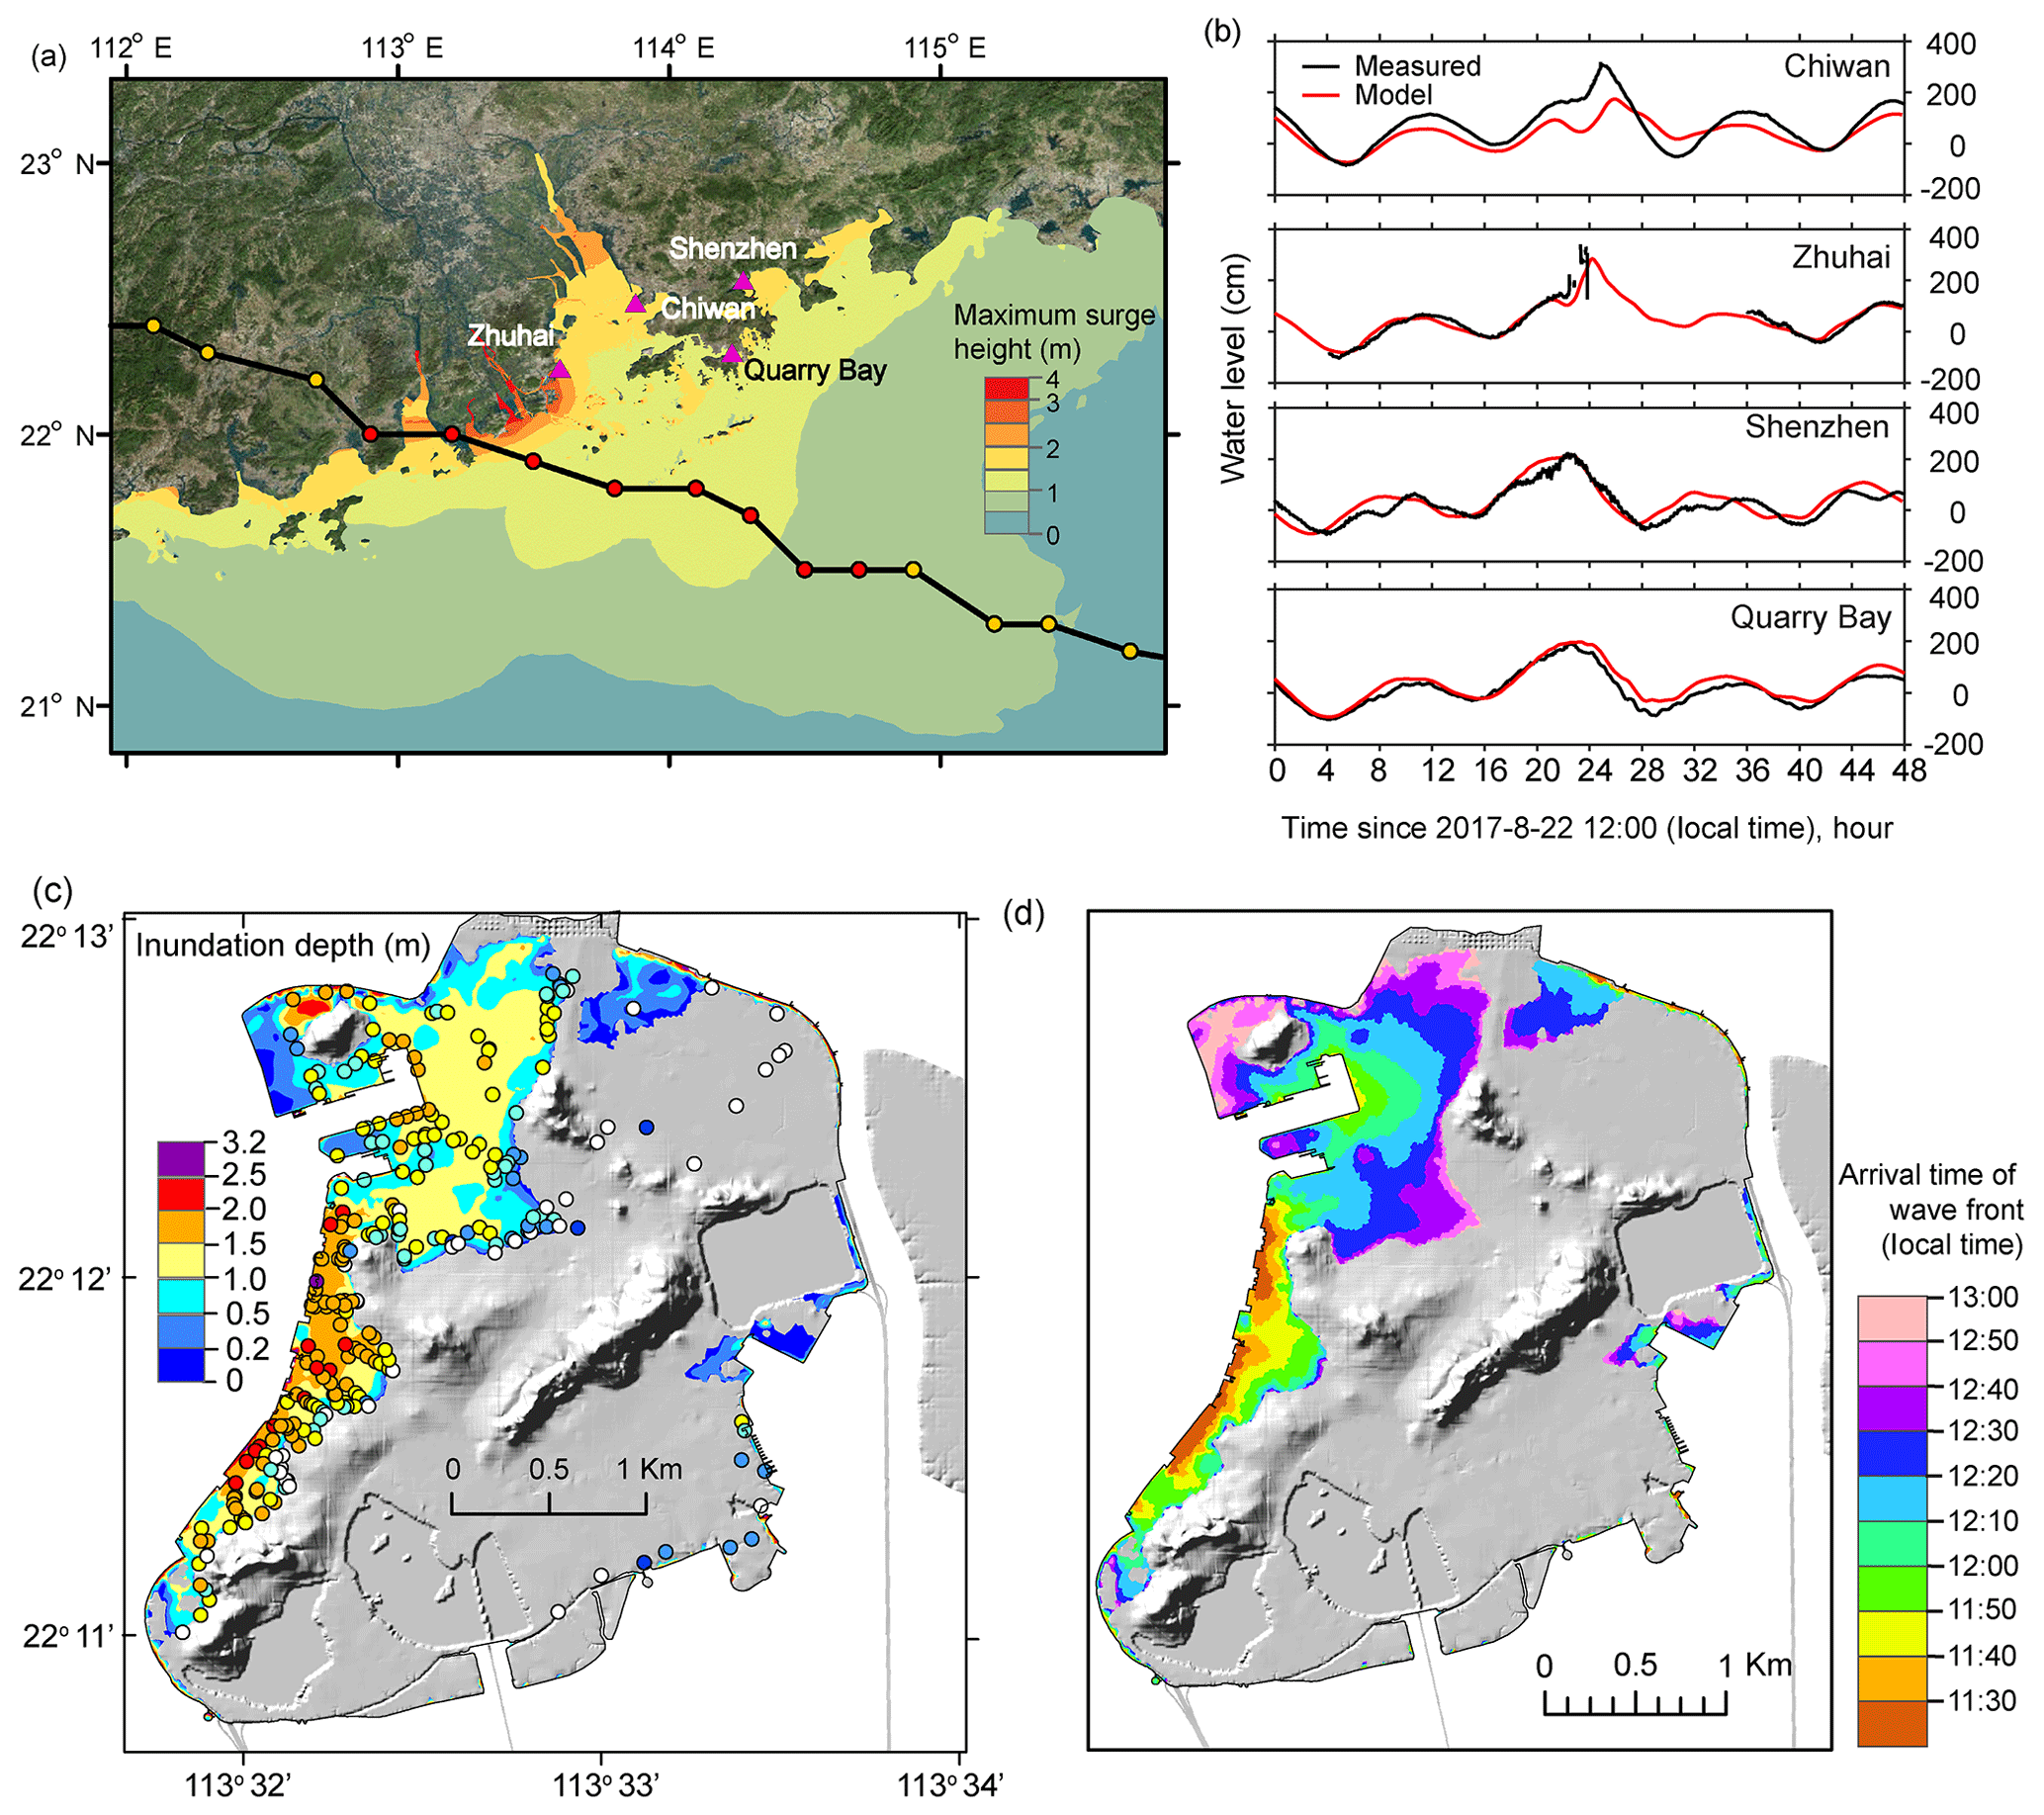
Figure 6Numerical results capture the key features of storm flooding induced by Typhoon Hato well. (a) The simulated maximum surge height in the PRD. (b) A comparison of simulated and measured storm tide at four selected tide locations (marked with the green dots in Fig. 5a). Note the measured data at Zhuhai station are not complete due to a power cut. (c) The surveyed inundation depths (the colored dots) overlaid on the simulated maximum inundation depths in the Macau Peninsula. (d) The arrival time of the flood wave front.
4.1 Simulation results of Typhoon Hato
We first compare the wind speeds generated by WRF with the measured data at nine selected wind gauge stations in the PRD (Fig. 5c–k), including four local wind gauges in Macau (see the gauge locations in Fig. 5a–b). The model–data comparison shows that the WRF model captures Typhoon Hato's wind fields well in terms of both the peak wind speed and the phase (Fig. 5c–k).
The simulated maximum surge heights in the PRD (Fig. 6a) show that the storm surge heights on both sides of the PRD varied widely, ranging from 0 m to 4.5 m. Surge heights > 2.5 m occurred on much of the western side of PRD including Macau. Wave amplification effects and the funnel-shaped coastline in the PRD also likely led to larger surge heights in the inner estuary area. To validate the numerical results, we compare the simulated storm tides with the measured storm tides at four selected locations (Fig. 6b). Very reasonable agreement is observed, ensuring the reliability of the modeling approach used in this study.
We further compare the simulated and measured inundation maps in Macau (Fig. 6c). The calculated inundation depths are slightly lower (∼10 %) than the measured ones in some locations near the coastline of Fai Chi Kei and the southern part of Inner Harbor and several inland locations in the Inner Harbor area (see the locations in Fig. 3b). The underestimation is likely the by-product of the bare-ground topographic data used in the simulation, which do not include buildings, and hence exclude complex flow patterns (e.g., wave front colliding with buildings) and channeling effects, which locally increase water depth. Nevertheless, the overall agreement is quite good. It demonstrates that the coupled model can reproduce this flood event reasonably well in terms of both inundation depth and extent.
In Fig. 6d we also plot the simulated arrival time of the wave front, which can be viewed as the arrival time of the surge. During Typhoon Hato the surge wave arrived in the southern part of Inner Harbor first at around 11:20 local time on 23 August 2017 and then propagated eastward inland and northward in the Fai Chi Kei direction in the next 1.5 h. The flow velocity was less than 0.5 m s−1 in the southern part of Inner Harbor due to the generally steep slope, while in the area surrounding Fai Chi Kei, the flow velocity was faster and was up to 0.7–0.8 m s−1. When comparing this with the 2–5 m s−1 tsunami flow velocity recorded in Banda Aceh during the 2004 Indian Ocean tsunami (Fritz et al., 2006), the 0.5–0.8 m s−1 flow velocity of storm tide in Macau is significantly smaller. Information like this demonstrates that numerical models and field surveys can complement each other and build a comprehensive view of the disaster scene.
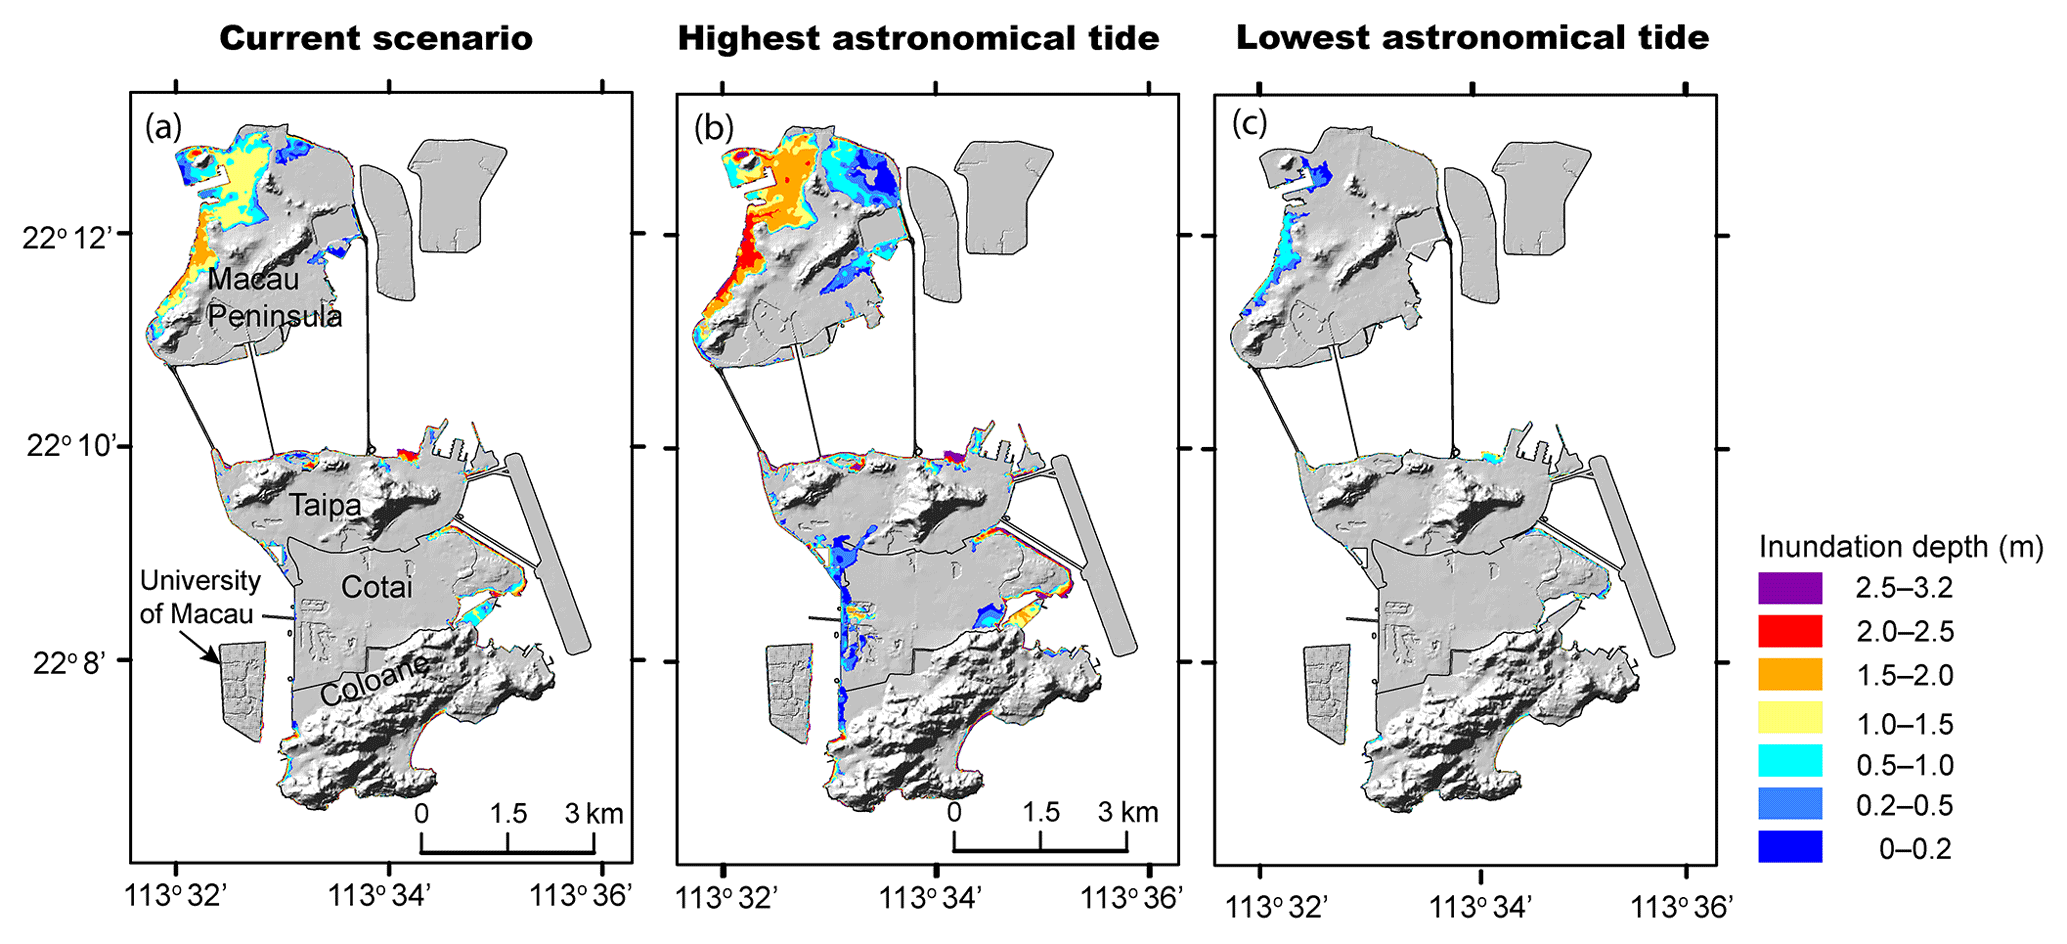
Figure 7Maximum inundation depths for (a) the benchmark scenario, (b) the highest extreme tide and (c) the lowest extreme tide under current sea level.
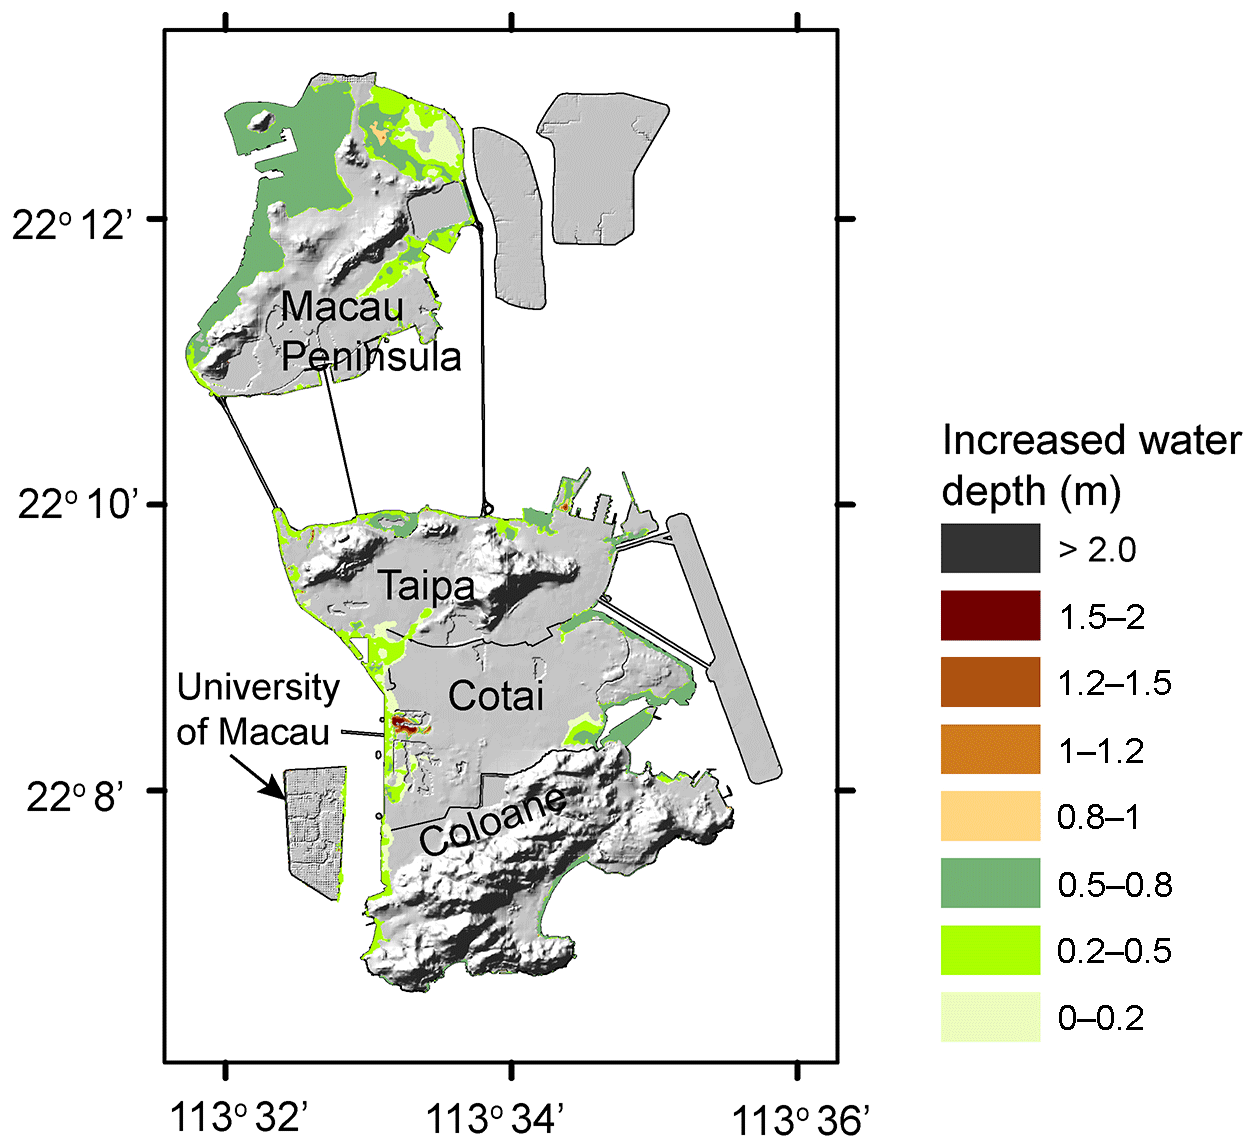
Figure 8A map showing the difference between the maximum inundation during the benchmark scenario (Fig. 5a) and the highest extreme tide under current sea level.

Figure 9Maximum inundation depths during the highest extreme tide under (a) 0.5 m SLR and (b) 1 m SLR. Maximum inundation depth during the lowest extreme tide under (c) 0.5 m SLR and (d) 1 m SLR. A map showing the difference between the maximum inundation during the benchmark scenario (Fig. 7a) and the highest extreme tide under (e) 0.5 m SLR and (f) 1 m SLR.
4.2 The effects of tidal level
Having checked our numerical model with measured data and demonstrated that the model can replicate events like Typhoon Hato, we now investigate the effects of tidal level on coastal flooding. Most of the PRD including Macau has a mixed semidiurnal tidal cycle in which the semidiurnal lunar tide, M2, is the predominant component, followed by K1, O1 and S2. The maximum tidal range observed in Macau is 2.86 m, while the difference between mean high water and mean low water is 1.11 m (calculated from the tide record during 1985–2012).
To quantitatively investigate the impact of tidal level at Hato's landfall, we first selected two extreme tidal levels from the years of 1964–2017 using the OSU TPXO-atlas8 tide model. The reason we use more extreme tidal levels is because scenarios under those tidal levels can provide the upper and lower bounds of the potential inundations, thus better demonstrating the effect of tidal level. On the other hand, we observe that the peak tidal level on the day of Typhoon Hato's landfall was only moderately high compared with the daily higher high water records (HHW) in Macau (Fig. S2), although it was the third highest during that month. Putting this peak tide of 0.927 m in all the estimated daily HHW, we can see that this value is lower than 21 % of the daily HHW during 1964–2017 (Fig. S2 shows the HHW and LLW during 2008–2017 as an example). We find that the corresponding highest extreme tide (HET) and the lowest extreme tide (LET) occurred on 1 January 1987 at 22:00 and 2 January 1987 at 06:00, respectively, with the tide 1.304 m a.m.s.l. and 1.165 m below m.s.l. We then conduct storm surge simulations at these two selected extreme tidal levels by moving the typhoon landfall time from 13:00 (UTC+8) on 23 August 2017 to 1 January 1987 at 22:00 and 2 January 1987 at 06:00 local time.
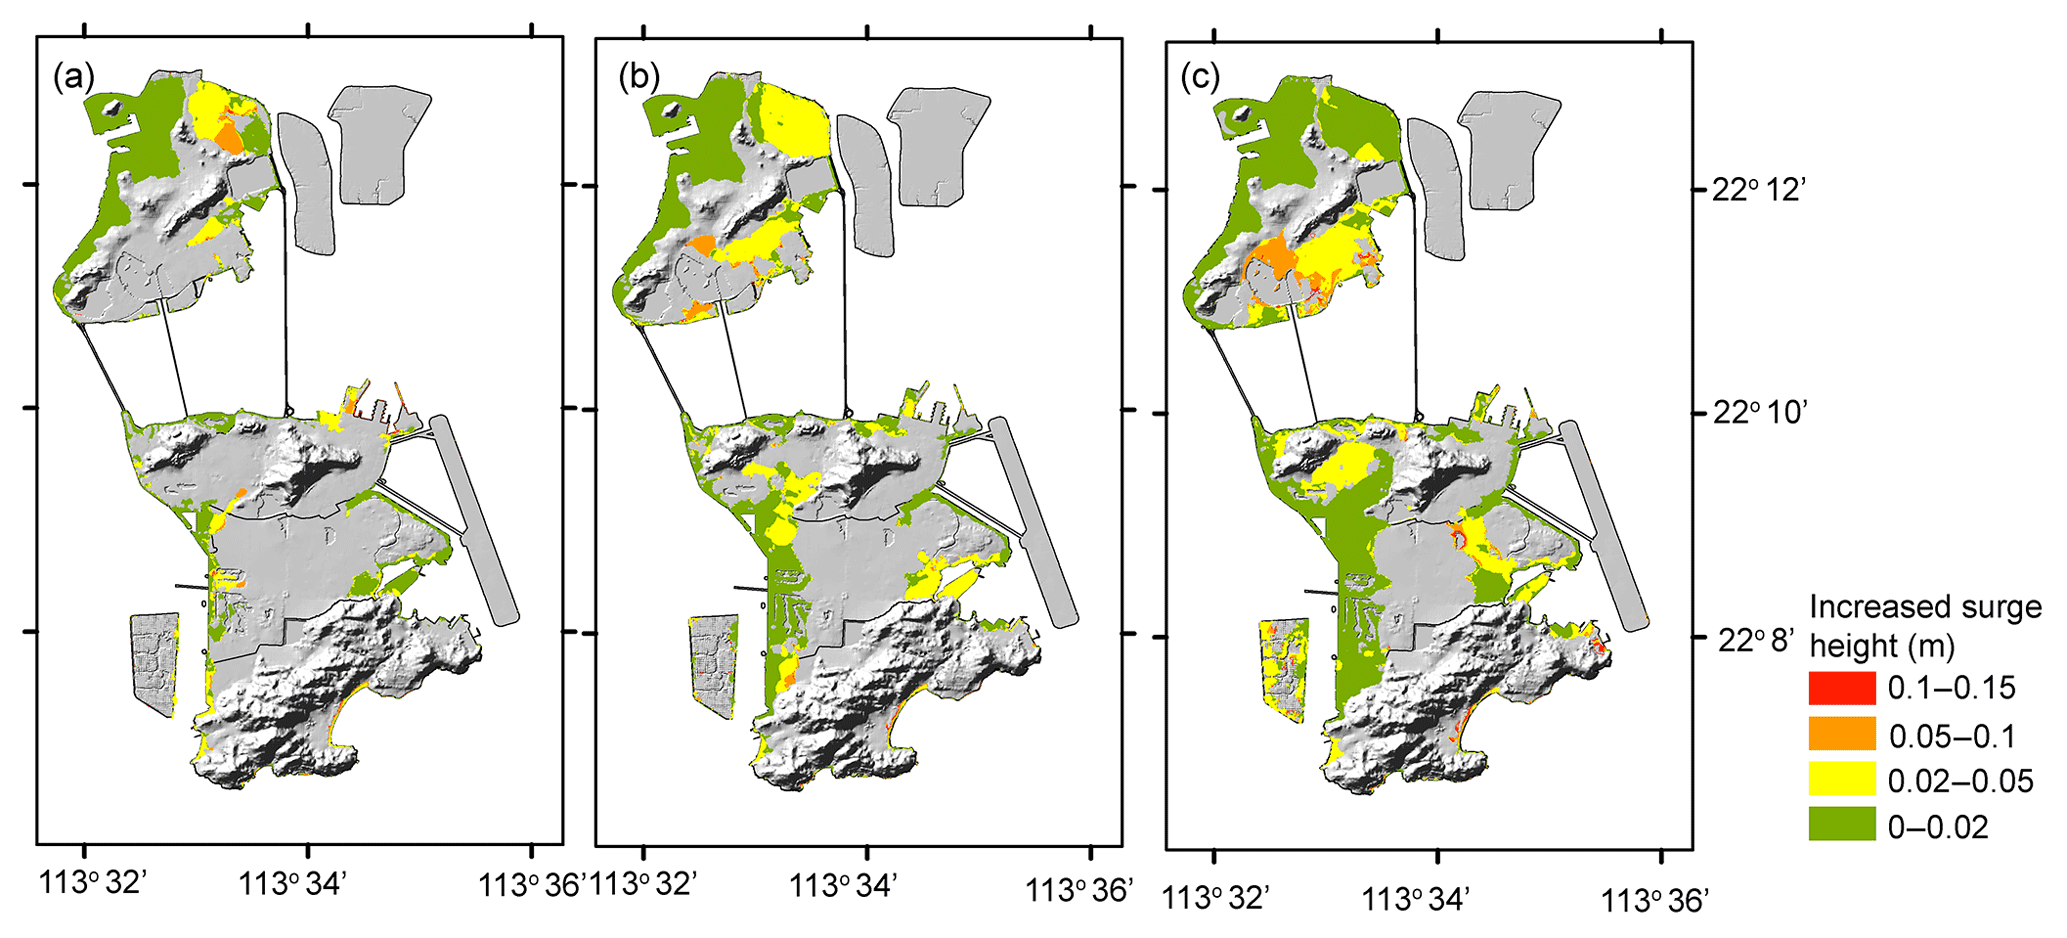
Figure 10The difference in maximum inundation depths between scenarios with and without the wave model during the highest extreme tide under (a) current sea level, (b) 0.5 m SLR and (c) 1 m SLR.
Figure 7 shows the maximum inundation maps for the real case (benchmark scenario; Fig. 7a), at HET (Fig. 7b) and LET (Fig. 7c), respectively. The striking observation is that Typhoon Hato would cause inundation in Macau at all the considered tidal levels (Fig. 7a–c). Even if Typhoon Hato had occurred during the LET, the Inner Harbor area would still be inundated with a maximum inundation depth of up to 1.0 m (Fig. 7c). We emphasize here that the LET is a representative value of the lowest extreme tidal level in the past 54 years (1964–2017), which suggests the Inner Harbor area will certainly be inundated during Hato-like events regardless of the tidal levels at the landfall time. The results once again highlighted the vulnerability of the Inner Harbor area to extreme flooding and the urgency of establishing an effective protection system. Not surprisingly, if Hato had occurred at HET, a noticeably greater inundation depth (0.5–0.8 m deeper in the Inner Harbor; see Fig. 8) would have been sustained in all the flooded areas on the Macau Peninsula, with inundation extending considerably to previously unaffected areas. For example, had Hato struck at HET, the northeast Macau Peninsula and the coastal area of Taipa and Cotai would be inundated with up to 1 m water depth or higher.
4.3 Investigation sea level rise
To account for the effects of future sea level rise (SLR), the values of 0.5 and 1 m SLR were chosen to represent the sea levels by the mid-century and end of this century based on projected local sea level rises of 30–51 cm by 2060 and 65–118 cm by 2100 (Wang et al., 2016). We then ran the storm surge simulations at HET and LET with different magnitude of SLR 0.5 and 1.0 m. For each simulation, we obtain the maximum inundation depths at all in-land computational nodes by subtracting the digital elevation model (DEM) data from the simulated maximum wave heights. In total, we derive three sets of inundation maps at current sea level and 0.5 and 1.0 m SLR conditions.
Adding the effect of 0.5 and 1 m SLR at HET, the inundation extent quickly expands into the eastern part of the Macau Peninsula and coastal areas of Taipa, Cotai and the University of Macau, where no or limited flooding was observed during Typhoon Hato (Fig. 9a–b). Compared with the benchmark scenario (Fig. 7a), the maximum inundation depths in the Inner Harbor area will increase more than 1–1.2 m in the 0.5 m SLR scenario (Fig. 9e) and 1.2–1.5 m in the 1 m SLR scenario for most of the Inner Harbor area (Fig. 9i); such an increase is generally a linear combination of increased tidal level and SLR. While on the eastern side of the Macau Peninsula and some places in Taipa and Cotai, we observe larger increases in the water depths than in the Inner Harbor area, the increased water depths can be up to 1.2–1.5 and 1.5–2.0 m at 0.5 and 1 m SLR conditions, respectively. The larger increase can be partly attributed to large waves on the eastern side of the Macau Peninsula and the coastal areas of Taipa and Cotai than in the Inner Harbor area, especially at higher sea level conditions (Fig. 10). Such a spatially nonuniform response of storm waves to SLR has been discussed in previous studies in many coastal areas worldwide (e.g., Atkinson et al., 2013; Bilskie et al., 2016; Mcinnes et al., 2003) and China (e.g., Wang et al., 2012; Yin et al., 2017). Comparing the maximum inundation depth between scenarios at LET under different sea level conditions (Fig. 9c–d), we point out once again that the Inner Harbor area will suffer increasingly more hazardous inundation with rising sea level. Thus engineering measures are urgently required to protect this area. When designing such engineering measures, proactive policies and adaptive strategies should be taken to combat the likelihood of worsening flooding in future.
Typhoon Hato was one of the most damaging natural disaster events in the western Pacific region in 2017. It caused extensive coastal inundation in and around the PRD region. In this paper, we have presented a detailed post-typhoon field survey, yielding 278 measurements of maximum water depths and inundation extent on Macau Peninsula. Using these data, a high-resolution flood map has been produced. These survey data have been used to successfully validate a numerical model package, which consists of a WRF model for calculating the wind and atmospheric pressure field and a tide–surge–wave coupled hydrodynamic model, SCHISM, for computing tides, storm surges and ocean waves driven by the WRF model results. The data–model comparisons show that the skill of the numerical model package is high and can capture all key features of this event, including the wind fields, the water levels associated with storm surges and tides in the PRD and the inundation depths in Macau. More importantly, the numerical model package can provide additional information such as the arrival times of the storm surge front and the corresponding shoreline movements.
The numerical model package can also be used to gain better understanding of the relative importance of different causes for coastal flooding. To demonstrate this capability, we have focused on studying the effects of tidal level and SLR on coastal inundation in Macau, using Typhoon Hato's atmospheric condition as a benchmark scenario. One of the important observations is that regardless of the tidal level during Typhoon Hato's landfall, the Inner Harbor area will always be inundated with a maximum inundation depth of up to 0.5–1.0 m. On the other hand, although Typhoon Hato broke all the historical records in terms of storm surge heights and flooded area, much worse scenarios could have been expected if Typhoon Hato had occurred at a higher tidal level, and thus, caution is required if Typhoon Hato is to be used as the worst-case scenario for designing future coastal defense measures. This is especially true when taking the rising sea level into consideration as 0.5 and 1 m SLR could significantly increase the severity of the resulting inundation for most of the territory in Macau, including both the high tide and low tide conditions. The inundation maps presented in this study provide the lower and upper bound of potential impacts of Hato-like events at different tidal levels and sea level conditions. Such maps could aid the local government in making more informative decisions.
Besides the tidal level, other factors including the landing location, track azimuth, forward speed, the sudden intensification and urban development (e.g., land reclamation) may have played a more important role in contributing to this record-breaking flood in Macau. The effects of such factors will be analyzed in more detail in a future paper.
Hato-like typhoon events pose a clear and significant threat to the emerging megacities of the PRD and the drive to expand towards the sea, with extensive land reclamation and infrastructure development needed to meet the demands of the growing population and the booming economy. Although most major cities in the region are protected by seawalls, the protection standards vary considerably, and the question as to whether such standards are sufficient to combat increasingly frequent flooding in future needs careful investigation. Adaptive strategies and sustainable management are almost certainly required in order to keep up with the pace of rising sea level. We believe that the data and findings provided in this paper and the numerical model package will not only be of great interest to coastal hazard researchers, but also to a range of stakeholders such as policymakers, town planners, emergency services and insurance companies who are working to create or insure safer coastlines.
The GEBCO data used in this study were downloaded from https://www.gebco.net/data_and_products/gridded_bathymetry_data/ (Weatherall, 2015) in October 2014 and readers can also currently access the data from this link.
The supplement related to this article is available online at: https://doi.org/10.5194/nhess-18-3167-2018-supplement.
LL, YW, JY, CTC, KZ, and YTW conducted the post-event field survey in Macau. JY conducted the numerical simulations. CYL provided the WRF model result. PW provided the measured data at selected tide gauges and compared the simulated and measured results. DP analyzed the tide information in Macau. LL wrote the manuscript with contributions from all other co-authors. All authors contributed to the discussion and interpretation of the results.
The authors declare that they have no conflict of interest.
We are very grateful to the Macau people for the extremely helpful
information, photographs and video footage provided, and the kindness they showed us during the field survey. We thank Hoi Ka In for the tide data
analysis and Zhiguo Ma for helping processing the topographic data of
Macau. We thank the Macau Meteorological and Geophysical Bureau for providing
us with the meteorological data of Macau. This study is supported by an AXA
Research Fund Post-Doctoral Fellowship under the project “Probabilistic
assessment of multiple coastal flooding hazards in the South China Sea under
changing climate” to Linlin Li and the Ng Teng Fong Charitable Foundation
(Hong Kong) under the joint research project “The impact of climate changes
on coastal flooding hazard in South and East China Seas” between the National
University of Singapore and Tsinghua University. Adam Switzer was supported
by (AcRF) Complexity Tier 1 Project RGC4/14 “Preparing Asian mega cities for
changing climate and the potential Increase in extreme sea levels and storm
surges”. This paper contributes to IGCP639 “Sea level change: from Minutes
to Millennia”. The navigational charts in the Pearl River Delta are
purchased from Beijing Situo Ocean Information Technology Co Ltd. The
topographic data of Macau were purchased from the Macau Cartography and
Cadastre Bureau.
Edited by: Mauricio Gonzalez
Reviewed by: two anonymous referees
Atkinson, J., McKee Smith, J., and Bender, C.: Sea-Level Rise Effects on Storm Surge and Nearshore Waves on the Texas Coast: Influence of Landscape and Storm Characteristics, J. Water. Port C., 139, 98–117, https://doi.org/10.1061/(ASCE)WW.1943-5460.0000187, 2013.
Benfield, A.: Weather, Climate & Catastrophe Insight 2017 Annual Report, Aon Benfield, available at: https://reliefweb.int/sites/reliefweb.int/files/resources/20180124-ab-if-annual-report-weather-climate-2017.pdf, last access: 6 June 2018.
Bilskie, M. V., Hagen, S. C., Alizad, K., Medeiros, S. C., Passeri, D. L., Needham, H. F., and Cox, A.: Dynamic simulation and numerical analysis of hurricane storm surge under sea level rise with geomorphologic changes along the northern Gulf of Mexico, Earth's Future, 4, 177–193, https://doi.org/10.1002/2015EF000347, 2016.
Egbert, G. D. and Erofeeva, S. Y.: Efficient Inverse Modeling of Barotropic Ocean Tides, J. Atmos. Ocean. Tech., 19, 183–204, https://doi.org/10.1175/1520-0426(2002)019<0183:EIMOBO>2.0.CO;2, 2002.
ESCAP/WMO Typhoon Committee: Member Report, available at: http://www.typhooncommittee.org/12IWS/docs/Members/China20171026_final.pdf (last access: 20 June 2018), 2017.
Fritz, H. M., Borrero, J. C., Synolakis, C. E., and Yoo, J.: 2004 Indian Ocean tsunami flow velocity measurements from survivor videos, Geophys. Res. Lett., 33, L24605, https://doi.org/10.1029/2006GL026784, 2006.
Fritz, H. M., Blount, C., Sokoloski, R., Singleton, J., Fuggle, A., McAdoo, B. G., Moore, A., Grass, C., and Tate, B.: Hurricane Katrina storm surge distribution and field observations on the Mississippi Barrier Islands, Estuar. Coast. Shelf S., 74, 12–20, https://doi.org/10.1016/j.ecss.2007.03.015, 2007.
Garzon, J. and Ferreira, C.: Storm Surge Modeling in Large Estuaries: Sensitivity Analyses to Parameters and Physical Processes in the Chesapeake Bay, Journal of Marine Science and Engineering, 4, 45, 2016.
HKO: Super Typhoon Hato (1713), Hong Kong Observatory, available at: http://www.weather.gov.hk/informtc/hato17/report.htm (last access: 21 June 2018), 2017.
Hong, S.-Y., Dudhia, J., and Chen, S.-H.: A Revised Approach to Ice Microphysical Processes for the Bulk Parameterization of Clouds and Precipitation, Mon. Weather Rev., 132, 103–120, https://doi.org/10.1175/1520-0493(2004)132<0103:ARATIM>2.0.CO;2, 2004.
Hong, S.-Y., Noh, Y., and Dudhia, J.: A New Vertical Diffusion Package with an Explicit Treatment of Entrainment Processes, Mon. Weather Rev., 134, 2318–2341, https://doi.org/10.1175/mwr3199.1, 2006.
Iacono, M. J., Delamere, J. S., Mlawer, E. J., Shephard, M. W., Clough, S. A., and Collins, W. D.: Radiative forcing by long-lived greenhouse gases: Calculations with the AER radiative transfer models, J. Geophys. Res.-Atmos., 113, D13103, https://doi.org/10.1029/2008JD009944, 2008.
Jiang, S., Xu, F., Li, Y., Liu, X., Zhao, Y., and Xu, W.: Distributional characteristics of grain sizes of surface sediments in the Zhujiang River Estuary, Acta Oceanologica Sinica, 30–36, 2014.
Jiménez, P. A., Dudhia, J., González-Rouco, J. F., Navarro, J., Montávez, J. P., and García-Bustamante, E.: A Revised Scheme for the WRF Surface Layer Formulation, Mon. Weather Rev., 140, 898–918, https://doi.org/10.1175/mwr-d-11-00056.1, 2012.
Kain, J. S.: The Kain–Fritsch Convective Parameterization: An Update, J. Appl. Meteorol., 43, 170–181, https://doi.org/10.1175/1520-0450(2004)043<0170:TKCPAU>2.0.CO;2, 2004.
Krien, Y., Testut, L., Islam, A. K. M. S., Bertin, X., Durand, F., Mayet, C., Tazkia, A. R., Becker, M., Calmant, S., Papa, F., Ballu, V., Shum, C. K., and Khan, Z. H.: Towards improved storm surge models in the northern Bay of Bengal, Cont. Shelf Res., 135, 58–73, https://doi.org/10.1016/j.csr.2017.01.014, 2017.
Lee, E. K. S., Fok, L., and Lee, H. F.: An Evaluation of Hong Kong's Tropical Cyclone Warning System, Asian Geographer, 29, 131–144, https://doi.org/10.1080/10225706.2012.742619, 2012.
Ma, L.-M. and Tan, Z.-M.: Improving the behavior of the cumulus parameterization for tropical cyclone prediction: Convection trigger, Atmos. Res., 92, 190–211, https://doi.org/10.1016/j.atmosres.2008.09.022, 2009.
Martyr, R. C., Dietrich, J. C., Westerink, J. J., Kerr, P. C., Dawson, C., Smith, J. M., Pourtaheri, H., Powell, N., Ledden, M. V., Tanaka, S., Roberts, H. J., Westerink, H. J., and Westerink, L. G.: Simulating Hurricane Storm Surge in the Lower Mississippi River under Varying Flow Conditions, J. Hydraul. Eng., 139, 492–501, https://doi.org/10.1061/(ASCE)HY.1943-7900.0000699, 2013.
Mcinnes, K. L., Walsh, K. J. E., Hubbert, G. D., and Beer, T.: Impact of Sea-level Rise and Storm Surges on a Coastal Community, Natural Hazards, 30, 187–207, https://doi.org/10.1023/a:1026118417752, 2003.
Pond, S. and Pickard, G. L.: Introductory Dynamical Oceanography, Oxford: Elsevier Butterworth-Heinemann, 1998.
Roland, A.: Development of WWM II: Spectral wave modeling on unstructured meshes, PhD Thesis, Technische Universitat Darmstadt, Germany, 2008.
Shan, C., Zhang, X., Yuan, H., Qian, C., Huang, X., Jiang, X., Shen, H., Sun, S., Ji, Y., Li, J., Wang, C., Zhang, Y., Zhang, B., Zheng, J., Fu, M., and Qin, X.: The hazard assessment of Typhoon Hato in Macau, China National Commission for Disaster Reduction, available at: http://www.gep.gov.mo/event/pdf/reportCN_201803.pdf, last access: 21 June 2018.
Skamarock, W. C., Klemp, J. B., Dudhia, J., Gill, D. O., Barker, D., Duda, M. G., Huang, X.-y., Wang, W., and Powers, J. G.: A Description of the Advanced Research WRF Version 3, National Center for Atmospheric Research, Boulder, Colorado, USA, NCAR TECHNICAL NOTE, 2008.
SMG: Typhoon Hato (1713), Macau Meteorological and Geophysical Bureau, available at: http://www.smg.gov.mo/smg/database/pdf/typhoon/e_1713.pdf (last access: 20 June 2018), 2017.
Soria, J. L. A., Switzer, A. D., Villanoy, C. L., Fritz, H. M., Bilgera, P. H. T., Cabrera, O. C., Siringan, F. P., Maria, Y. Y.-S., Ramos, R. D., and Fernandez, I. Q.: Repeat Storm Surge Disasters of Typhoon Haiyan and Its 1897 Predecessor in the Philippines, B. Am. Meteorol. Soc., 97, 31–48, 10.1175/bams-d-14-00245.1, 2016.
Tajima, Y., Yasuda, T., Pacheco, B. M., Cruz, E. C., Kawasaki, K., Nobuoka, H., Miyamoto, M., Asano, Y., Arikawa, T., Ortigas, N. M., Aquino, R., Mata, W., Valdez, J., and Briones, F.: Initial Report of JSCE-PICE Joint Survey on the Storm Surge Disaster Caused by Typhoon Haiyan, Coast. Eng. J., 56, 1450006, 10.1142/s0578563414500065, 2014.
Takagi, H., Esteban, M., Shibayama, T., Mikami, T., Matsumaru, R., Leon, M. D., Thao, N. D., Oyama, T., and Nakamura, R.: Track analysis, simulation, and field survey of the 2013 Typhoon Haiyan storm surge, J. Flood Risk Manag., 10, 42–52, https://doi.org/10.1111/jfr3.12136, 2017.
Takagi, H., Xiong, Y., and Furukawa, F.: Track analysis and storm surge investigation of 2017 Typhoon Hato: were the warning signals issued in Macau and Hong Kong timed appropriately?, Georisk: Assessment and Management of Risk for Engineered Systems and Geohazards, 12, 297–307, https://doi.org/10.1080/17499518.2018.1465573, 2018.
Tewari, M., Chen, F., Wang, W., Dudhia, J., Lemone, M., Mitchell, K., Ek, M., Gayno, G., Wegiel, J., and Cuenca, R.: Implementation and verification of the unified Noah land-surface model in the WRF model 20th Conference on Weather Analysis and Forecasting/16th Conference on Numerical Weather Prediction, Seattle, WA, US, 2004.
Wang, H., Loftis, J., Liu, Z., Forrest, D., and Zhang, J.: The Storm Surge and Sub-Grid Inundation Modeling in New York City during Hurricane Sandy, Journal of Marine Science and Engineering, 2, 226–246, https://doi.org/10.3390/jmse2010226, 2014.
Wang, J., Gao, W., Xu, S., and Yu, L.: Evaluation of the combined risk of sea level rise, land subsidence, and storm surges on the coastal areas of Shanghai, China, Clim. Change, 115, 537–558, https://doi.org/10.1007/s10584-012-0468-7, 2012.
Wang, L., Huang, G., Zhou, W., and Chen, W.: Historical change and future scenarios of sea level rise in Macau and adjacent waters, Adv. Atmos. Sci., 33, 462–475, https://doi.org/10.1007/s00376-015-5047-1, 2016.
Weatherall, P., Marks, K. M., Jakobsson, M., Schmitt, T., Tani, S., Arndt, J. E., Rovere, M., Chayes, D., Ferrini, V., and Wigley, R.: A new digital bathymetric model of the world's oceans, Earth and Space Science, 2, 331–345, https://doi.org/10.1002/2015EA000107, 2015.
Yin, K., Xu, S., Huang, W., and Xie, Y.: Effects of sea level rise and typhoon intensity on storm surge and waves in Pearl River Estuary, Ocean Eng., 136, 80–93, https://doi.org/10.1016/j.oceaneng.2017.03.016, 2017.
Zhang, Y. J. and Baptista, A. M.: An Efficient and Robust Tsunami Model on Unstructured Grids. Part I: Inundation Benchmarks, Pure Appl. Geophys., 165, 2229–2248, https://doi.org/10.1007/s00024-008-0424-7, 2008.
Zhang, Y. J., Ye, F., Stanev, E. V., and Grashorn, S.: Seamless cross-scale modeling with SCHISM, Ocean Modell., 102, 64–81, https://doi.org/10.1016/j.ocemod.2016.05.002, 2016.