the Creative Commons Attribution 4.0 License.
the Creative Commons Attribution 4.0 License.
 | 14 Sep 2018
Revisiting seismic hazard assessment for Peninsular Malaysia using deterministic and probabilistic approaches
Daniel Weijie Loi
Mavinakere Eshwaraiah Raghunandan
Varghese Swamy
Seismic hazard assessments, both deterministic and probabilistic, for Peninsular Malaysia have been carried out using peak ground acceleration (PGA) data recorded between 2004 and 2016 by the Malaysian Meteorological Department using triaxial accelerometers placed at 19 seismic stations on the peninsula. Seismicity source modelling for the deterministic seismic hazard assessment (DSHA) used historical point sources whereas in the probabilistic (PSHA) approach, line and areal sources were used. The earthquake sources comprised the Sumatran subduction zone (SSZ), Sumatran fault zone (SFZ) and local intraplate (LI) faults. Gutenberg–Richter law b value for the various zones identified within the SSZ ranged between 0.56 and 1.06 (mean=0.82) and for the zones within the SFZ, between 0.57 and 1.03 (mean=0.89). Suitable ground motion prediction equations (GMPEs) for Peninsular Malaysia along with other pertinent information were used for constructing a logic tree for PSHA of the region. The DSHA “critical-worst” scenario suggests PGAs of 0.07–0.80 ms−2 (0.7–8.2 percent g), whilst the PSHA suggests mean PGAs of 0.11–0.55 ms−2 (0.5–5.4 percent g) and 0.20–1.02 ms−2 (1.9–10.1 percent g) at 10 % and 2 % probability of exceedance in 50 years, respectively. DSHA and PSHA, despite using different source models and methodologies, both conclude that the central-western cities of Peninsular Malaysia, located between 2 and 4∘ N, are most susceptible to high PGAs, due to neighbouring active Sumatran sources, SFZ and SSZ. Of the two Sumatran sources, surprisingly, the relatively less active SFZ source with low magnitude seismicity appeared as the major contributor due to its proximity. However, potential hazards due to SSZ mega-earthquakes should not be dismissed. Finally, DSHA performed using the limited LI seismic data from the Bukit Tinggi fault at a reasonable moment magnitude (Mw) value of 5.0 predicted a PGA of ∼0.40 ms−2 at Kuala Lumpur.
- Article
(15475 KB) - Full-text XML
- BibTeX
- EndNote


Seismic hazard assessment (SHA) of a particular region can generally be defined as the estimation of hazard at a specific site due to occurrence of a hypothetically damaging earthquake originating within the geographic region. The ground shaking experienced at a given site is directly related to the intensity of seismic waves emitted by this natural phenomenon. Violent ground shaking caused by devastating earthquakes can lead to both massive fatalities and economic losses, as reported for past earthquake events such as the 2004 Aceh earthquake, 2011 Christchurch earthquake, 2015 Nepal earthquake and 2016 Italy earthquake. The ground motions are normally expressed through response parameters such as peak ground acceleration (PGA), peak ground velocity (PGV) and response spectrum amplitude (RSA). An understanding of the ground motion is one of the fundamental understandings required to develop reliable seismic resistance design codes. These design codes established from the ground motion information of a specific region are valuable for practising engineers in the design of earthquake resistant structures.
As Malaysia is a developing nation with new infrastructure being built at a relatively fast rate in its major cities, it is essential that seismic hazard assessment is undertaken to reliably predict ground motion scenarios due to potential earthquakes. The ground motion values obtained will serve as a reference for upcoming constructions and also for existing structures as an evaluation to determine if retrofitting is required to mitigate the seismic risk. Currently, the design code BS8110 is widely used by the construction industry in Malaysia and the ongoing usage of this design code can be deemed unwise as it does not include any seismic considerations (Megawati et al., 2005; Shoushtari et al., 2016). It is worth noting that the inherent seismic hazard for the Malaysia region has been acknowledged by the government of Malaysia. In view of the lessons learnt from the devastating earthquakes of the Sumatran region, especially in the aftermath of the 2004 Aceh earthquake, there have been initiatives such as publication of a handbook on the requirement of incorporating seismic design, in particular for concrete buildings in Malaysia based on Eurocode 8 and IBC2000 design codes (Ministry of Science Technology & Innovation, 2009). However, the values proposed in these codes may not be suitable for usage as they were not specifically developed for this region (Sooria, 2012). Note that the seismotectonic parameters such as earthquake magnitude and frequency, distance from the sources, among others, vary for different regions of the world.
The SHA methods developed to deal with strong ground motions have been elaborated in the literature (Baker, 2008; Kolathayar et al., 2012; Kramer, 1996; McGuire, 2001; Panza et al., 1999) with the most common methods utilizing a deterministic or probabilistic approach. Deterministic seismic hazard assessment typically uses earthquake magnitude and distance associated with the highest hazard from historical records for a specific seismic source to predict the ground motion at a site. This is commonly achieved using a pre-determined seismic wave attenuation model also known as ground motion prediction equation (GMPE). This method can be termed as a “scenario-like description” for earthquake hazard (Reiter, 1991). Deterministic seismic hazard assessment (DSHA) is often desirable for regions with well-defined seismotectonic models, for example, California, where DSHA dictates the design ground motion parameters for bridges and buildings (Wang, 2011). The application of this approach is straightforward and less complicated, allowing engineers to make clear-cut decisions, for consideration of other earthquake parameters unrelated to the site is seldom required. However, DSHA has its own shortcomings in that it does not take uncertainties (i.e. frequency of recurrence and ground motion) into proper account (Baker, 2008; Kramer, 1996). This has inevitably led to the development of probabilistic seismic hazard assessment (PSHA), which resolves some of the inadequacies in DSHA including probability of recurrence and earthquake magnitude uncertainty.
The use of PSHA has gained popularity in the past two to three decades with the expansion of seismic networks throughout the world and consequent availability of abundant seismic data. The method of PSHA was pioneered by Cornell (1968) and further enhanced by a number of researchers including Esteva (1969), Reiter (1991), McGuire (2004) and Atkinson et al. (2014). In contrast to the straightforward DSHA method which uses a single absolute value to estimate hazard at a site, PSHA allows the inclusion of multi-valued parameters that consider uncertainties in earthquake factors such as the location, size and the recurrence rate. The combination of these parameters provides an advantage for PSHA as it enables assessment of the likelihood of an earthquake ground motion exceeding a certain threshold at a site of interest. PSHA employs flexible mathematical approaches which are oftentimes presented in the ground motion annual return rate of exceedance or return period, which facilitates engineers to perform seismic risk assessment for a site of interest. Subsequently, with better understanding of the seismic hazard, specifically on the relationship between different sources and the potential shaking caused by impending earthquakes, engineers can ascertain suitable design ground motion that a structure should be able to withstand. PSHA, nonetheless, is not free of criticism as some studies have observed that it is merely a numerical creation with a hazy mathematical concept and the use of it may lead to risky or overly conservative engineering design (Klügel, 2010; Wang, 2011). Therefore, it is always a good practice to supplement PSHA results with analysis using DSHA.
In view of both its methodological limitation in not treating uncertainties adequately and that ground motions felt within Peninsular Malaysia have been predominantly due to infrequent distant events, the utilisation of DSHA in Peninsular Malaysia has been relatively scarce. Unsurprisingly, PSHA has been the choice for SHA by a number of researchers in this region. The PSHA outcomes reported for this region have been recently discussed by Loi et al. (2016) and Shoushtari et al. (2016). These authors have discussed possible reasons for the variation in the published PSHA outcomes including the utilisation of different GMPEs and data sets (either synthetic or recorded ground motions), employment of different methodologies for PSHA and site-specific conditions.
The major motivation for the current study is the lack of a dedicated GMPE for Peninsular Malaysia. The past studies adopted regional GMPEs not specifically developed for Peninsular Malaysia for SHA of this region. Moreover, awareness of potential earthquake hazards in the country has gained traction over the last decade, owing to a series of minor earthquakes in Bukit Tinggi between 2009 and 2010 and the Sabah earthquake in 2015. In 2016, the Department of Standards Malaysia (2016) also drafted an Annex – denoted as DMS16 in this paper, based on Eurocode 8 on the applicability of seismic resistant design in Malaysia. With intensifying interest in earthquake studies in Malaysia, the present work aims to contribute a detailed study of the seismic hazard faced by Peninsular Malaysia including the development of seismic zonation maps. To this end, updated strong ground motion records obtained from the Malaysian Meteorological Department (MMD) for the period of 2004–2016 in conjunction with recent findings on the suitability of existing and new GMPEs for this region (Loi, 2018; Shoushtari et al., 2016; Van et al., 2016) will be used in performing DSHA and PSHA for Peninsular Malaysia encompassing a rectangular area of 1–7∘ N and 99–105∘ E. The outcomes of the present research comprises (a) seismic hazard maps based on both DSHA and PSHA via ground motion in terms of PGA at bedrock and (b) hazard curves for major cities throughout the peninsula. The PSHA hazard map will also present the PGA with 2 % and 10 % probabilities of exceedance (PE) in 50 years.
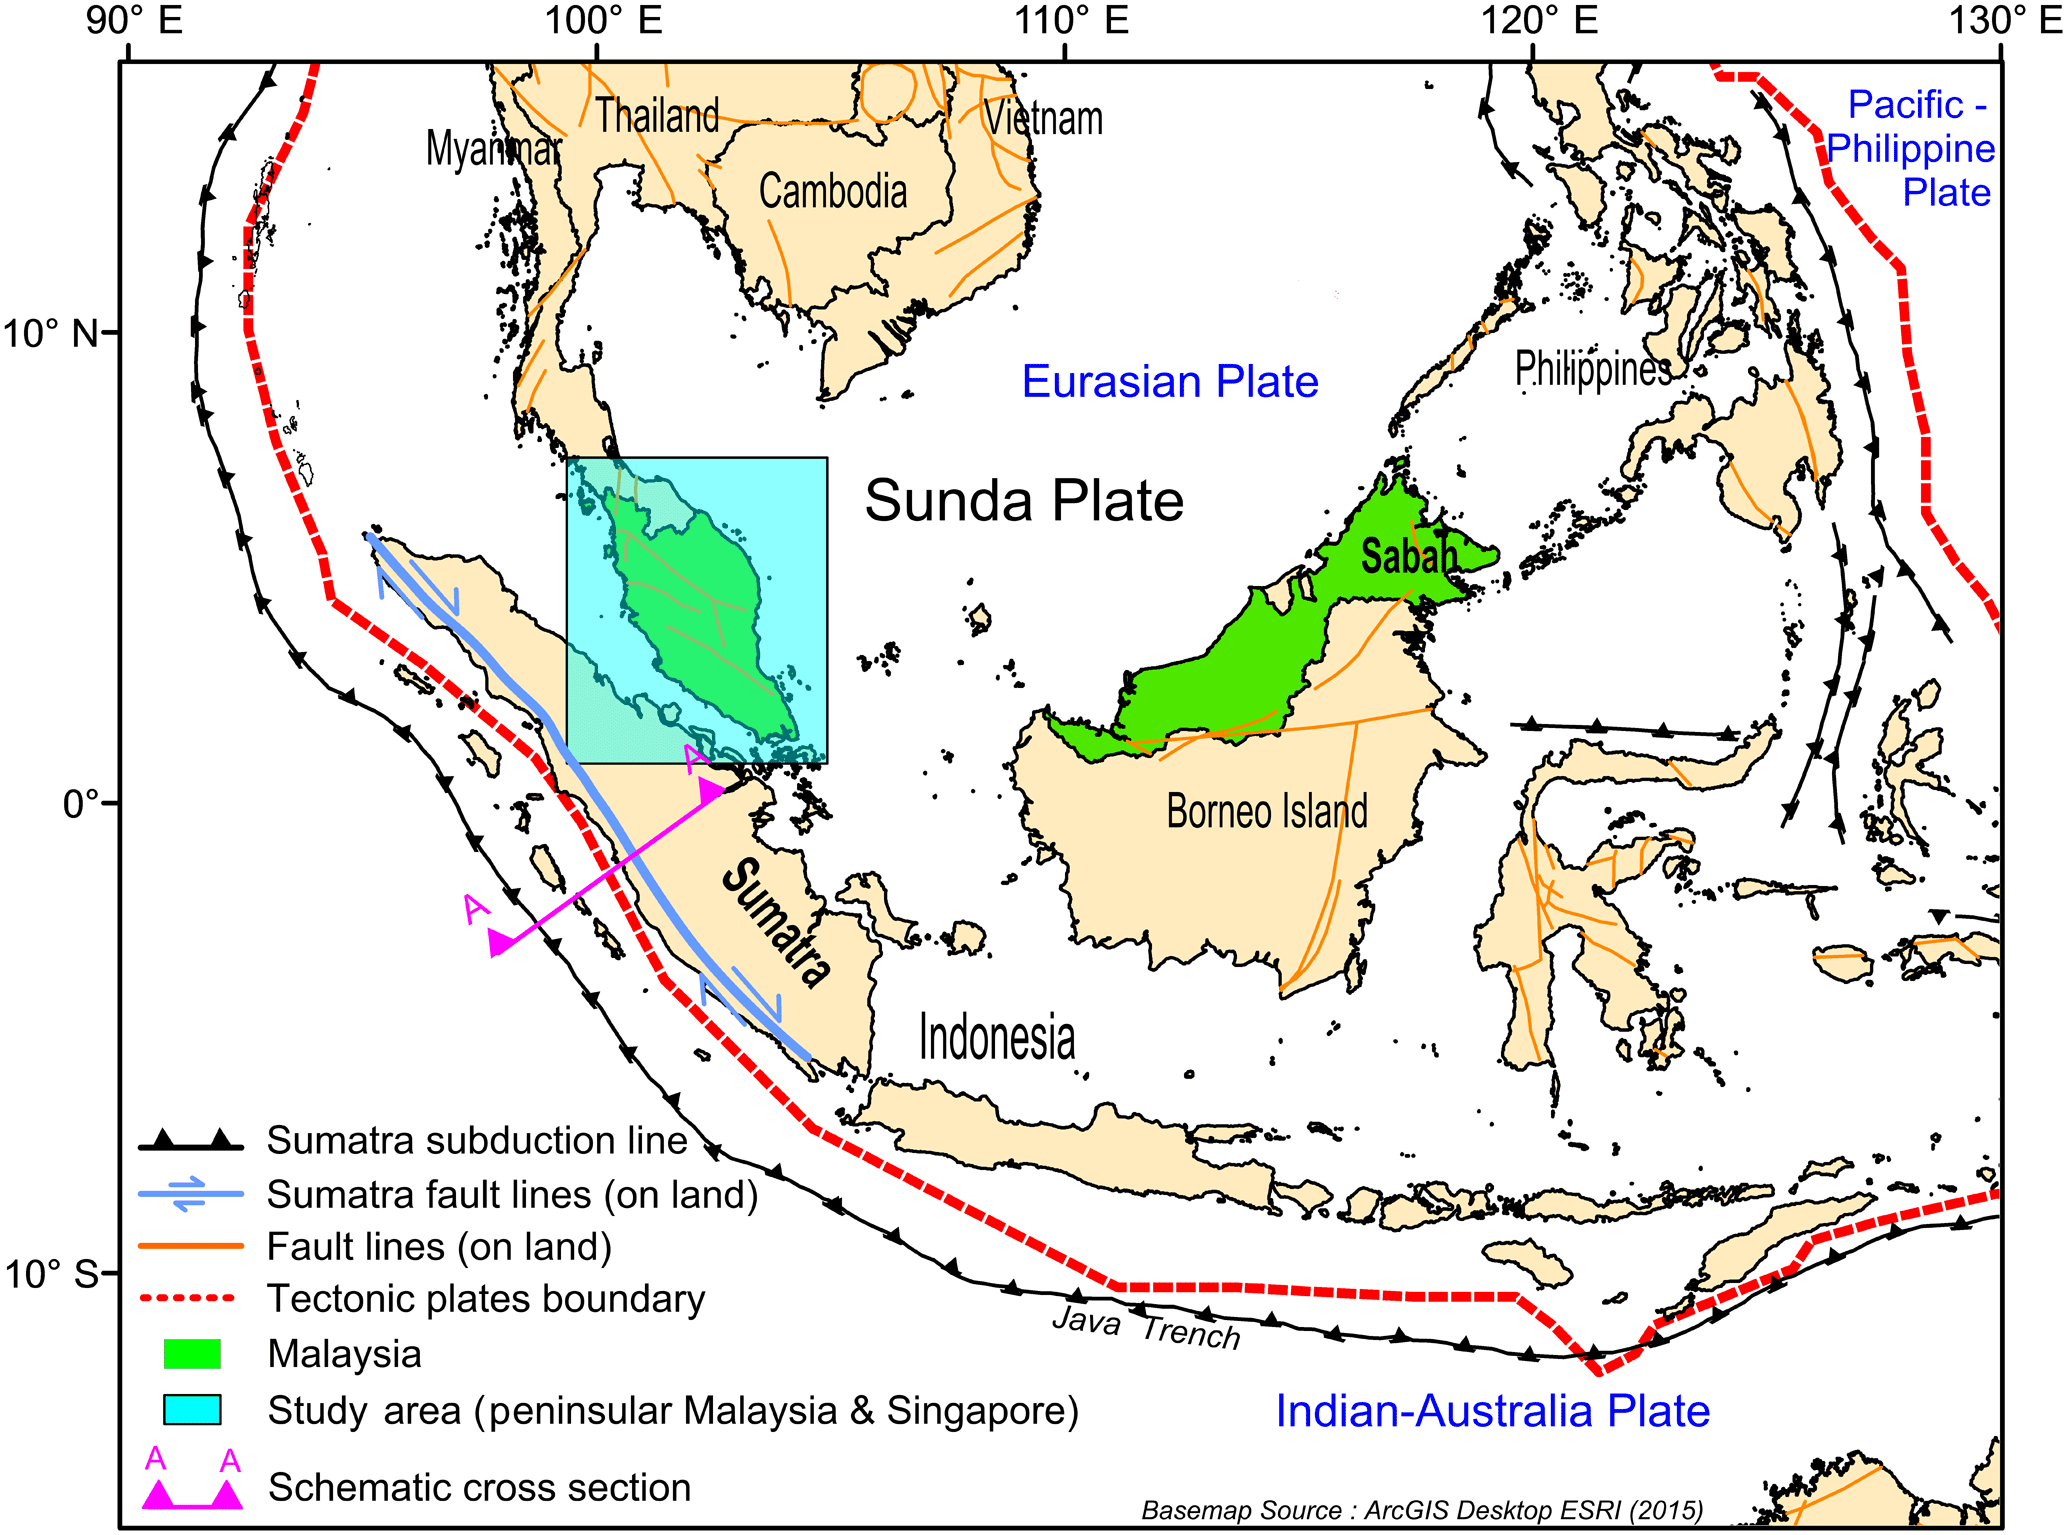
Figure 1Location of Peninsular Malaysia on the Sunda Plate and the seismic sources around it (modified from Loi et al., 2016). The subduction lines, fault lines and tectonic boundary were obtained from ArcGIS 10.4.
The foremost step in the SHA for a region is the identification of the potential earthquake sources capable of yielding substantial ground motion at a given site. The earthquake sources vary from active interplate subduction regions where earthquake activity is relatively high as the result of constant interactions between tectonic plates to stable continental intraplate regions which are away from the plate boundaries and can be identified based on historical seismological events and geological data. The knowledge of the seismotectonic setting of a region is derived on the basis of past seismicity and geological structures. The area considered in the present study consists of the whole of Peninsular Malaysia located between the latitudes 1 and 7∘ N and longitudes 98 and 105∘ E (Fig. 1).
Peninsular Malaysia covers an area about 0.3 million km2 at the southern tip of mainland Asia and is connected by land to Thailand to the north while separated from Singapore by Johor Strait to the south and from Sumatra of Indonesia by Malacca Strait to the west. Borneo, which contains the states of Sabah and Sarawak, is located east of Peninsular Malaysia and is separated by South China Sea. Tectonically, Peninsular Malaysia is located within the stable Sunda Plate. Seismicity within the Sunda Plate has been historically low with progressive collision with the Eurasian Plate relatively slow (Baroux et al., 1998). The axis of rotation of the Sunda block is believed to be at 49.0∘ N to 94.2∘ E with a clockwise rotation of 0.34 degree/million years (Simons et al., 2007). The general movement of this block is eastwards at a slow rate of 6±1 and 10±1 mm yr−1 in its southernmost and northern boundaries, respectively (Simons et al., 2007). Despite being located on a stable continental region, ground motions due to earthquakes (both major and minor) are still experienced within the country (Megawati et al., 2005; Ministry of Science Technology & Innovation, 2009; Sun and Pan, 1995). Based on the chronological events documented by various agencies such as the United States Geological Survey (USGS), International Seismological Centre (ISC) and MMD, it could be established that ground motions detected due to seismic activity within and around Peninsular Malaysia can largely be attributed to two main sources: far-field Sumatran sources and local intraplate earthquakes. These two sources can further be grouped into three seismotectonic regions: Sumatran subduction zone (SSZ), Sumatran fault zone (SFZ) and intraplate zones within the Sunda Plate. Historical statistics obtained from MMD showed that states located on the western coastline of Peninsular Malaysia are more vulnerable to felt ground motions (Loi et al., 2016; Sooria, 2012). The location of Peninsular Malaysia within the Sunda Plate and its nearby seismic sources are presented in Fig. 1.

Figure 2Schematic cross section of A–A from Fig. 1 showing the subduction of Indian–Australian Plate beneath the Eurasian Plate and the location of major seismic activities along the Sumatra subduction and fault zone. The diverging white arrows merely indicate the separation between the Eurasian Plate and the Indian–Australian Plate; and also the Indian Ocean and Sumatra.
Figure 2 schematically illustrates the tectonic movements around the Sumatran region that lead to major seismic activities. The island of Sumatra, located on the Eurasian Plate, overrides the subducting Indian–Australian Plate along the Sunda Trench. The subduction zone which lies on the Indian Ocean bed is not as distinctive as the fault lines on Sumatra. This zone, where the two plates converge, has generally been identified as the Sumatran subduction zone. The SSZ is relatively younger south of the Equator (approx. 50 Ma) and older towards the north (approx. 90 Ma) with historical records showing that earthquakes of high magnitudes happening frequently at younger and faster moving subducting plates (Cassidy, 2015; Gradstein et al., 1994; Gutscher, 2016). This does not imply that mega-earthquakes are not likely to happen at zones that are moving at a slower convergence: the 2004 Aceh earthquake being a prominent example of the latter (McCaffrey, 2009). The convergence of these plates is highly oblique to the southwest of Sumatra, lying almost parallel and approximately 150–200 km away from its coastline. The vector of plate motion varies around 57±8 mm yr−1 and is oriented about N10∘ E (McCaffrey, 1991; Megawati et al., 2005; Petersen et al., 2004; Prawirodirdjo et al., 2010). The resultant mega earthquakes are directly related to the strong coupling between the overriding and subducting plates with studies indicating that the focal mechanism and hypocentral distribution being shallow and dips gradually beneath the outer arc ridge (Newcomb and McCann, 1987; Pan and Megawati, 2002; Prawirodirdjo et al., 1997). SSZ has accounted for most of the megathrust earthquakes in this region with records showing one of the largest earthquakes ever to strike had a massive 9.0±0.2 on the moment magnitude (Mw) scale in 1833 (Newcomb and McCann, 1987). Another massive earthquake happened in 1861 at an estimated Mw of 8.4±0.1, which was felt in Java and Peninsular Malaysia (Newcomb and McCann, 1987). More recently, the Aceh earthquake recorded at ∼Mw9.1–9.3 near the island of Simeulue (Nalbant et al., 2005) generated giant tsunamis that led to thousands of fatalities and posed colossal financial losses in terms of rebuilding and restoration work to the surrounding regions. Although high-rise buildings were not structurally damaged in distant countries such as Malaysia and Singapore, tremors were still reportedly strongly felt even as far as India (Martin, 2005).
Lying east about 200 km away, parallel to the trench, is the Sumatran fault zone that accommodates the oblique convergence along the plate margin. This 1900 km long dextral strike-slip fault runs in a northwest–southeast direction along the spine of Sumatra, spanning 10∘ N to 7∘ S (Sieh and Natawidjaja, 2000). The slip rate of this fault accelerates northwestwards at varying speeds of 6 to 27 mm yr−1 with relatively high seismicity rates in the vicinity of Sumani, Sianok and Angkola (Petersen et al., 2004; Prawirodirdjo et al., 2000). This is in line with the Global Positioning System (GPS) data studied by McCaffrey et al. (2000) that suggested a uniform slip rate of 21±5 mm yr−1 across central Sumatra. A geomorphology study of the SFZ by Sieh and Natawidjaja (2000) and Acocella et al. (2018) found it to be highly segmented with 19 major geometrically defined segments. Termed “equatorial bifurcation”, the largest irregularity is located at the Equator, where the fault separates into two subparallel branches at approximately 35 km apart (Sieh and Natawidjaja, 2000). The geometrical irregularities exhibited along the sinusoidal shape of Sumatran faults have tectonic and seismological significance that affects the rupture dimensions, limiting the energy that could be released from this active strike-slip fault (Balendra et al., 2002). This is supported by historical data, noting that major earthquakes in this zone have never exceeded Mw7.8 (Natawidjaja and Triyoso, 2007). The same study also concluded, on the basis of the assumption that all the fault zones are locked from surface to a depth of 15 km, that the recurrence of large earthquake Mw7.2–7.4 is approximately 0.2/year while an earthquake of Mw7.4–7.7 is likely to strike 0.1/year. Although earthquakes from SFZ are comparatively lower in magnitude compared to those from the SSZ, the effects of major ruptures belonging to the former such as the 2010 and 2011 events were still felt in Peninsular Malaysia. The logical explanation is that the lower magnitude effect of the earthquakes from SFZ is offset by the shorter distance to the peninsula.
The geological map published by the Mineral and Geoscience Department of Malaysia (JMG) recognises three prominent set of fault systems trending in northwest–southeast, north–south and east–west directions. Seven major faults were listed within the Peninsular Malaysia, including the Bok Bak fault, Lebir fault, Terengganu fault, Bukit Tinggi fault, Kuala Lumpur fault, Lepar fault and Mersing fault (Mineral and Geoscience Department Malaysia, 2014). The location of these mostly normal and strike-slip faults (Khoo and Tan, 1983) is shown in Fig. 2. From November 2007 to May 2008, a series of low-magnitude (Mw<4.0) earthquakes were registered at Bukit Tinggi. These events generated tremors felt by nearby residents and minor hairline cracks on the wall at a nearby police station and school (Lat and Tajuddin, 2009; Lau et al., 2005). Such occurrences were unanticipated as seismicity within Peninsular Malaysia has historically been of low intensity around level VI on the Modified Mercalli (MM) scale due to tremors instigated by Sumatran events (Chai et al., 2011). These events presumably suffice after the megathrust earthquakes at Aceh and Nias in 2004 and 2005, respectively, with recent geophysical studies suggesting that the core of Sundaland to be gradually deforming (Shuib, 2009). This notion is supported by GPS and Shuttle Radar Topography Mission – Digital Elevation Mapping (SRTM-DEM) measurements showing distortion of plates due to intraplate stress build-up in the northwest of Peninsular Malaysia (Jhonny, 2009). Such movements seemingly activate the intraplate faults, eventually leading to low magnitude intraplate earthquakes. Considering that Kuala Lumpur (KL), the capital of the nation, is located only about 30 km away, these events warrant general public's interest and concern. The presence of these local intraplate (LI) earthquakes requires further geomorphological studies for a better understanding of the faults' behaviour and level of seismicity these faults are capable of producing. A new hazard map incorporating potential hazards posed by these active faults will certainly be useful for engineers during seismic resistant design.

Figure 3Seismic data completeness for (a) Sumatra subduction zone and (b) Sumatran fault zone.
Table 1Location of MMD seismic stations across Peninsular Malaysia and the ground motion values recorded for the period 2004–2016 by the MMD.
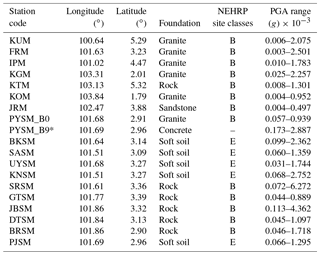
* Seismic sensor located inside the building. Records not utilised for the current study.
Over the past 15 years, the Malaysian Meteorological Department (MMD) has set up a network of seismic stations across Peninsular Malaysia. In view of economic and scientific importance, majority of these stations are located in the west coast of Peninsular Malaysia where major cities are situated. Moreover, they are located closer to the active Sumatran region. The network comprises of 19 stations that use FBA-EST triaxial accelerometers, of these 19 stations, 7 are equipped with broadband seismometers (Streckeisen STS-1 and STS-2). The sensors used at these stations by MMD capture the horizontal, vertical and surface accelerations due to an earthquake event. Real-time data are transmitted via VSAT telemetry to the headquarters of MMD for processing and analysis. These stations were built on various foundations: granite, sandstone and soft soil. The sites are referenced to the National Earthquake Hazards Reduction Program (NEHRP) site classification by the Building Seismic Safety Council (2003). The aforementioned two foundations on which 13 seismic stations have been established can be classified as NEHRP site class B rock sites (average shear wave velocity in the upper 30 m (VS30) of the soil profile with VS30 ranging from 760 to 1500 ms−1) whereas the soft soil foundation on which five seismic stations are situated is considered to be NEHRP site class E (VS30 less than 180 ms−1). The data from one remaining seismic station located within a building were not considered in the current study. The details of these stations (location, foundation, NEHRP site class and recorded PGA ranges) are listed in Table 1.
For the period of 2004 to 2016, a total of 88 earthquake events within a rectangular area of 10∘ S to 10∘ N and 95 to 110∘ E that triggered considerable ground motion were recorded by the MMD. The data set for PGA consists of 103 recordings for local earthquakes and 368 recordings from far-field Sumatran earthquakes, 34 out of 88 events were categorised as low-magnitude local earthquakes which occurred within Peninsular Malaysia and are of Mw≤4.0 whereas the remaining 54 earthquakes were classified as far-field earthquakes from the SSZ and SF. These latter events were located more than 400 km away and have Mw ranging from 5.0 to 9.1. The focal depth of LI earthquakes ranges from the surface to 22.5 km while the focal depths for far field earthquakes range from 9 to 580.9 km. PGA data utilised in this study were from the original uncorrected accelerograms and were not post-processed as they are normally smaller due to time decimation and frequency band-limited filtering (Campbell, 1981). As the recorded PGA values (in vertical and two perpendicular horizontal directions) across Peninsular Malaysia were very low (0.00003 to 0.0616 ms−2), the peak value from an individual recording was utilised as the worst-case scenario in this study. The 378 records were from rock sites (NEHRP class site B) while the remaining were from soil sites (NEHRP class site E).
A comprehensive SHA requires a sizeable amount of data. In addition to the data from MMD, we obtained data due to past earthquakes around the Sumatran region from the USGS and ISC earthquake catalogues. The combined catalogue comprises earthquake data for the region 10∘ N–7∘ S and 90–106∘ E with minimum earthquake magnitude of Mw≥4.0 for the period of 4 January 1907 to 31 December 2016. The total events in the raw catalogue were 22 734. However, considering that earthquake hazard is usually estimated using a Poisson model, not all data from the catalogue were suitable as they contained both foreshocks and aftershocks. The “de-clustering” (removal of the dependent events, i.e. foreshocks and aftershocks from background seismicity) leads to a better estimation of random events which is a vital aim in SHA (Kolathayar and Sitharam, 2012). For this purpose, the de-clustering was performed using the algorithm proposed by Gardner and Knopoff (1974). This process, together with the removal of duplicates, eliminated 19 886 dependent events with the remaining 2848 events identified as main shocks. Out of these 2848 events, 1128 events were from SFZ with Mw≥4.0 and the remaining 1720 were from SSZ with Mw≥5.0. The catalogue completeness analysis was subsequently conducted using Stepp's (1972) method. Based on the catalogue completeness analysis, the earthquakes from the SSZ for magnitude interval between are reported complete for the past 45 years, while the earthquakes interval between and magnitude Mw≥6.5 are considered complete for the past 70 and 115 years, respectively. As for the SFZ, the magnitude interval between is reported complete for the past 45 years, while the magnitude interval between and magnitude Mw≥6.0 are considered complete for the past 60 and 100 years, respectively. The results are shown in Fig. 3.
Identification of the seismic source model based on geological evidence, geotectonic province, historic seismicity, geomorphic investigation and other relevant data is one of the crucial steps in SHA. For the present study the earthquake sources utilised to define the source models have been confined to an area encompassing 91∘–106∘ E and 10∘ N–7∘ S. Here the assumption is that earthquakes that are capable of causing significant ground motion originate as far as approximately 800 km radius away from the most northwestern point of Peninsular Malaysia, the island of Langkawi, and the southernmost point, considered here to be Singapore.
DSHA oftentimes presents the worst-case scenario of an earthquake event, and consideration of the probability of location and time of occurrence plays a less critical role compared to PSHA (Moratto et al., 2007). Although ground motion data collection only began in 2004 in Peninsular Malaysia, records of great earthquakes (Mw>8.0) from the Sumatra region are available for the period since 1797 (Newcomb and McCann, 1987). It would be insightful to model these historical events also to predict the PGA values across Peninsular Malaysia. For this purpose, point sources instead of line and areal sources are utilised here to replicate the historical events. With no clear segmentation for the SSZ, as opposed to the SFZ, a grid of 1.0∘ × 1.0∘ and a limitation of 200 km on either side of the digitised subduction line were considered to cover the entire area. The maximum possible earthquake (MPE) utilised for the analyses was the largest earthquakes with Mw≥7.0 that occurred within the same grid since 1797. In addition, a simulated event of Mw9.1 was presumed at the Mentawai–Siberut segment (2∘ S, 99∘ E) as studies have reported the possibility of a mega-earthquake within the next couple of decades (Lay, 2015; Philibosian et al., 2014). In contrast, the fault lines on the SFZ have been researched more extensively and are better wedged compared to the SSZ, with 19 segments spanning across Sumatra, as listed in Sieh and Natawidjaja (2000). Therefore, events with Mw≥6.0 along these segments were considered as the MPEs. As for the LI events, although a few major faults have been identified within the peninsula, only minor earthquakes from Bok Bak and Bukit Tinggi faults have produced notable ground motion, and thus only the six events with magnitude Mw>2.4 were considered.
With the MPEs thus determined, the next step was to assign a maximum possible magnitude to these locations. Multiple scenarios were considered for this objective. Scenario 1 represents the maximum historical earthquake recorded by ISC, USGS and also Newcomb and McCann (1987) for the Sumatran region while the maximum magnitudes for local earthquakes were recorded by the MMD. Earthquake magnitudes that were recorded in body-wave magnitudes (mb) especially for the data collected from MMD were converted to Mw using the regression suggested in Loi (2018). As it is almost impossible to determine if past events will be superseded by earthquakes of larger magnitude, one standard rule of thumb that has been employed to consider the “worst-case” scenario is to increase the magnitude of past events by Mw0.25 or 0.5 (Naik and Choudhury, 2014; Secanell et al., 2008; Shukla and Choudhury, 2012). Hence, this method was assigned to Scenario 2. Due to its slower convergence, an increment of 0.3 Mw was applied to events originating above the Equator from the SSZ. In addition, this zone has undergone massive rupture, frequently releasing strain energy in recent times which have resulted in mega-earthquakes of Mw 8.6, 8.6 and 9.0 in the year 2005, 2012 and 2004, respectively. In contrast, an increment of Mw 0.5 was applied to events located below the Equator from the same region due to this region's faster convergence and also because researchers have predicted that a major earthquake may happen along the Mentawai segment within the next few decades (Lay, 2015; Nalbant et al., 2005). However, the maximum magnitude applied was limited to Mw9.5 considering that the largest ever earthquake recorded was the Mw9.5 1960 Chilean earthquake. Similarly, an increment of Mw0.5 was assigned for events emanating from the SFZ with a maximum magnitude of Mw8.0. Within the peninsula, records for the local intraplate events have been scarce and sporadic. Hence, the MPEs for the local intraplate events were retained as per Scenario 1 as it is difficult to estimate now a credible maximum magnitude for the faults. Nonetheless, taking into account that KL lies in close proximity to three major fault lines (Bukit Tinggi, Seremban, and KL faults) and records indicating that stable continental earthquakes have the odd capability of striking above Mw6.0 (Johnston and Kanter, 1990; Schulte and Mooney, 2005), a plausible increment of Mw1.0 was assigned to the Bukit Tinggi event. The values from Scenarios 3 and 4, by contrast, were obtained from literature and are only applicable for the SFZ. Scenario 3 tabulates the predicted maximum magnitude for each of the 19 segments with a 200-year return period by Natawidjaja and Triyoso (2007), while Scenario 4 represents the predicted maximum magnitude for each of the 16 tessellated zones in SFZ using k-means algorithm analytical approach by Burton and Hall (2014). The maximum magnitudes for each of the four scenarios were thereafter compared with the largest value being utilised as the MPE.
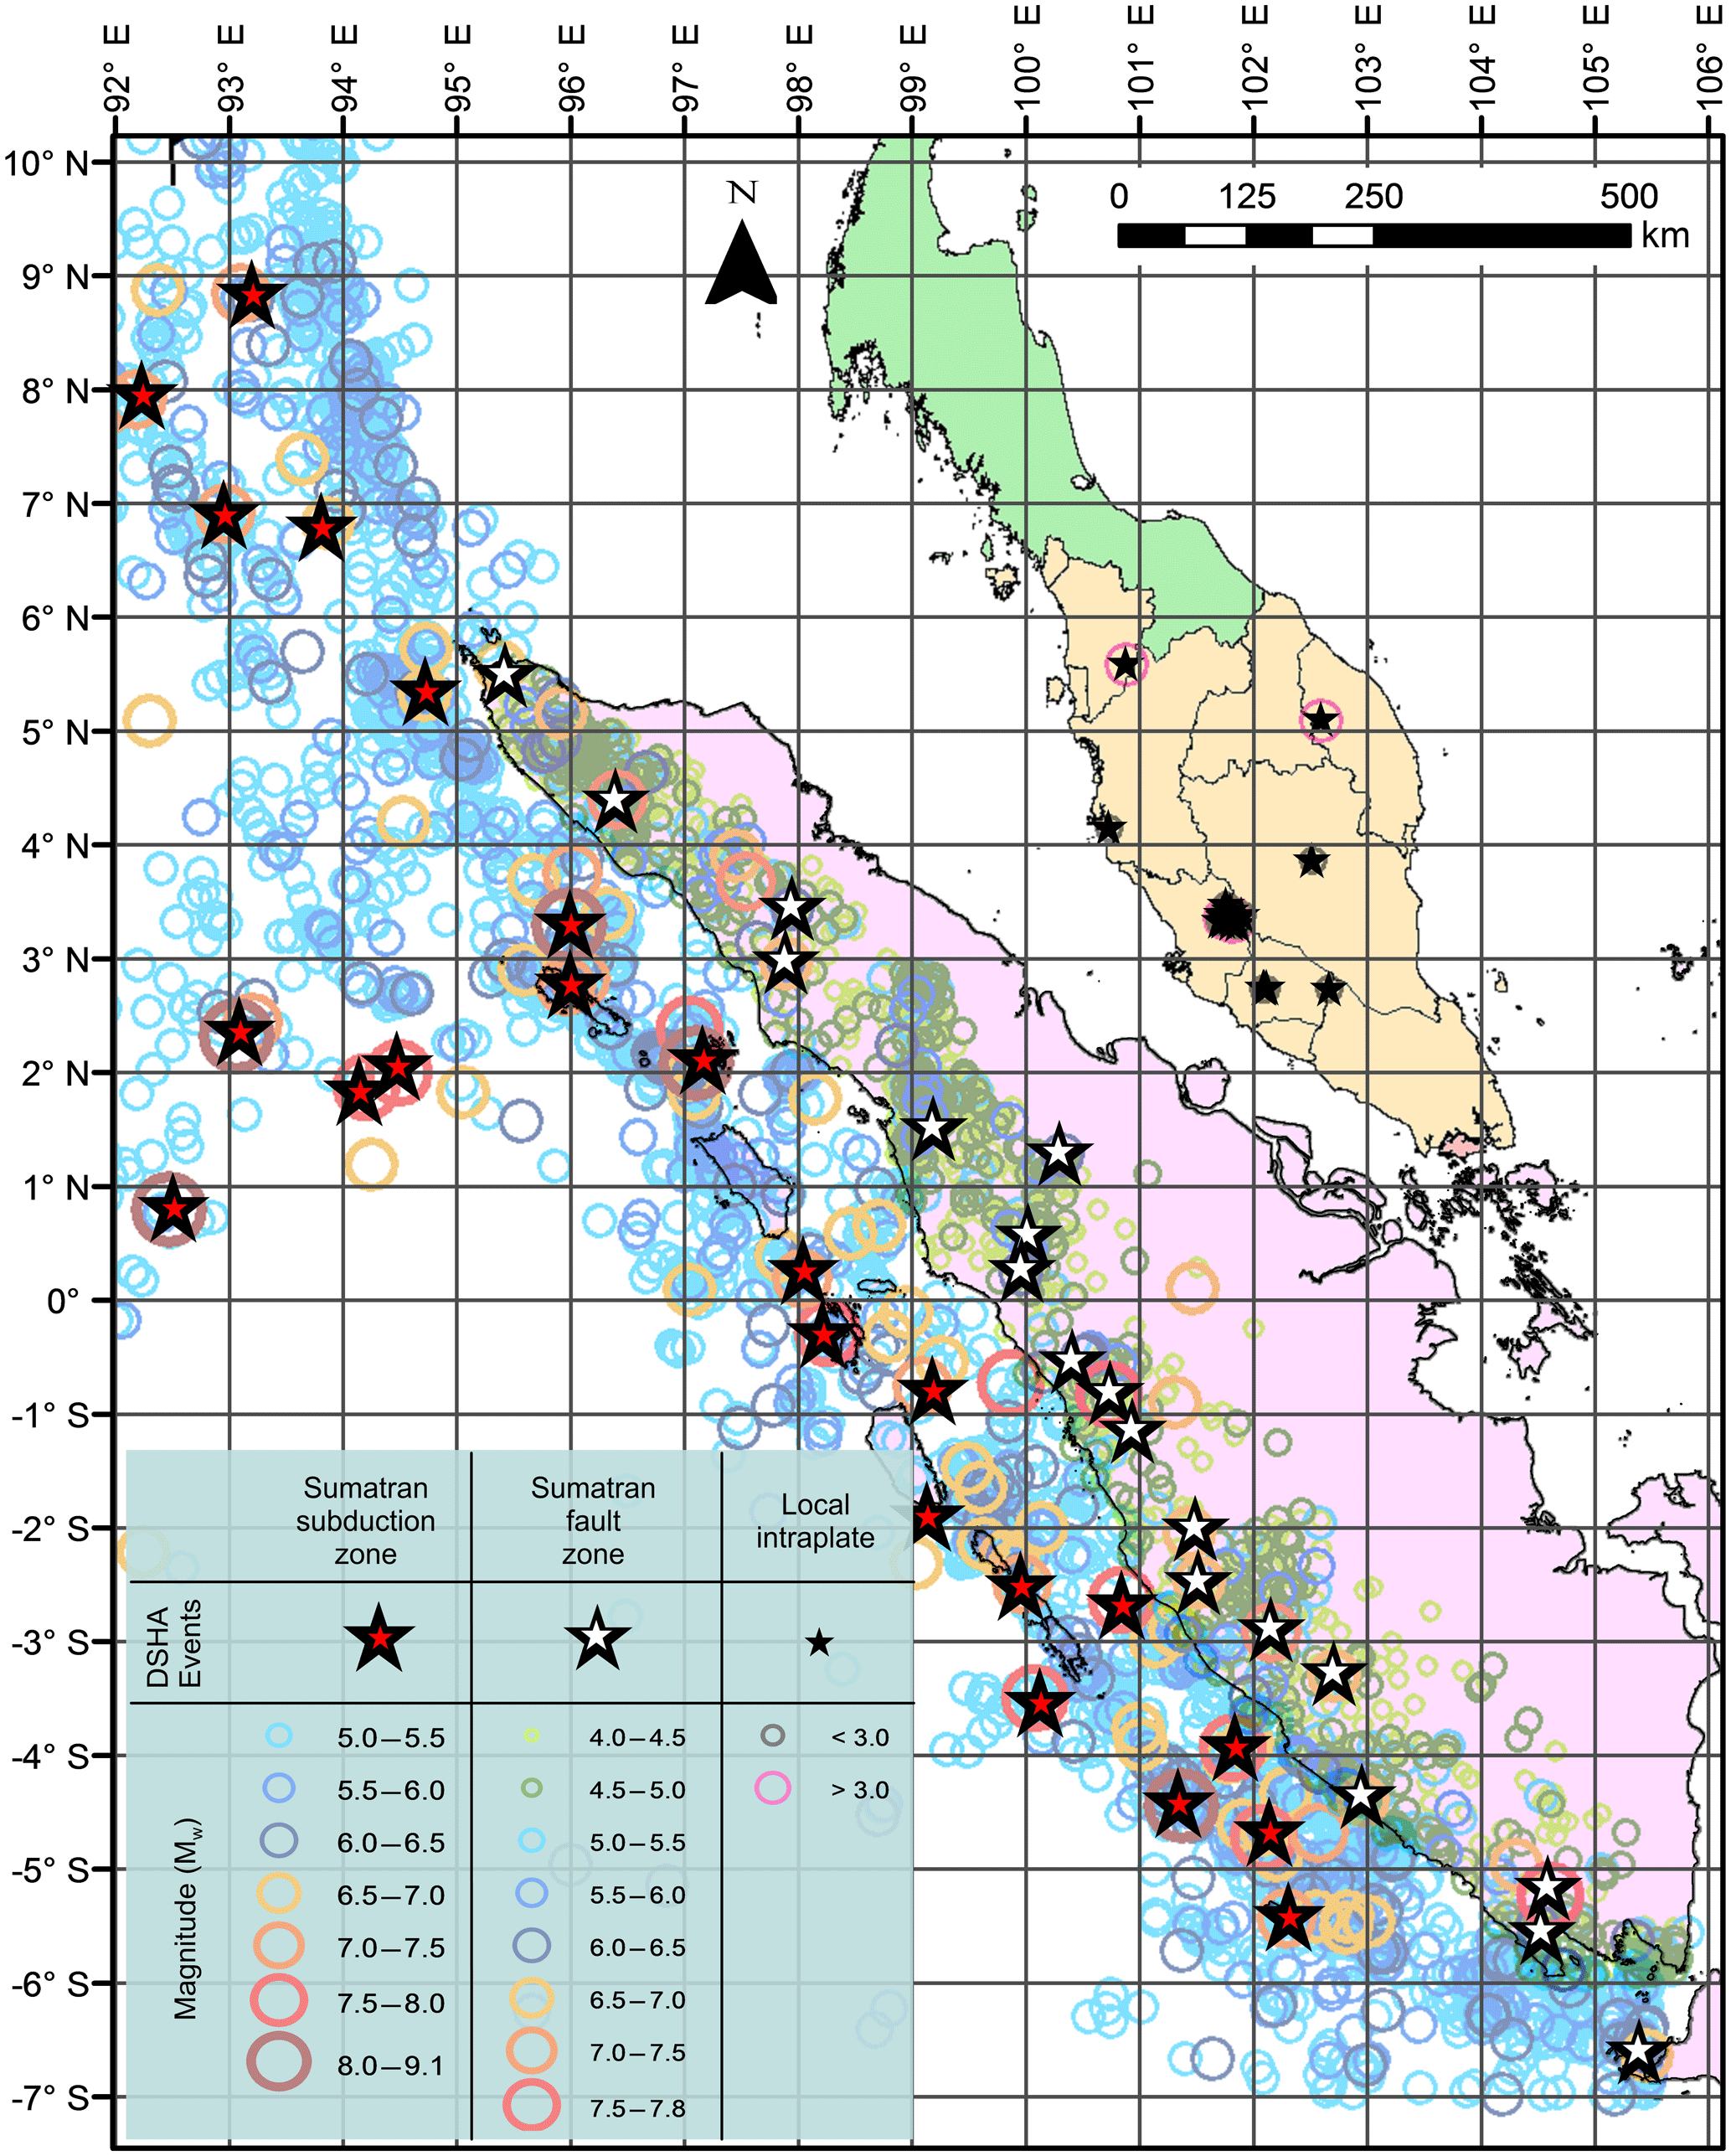
Figure 4An epicentre map of historical earthquake magnitudes: Mw≥5.0 for the Sumatran subduction zone, Mw≥4.0 for the Sumatran fault zone and low-magnitude earthquakes within Peninsular Malaysia for the period of 1906–2016. The records for these events were taken from USGS earthquake catalogue, MMD and published literature. Earthquake sizes are given on scales and colours proportional to the earthquake magnitudes. The asterisks show the locations of the MPEs utilised for DSHA for each region.
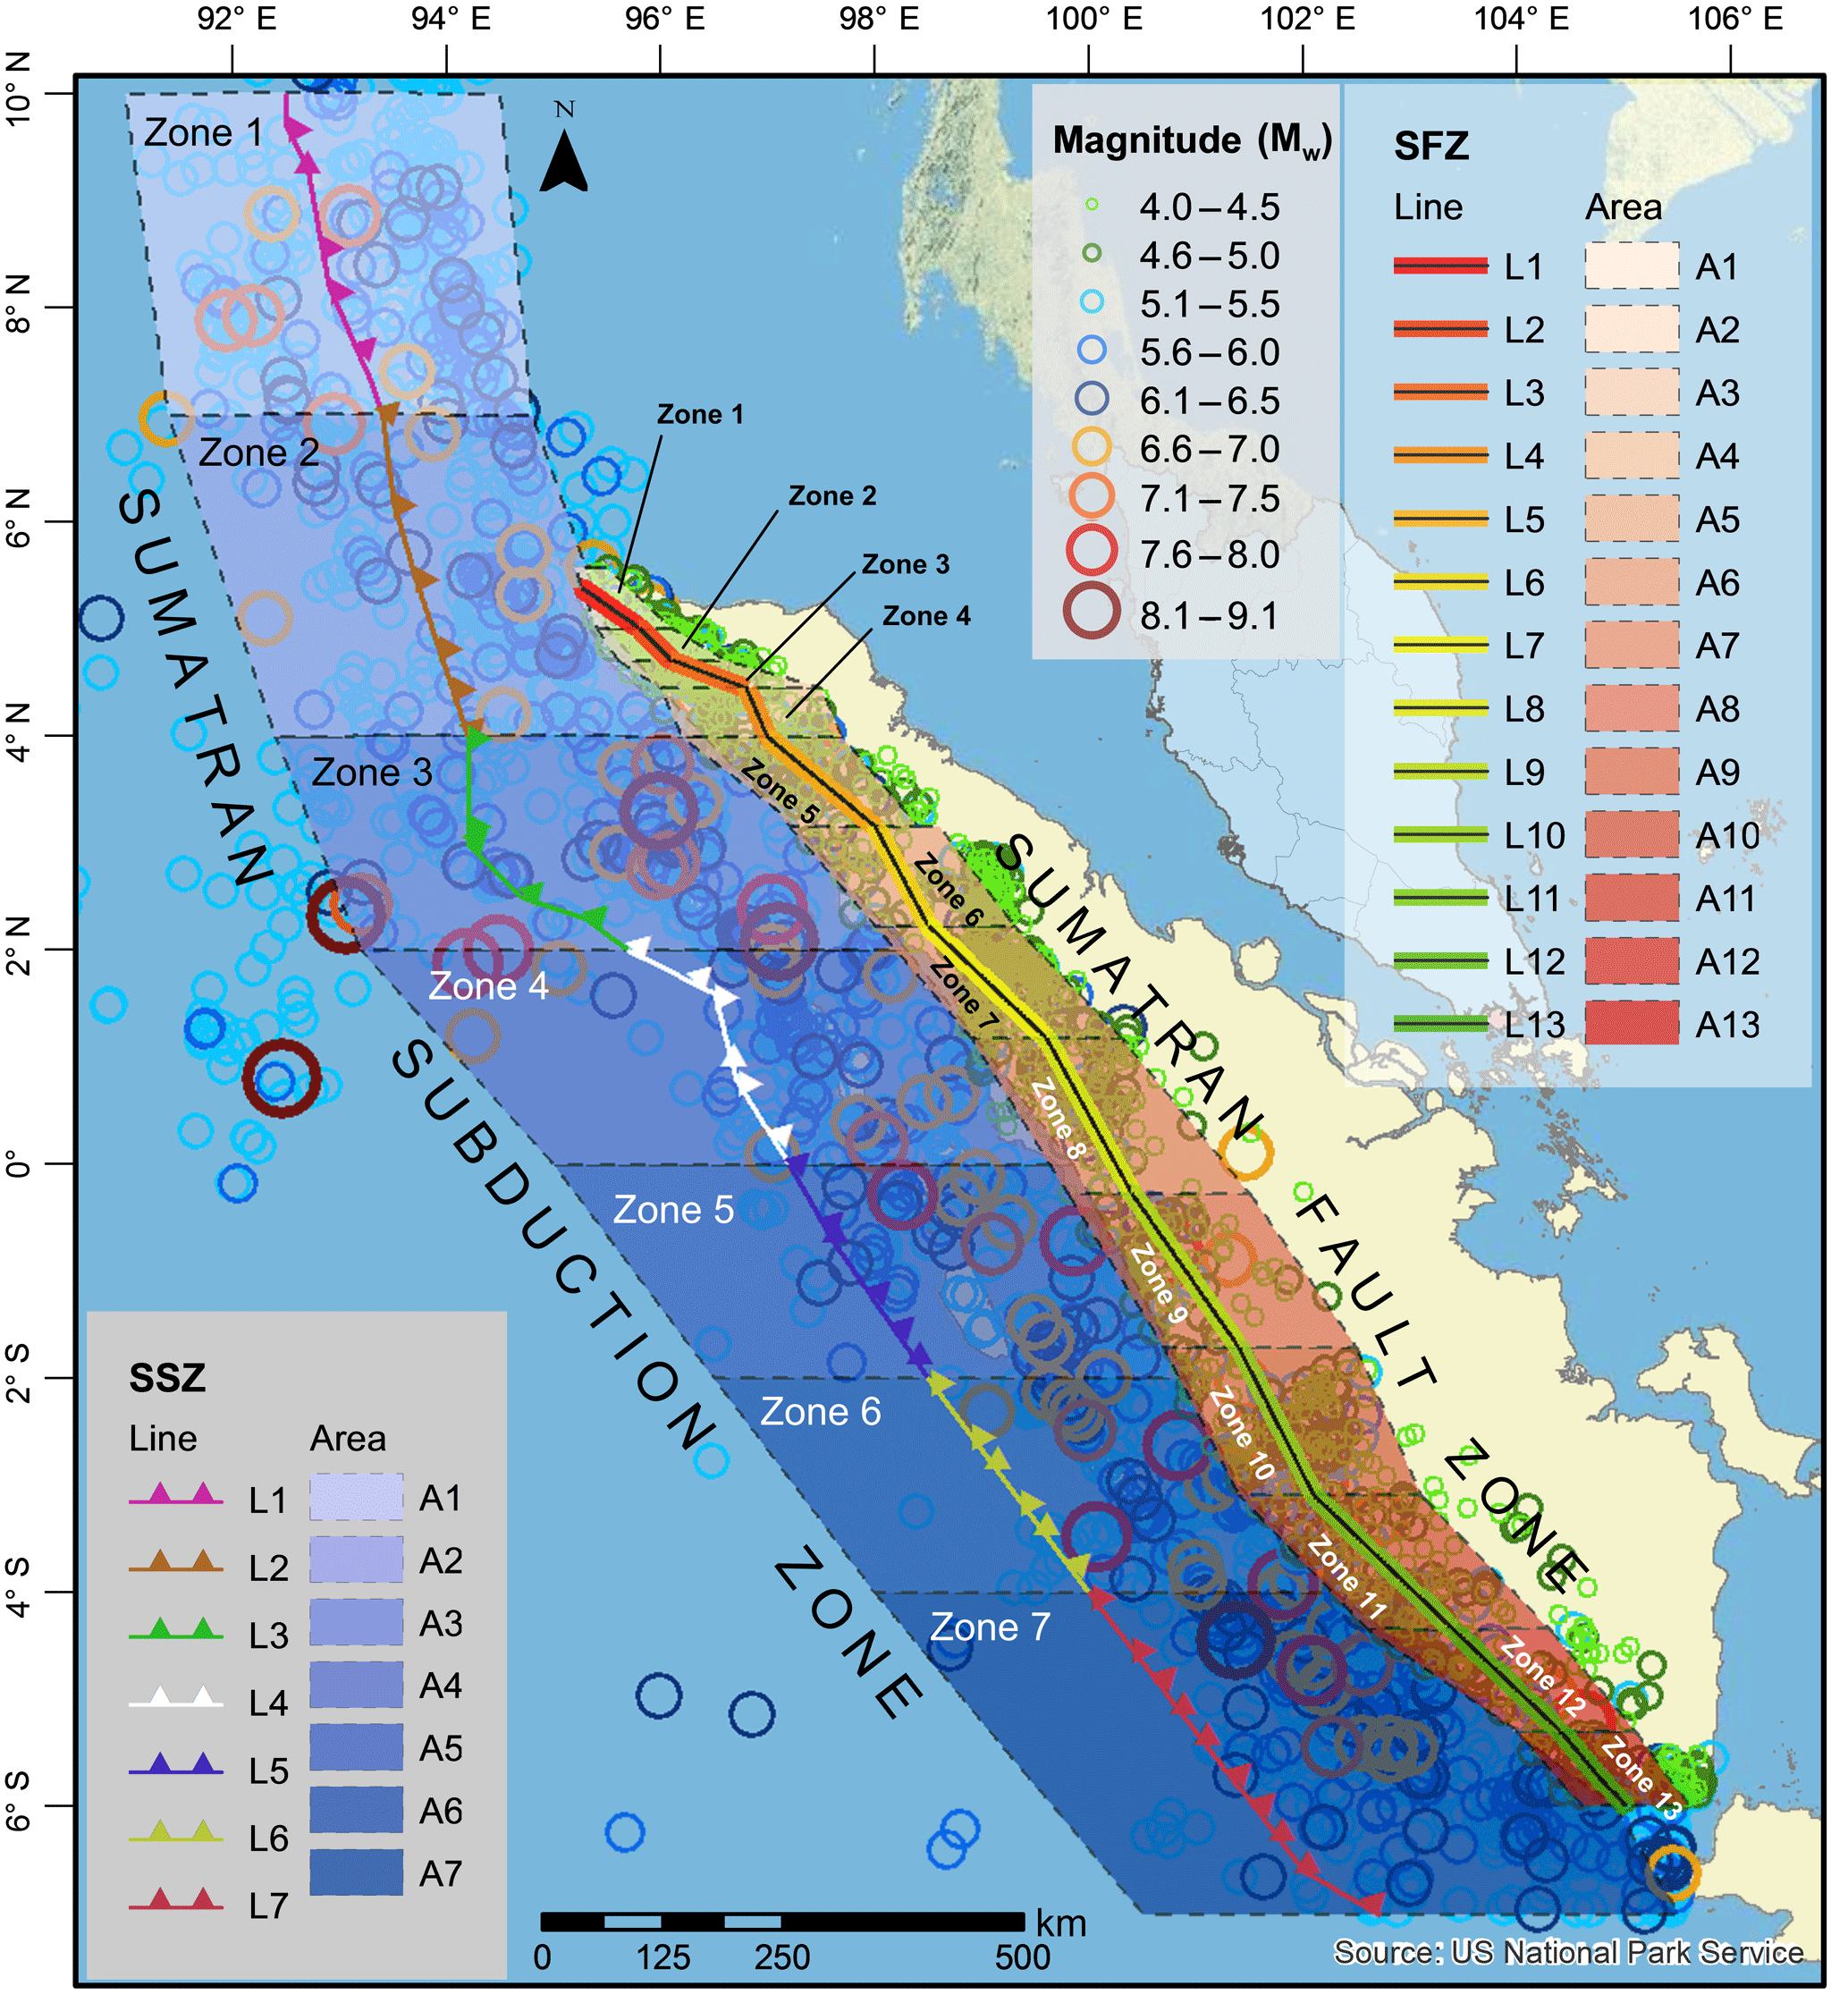
Figure 5Seismic zonation map for the Sumatra regions with SSZ and SFZ being split into two different source models (line and area) for PSHA. The details of these zones such as length, slip rate and Mw Max are listed in Table 3.
Table 2List of MPEs from all three sources used in the DSHA.
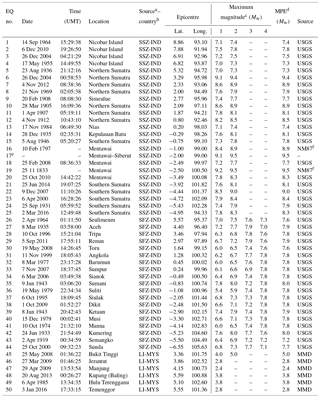
a Source: SSZ – Sumatran subduction zone; SFZ – Sumatran fault zone; LI – local intraplate. b Country: IND – Indonesia. MYS – Malaysia. c 1: maximum historical earthquake; 2: maximum historical earthquake +0.3 Mw for SSZ above the Equator, or +0.5 Mw for SSZ below the Equator up to a maximum of 9.5 and SFZ until a maximum of Mw 8.0 and + Mw 1.0 for Bukit Tinggi; 3: maximum earthquake predicted from Natawidjaja and Triyoso (2007); 4: maximum earthquake from Burton and Hall (2014). d MPE: maximum magnitude from column 1, 2, 3 and 4. e. Event 16 is a simulated event which predicts that the Mentawai gap (0∘–2.5∘ S) may produce large EQ in the next few decades (Nalbant et al., 2005; Lay, 2015). f NM87: Newcomb and McCann (1987).
A total of 50 MPEs were identified from all three regions (SSZ, SFZ and LI). The 25 events were for the SSZ, with the largest anticipated events coming from the 2004 Aceh earthquake and the simulated Mentawai–Siberut earthquake at Mw9.4 and Mw9.5, respectively, while smaller events (Mw of 7.3–7.8) were projected around the Nicobar Islands cluster between 6 and 9∘ N. The least maximum magnitude for the SFZ was located near the Toru, Barumun and Manna segment, recorded at Mw6.0 while the largest was from the Sumani segment, recorded at Mw7.8. Despite the relatively low magnitudes recorded for the former, Natawidjaja and Triyoso (2007) estimated based on rate of seismic moment calculation that a maximum magnitude for these three segments may be as high as Mw7.4. The maximum magnitude calculated by Burton and Hall (2014) for the same zones was even higher, in the range of Mw=7.6–7.8. The maximum magnitude estimated by these two literature sources was noticeably higher when compared to actual recordings and thus were selected as the MPEs for our DSHA. As for the local earthquake scene, the highest MPE utilised for DSHA was that of the Bukit Tinggi earthquake. A detailed list of these events from all three regions with four different scenarios and the selected MPEs is presented in Table 2 and the locations are illustrated in Fig. 4.
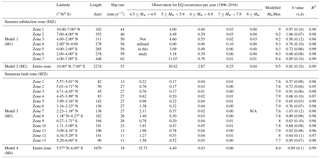
Table 3Summary of locations, earthquake recurrences and seismic activity quantification for the SSZ and SFZ.
Similar to DSHA, one of the crucial steps in PSHA is to identify the seismic source model. While DSHA in the current study utilises point source, linear and areal sources were used for the PSHA. Although the utilisation of the latter two sources have been well documented in the literature (Anbazhagan et al., 2008; Kramer, 1996; Ornthammarath et al., 2010; Vipin et al., 2009), specifying the linear and area sources for SSZ is complicated owing to the following: the SSZ is extremely long (over 4000 km), its location off the coast of Sumatra and key tectonic parameters such as its segmentation length, displacement and area are not well defined. The subduction line utilised in the PSHA analyses for the SSZ was approximately digitised using the USGS maps. In regard to the upper and lower boundaries of SSZ, past observations have noted that majority of the earthquakes tend to strike at a certain depth to the east of the subduction line, instead of to the west, due to the subduction of the Indian–Australian Plate (Fig. 5). This phenomenon is more prominent to the south of the Equator as illustrated in Fig. 5. Keeping in mind that large earthquakes are capable of striking on both sides of the subduction line, the boundary width of the areal source for SSZ was confined to be within 200–250 km on either side of the subduction line and away from Sumatra. As the age of the plate and slip rates differ from north to south, with literature suggesting that the slip rate increases from north to south along the subduction line (Chlieh et al., 2007; Moeremans et al., 2014; Subarya et al., 2006), this zone was further segmented into seven different zones at every 2∘ or 3∘ latitude intervals with different modelled maximum magnitude (Mw Max) for each individual zone.
In contrast to SSZ, the occurrences of earthquakes to the east and west of the SFZ are almost equal throughout. Although the SFZ has been better defined, as shown by Natawidjaja and Triyoso (2007), some of the subdivided segments tend to overlap making the fault line boundary determination somewhat complicated. Therefore, for the latitudinal margin for the SSZ, the boundary was divided as per the suggestion by Burton and Hall (2014). However, the SFZ in the present work is subdivided into 13 instead of 16 segments as suggested by Burton and Hall (2014). This is achieved by combining the southernmost three segments into one segment in view of the fact that these are located relatively far off from the area of our interest. However, the width of these zones was not uniform: to the left of the fault line the zone width was constrained to be within Sumatra while to the right, the width varied from approximately 20 to 100 km away from the fault line. Although the segmentation of this study follows the suggestion by Burton and Hall (2014), the slip rate was approximately extracted based on Natawidjaja and Triyoso (2007). For example, even though the length of Zone 1 is shorter and falls into the Seulimeum fault in Natawidjaja and Triyoso (2007), the slip rate was assumed to be the same as suggested in Natawidjaja and Triyoso (2007). A map showing source modelling zonation for the PSHA is illustrated in Fig. 5.
While multiple scenarios were considered to determine the MPEs in the DSHA, in the PSHA for SSZ the present analysis considered that a Mw Max earthquake could take place all along the SSZ even though the values vary from north to south. With slip rates towards the north relatively slower compared to those in the south, the upper boundary Mw Max for Zone 1 was fixed at 9.0 with the values gradually increasing until a maximum of 9.5 for Zone 7. By contrast, multiple MPEs for the SFZ from Table 2 fall within a same zone for some cases in the current study. As such, the Mw Max is selected based on the highest MPE within the same zone. The length, slip rate and Mw Max for each zone are given in Table 3.
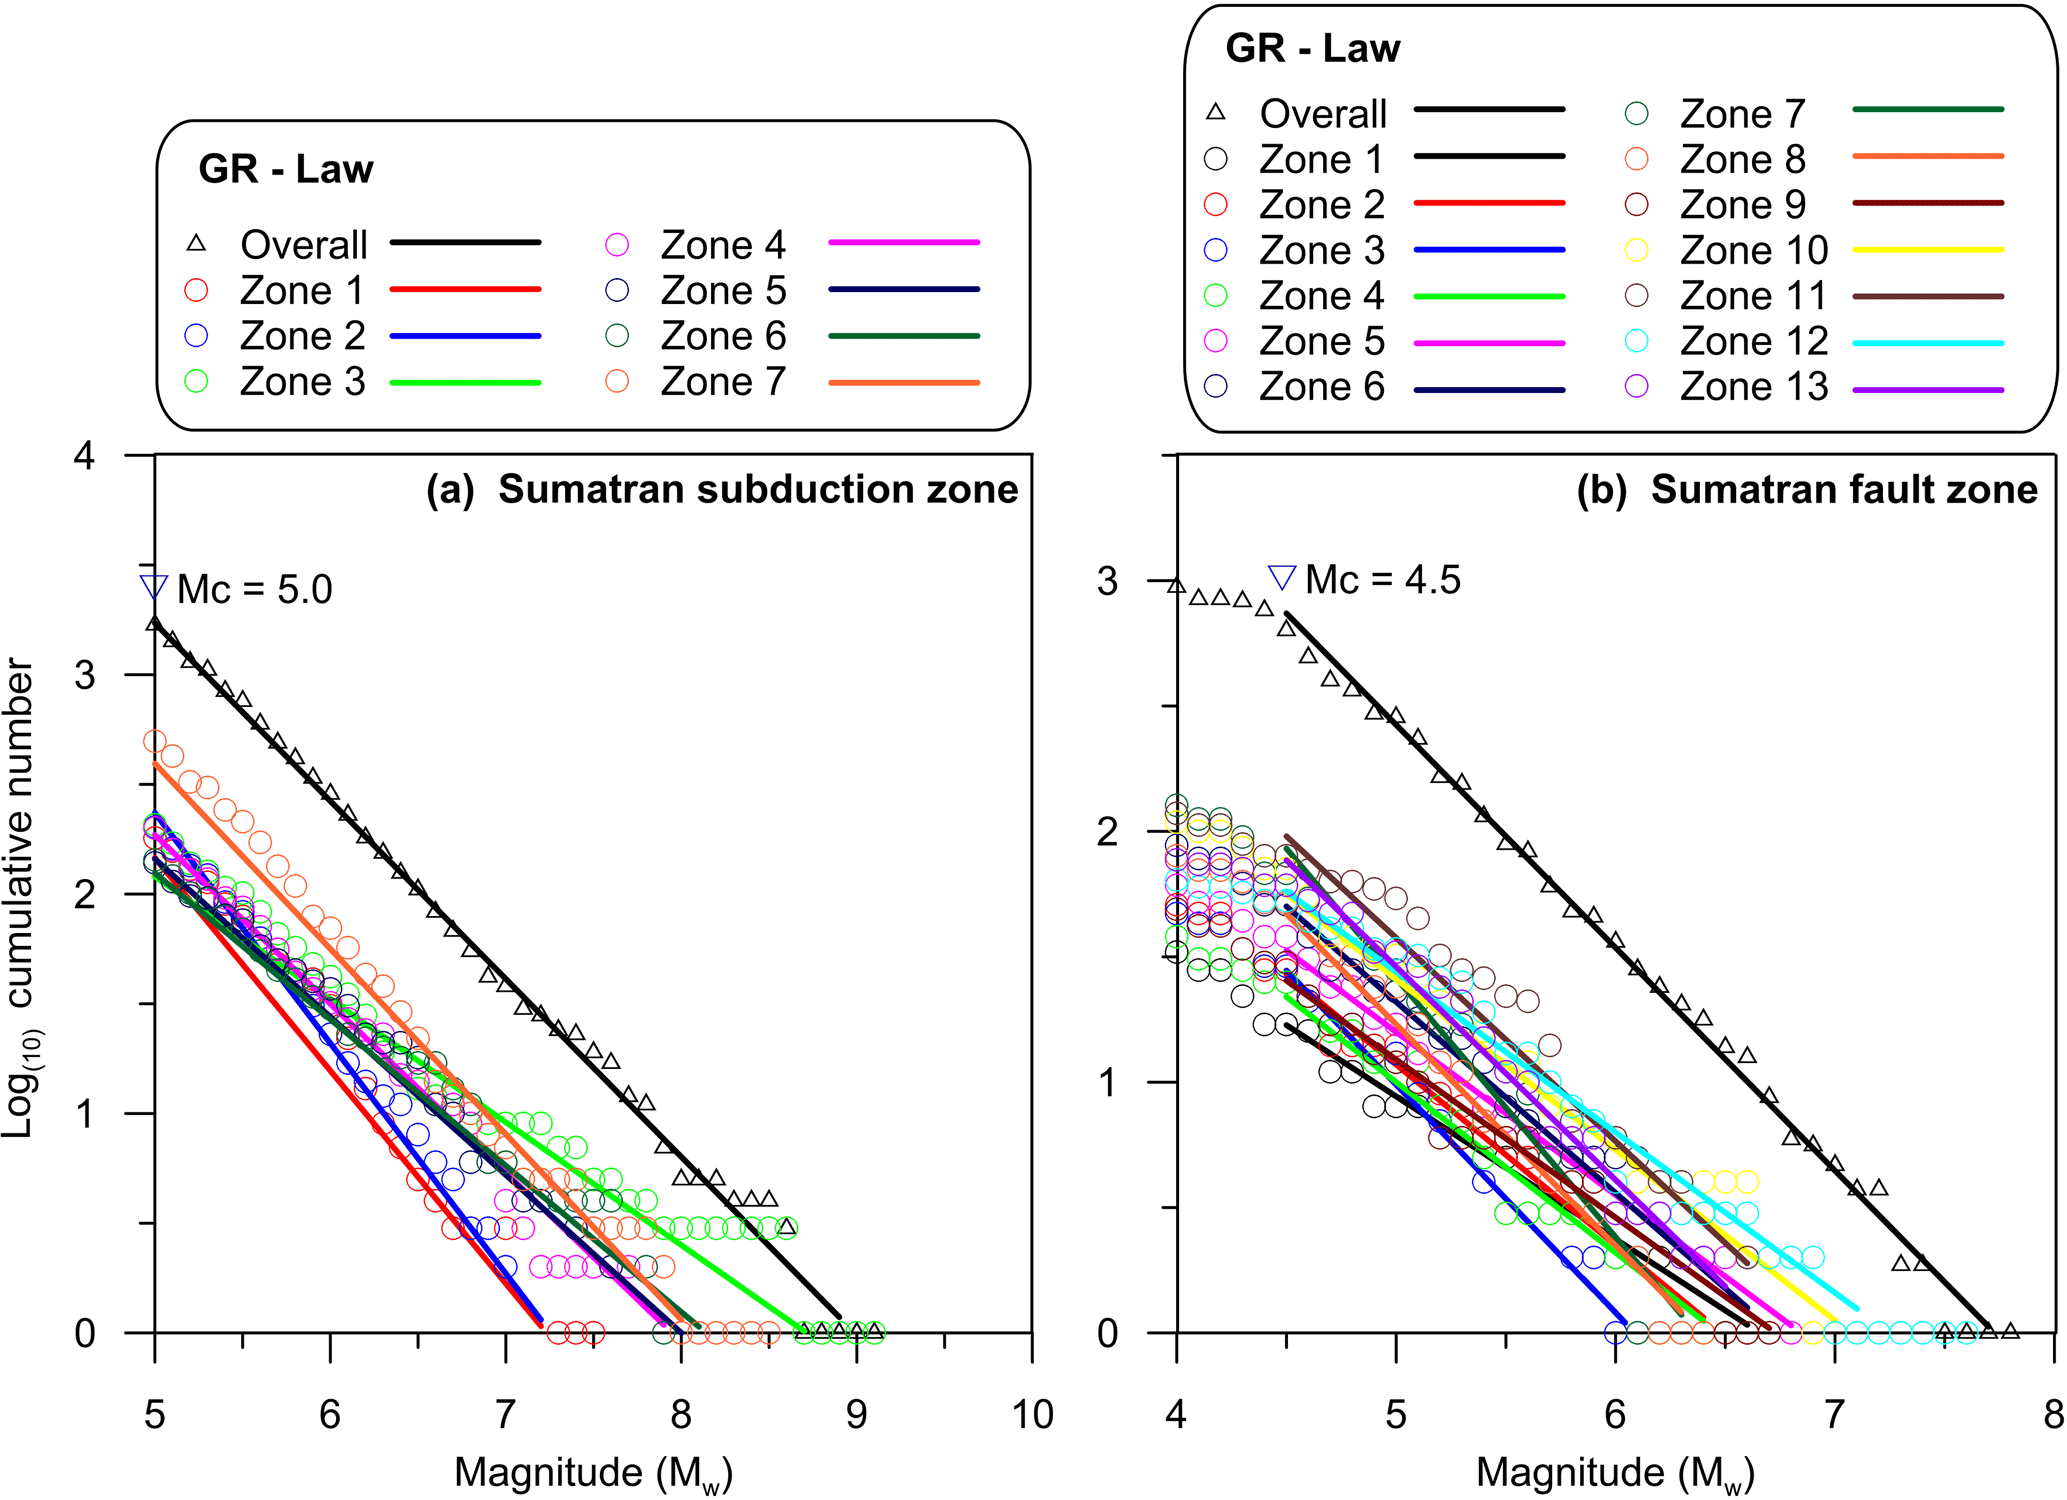
Figure 6Magnitude vs. cumulative number relation obtained using the Gutenburg–Richter Law (GR-Law) for the (a) Sumatran subduction zone and the (b) Sumatran fault zone. The b values are listed in Table 3.
Although not directly related to the PSHA, Table 3 also summarises the observations for earthquake occurrences per year for the past 40 years (since 1976) for every interval of Mw1.0 from both zones. This is despite that the SHA considers records from USGS since 1907. The approximate range of 40 years was chosen based solely on observation. The reason is that the records for the years prior to 1976 are relatively scarce. Besides, throughout the years, the expansion of ground motion stations worldwide and collection of earthquake data have progressively increased, and it is difficult to determine a cut-off point to which time should reliable data be considered. Moreover, data prior to 1976 consist of <8 % of the overall records, after the removal of foreshocks and aftershocks. The records for the SSZ clearly show that earthquake occurrences in Zone 7 are relatively higher compared to that in Zone 1, in line with studies suggesting movement rates are higher in the south of the SSZ, thereby indicating that higher slip rates result in higher frequency of earthquakes. However, a similar pattern cannot be observed for the SFZ wherein the earthquake frequency is rather scattered with no clear correlation between the slip rate and the frequency of earthquake occurrences. This is reflected for the SFZ in Zones 1 and 13 wherein although the pair have similar fault lengths and slip rates, the difference in frequency of occurrences was still relatively distinct at 0.44 and 2.18, respectively. Similarly, both Zones 8 and 9, despite having analogous fault lengths and slip rates did not result in similar frequency of occurrences. Apart from that there also seems to be no direct link between slip rate and the upper boundaries of Mw for both regions.
One of the most commonly used methods to characterise seismicity for a region is the Gutenberg–Richter earthquake recurrence law (Gutenberg and Richter, 1944). This law estimates the seismic parameter b value which follows a magnitude exponential distribution expressed as follows:
where Nm is the total number of earthquakes exceeding M for the predetermined region, a is a constant that reflects the earthquake productivity or seismic activity, and b indicates the relative occurrence of small and large events. Larger b values, the slope of frequency vs. magnitude distribution (FMD), implies a larger proportion of small earthquakes whereas a small b value represents relatively small number of high-magnitude earthquakes (Nanjo et al., 2012). Of the two variables, the b value has often been prioritised by researchers and has undergone many statistical and analytical evaluations over the past few decades. It has been widely recognised that this value normally hovers around 1.0 for seismically active regions (Baker, 2008; El-Isa and Eaton, 2014; Mogi, 1962; Singh et al., 2015).
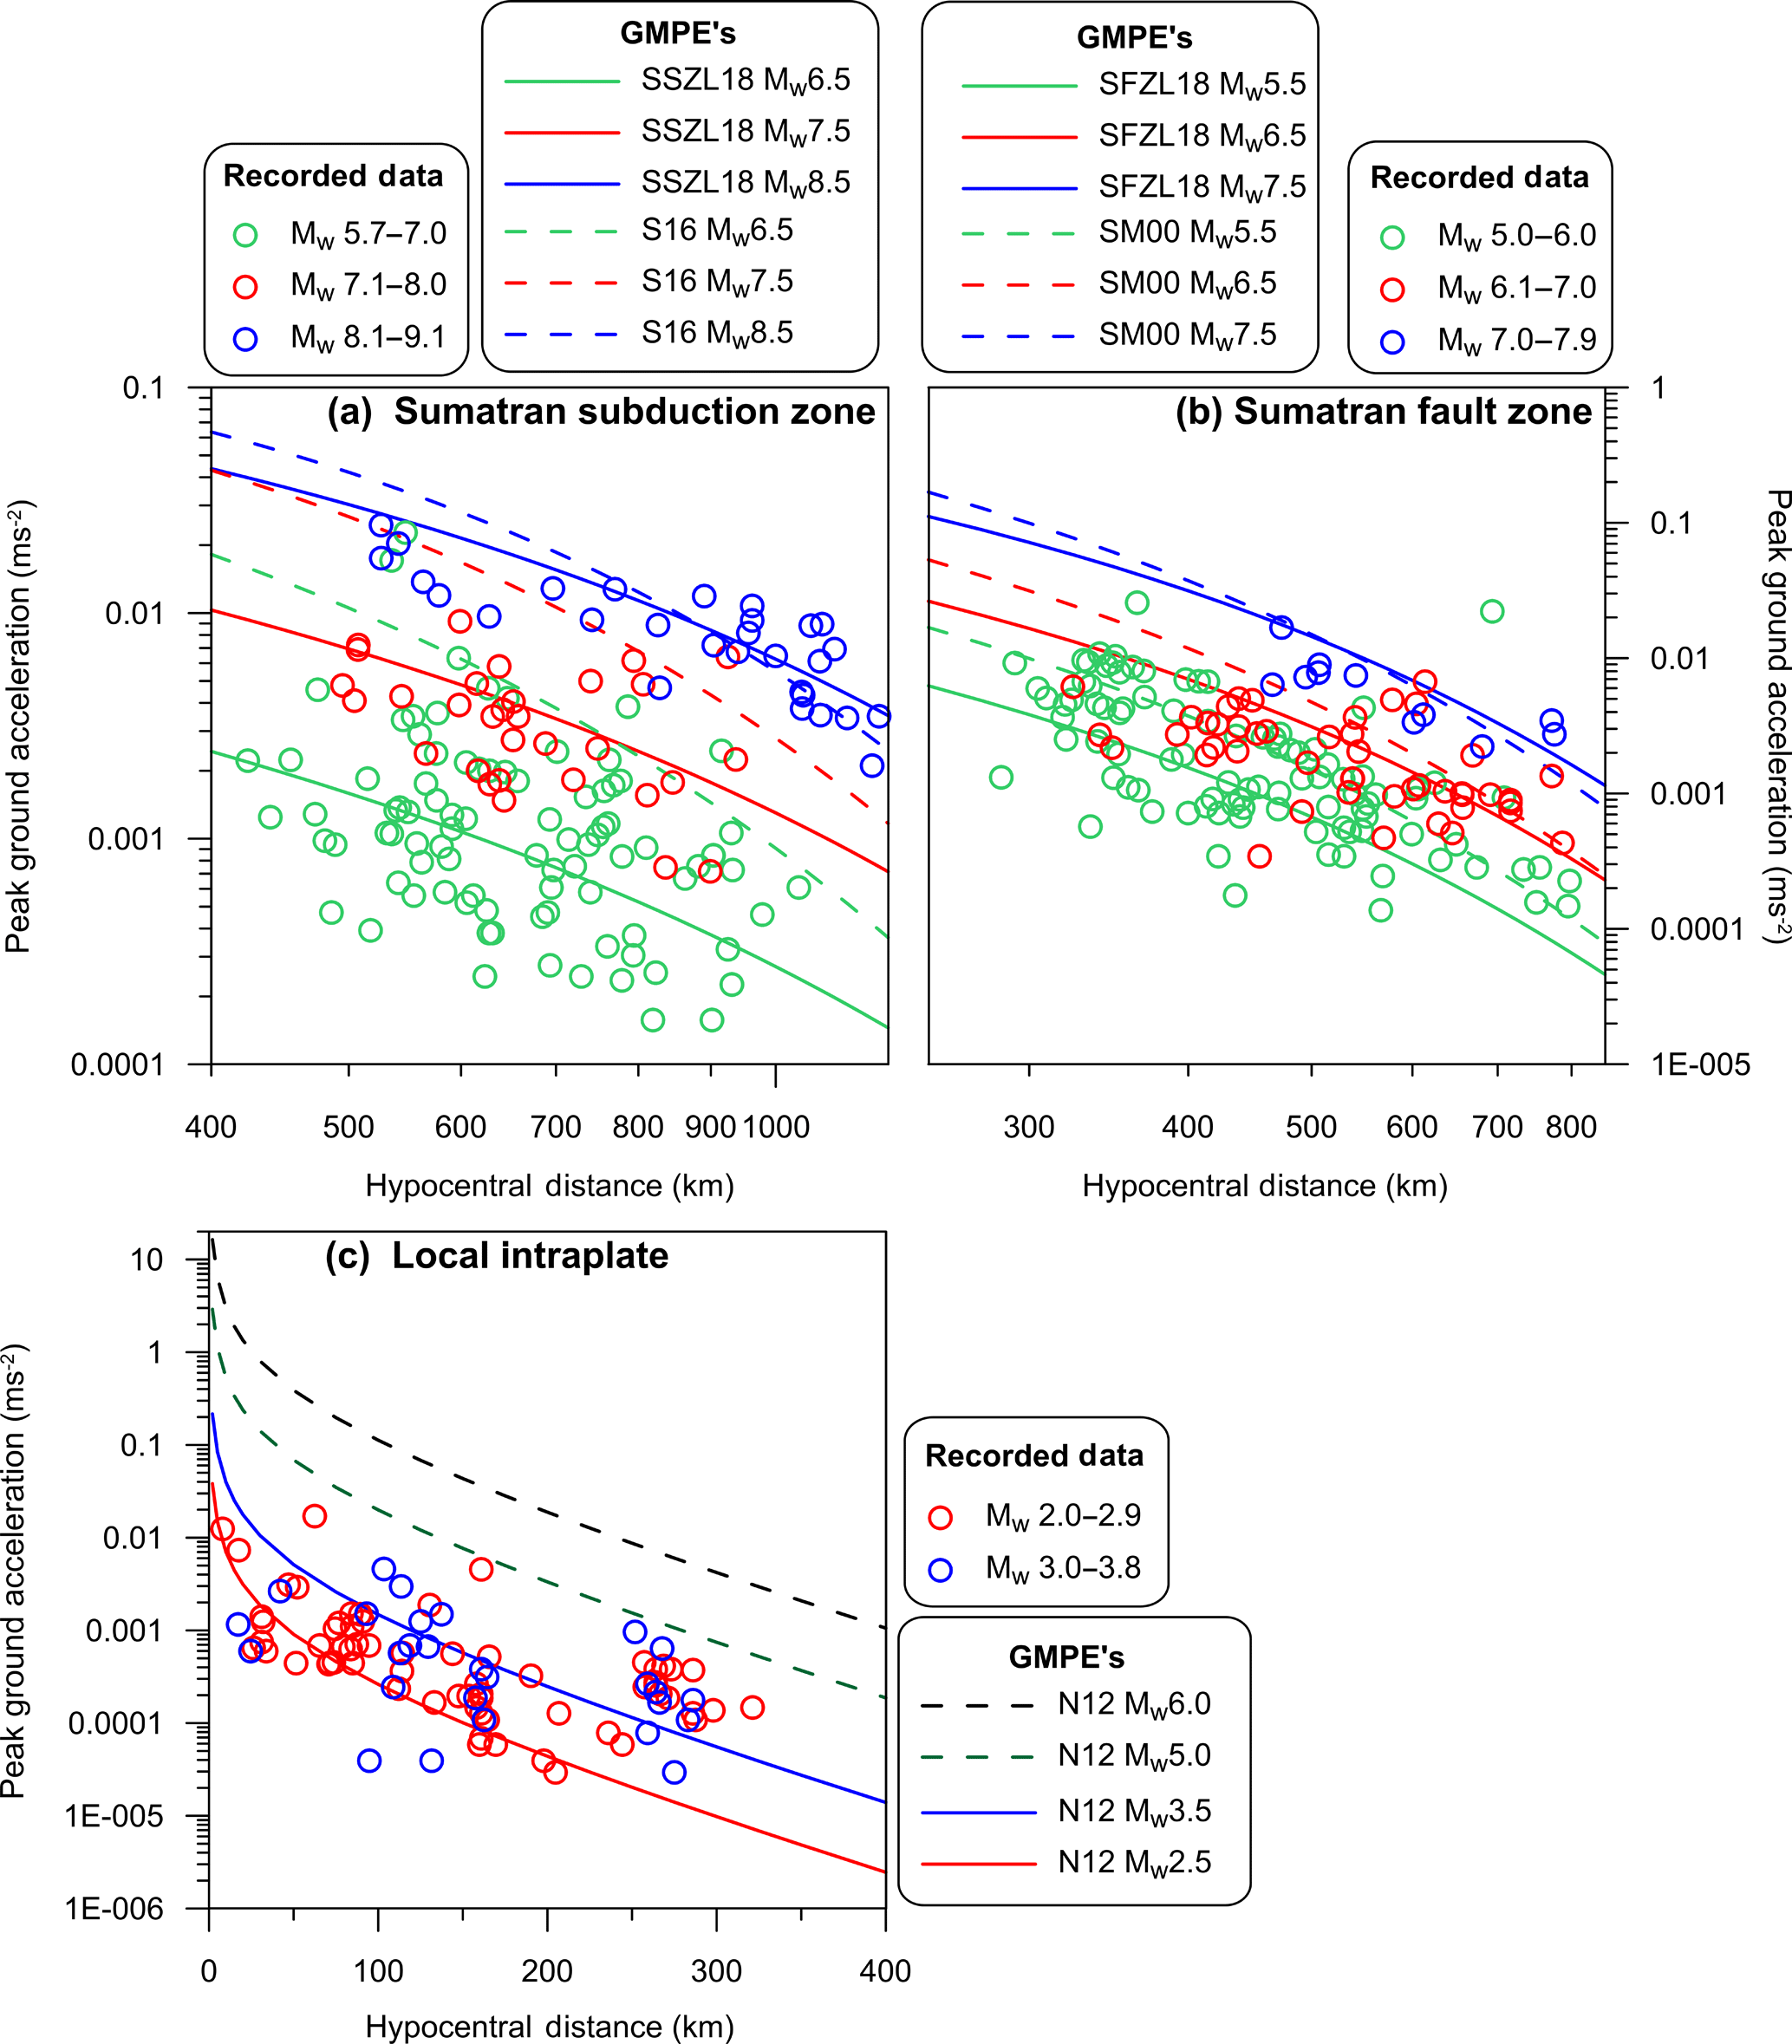
Figure 7Plots at various magnitude intervals for the GMPEs used in the current study with respect to recorded ground motion data for the (a) Sumatran subduction zone, using GMPEs proposed by Loi (2018) and Shoushtari et al. (2016), denoted as SSZL18 and S16, respectively; the (b) Sumatran fault zone, using the GMPEs proposed by Loi et al. (2018) and Si and Midorikawa (2000), denoted as SFZL18 and SM00, respectively; and the (c) local intraplate fault zone, using the GMPE proposed by Nguyen et al. (2012), denoted as N12.
A least-squares regression method was utilised to obtain the b values for the studied region with earthquake threshold magnitude above Mw5.0 for the SSZ and 4.0 for the SFZ. Figure 6 presents the FMD plots for the SSZ and SFZ as a whole and also for each of the 7 and 13 zones individually with the b values listed in Table 3. However, it should be remembered that the b values in the table have no relation to the observation column in Table 3 as the FMD plots considered data since 1907 and not only for the past 40 years.
As illustrated in Fig. 6, the b values range between 0.56 and 1.06 for the SSZ and between 0.57 and 1.03 for the SFZ. The estimated b value for Zone 3 in SSZ was noted to be particularly low as this zone has been associated with only a few earthquakes of with Mw>8.0 since 2000. As for the SFZ, the estimated low b values for Zone 1 is due to the moderately short length of Zone 1 with historically large earthquakes (Mw>6.0). The low b value for Zone 9, in spite of its relatively long length, is due to the comparatively low earthquake recurrences on top of the occurrence of odd earthquakes with high magnitude (Mw>7.0). Despite their relatively low b values, the average for the overall regions of SSZ and SFZ was higher at 0.82 and 0.89, respectively. These values concur well with the b values for the PSHA obtained for Sumatra and KL by Irsyam et al. (2008) and Nabilah and Balendra (2012). Petersen et al. (2004) performed PSHA for Sumatra, Singapore and Peninsular Malaysia using proposed b values between 0.63 and 1.08. Pailoplee et al. (2005) and Pailoplee (2017) also calculated relatively low b values, especially for Sumatra, at 0.61 and 0.27, respectively.
Suitable GMPEs that can predict or estimate ground motions in good agreement with recorded ground motion data due to past seismic events are fundamental to SHA. Although numerous GMPEs have been developed and applied worldwide, not many GMPEs are available exclusively for Peninsular Malaysia due to its relatively lower local seismicity and distant location from active seismic hotspots such as the Sumatran region. Naturally, past attempts either adapted or adopted regional GMPEs or relied on the available limited data for developing GMPEs suitable for this region (Adnan et al., 2005; Pan and Megawati, 2002; Petersen et al., 2004). The collection of seismic ground motion data since 2004 by MMD, albeit relatively smaller in quantity compared to more earthquake active regions, has since allowed researchers to either identify suitable GMPEs (Van et al., 2016) or develop independent GMPEs for the peninsula (Adnan and Suhaltril, 2009; Loi, 2018; Nabilah and Balendra, 2012; Shoushtari et al., 2016) using the available ground motion records. Loi et al. (2016), Van et al. (2016) and Shoushtari et al. (2015) have compared the adaptability of selected worldwide GMPEs revealing their limitations wherein most of them either overestimated or underestimated the actual ground motion data for the peninsula. Therefore, more accurate GMPEs developed for this region by Loi (2018) and Shoushtari et al. (2016), together with the GMPE developed for Japan by Si and Midorikawa (2000) are used here to carry out the DSHA and PSHA. As for the LI earthquakes, only DSHA was carried using the Nguyen et al. (2012) GMPE that best fits the scarce data of low-magnitude events (Loi, 2018). The pertinent details of the GMPEs including their functional form, magnitude and distance ranges, tectonic environment and standard deviation utilised to conduct DSHA and PSHA are shown in Table 4. It should be noted that although the distance range of SM00 may not be applicable to the current scenario for SFZ, extrapolation of the model predicts the recorded ground motion data quite well. PSHA was not conducted for the LI earthquakes due to the limited availability of information such as slip rate and recurrence rate of the existing faults. The relationship of these GMPEs to recorded ground motion data due to the SSZ, SFZ and LI earthquakes is plotted at various magnitude intervals in Fig. 7.
Table 4GMPEs utilised for PSHA and DSHA.
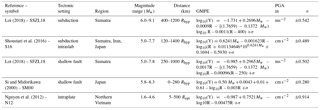
R is the hypocentral distance utilised to conduct DSHA and PSHA in the current work.
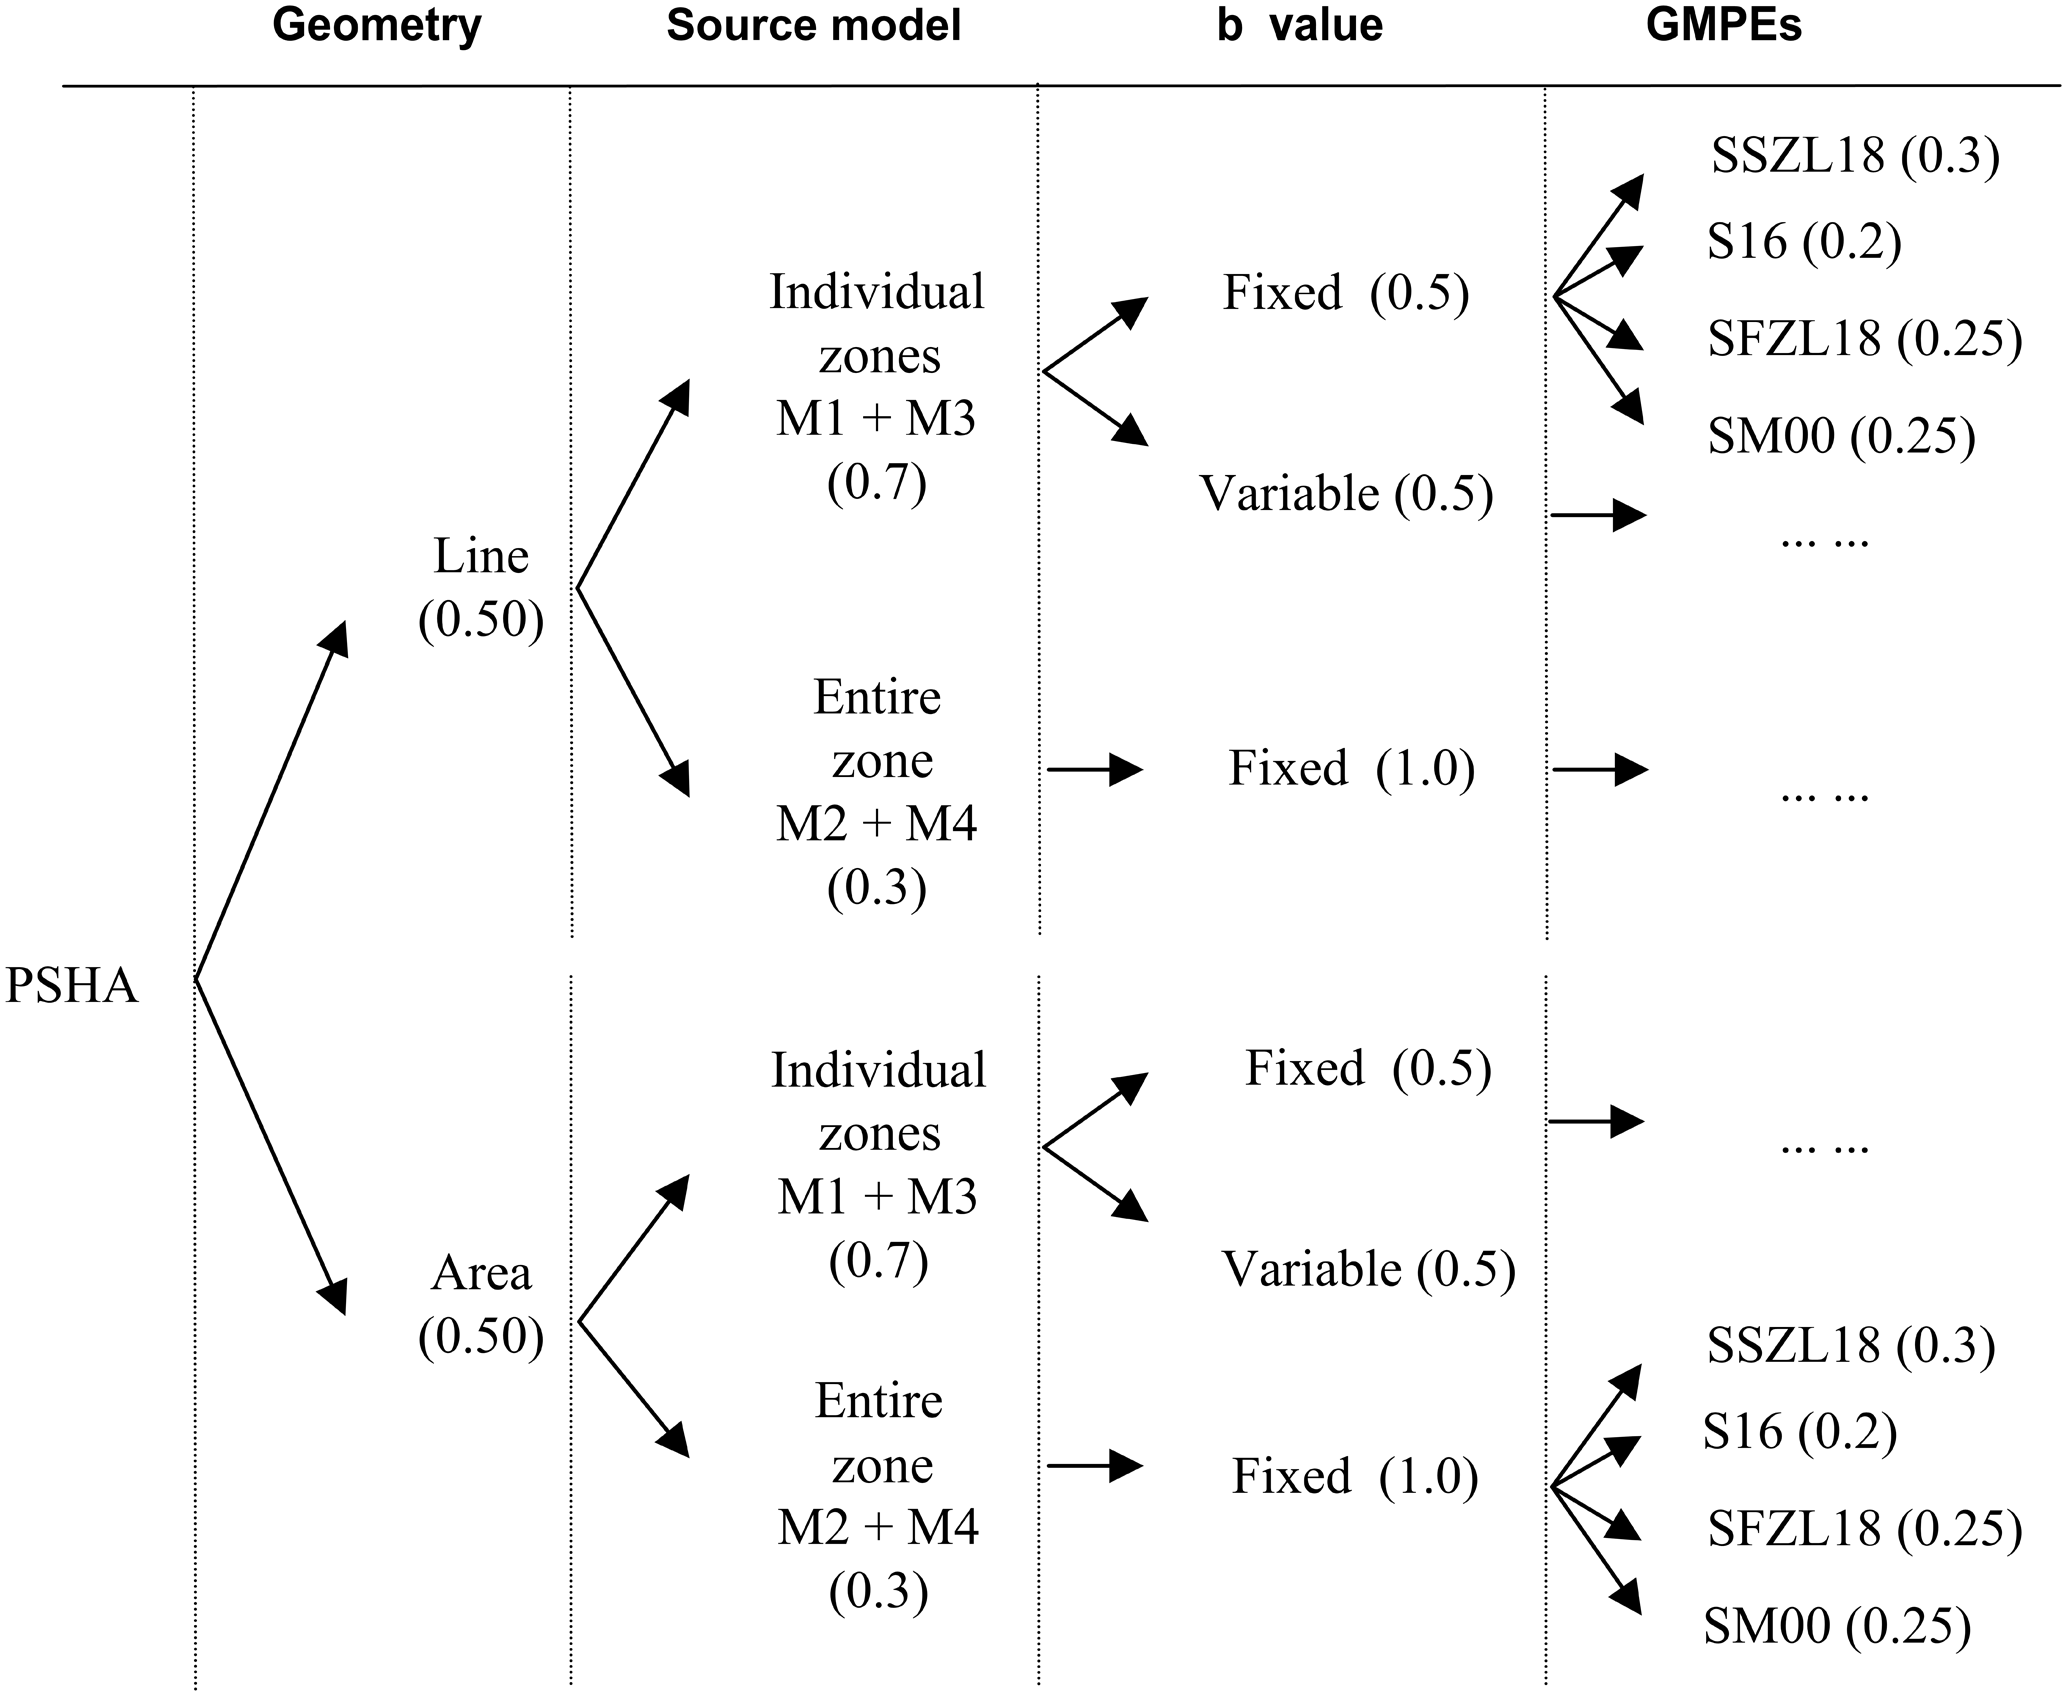
There are inherent uncertainties associated with earthquake data and these uncertainties can be broken down into two categories: aleatory (statistical) and epistemic (systematic) (Bommer et al., 2005). Whereas aleatory uncertainty is unavoidable due to the fact that an earthquake is a random process, epistemic uncertainly (limited knowledge and data) can be accounted for using a logic tree structure (Bommer et al., 2005; Delavaud et al., 2012; Marzocchi et al., 2015; Youngs and Coppersmith, 1985). A logic tree consists of a series of nodes that lead to multiple branches. The branches allow a formal characterisation for addressing uncertainties in the analysis by including parameters and models (hypothesis), each being subjectively weighted on the basis of engineering judgment and their probability of being accurate. The weightage for each individual branch leading up to the end branch can be multiplied to obtain the weightage of that particular route and the sum the weightages should equal to 1. Parameters selected for constructing logic tree formation in this study include different regions, source modelling, magnitude uncertainty model, b values and GMPEs.
For DSHA, the selected GMPEs from the respective regions were weighted to predict the value of PGA at a site of interest. Two different GMPEs were suggested for SSZ and SFZ in Loi (2018) denoted as SSZL18 and SFZL18, respectively. As SSZL18 showed more reliability compared to S16 (the GMPE by Shoushtari et al., 2016) for the ground motion data due to SSZ sources, especially at lower magnitude range (Fig. 7a), weightages of 0.6 and 0.4 were assigned to the respective GMPE. In contrast, weightages were equally split for the GMPEs applicable to the SFZ as both SFZL18 and SM00 (GMPE by Si and Midorikawa, 2000) showed close estimation in relation to recorded ground motion data. The GMPE suggested by Nguyen et al. (2012), denoted N12 here, was utilised for LI earthquakes. An in-house Microsoft Excel based program was designed to perform the DSHA with hazard outcome being the maximum possible PGA estimated as a function of distance and magnitude taking into consideration each of the 50 MPEs.
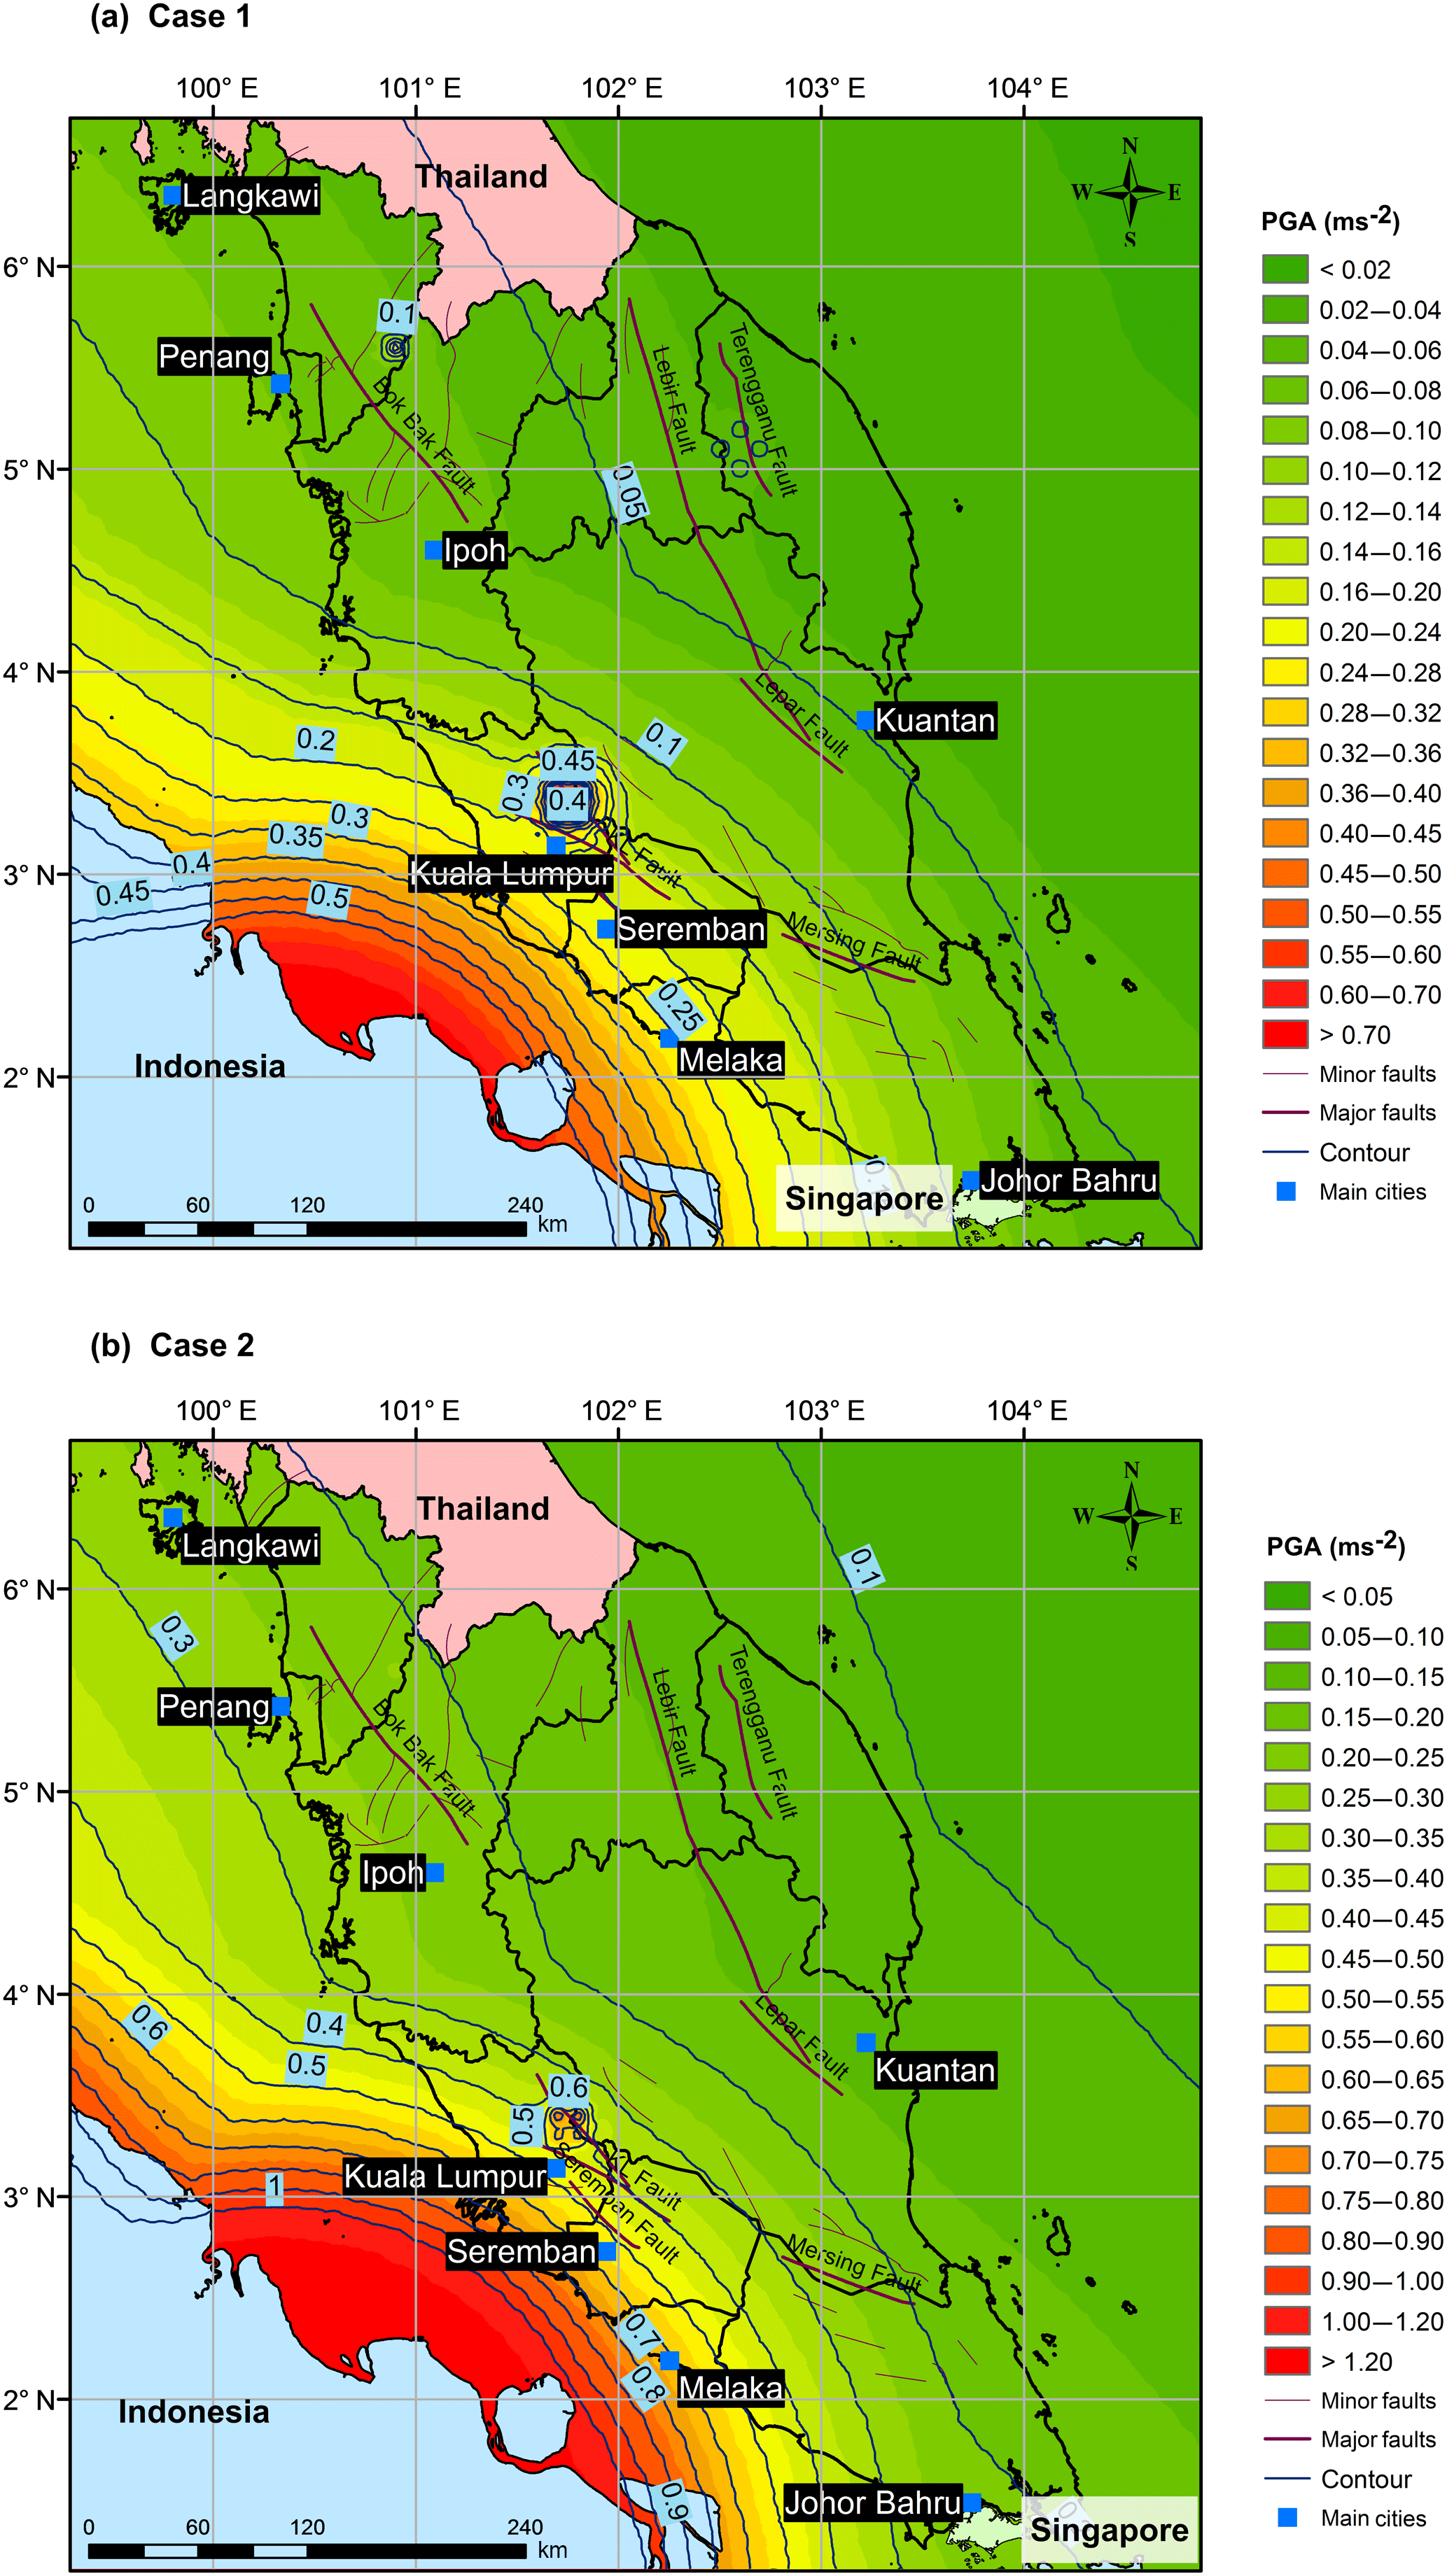
Figure 9PGA maps of Peninsular Malaysia obtained using DSHA. (a) Case 1 – mean GMPE, (b) Case 2 as “critical-worst” case – mean GMPE plus standard deviation.
For PSHA, the source geometries were split into line and area source with equal weightages for the two geometries. The line and areal sources were further split into individual zones and entire zone (see Fig. 8). Individual zones M1 and M3 represent the segmented zones from the SSZ and SFZ. M1 consists of 7 zones from the SSZ whereas M3 consists of 13 zones from the SFZ. M2 and M4, in contrast, represent the entire length of SSZ and SFZ, respectively. The weightage of individual zones was assigned to be 0.7 while the weightage for the entire zone was assigned to be 0.3. The reason for assigning higher weightage to individual zones is that the frequencies of earthquakes that rupture over a short length or small area are much higher compared to that for an extended length or larger area such as the 2004 Aceh event. Besides, the probability of the entire zone rupturing and producing extremely high-magnitude earthquake is lower compared to that for an individual zone. The weightages for b values, separated into fixed (mean b value calculated for the entire zone) and variable (b value calculated for the individual zones), were also equally split for the individual zones, while only the fixed b values were utilised for the entire zone. The PSHA was subsequently conducted using the same weightages for the GMPEs as used in the DSHA. A PSHA logic tree structure with the respective weightages to the branches is shown in Fig. 8. PSHA calculations using the input parameters such as geometry, source models, b values and GMPEs were conducted using EZ-Frisk v8.00, developed by Risk Engineering Inc, USA.
While PSHA performs integration on all the possible earthquake occurrences and ground motions to predict the mean frequency of exceedance, the knowledge of the source relative contribution to the hazard in terms of distance and magnitude is oftentimes valuable and disaggregation is one such method (Bazzurro and Allin Cornell, 1999; McGuire, 1995; Trifunac, 1989). Disaggregation of PGA was carried out in terms of bin pairs of distance and magnitude (R, M) at 20 km and Mw0.1, respectively, following the procedure presented in EZ-Frisk.
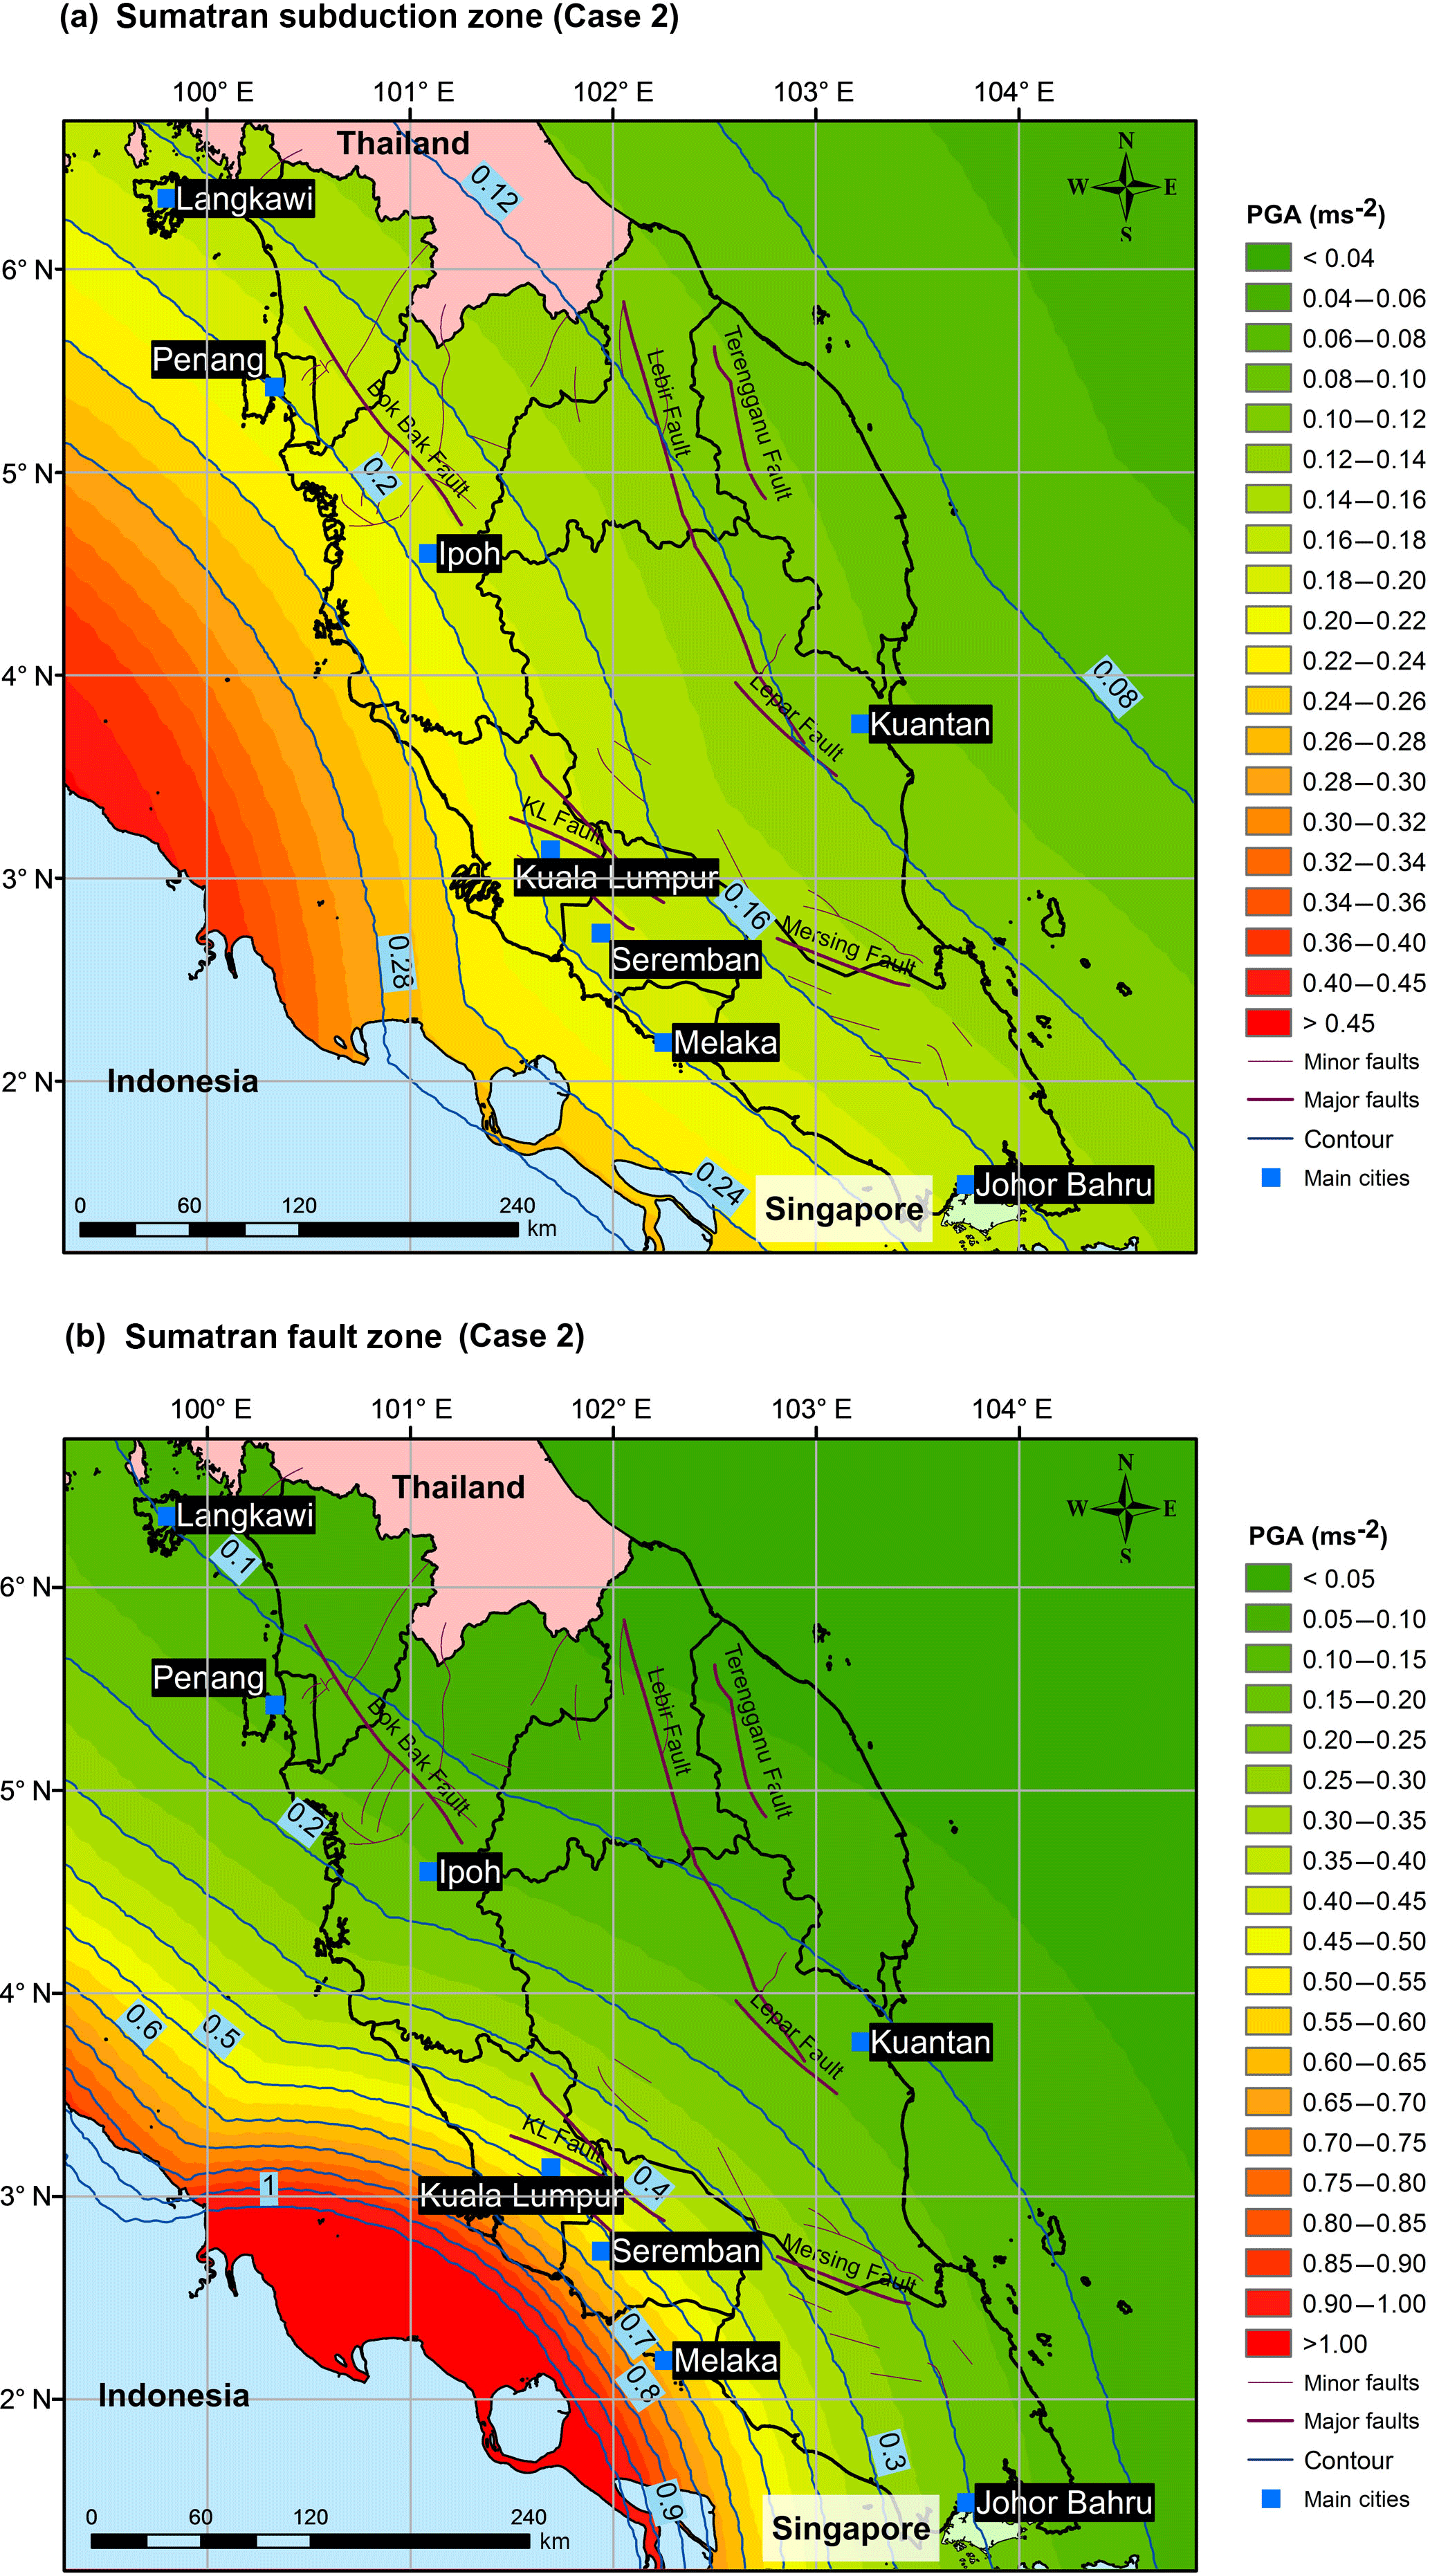
Figure 10PGA maps of Peninsular Malaysia for Case 2 for the sources originating from (a) Sumatran subduction zone and (b) Sumatran fault zone based on Case 2.
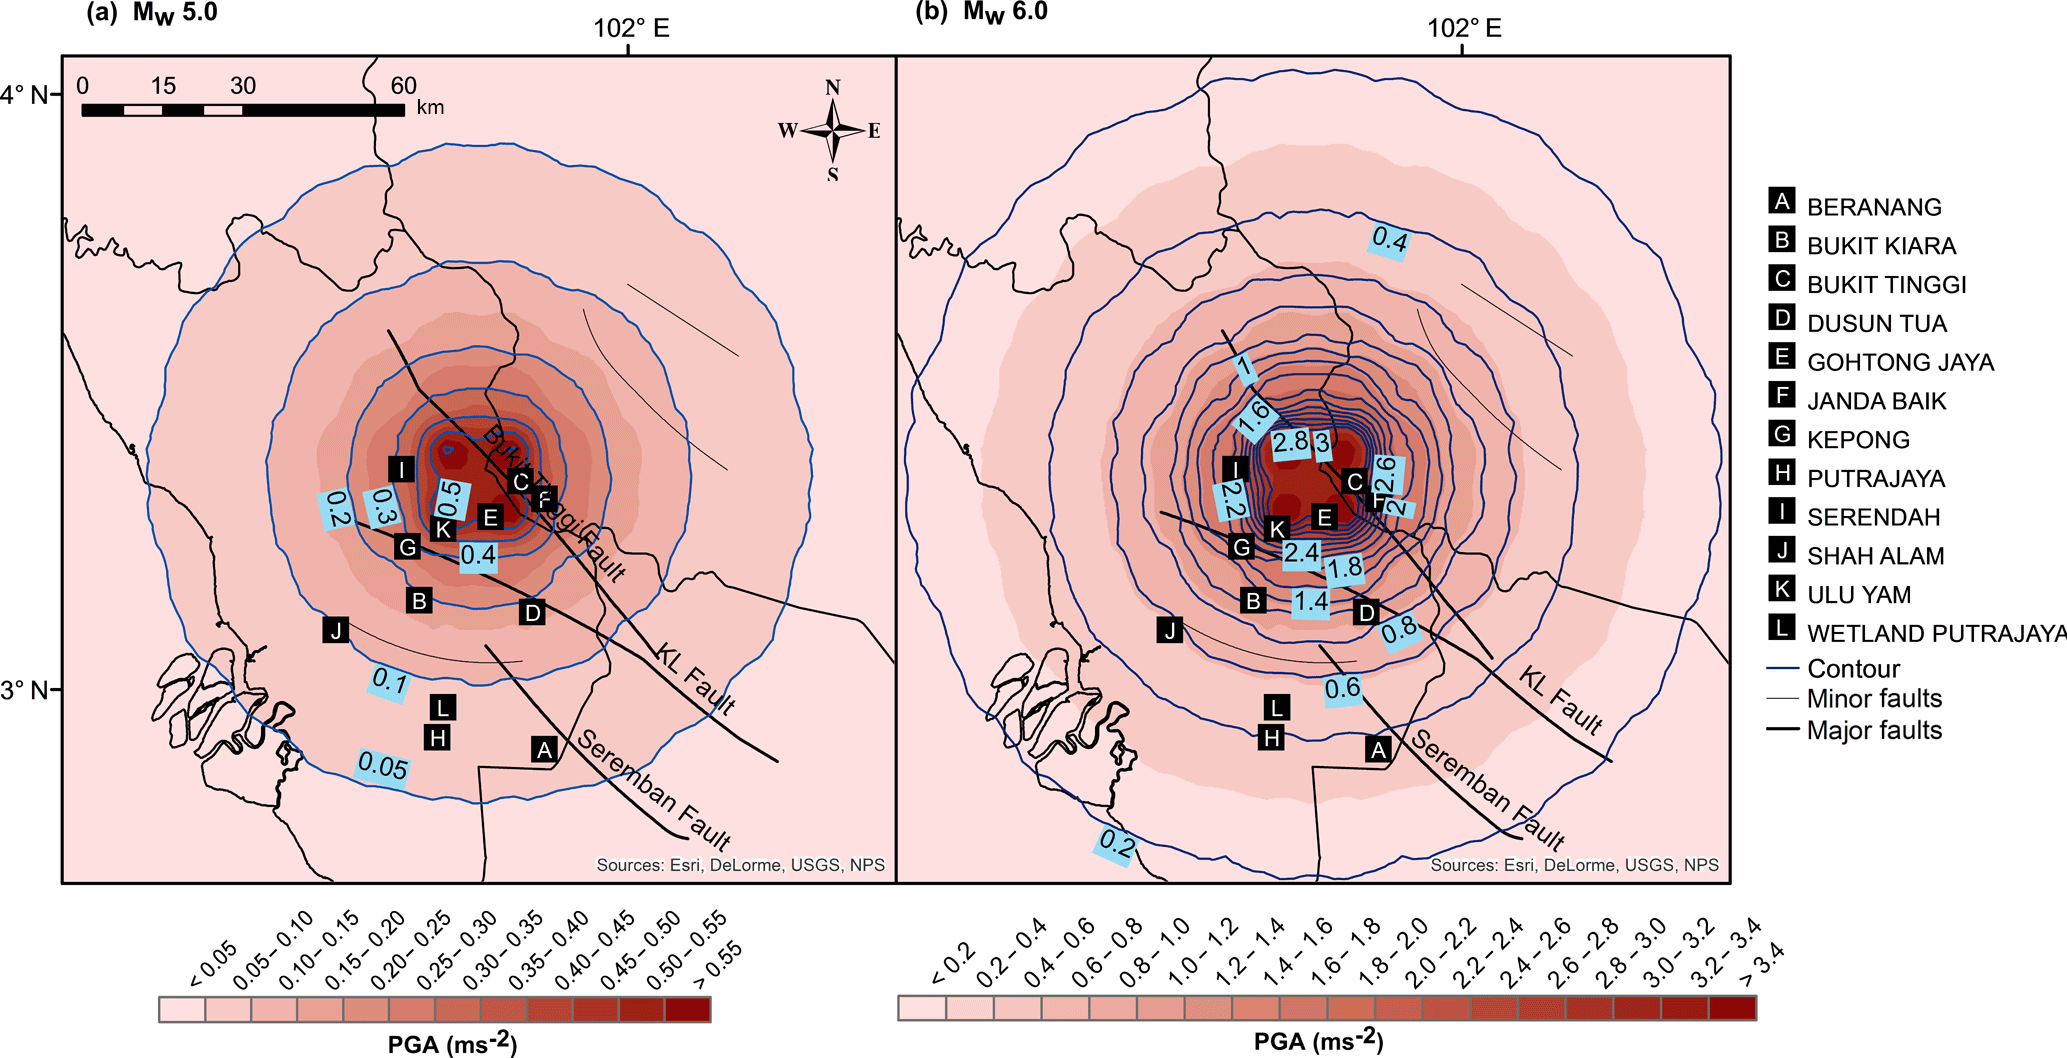
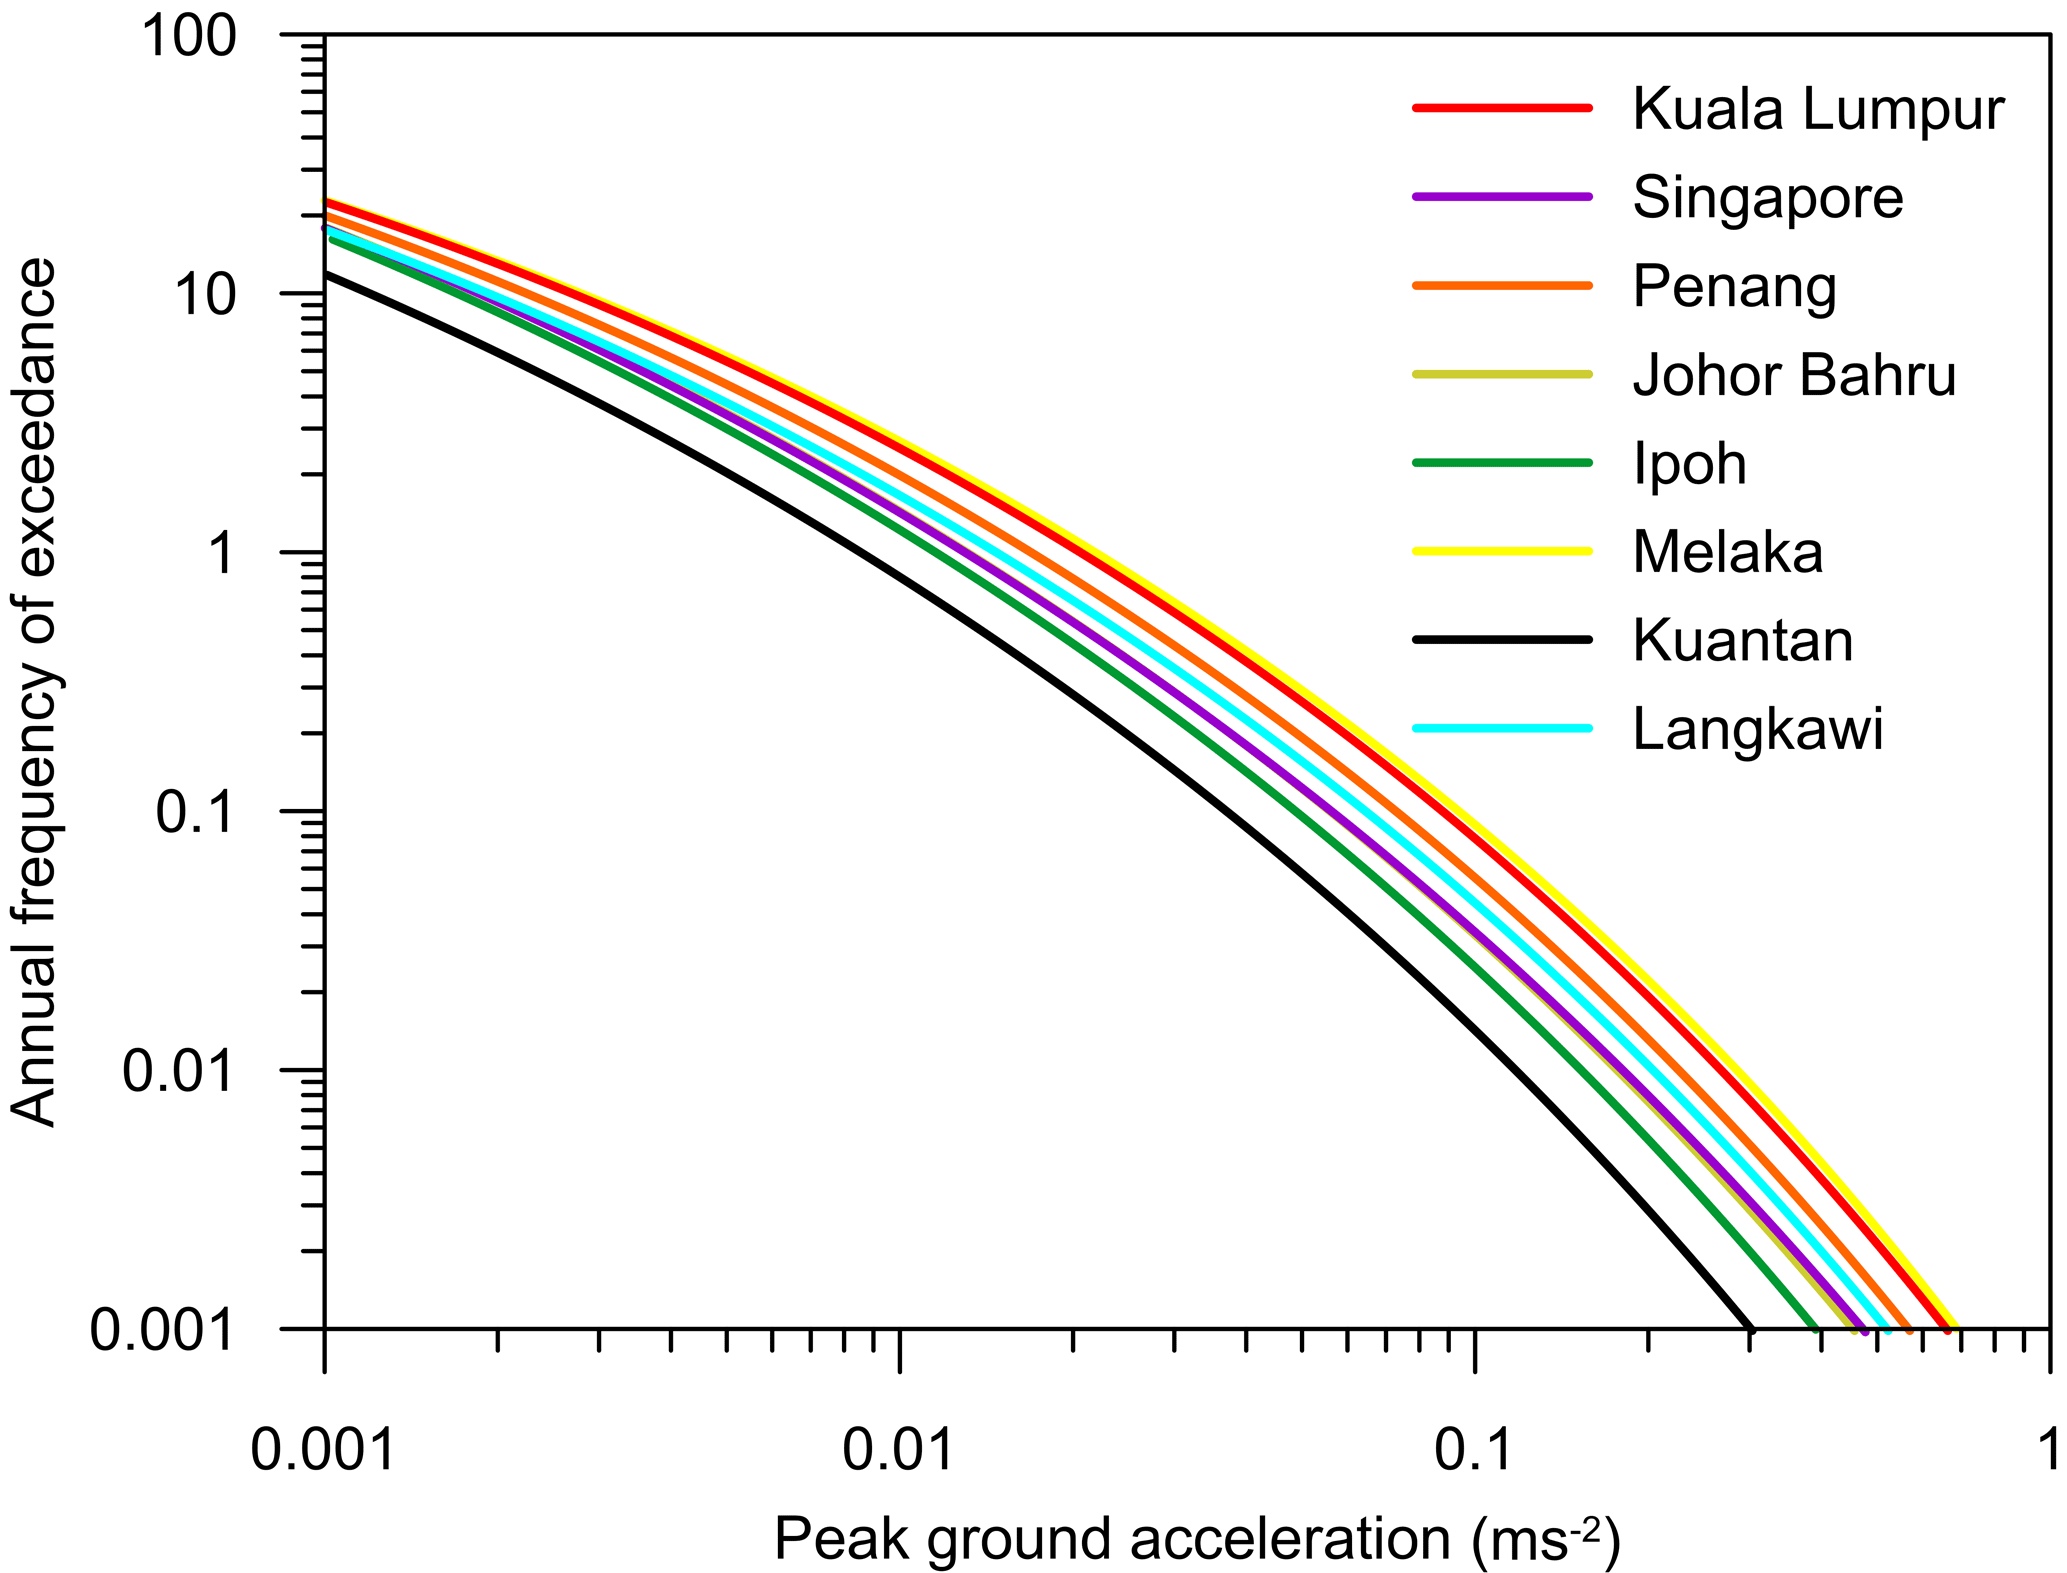
Figure 12Hazard curves for different cities in Peninsular Malaysia and Singapore at rock sites.
10.1 Hazard maps
Two cases were considered for this study. Case 1 considered the mean values from the GMPEs to predict the PGA whereas Case 2 considered the mean values from the GMPEs plus their respective upper boundary standard deviation to predict the PGA. However, it should be noted that for the local intraplate MPEs, only the mean values from N12 were used for both cases (see below). Two separate DSHA maps for Case 1 and Case 2 were subsequently plotted with the hazard values for each grid point using ArcMap 10.4 (Fig. 9a and b). Figure 10a and b were plotted for SSZ and SFZ individually using Case 2 considering this can be termed as the “critical-worst” case to determine the MPEs that contribute to the ground motion hazard for the major cities across Peninsular Malaysia.
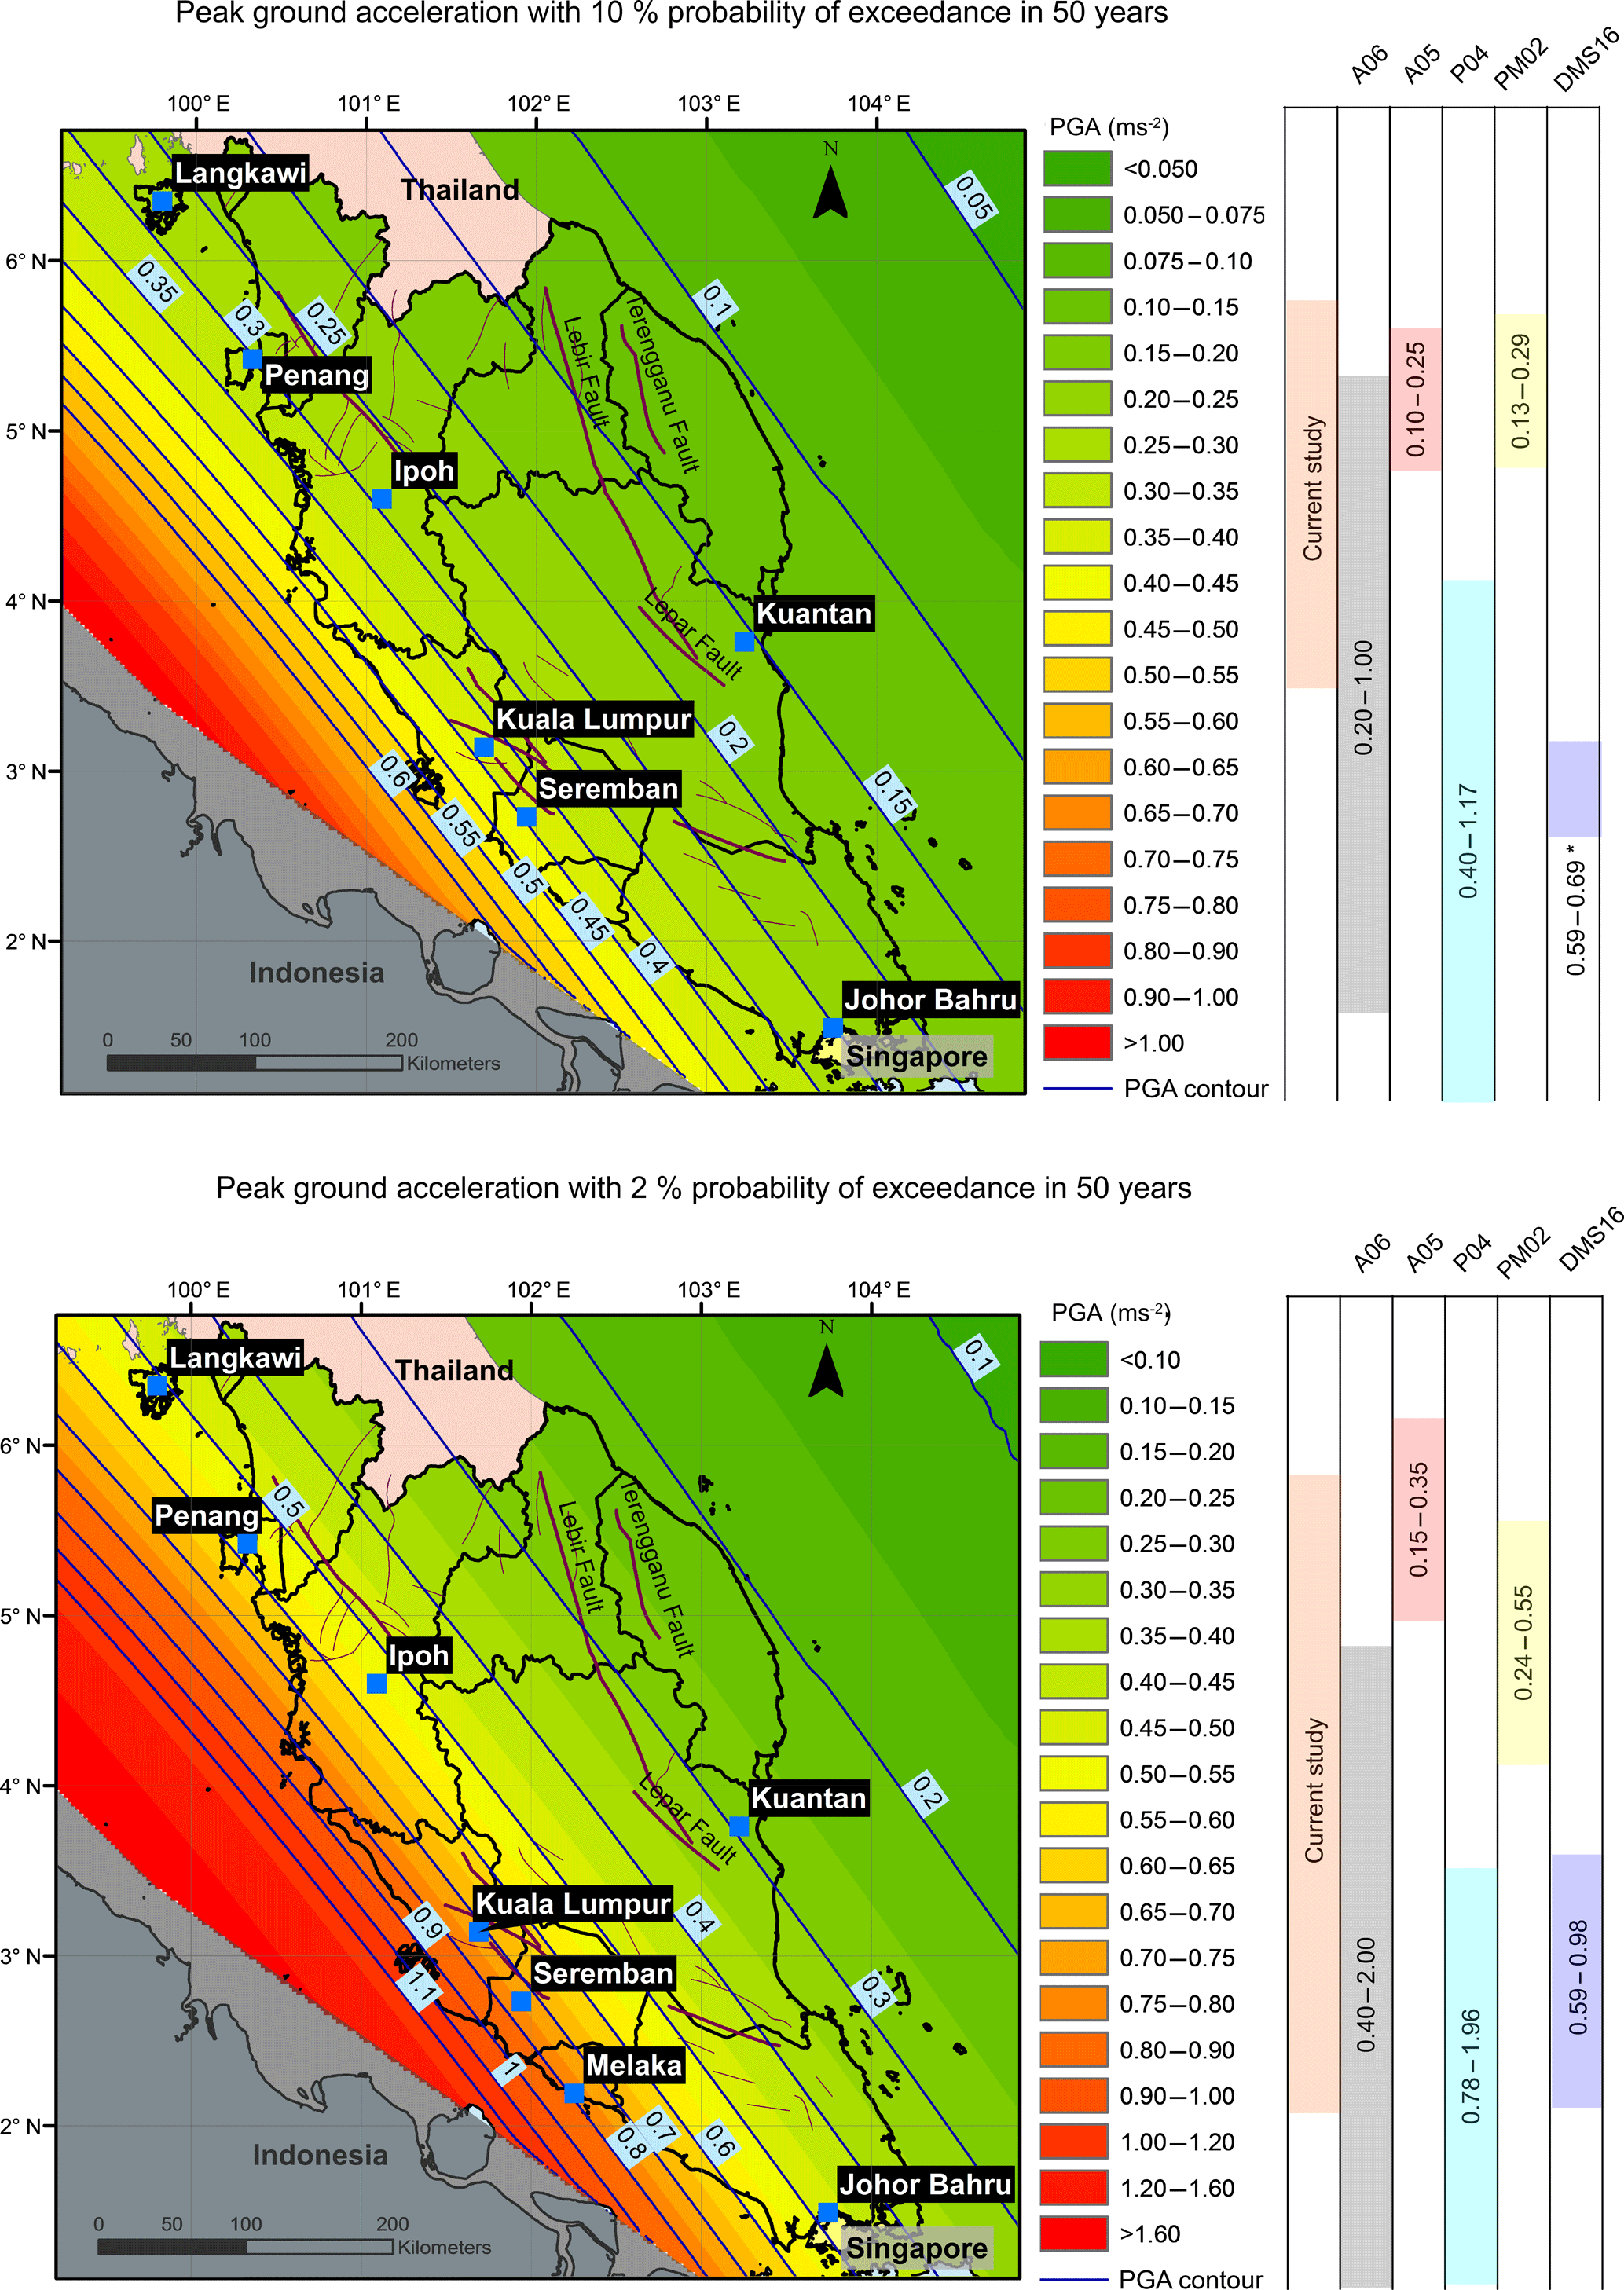
Figure 13PGA Maps of Peninsular Malaysia at rock site condition affected by the Sumatran sources at 10 % and 2 % in 50 years probability of exceedance, respectively. PM02 denotes Pan and Megawati (2002), P04 denotes Petersen et al. (2004), A05 denotes Adnan et al. (2005), A06 denotes Adnan et al. (2006) and DMS16 denotes the Draft National Annex by the Department of Standards Malaysia (2016).
As observed for Case 1 in Fig. 9a and b, the PGA value varies from 0.02 to 0.34 ms−2 across the peninsula while the PGA values expectedly rise approximately 2.5 times for Case 2 in the range of 0.07–0.80 ms−2. Both figures clearly show that lower central-western area (below latitude 4.0∘ N) of Peninsular Malaysia is more susceptible to higher seismic hazard with PGA values decreasing from the southwest to northeast of Peninsular Malaysia. When the overall DSHA map is split into the regional sources (SSZ and SFZ), as shown in Fig. 10a and b, it is observed that the source that contributes to the high PGA in the cities of KL, Seremban and Malacca was the SFZ with the MPE associated located close to the Angkola segment. Although this event is noted to occur slightly off the Sumatra fault line compared to the remaining events from the SFZ, this hypothetical MPE further illustrates that the controlling earthquake could be located closer to the peninsula and hence fits in with worst-case scenario often associated with DSHA. Conversely, the high PGA predicted in the northwestern islands of Penang and Langkawi originates from the SSZ with the MPE associated being the epicentre of the 2004 Aceh earthquake, hereby modelled at Mw9.4. It is also worth noting that in spite of having simulated a hypothetical event near the Siberut-Mentawai segment at Mw9.5, the PGA estimated at KL, Seremban and Malacca from this SSZ event was still lower when compared the event originating at Angkola from the SFZ, thereafter highlighting the hazard that the SFZ may produce. Nevertheless, the PGAs predicted on the southern peninsula and Singapore from both regions were similar, with the SSZ capable of producing PGA ranging from 0.16 to 0.20 ms−2 while the SFZ is expected to produce PGA between 0.18 and 0.24 ms−2 at Johor Bahru and Singapore.

Figure 14Disaggregation plots showing PGA relative contribution from the Sumatran region for Peninsular Malaysia and Singapore as a function of distance and magnitude at various major cities at 10 % and 2 % PE, respectively.
Although there were six MPEs in total associated with the LI earthquakes, only three MPEs were large enough to produce high PGAs compared to the events originating from the Sumatran region (see contour lines in Fig. 9). The remaining three MPEs were of very low magnitude at less than Mw3.0. Of particular interest is the MPE modelled at Mw5.0 close to the Bukit Tinggi fault. In relation to this fault, the PGA predicted within the 20 km vicinity from the centre of KL (3.14∘ N and 101.69∘ S) can reach as high as 0.4 ms−2 with the value peaking at 0.5 ms−2 approximately 10 km away from the epicentre (Fig. 11). Although this work considered Mw5.0 as a plausible case, concerns have been raised by Looi et al. (2013) in an extreme event of Mw6.0 that cannot be ruled out. Therefore, utilizing the same source but altering the maximum magnitude to Mw6.0, the PGA values for this special case were further calculated and plotted in Fig. 11 for comparison purposes. The PGA observed was exceedingly high and the predicted values were capable of rising as high as 3.0 ms−2. This value is approximate 6 and 4 times more than the PGA expected from the MPE for the LI events and Case 2 for the Sumatra region, respectively. Although the predicted PGAs show a sharp drop to 1.2 ms−2 at the centre of KL, these values are still alarmingly high. This is certainly expected as the Nguyen et al. (2012) GMPE used for the DSHA is applicable up to a suggested local magnitude (ML) of 4.6. Therefore, until a better understanding of the critical magnitude that these LI faults can produce is achieved coupled with a more suitable GMPE, this value may be too conservative to be implemented for seismic resistant design in KL. Furthermore, seismic resistant design for countries located on stable continental regions with low seismicity worldwide mostly have a threshold of 0.2 g (Giardini et al., 2013; Woessner et al., 2015). The PGA values from the current work fall within previous DSHA studies performed by local researchers. Manafizad et al. (2016) predicted the PGA across the country in the range of 0.01–0.191 ms−2 while the estimate by Adnan et al. (2005) was relatively low, between 0.03 and 0.07 ms−2.
10.2 Probability of exceedance (PE) maps and hazard curves
Now considering the PSHA, it has been well established that earthquake designs are based on 10 % and 2 % probability of exceedance (PE) in 50 years (return period of 475 and 2475 years, respectively) with the outcome expressed in hazard curves and macrozonation contour maps of mean PGA. For the current study, it should be noted that these hazards are calculated based on rock site condition with references to NEHRP class B with the average shear-wave velocity being 760 ms−1 in the upper 30 m of the crust. Figure 12 presents the hazard curves in terms of mean annual rate of exceedance against PGA at various cities across Peninsular Malaysia, which clearly highlights that the hazard in central-western cities (between latitudes 2 and 4∘ N) being the highest, followed by the northwestern (above 4∘ N) and southern (below 2∘ S) cities (including Singapore). The information from the hazard curves is reflected in the regular PE maps displayed in Fig. 13. The ground motions across Peninsular Malaysia expressed in PGA at bedrock range from 0.11 to 0.55 ms−2 and 0.20 to 1.02 ms−2 for 10 % and 2 % PE in 50 years, respectively. Although the PGA values differ, both maps exhibit a similar pattern in that the PGA values gradually decrease from west towards east of the peninsula. Once again, higher PGA values were observed for KL and Malacca with the lowest PGA estimated at Kuantan. Even though the DSHA indicated that the southern region is more susceptible to higher hazard in comparison to the northwestern region, the PSHA suggests that the hazard at northwestern region to be higher compared to the southern region. The region for this discrepancy lies with the source model whereby DSHA utilised historical point sources whereas PSHA utilised linear and areal sources. PSHA results from this work are further compared with similar PSHA work from the past literature and seismic resistance values suggested in DMS16.
The bars next to the PE maps in Fig. 13 show the PGA ranges estimated across Peninsular Malaysia by various researchers in the past. The PGA estimated from a study by Pan and Megawati (2002), denoted as PM02, for 10 % and 2 % PE in 50 years was between 0.13 and 0.30 ms−2 and 0.24 and 0.55 ms−2 across Singapore and Peninsular Malaysia, respectively. A separate study conducted by Petersen et al. (2004), denoted as P04, predicted relatively high PGA values of 0.40–1.17 ms−2 and 0.78–1.96 ms−2 while Adnan et al. (2005), denoted as A05, predicted values between 0.10 and 0.25 ms−2 and 0.15–0.35 ms−2 across the peninsula at 10 % and 2 % PE in 50 years. Another separate study by Adnan et al. (2006), denoted as A06, predicted rather high PGA with values ranging from 0.20 to 1.00 ms−2 and 0.40 to 2.00 ms−2 for the same 10 % and 2 % PE in 50 years. As for the more recently drafted DMS16, a definitive range was not clearly indicated for the same return periods, but it was suggested that ordinary buildings (defined as low-rise structures or individual dwellings) were to be designed against 0.69 ms−2 at 10 % PE in 50 years while important critical structures such as hospitals, emergency services, power stations and communication facilities should be designed against 0.98 ms−2 at 2 % PE in 50 years. The PGA calculated from this work presents a wider range of hazard across the peninsula when compared to the predictions by A05 and PM02. While the PGA calculated at the higher spectrum coincides with the PGA for the lower range of A06, the PGA data from this study do not agree well with the PGAs calculated by P04. We believe that the current work possibly represents the seismic ground motion experience in the peninsula better than the previous studies given that the earthquake data used here are richer and the GMPEs applied more reliable in relation to the actual ground motion records.
10.3 Disaggregation and hazard source
The combined disaggregation results from both regions at 10 % and 2 % PE in 50 years across the major cities in the peninsula and Singapore are displayed in Fig. 14. The results provide information regarding the magnitude–distance combinations that have a major contribution to the PGA values together with the mode and mean distances and magnitudes.
The results show that the SSZ is the main hazard contributor at northwestern region (Penang and Langkawi), southern region (Johor Bahru and Singapore) and eastern region (Kuantan) at 10 % PE over 50 years. Penang (despite being situated relatively close to Langkawi in the northern region), the cities of the central-western region (Ipoh, KL and Malacca) and the southern region (Johor Bahru and Singapore) are more susceptible to hazards originating from the SFZ, especially at 2 % PE over 50 years. However, at a longer return period, the higher PGA predicted at central-western and southern peninsula was noted to originate from the SFZ.
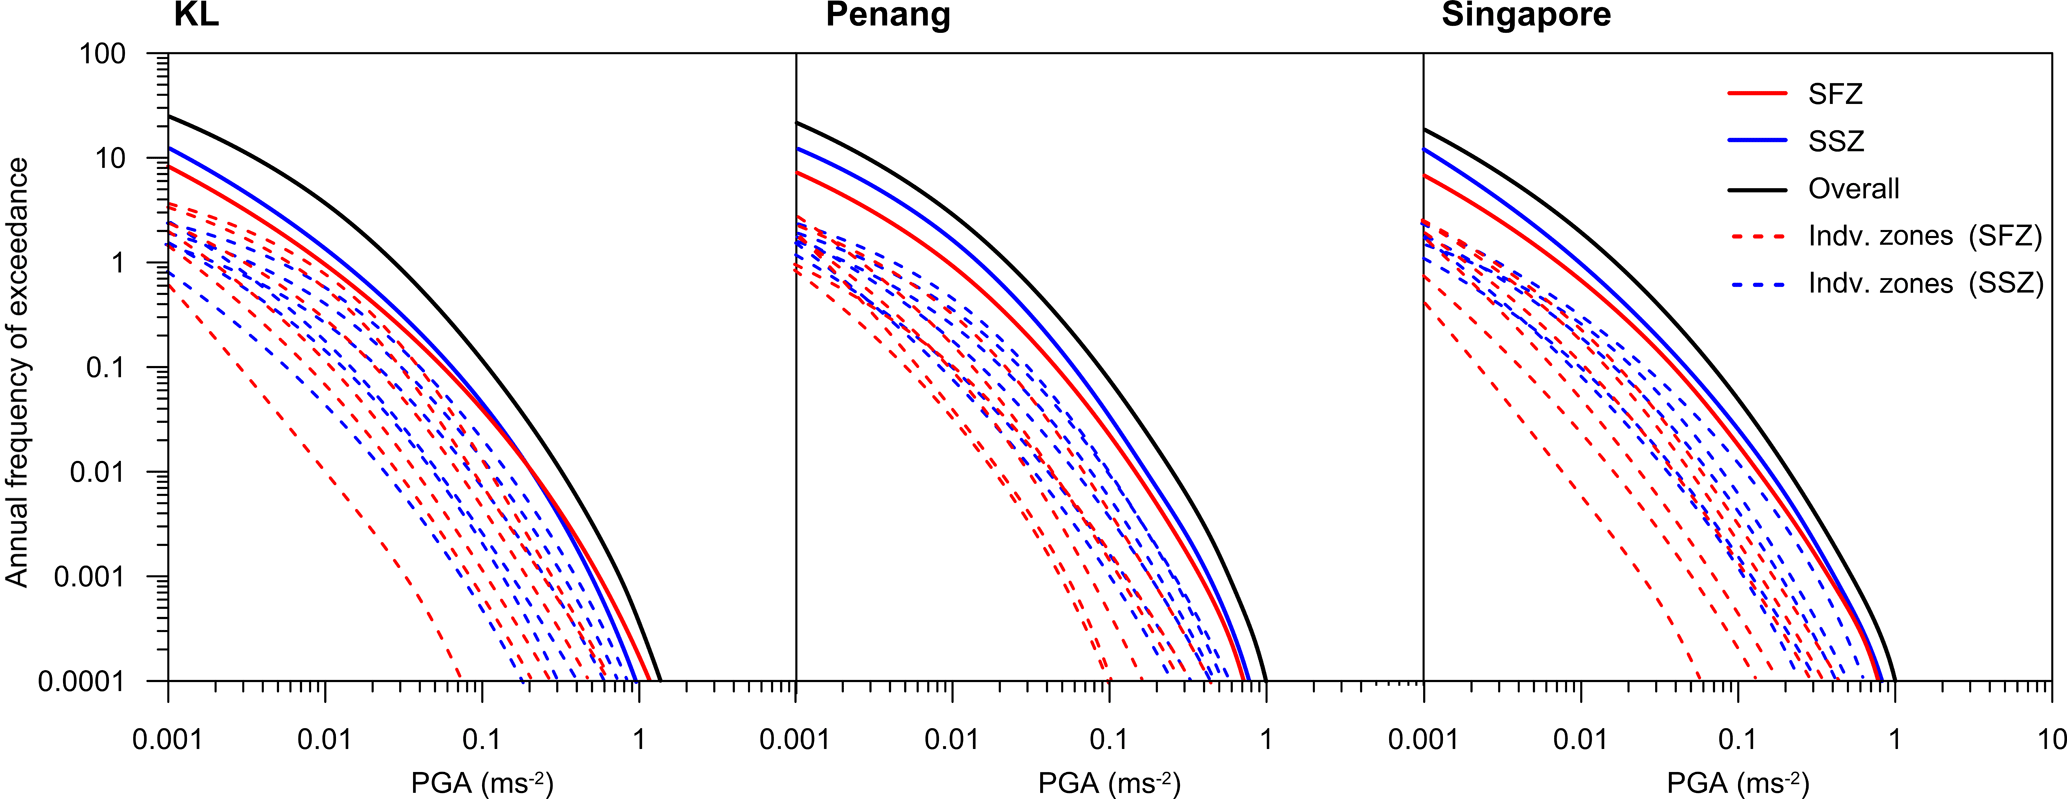
Furthermore, hazard sources affecting three major cities representing the north and central regions along the west coast and also Singapore were selected for comparison in Fig. 15. It can be observed that the major source that contributes to the hazard in Penang especially at the lower PGA range (less than 0.1 ms−2) originates from the SSZ. Meanwhile, hazards calculated at KL were likely due to events located from the SSZ for PGA approximately less than 0.30 ms−2 while events from SFZ contribute more at higher PGA, albeit at a noticeably lower frequency. A similar trend was also observed for Singapore where the hazard contribution at PGA approximately less than 0.65 ms−2 mainly originates from the SSZ. The hazard curve for SSZ gradually tapers towards the hazard curve for SFZ at higher PGA, similar to all three other cities, indicating that hazard posed by SFZ increases at higher PGA.
In summary, this paper presents an overall SHA in terms of PGA at bedrock for Peninsular Malaysia using the DSHA and PSHA approaches. Historical point sources were modelled in DSHA while line and areal sources were utilised for PSHA. Earthquake data collected from the literature, ISC, USGS and MMD were utilised for source modelling and the estimation of seismic hazard parameter “b”. The b values for various zones from the SSZ and SFZ range between 0.56 and 1.06 and 0.57 and 1.03 with mean values of 0.82 and 0.89, respectively, using the GR-Law. Suitable GMPEs were subsequently employed with the assistance of a logic-tree structure for the SHA. Both DSHA and PSHA, despite having different seismic source models and conducted using different software (in-house Microsoft Excel based for DSHA and EZ-Frisk for PSHA), conclude that the central-western cities (latitudes 2 to 4∘ N) of Peninsular Malaysia are most susceptible to high PGAs due to their location closer to the seismically active Sumatran region. The DSHA using “critical-worst” case indicated that the hazard across Peninsular Malaysia on bedrock in terms of PGA ranges from 0.07 to 0.80 ms−2, while hazard conducted using PSHA at PE for 10 % and 2 % in 50 years (return periods of 475 and 2475 years, respectively) showed that the mean PGA ranges from 0.11 to 0.55 ms−2 and from 0.20 to 1.02 ms−2, respectively. Similarly, the combined results from both the SHA showed that the hazard across the peninsula (especially below 5∘ N latitude) was mostly contributed by the SFZ despite the latter being less active and the limited energy it releases. However, it is worth mentioning that the current work only focuses on the PGA at bedrock without taking into consideration the spectral acceleration and soil amplifications. Hence, the contribution of mega-earthquakes from the SSZ frequently associated with long duration seismic waves should not be dismissed.
The absence of good seismic data (small database and short duration activities) for the local intraplate events prevented the utilisation of PSHA. Nevertheless, a simulated DSHA near the Bukit Tinggi fault at a reasonable Mw5.0 predicted a PGA of approximately 0.40 ms−2 at the centre of KL. The overall hazard from both deterministic and probabilistic analyses, despite their differences, leads to similar results and offers valuable information on the seismic ground motion experience across the peninsula. Finally, the PGA values from SHA were lower than the recommended values from the drafted Annex on the seismic resistant design from the Department of Standards Malaysia (2016), which was adjusted based on Eurocode 8, suggesting that the usage of the Annex, for now, is suitable across the peninsula. However, revisiting the SHA procedure with a new set of earthquake data set and improved approaches is recommended in future, which defines the accuracy and reliability of the assessment procedure.
The data used for the analyses in Figs. 3 to 5 and Table 3 are publicly available on the USGS earthquake catalog (https://earthquake.usgs.gov/earthquakes/search/). The seismic records collected from the Malaysia Meteorological Department (MMD) and the analysis conducted in this study using the EZ-Frisk software are available from the corresponding author upon request. Please note that the EZ-Frisk software used in this study was purchased as an educational package (or licence) from the Fugro USA Land, Inc. Use of the data from MMD shall be subject to approval from the Malaysia Meteorological Department as appropriate.
DWL collected and analyzed the seismic data, formulated the GMPEs, conducted DSHA and PSHA, and drafted the manuscript; MER supervised the overall work and provided input and suggestions on analyses and outcomes; and VS contributed to the geological understanding of the region and its application in approaching the SHA.
The authors declare that they have no conflict of interest.
The authors would like to acknowledge the financial support from the
Ministry of Higher Education Malaysia through the Fundamental Research Grant
Scheme (grant FRGS/2/2013/TK03/MUSM/03/2). We also thank the Advanced
Engineering Platform, Monash University Malaysia for the financial support
to cover the publication charges of this paper. The authors would also
like to acknowledge the Malaysian Meteorological Department for providing
the earthquake data and details pertaining to their measurement and the
seismic network of the nation. The contributions of Biswajeet
Pradhan, University of Technology Sydney (formerly of Universiti Putra Malaysia) and
Zainuddin Md. Yusoff, Universiti Putra Malaysia, in terms of suggestions
during the initial stages of earthquake data collection in this study is
highly appreciated.
Edited by: Maria Ana Baptista
Reviewed by: Chung-Han Chan and two anonymous referees
Acocella, B. V., Bellier, O., Sandri, L., Sebrier, M., and Pramumijiyo, S.: Weak tectono-magmatic relationships along an obliquely convergent plate boundary: Sumatra, Indonesia, Front. Earth Sci., 6, 1–20, https://doi.org/10.3389/feart.2018.00003, 2018.
Adnan, A., Hendriyawan, Marto, A., and Irsyam, M.: Seismic hazard assessment for Peninsular Malaysia using gumbel distribution method, Jurnal Teknologi University Teknologi Malaysia, 42, 57–73, 2005.
Adnan, A., Marto, A., and Irsyam, M.: Development of Synthetic Time Histories at Bedrock for Kuala Lumpur, Proceedings of the 6th Asia-Pacific Structural Engineering and Construction Conference, Kuala Lumpur, Malaysia, 2006.
Adnan, A. and Suhaltril, M.: Derivation of attenuation equations for distant earthquake suitable for Malaysia, Project Report (unpublished work), Faculty of Civil Engineering, Universiti Teknologi Malaysia, 2009.
Anbazhagan, P., Vinod, J. S., and Sitharam, T. G.: Probabilistic seismic hazard analysis for Bangalore, Nat. Hazards, 48, 145–166, https://doi.org/10.1007/s11069-008-9253-3, 2008.
Atkinson, G. M., Bommer, J. J., and Abrahamson, N. A.: Alternative approaches to modeling epistemic uncertainty in ground motions in probabilistic seismic-hazard analysis, Seismol. Res. Lett, 85, 1141–1144, 2014.
Baker, J. W.: An introduction to probabilistic seismic hazard analysis (PSHA), White paper, version, 1, 72, 2008.
Balendra, T., Lam, N., Wilson, J. L., and Kong, K.: Analysis of long-distance earthquake tremors and base shear demand for buildings in Singapore, Eng. Struct., 24, 99–108, 2002.
Baroux, E., Avouac, J.-P., Bellier, O., and Sebrier, M.: Slip-partitioning and fore-arc deformation at the Sunda Trench, Indonesia, Terra Nova, 10, 139–144, 1998.
Bazzurro, P. and Allin Cornell, C.: Disaggregation of seismic hazard, Bull. Seismol. Soc. Am, 89, 501–520, 1999.
Bommer, J. J., Scherbaum, F., Bungum, H., Cotton, F., Sabetta, F., and Abrahamson, N. A.: On the use of logic trees for ground-motion prediction equations in seismic-hazard analysis, Bull. Seismol. Soc. Am, 95, 377–389, 2005.
Building Seismic Safety Council: Program on improved seismic safety provisions, NEHRP recommended provisions for seismic regulations for new buildings and other structures: Provisions, Fema, 1997.
Burton, P. W. and Hall, T. R.: Segmentation of the Sumatran fault, Geophys. Res. Lett., 41, 4149–4158, https://doi.org/10.1002/2014GL060242, 2014.
Campbell, K. W.: Near-source attenuation of peak horizontal acceleration, Bull. Seismol. Soc. Am, 71, 2039–2070, 1981.
Cassidy, J. F.: The 2004 Sumatra earthquake and tsunami: lessons learned in subduction zone science and emergency management for the Cascadia Subduction Zone, Pure Appl. Geophys., 172, 835–847, 2015.
Chai, M. F., Zainal, Z., Ramachandran, D., Mokhtar, Z. A., Abdul Wahab, A., and Che Abas, M. R.: Study on Hypocenter Relocation of the local earthquakes in Malay Peninsula using the Modified Joint Hypocenter Determination and HYPOCENTER Programs, Ministry of Science, Technology and Innovation (MOSTI), 2011.
Chlieh, M., Avouac, J. P., Hjorleifsdottir, V., Song, T. R. A., Ji, C., Sieh, K., Sladen, A., Hebert, H., Prawirodirdjo, L., Bock, Y., and Galetzka, J.: Coseismic slip and afterslip of the great Mw 9.15 Sumatra–Andaman earthquake of 2004, Bull. Seismol. Soc. Am., 97, 152–173, 2007.
Cornell, C. A.: Engineering seismic risk analysis, Bull. Seismol. Soc. Am, 58, 1583–1606, 1968.
Delavaud, E., Cotton, F., Akkar, S., Scherbaum, F., Danciu, L., Beauval, C., Drouet, S., Douglas, J., Basili, R., Sandikkaya, M. A., Segou, M., Faccioli, E., and Theodoulidis, N.: Toward a ground-motion logic tree for probabilistic seismic hazard assessment in Europe, J. Seismol., 16, 451–473, https://doi.org/10.1007/s10950-012-9281-z, 2012.
Department of Standards Malaysia: Draft Malaysian Standard -Malaysia National Annex to MS EN 1998-1: 2015, Eurocode 8: Design of structures forearthquake resistance – Part 1: General ruseismic actions and rules for buildings, available at: http://www.sirim.my/srmc/files/PublicComment/2016/Feb-Apr/documents/15D005R0_PC.pdf (last access: 5 June 2017), 2016.
El-Isa, Z. H. and Eaton, D. W.: Spatiotemporal variations in the b-value of earthquake magnitude–frequency distributions: Classification and causes, Tectonophysics, 615, 1–11, 2014.
Esteva, L.: Seismicity prediction: a Bayesian approach, Proceedings of the fourth world conference on earthquake engineering, 13–18 January, Santiago, Chile, 1969.
Gardner, J. and Knopoff, L.: Is the sequence of earthquakes in southern California, with aftershocks removed, Poissonian, Bull. Seismol. Soc. Am, 64, 1363–1367, 1974.
Giardini, D., Woessner, J., Danciu, L., Cotton, F., Crowley, H., Grünthal, G., Pinho, R., Valensise, G., Akkar, S., Arvidsson, R., Basili, R., Cameelbeck, T., Campos-Costa, A., Douglas, J., Demircioglu, M. B., Erdik, M., Fonseca, J., Glavatovic, B., Lindholm, C., Makropoulos, K., Meletti, C., Musson, R., Pitilakis, K., Rovida, A., Sesetyan, K., Stromeyer, D., and Stucch, M.: European Seismic Hazard Map, Seismic Hazard Harmonization in Europe (SHARE), Online Data Resource, https://doi.org/10.12686/SED-00000001-SHARE, 2013.
Gradstein, F. M., Agterberg, F. P., Ogg, J. G., Hardenbol, J., Veen, P., Thierry, J., and Huang, Z.: A Mesozoic time scale, J. Geophys. Res. – Sol. Ea., 99, 24051–24074, 1994.
Gutenberg, B. and Richter, C. F.: Frequency of earthquakes in California, Bull. Seismol. Soc. Am, 34, 185–188, 1944.
Gutscher, M. A.: Great subduction zone earthquakes: Advances in our understanding a decade after Sumatra, 2004, Plate Boundaries Nat. Hazards, 219, 101, 2016.
International Code Council: International Building Code, ICC, Country Club Hills, Il, 2000.
Irsyam, M., Dangkua, D. T., Hoedajanto, D., Hutapea, B. M., Kertapati, E. K., Boen, T., and Petersen, M. D.: Proposed seismic hazard maps of Sumatra and Java islands and microzonation study of Jakarta city, Indonesia, J. Earth Syst. Sci., 117, 865–878, 2008.
Jhonny, K. M. O.: Crustal deformation study in Peninsular Malaysia using global positioning system. Universiti Teknologi Malaysia, available at: https://www.researchgate.net/publication/238730992 (last access: 20 Octoeber 2017), 2009.
Johnston, A. C. and Kanter, L. R.: Earthquakes in stable continental crust, Sci. Am., 262, 68–75, 1990.
Khoo, T. T. and Tan, B. K.: Geological evolution of Peninsular Malaysia, in: Proc. of the Workshop on Stratigraphic Correlation of Thailand and Malaysia, 253–290, 1983.
Klügel, J.-U.: Uncertainty Analysis and Expert Judgment in Seismic Hazard Analysis, Pure Appl. Geophys., 168, 27–53, https://doi.org/10.1007/s00024-010-0155-4, 2010.
Kolathayar, S. and Sitharam, T.: Characterization of regional seismic source zones in and around India, Seismol. Res. Lett., 83, 77–85, 2012.
Kolathayar, S., Sitharam, T., and Vipin, K.: Deterministic seismic hazard macrozonation of India, J. Earth Syst. Sci., 121, 1351–1364, 2012.
Kramer, S. L.: Geotechnical Earthquake Engineering, Prentice Hill, New Jersey, 1996.
Lat, C. N. and Tajuddin, I. A.: Bukit Tinggi earthquakes: November 2007–January 2008, Bull. Geol. Soc. Malaysia, 55, 81–86, 2009.
Lau, T. L., Majid, T. A., Choong, K. K., and Zaini, S. S.: Public awareness on earthquake and tsunami survey in Penang, Institute of Engineers Malaysia (IEM), September, 2005.
Lay, T.: The surge of great earthquakes from 2004 to 2014, Earth Planet Sci. Lett., 409, 133–146, https://doi.org/10.1016/j.epsl.2014.10.047, 2015.
Loi, D. W.: Seismic hazard assessment of Peninsular Malaysia using far field interplate and local intraplate earthquake sources, Ph.D. Thesis, Monash University, 2018.
Loi, D. W., Raghunandan, M. E., and Swamy, V.: Seismicity of Peninsular Malaysia due to intraplate and far field sources, Earthq. Struct., 10, 1391–1404, 2016.
Looi, T., Hee, M., Tsang, H., and Lam, N.: Recommended earthquake loading model for peninsular Malaysia, Jurutera, 2013.
Manafizad, A. N., Pradhan, B., and Abdullahi, S.: Estimation of Peak Ground Acceleration (PGA) for Peninsular Malaysia using geospatial approach, IOP Conference Series: Earth and Environmental Science, 2016.
Martin, S. S.: Intensity distribution from the 2004 M 9.0 Sumatra-Andaman earthquake, Seismol. Res. Lett., 76, 321–330, 2005.
Marzocchi, W., Taroni, M., and Selva, J.: Accounting for epistemic uncertainty in PSHA: Logic tree and ensemble modeling, Bull. Seismol. Soc. Am, 105, 2151–2159, 2015.
McCaffrey, R.: Slip vectors and stretching of the Sumatran fore arc, Geology, 19, 881–884, 1991.
McCaffrey, R.: The tectonic framework of the Sumatran subduction zone, An. Rev. Earth Planet. Sci., 37, 345–366, 2009.
McCaffrey, R., Zwick, P. C., Bock, Y., Prawirodirdjo, L., Genrich, J. F., Stevens, C. W., Puntodewo, S., and Subarya, C.: Strain partitioning during oblique plate convergence in northern Sumatra: Geodetic and seismologic constraints and numerical modeling, J. Geophys. Res.-Sol. Earth, 105, 28363–28376, 2000.
McGuire, R. K.: Probabilistic seismic hazard analysis and design earthquakes: closing the loop, Bull. Seismol. Soc. Am, 85, 1275–1284, 1995.
McGuire, R. K.: Deterministic vs. probabilistic earthquake hazards and risks, Soil Dyn. Earthq. Eng., 21, 377–384, 2001.
McGuire, R. K.: Seismic hazard and risk analysis, Earthquake Engineering Research Institute, Berkeley, 2004.
Megawati, K., Pan, T.-C., and Koketsu, K.: Response spectral attenuation relationships for Sumatran-subduction earthquakes and the seismic hazard implications to Singapore and Kuala Lumpur, Soil. Dyn. Earthq. Eng., 25, 11–25, https://doi.org/10.1016/j.soildyn.2004.08.003, 2005.
Mineral and Geoscience Department Malaysia: Geological Map of Peninsular Malaysia, 9th Edition Edn., Mineral and Geoscience Department Malaysia, 2014.
Ministry of Science Technology & Innovation: Seismic and tsunami hazards and risks study in Malaysia: Summary for policy makers – final report, Ministry of Science Technology & Innovation, 2009.
Moeremans, R., Singh, S. C., Mukti, M., McArdle, J., and Johansen, K.: Seismic images of structural variations along the deformation front of the Andaman–Sumatra subduction zone: implications for rupture propagation and tsunami genesis, Earth Planet Sci. Lett., 409, 75–85, 2014.
Mogi, K.: Study of elastic shocks caused by the fracture of heterogeneous materials and its relations to earthquake phenomena, B. Earthq. Res. Inst., Univ. Tokyo, 40, 125–173, 1962.
Moratto, L., Orlecka-Sikora, B., Costa, G., Suhadolc, P., Papaioannou, C., and Papazachos, C. B.: A deterministic seismic hazard analysis for shallow earthquakes in Greece, Tectonophysics, 442, 66–82, https://doi.org/10.1016/j.tecto.2007.05.004, 2007.
Nabilah, A. B. and Balendra, T.: Seismic Hazard Analysis for Kuala Lumpur, Malaysia, J. Earthq. Eng., 16, 1076–1094, https://doi.org/10.1080/13632469.2012.685208, 2012.
Naik, N. and Choudhury, D.: Deterministic seismic hazard analysis considering different seismicity levels for the state of Goa, India, Nat. Hazards, 75, 557–580, https://doi.org/10.1007/s11069-014-1346-6, 2014.
Nalbant, S. S., Steacy, S., Sieh, K., Natawidjaja, D., and McCloskey, J.: Seismology: Earthquake risk on the Sunda trench, Nature, 435, 756–757, 2005.
Nanjo, K., Hirata, N., Obara, K., and Kasahara, K.: Decade-scale decrease inb value prior to the M9-class 2011 Tohoku and 2004 Sumatra quakes, Geophys. Res. Lett., 39, L20304, https://doi.org/10.1029/2012GL052997, 2012.
Natawidjaja, D. H. and Triyoso, W.: The Sumatran fault zone – From source to hazard, J. Earthq. Tsunami, 1, 21–47, 2007.
Newcomb, K. R. and McCann, W. R.: Seismic history and seismotectonics of the Sunda Arc, J. Geophys. Res., 92, 421, https://doi.org/10.1029/JB092iB01p00421, 1987.
Nguyen, L. M., Lin, T.-L., Wu, Y.-M., Huang, B.-S., Chang, C.-H., Huang, W.-G., Le, T. S., Nguyen, Q. C., and Dinh, V. T.: The first peak ground motion attenuation relationships for North of Vietnam, J. Asian Earth Sci., 43, 241–253, https://doi.org/10.1016/j.jseaes.2011.09.012, 2012.
Ornthammarath, T., Warnitchai, P., Worakanchana, K., Zaman, S., Sigbjörnsson, R., and Lai, C. G.: Probabilistic seismic hazard assessment for Thailand, Bull. Earthq. Eng., 9, 367–394, https://doi.org/10.1007/s10518-010-9197-3, 2010.
Pailoplee, S.: Probabilities of earthquake occurrences along the Sumatra-Andaman subduction zone, Open Geosci., 9, 53–60, 2017.
Pailoplee, S. and Choowong, M.: Earthquake frequency-magnitude distribution and fractal dimension in mainland Southeast Asia, Earth Planet. Space, 66, 1–10, https://doi.org/10.1186/1880-5981-66-8, 2005.
Pan, T.-C. and Megawati, K.: Estimation of peak ground accelerations of the Malay Peninsula due to distant Sumatra earthquakes, Bull. Seismol. Soc. Am, 92, 1082–1094, 2002.
Panza, G. F., Vaccari, F., and Cazzaro, R.: Deterministic seismic hazard assessment, in: Vrancea earthquakes: tectonics, hazard and risk mitigation, Springer, 269–286, 1999.
Petersen, M. D., Dewey, J., Hartzell, S., Mueller, C., Harmsen, S., Frankel, A., and Rukstales, K.: Probabilistic seismic hazard analysis for Sumatra, Indonesia and across the Southern Malaysian Peninsula, Tectonophysics, 390, 141–158, https://doi.org/10.1016/j.tecto.2004.03.026, 2004.
Philibosian, B., Sieh, K., Avouac, J. P., Natawidjaja, D. H., Chiang, H. W., Wu, C. C., Perfettini, H., Shen, C. C., Daryono, M. R., and Suwargadi, B. W.: Rupture and variable coupling behavior of the Mentawai segment of the Sunda megathrust during the supercycle culmination of 1797 to 1833, J. Geophys. Res.-Sol. Earth, 119, 7258–7287, 2014.
Prawirodirdjo, L., Bocl, Y., McCaffrey, R., Genrich, J., Calais, E., Stevens, C., Puntodewo, S., Subarya, C., Rais, J., and Zwick, P.: Geodetic observations of interseismic strain segmentation at the Sumatra subduction zone, Geophys. Res. Lett., 24, 2601–2604, 1997.
Prawirodirdjo, L., Bock, Y., Genrich, J., Puntodewo, S., Rais, J., Subarya, C., and Sutisna, S.: One century of tectonic deformation along the Sumatran fault from triangulation and Global Positioning System surveys, J. Geophys. Res.-Sol. Earth, 105, 28343–28361, 2000.
Prawirodirdjo, L., McCaffrey, R., Chadwell, C. D., Bock, Y., and Subarya, C.: Geodetic observations of an earthquake cycle at the Sumatra subduction zone: Role of interseismic strain segmentation, J. Geophys. Res.-Sol. Earth, 115, B03414, https://doi.org/10.1029/2008JB006139, 2010.
Reiter, L.: Earthquake hazard analysis: issues and insights, Columbia University Press, 1991.
Schulte, S. M. and Mooney, W. D.: An updated global earthquake catalogue for stable continental regions: reassessing the correlation with ancient rifts, Geophy. J. Int., 161, 707–721, 2005.
Secanell, R., Bertil, D., Martin, C., Goula, X., Susagna, T., Tapia, M., Dominique, P., Carbon, D., and Fleta, J.: Probabilistic seismic hazard assessment of the Pyrenean region, J. Seismol., 12, 323–341, 2008.
Shoushtari, A., Adnan, A., Zare, M., and Harith, N.: Estimation of the maximum credible hazard in Kuala Lumpur and Singapore due to gigantic Sumatran megathrust earthquakes: based on a comparative study on attenuation laws, Nat. Hazards, 78, 725–751, 2015.
Shoushtari, A. V., Adnan, A. B., and Zare, M.: On the selection of ground–motion attenuation relations for seismic hazard assessment of the Peninsular Malaysia region due to distant Sumatran subduction intraslab earthquakes, Soil. Dyn. Earthq. Eng., 82, 123–137, 2016.
Shuib, M. K.: The recent Bukit Tinggi earthquakes and their relationship to major geological structures, Bull. Geol. Soc. Malaysia, 55, 67–72, 2009.
Shukla, J. and Choudhury, D.: Seismic hazard and site-specific ground motion for typical ports of Gujarat, Nat. Hazards, 60, 541–565, 2012.
Si, H. and Midorikawa, S.: New attenuation relations for peak ground acceleration and velocity considering effects of fault type and site condition, Proceedings of twelfth world conference on earthquake engineering, 30 January–4 February, Auckland, New Zealand, 2000.
Sieh, K. and Natawidjaja, D.: Neotectonics of the Sumatran fault, Indonesia, J. Geophys. Res.-Sol. Earth, 105, 28295–28326, https://doi.org/10.1029/2000jb900120, 2000.
Simons, W. J. F., Socquet, A., Vigny, C., Ambrosius, B. A. C., Haji Abu, S., Promthong, C., Subarya, C., Sarsito, D. A., Matheussen, S., Morgan, P., and Spakman, W.: A decade of GPS in Southeast Asia: Resolving Sundaland motion and boundaries, J. Geophys. Res., 112, B06420, https://doi.org/10.1029/2005jb003868, 2007.
Singh, A., Roy, I. G., Kumar, S., and Kayal, J.: Seismic source characteristics in Kachchh and Saurashtra regions of Western India: b-value and fractal dimension mapping of aftershock sequences, Nat. Hazards, 77, 33–49, 2015.
Sooria, S. Z.: A study on seismic design for infrastructures in low seismicity region, Doctor of Engineering, Graduate School of Engineering, Kyoto University, 2012.
Stepp, J. C.: Analysis of completeness of the earthquake sample in the Puget Sound area and its effect on statistical estimates of earthquake hazard, in: Proc. of the 1st Int. Conf. on Microzonazion, Seattle, 2, 897–910, 1972.
Subarya, C., Chlieh, M., Prawirodirdjo, L., Avouac, J. P., Bock, Y., Sieh, K., Meltzner, A. J., Natawidjaja, D. H., and McCaffrey, R.: Plate-boundary deformation associated with the great Sumatra–Andaman earthquake, Nature, 440, 46, 2006.
Sun, J. and Pan, T.-C.: Seismic characteristics of Sumatra and its relevance to Peninsular Malaysia and Singapore, J. South. Asian Earth, 12, 105–111, 1995.
Trifunac, M. D.: Threshold magnitudes which cause the ground motion exceeding the values expected during the next 50 years in a metropolitan area, Geofizika, 6, 1–12, 1989.
Van, T. C., Lau, T. L., and Mok, C. F.: Selection of ground motion attenuation model for Peninsular Malaysia due to far-field Sumatra earthquakes, Nat. Hazards, 80, 1865–1889, 2016.
Vipin, K. S., Anbazhagan, P., and Sitharam, T. G.: Estimation of peak ground acceleration and spectral acceleration for South India with local site effects: probabilistic approach, Nat. Hazards Earth Syst. Sci., 9, 865–878, https://doi.org/10.5194/nhess-9-865-2009, 2009.
Wang, Z.: Seismic hazard assessment: issues and alternatives, Pure Appl. Geophys., 168, 11–25, 2011.
Woessner, J., Laurentiu, D., Giardini, D., Crowley, H., Cotton, F., Grünthal, G., Valensise, G., Arvidsson, R., Basili, R., and Demircioglu, M. B.: The 2013 European seismic hazard model: key components and results, Bull. Earthq. Eng., 13, 3553–3596, 2015.
Youngs, R. R. and Coppersmith, K. J.: Implications of fault slip rates and earthquake recurrence models to probabilistic seismic hazard estimates, Bull. Seismol. Soc. Am, 75, 939–964, 1985.
- Abstract
- Introduction
- Tectonic setting and seismicity of Peninsular Malaysia
- Interplate faults in the Sumatran region
- Intraplate faults within Peninsular Malaysia
- Earthquake database and catalogue
- Source modelling
- Regional seismicity recurrence
- Ground motion prediction equations (GMPEs)
- Logic tree structure
- Results and discussion
- Conclusions
- Data availability
- Author contributions
- Competing interests
- Acknowledgements
- References