the Creative Commons Attribution 4.0 License.
the Creative Commons Attribution 4.0 License.
 | 10 Jan 2018
Developing fragility functions for aquaculture rafts and eelgrass in the case of the 2011 Great East Japan tsunami
Anawat Suppasri
Kentaro Fukui
Kei Yamashita
Natt Leelawat
Hiroyuki Ohira
Fumihiko Imamura
Since the two devastating tsunamis in 2004 (Indian Ocean) and 2011 (Great East Japan), new findings have emerged on the relationship between tsunami characteristics and damage in terms of fragility functions. Human loss and damage to buildings and infrastructures are the primary target of recovery and reconstruction; thus, such relationships for offshore properties and marine ecosystems remain unclear. To overcome this lack of knowledge, this study used the available data from two possible target areas (Mangokuura Lake and Matsushima Bay) from the 2011 Japan tsunami. This study has three main components: (1) reproduction of the 2011 tsunami, (2) damage investigation, and (3) fragility function development. First, the source models of the 2011 tsunami were verified and adjusted to reproduce the tsunami characteristics in the target areas. Second, the damage ratio (complete damage) of the aquaculture raft and eelgrass was investigated using satellite images taken before and after the 2011 tsunami through visual inspection and binarization. Third, the tsunami fragility functions were developed using the relationship between the simulated tsunami characteristics and the estimated damage ratio. Based on the statistical analysis results, fragility functions were developed for Mangokuura Lake, and the flow velocity was the main contributor to the damage instead of the wave amplitude. For example, the damage ratio above 0.9 was found to be equal to the maximum flow velocities of 1.3 m s−1 (aquaculture raft) and 3.0 m s−1 (eelgrass). This finding is consistent with the previously proposed damage criterion of 1 m s−1 for the aquaculture raft. This study is the first step in the development of damage assessment and planning for marine products and environmental factors to mitigate the effects of future tsunamis.
- Article
(20346 KB) - Full-text XML
- BibTeX
- EndNote


Aquaculture and ecological systems provide many services and functions to humans and are important to the global economy (Costanza et al., 1997). The 2011 Great East Japan tsunami caused devastating damage to inland and offshore properties. Considerable economic damage resulting from the loss of aquaculture products and the impact to ecological systems was also caused by this tsunami. Since the 2004 Indian Ocean tsunami and the 2011 tsunami, numerous quantitative measures of tsunami vulnerability, such as fragility functions, have been developed for buildings (Leelawat et al., 2014; Charvet et al., 2015, 2017; Suppasri et al., 2013, 2016), infrastructures (Shoji and Nakamura, 2017), and marine vessels (Suppasri et al., 2014; Muhari et al., 2015). However, only one criterion is based on a previous study of the 1960 Chilean tsunami, which struck the west side of Japan: damage to an aquaculture raft (pearl) begins to occur when the tsunami flow velocity is larger than 1 m s−1 regardless of the water level (Nagano et al., 1991). No other criterion or study has been presented regarding the vulnerability of marine plants.
1.1 Objectives
To quantitatively assess such damage to marine products and marine ecosystems, the main objective of this study is to develop the fragility functions as the first step toward understanding the relationship between the tsunami characteristics and the damage. After reviewing previous works, this study comprises three main sections: (1) reproduction of the 2011 tsunami, (2) damage investigation, and (3) development of fragility functions. The first section presents a validation of the proposed source models for the 2011 tsunami and the adjustment for tsunami reproduction in the study areas. The second section presents the available damage data and damage quantification. The third section presents statistical analysis methods to develop the fragility functions using the results obtained from the first and second sections. Finally, new findings, recommendations, and the limitations of this study are discussed.
1.2 Review of previous studies
This section reviews selected previous studies related to the damage characteristics of offshore facilities and marine plants against tsunamis. The first attempt was based on the 1960 Chilean tsunami, which struck the west of Japan. The damaged aquaculture rafts were plotted against the simulated maximum water level and flow velocity (Nagano et al., 1991). As shown in Fig. 1, the damage to the aquaculture raft (pearl) begins to occur when the tsunami flow velocity is higher than 1 m s−1 regardless of the water level. Similarly, Kato et al. (2010) applied identical criteria to quantify the damage to aquaculture rafts in areas along the east coast of Japan, which were struck by the 2010 Chilean tsunami. They found that the damage on the east coast of Japan caused by the 2010 Chilean tsunami was accurately modeled by the proposed damage criteria developed from the data of the 1960 Chilean tsunami in the west of Japan.
After the 2011 tsunami, Suppasri et al. (2014) and Muhari et al. (2015) developed fragility functions for fishing boats. Based on their results, the threshold water level and flow velocity values for the complete destruction of small boats of less than 5 t are 2 m and 1 m s−1, respectively. Keen et al. (2017) developed fragility functions for structural components in small craft harbors based on actual damage caused by the 2011 tsunami on the US west coast. The 2016 Fukushima tsunami caused no inland damage but some damage to aquaculture rafts and fishing boats in Sendai Bay (Suppasri et al., 2017). Nevertheless, no damage criteria or fragility functions have been proposed for the 2011 tsunami. There have been limited studies on the relation between tsunami characteristics and damage to sea plants. Sakamaki et al. (2016) and Tsujimoto et al. (2016) reported the damage to eelgrass in Matsushima Bay but provided no direct consideration of the effect of tsunami characteristics. Yamashita et al. (2016) noted possible relationships between the sediment deposition and erosion caused by the 2011 tsunami and the damage to eelgrass.

Figure 1Damage criteria of the aquaculture raft based on the damage data from Kii Peninsula, western Japan, from the 1960 Chilean tsunami (Adapted from Nagano et al., 1991)
1.3 Target areas of this study
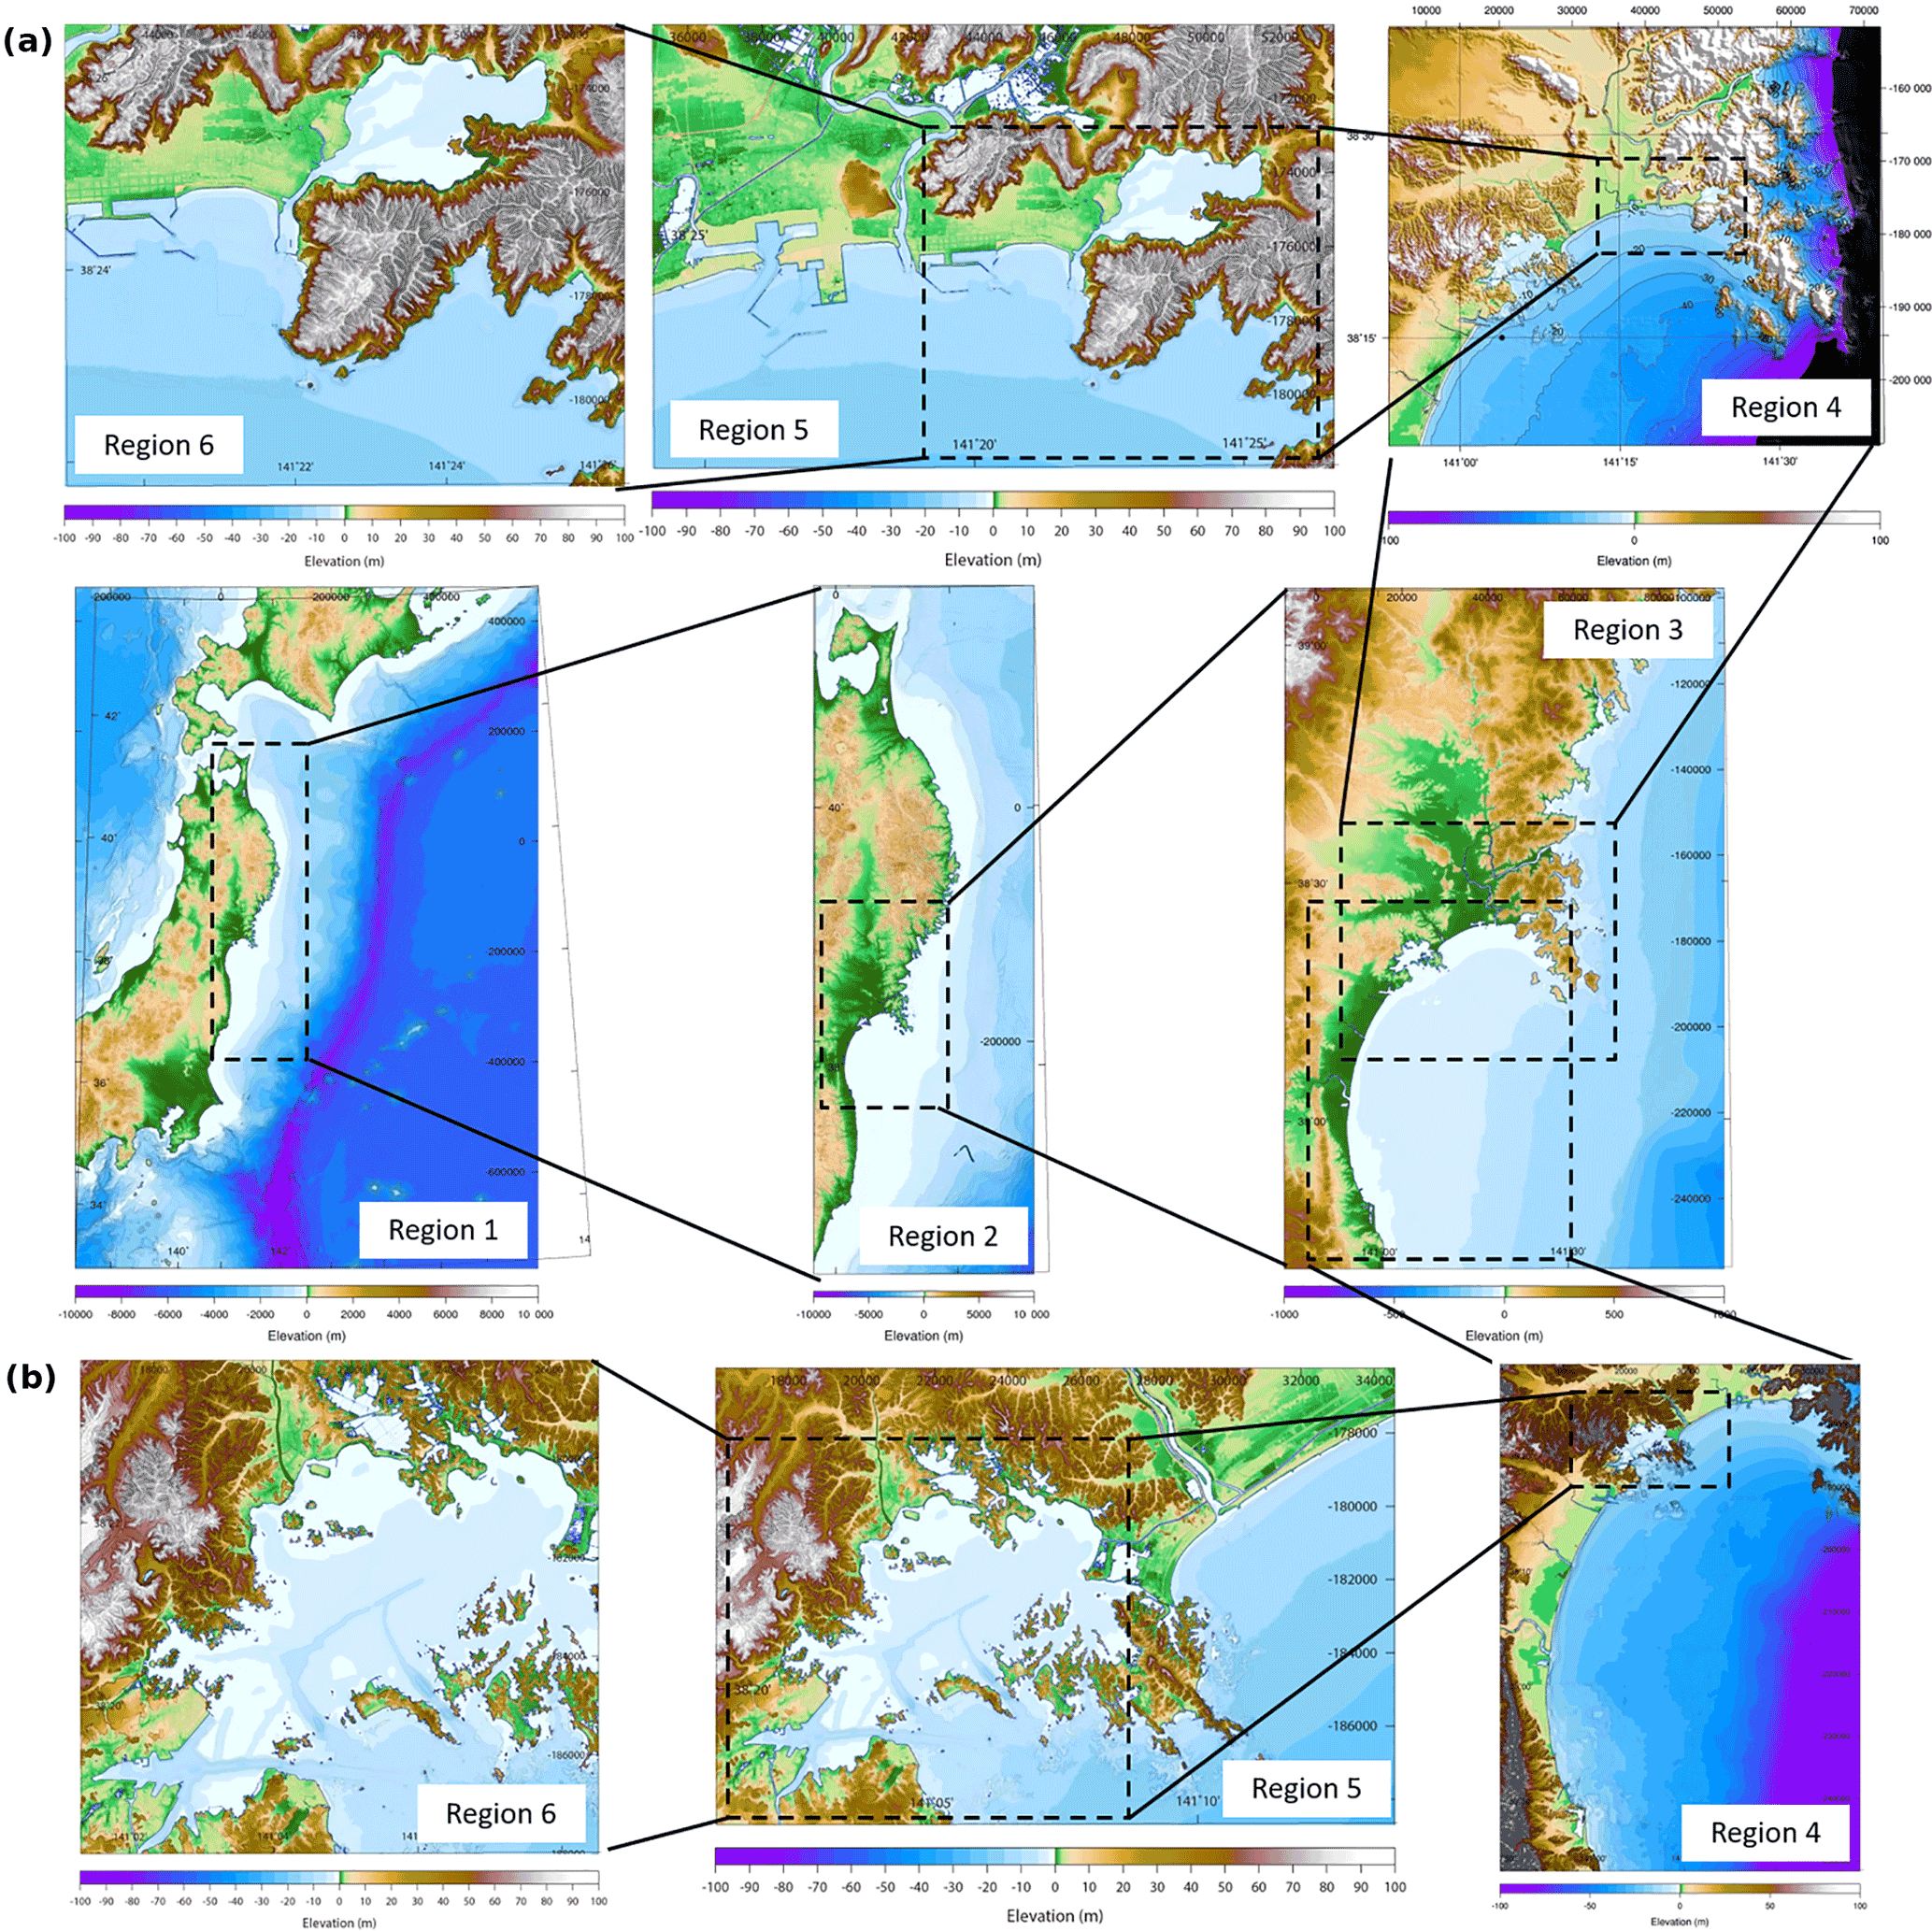
Because the size of the 2011 tsunami was extremely large, most aquaculture rafts and other marine plants were completely destroyed. There are only two well-suited locations with specific coastal geography, namely, Mangokuura Lake and Matsushima Bay in Miyagi Prefecture (Fig. 2), where the effects of the tsunami were comparatively small (Suppasri et al., 2012) and the aquaculture rafts were undamaged and the eelgrass survived (Northwest Pacific Region Environmental Cooperation Center, 2016). Mangokuura Lake has a notably narrow entrance from the Pacific Ocean through Ishinomaki Bay, and the average sea depth is as shallow as 5 m or less. Matsushima Bay is protected by almost 300 small islands around the bay front. Thus, the 2011 tsunami inundation and run-up heights in both areas were less than 1–2 m, whereas they were as high as 10 m in other nearby areas (Suppasri et al., 2012). As a result, some aquaculture rafts and other marine plants survived in these two locations, which enabled the development of fragility functions.

2.1 Simulation conditions
To obtain tsunami-related parameters, including the water level and flow velocity, the 2011 tsunami was reproduced using a numerical analysis. The 2011 tsunami was numerically simulated using a set of nonlinear shallow-water equations, which were discretized using the staggered leap-frog finite-difference scheme (TUNAMI model; Imamura, 1996) with bottom friction in the form of Manning's formula, similar to previous studies (Suppasri et al., 2011; Charvet et al., 2015; Macabuag et al., 2016). Six computational domains adopted from a previous study (Macabuag et al., 2016) which used original data from the Geospatial Information Authority of Japan (GSI, 2015) were used as a nesting grid system of 1215 m (region 1), 405 m (region 2), 135 m (region 3), 45 m (region 4), 15 m (region 5), and 5 m (region 6). The tidal level of −0.42 m was set at the time of the tsunami occurrence, and the simulation time was set to 3 h to maximize the water level and flow velocity.
2.2 Model calibration and verification
Three models of fault parameters were selected to reproduce the 2011 tsunami: model 1: Tohoku University model (Imamura et al., 2011); model 2: Satake model (Satake et al., 2013); and model 3: Japan Nuclear Energy Safety Organization (JNES) model (Sugino et al., 2013). The corresponding fault parameters were used to estimate the seafloor deformation proposed by Okada (1985), which later became the initial seafloor condition for the tsunami numerical simulation. The simulated tsunami inundation and run-up height with the actual measured values (Mori et al., 2012) were validated for each area using Aida's K and κ (Aida, 1978) as defined below:
where xi and yi are the measured and simulated tsunami trace heights, respectively, at point i. Consequently, K is considered a correction factor to adjust the modeled values to fit the actual tsunami averaged over several locations; κ is defined as a measure of the fluctuation or deviation in Ki. The values of Aida's K and κ from each model are shown in Table 1.
For Mangokuura Lake, model 3 produced the optimal values of Aida's K and κ. Because K is slightly less than 1.0, the simulated tsunami heights are slightly larger than the measurement. Similarly, for Matsushima Bay, model 2 produced the best Aida's K and κ. Because K is larger than 1.0, the simulated tsunami heights are smaller than the measurement. To better obtain the tsunami parameters, the fault slip was scaled by the K values of 0.96 and 1.29 for Mangokuura Lake and Matsushima Bay, respectively, so that the reproduced tsunami closely matched the measured tsunami trace heights and satisfied the guideline of the Japan Society of Civil Engineers: 0.95 < K < 1.05 and κ < 1.45 (Suppasri et al., 2011). As a result, the accuracy of the simulated tsunami parameters in both study areas was improved, as shown in Fig. 4.
Table 1Aida's K and κ for each model and after the model scaling.
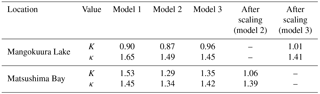
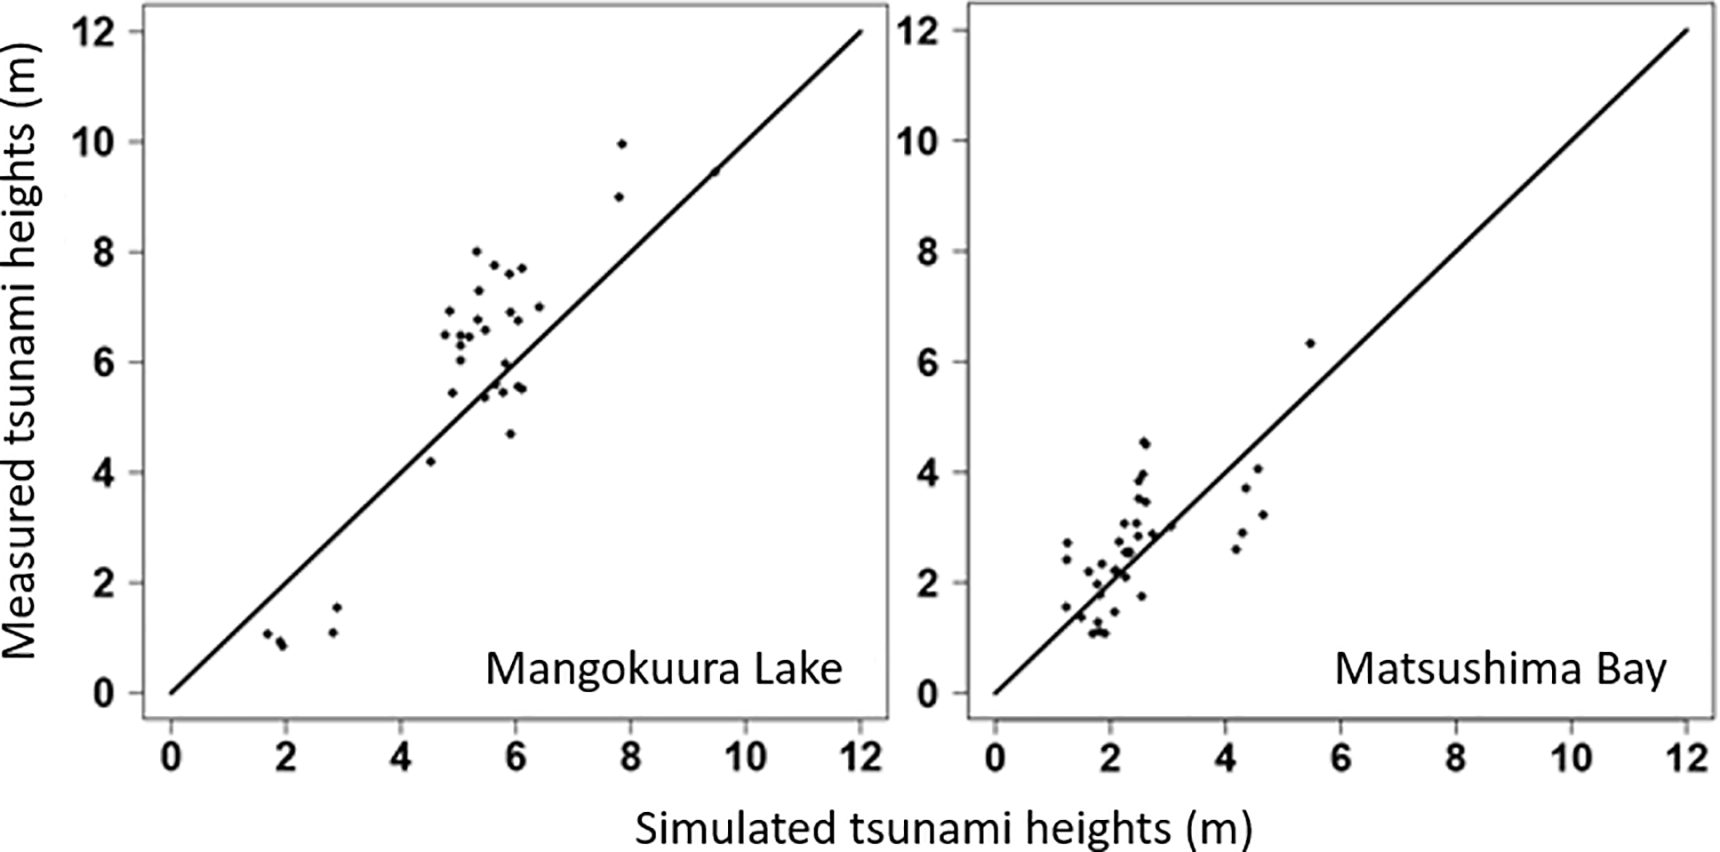
Figure 4Comparison of the simulated and measured tsunami heights in Mangokuura Lake and Matsushima Bay.
2.3 Reproduction results
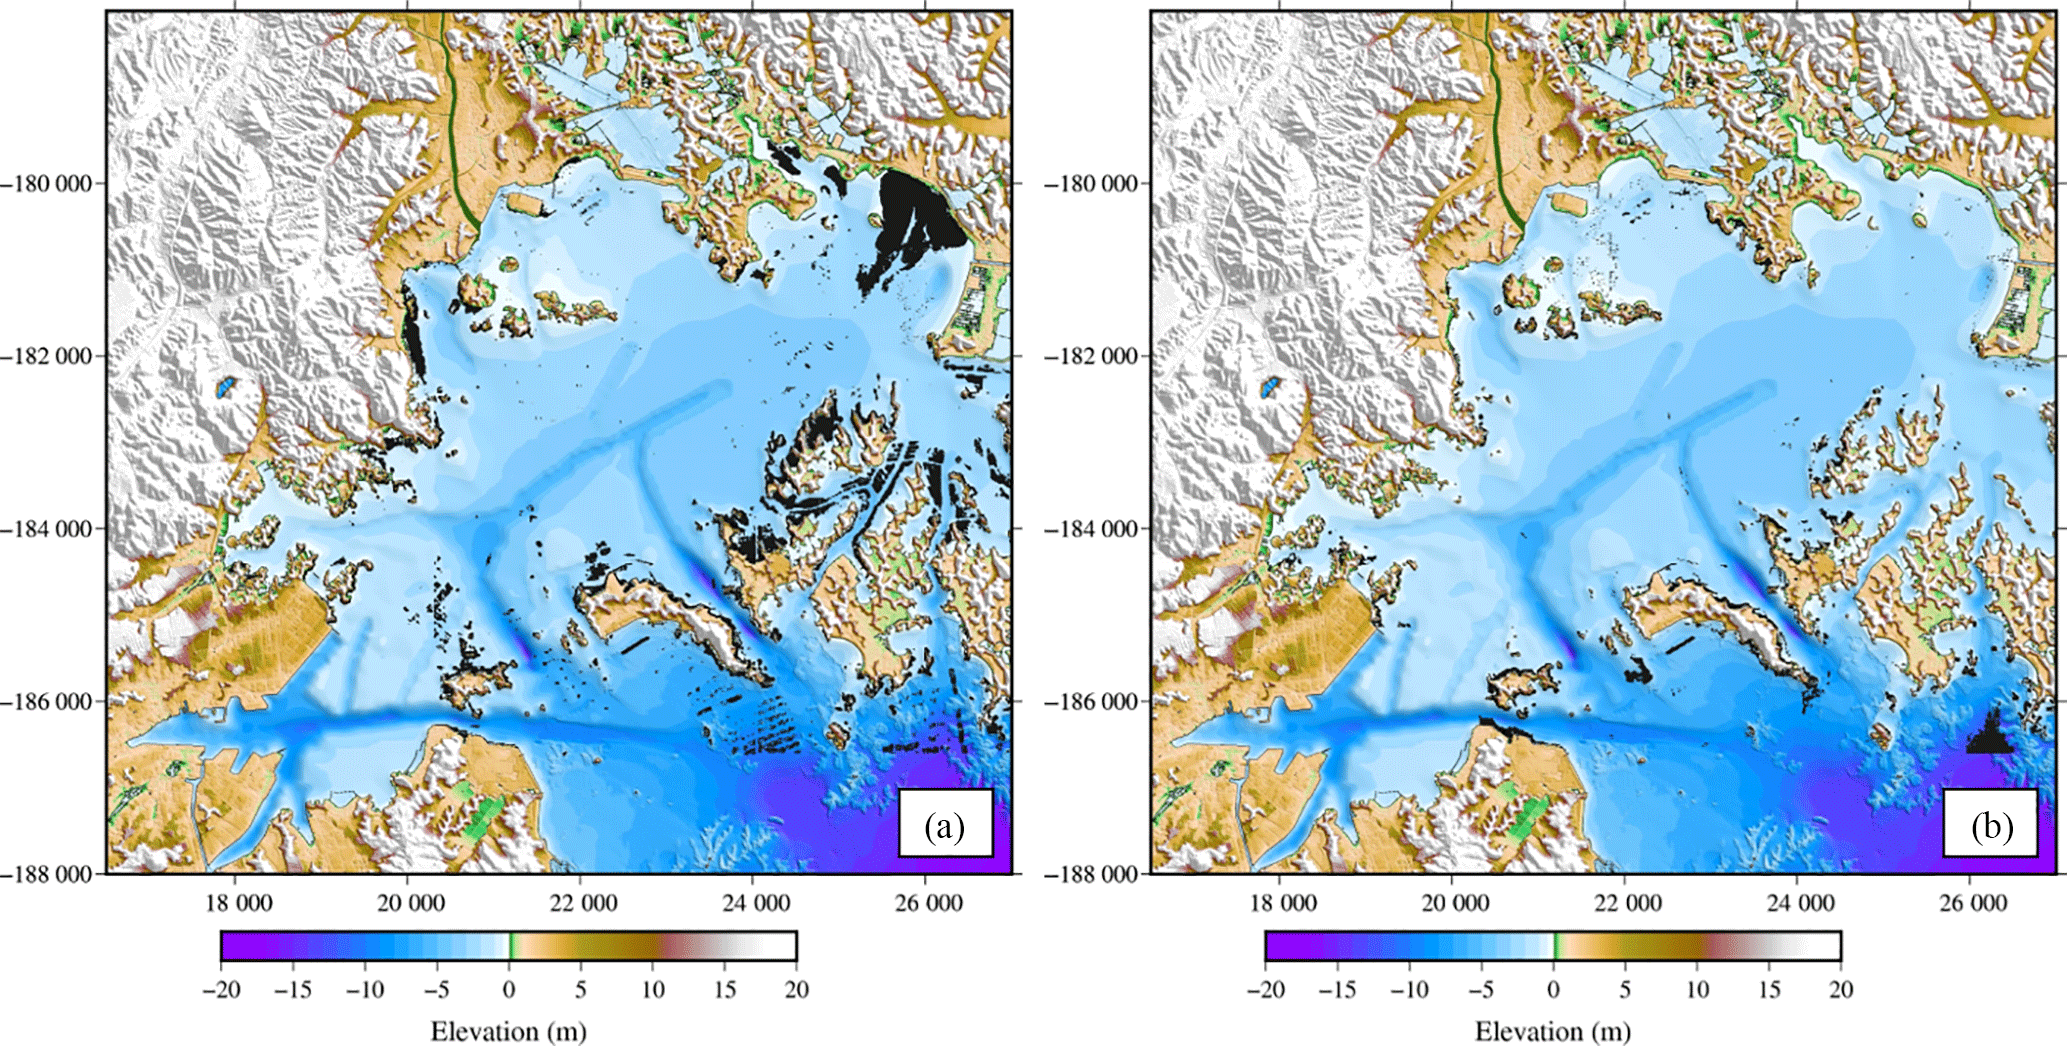
The hydrodynamic properties of the 2011 tsunami were reproduced based on the model calibration and verification as mentioned above. Figure 5 shows that the average maximum water level and flow velocity in the bay of Mangokuura Lake are approximately 0.5 m and 1–2 m s−1, respectively; those of Matsushima Bay are approximately 2 m and 3–5 m s−1, respectively; and the average offshore maximum water level and flow velocity in the other 2011 tsunami affected areas were much higher than these values (Suppasri et al., 2014).
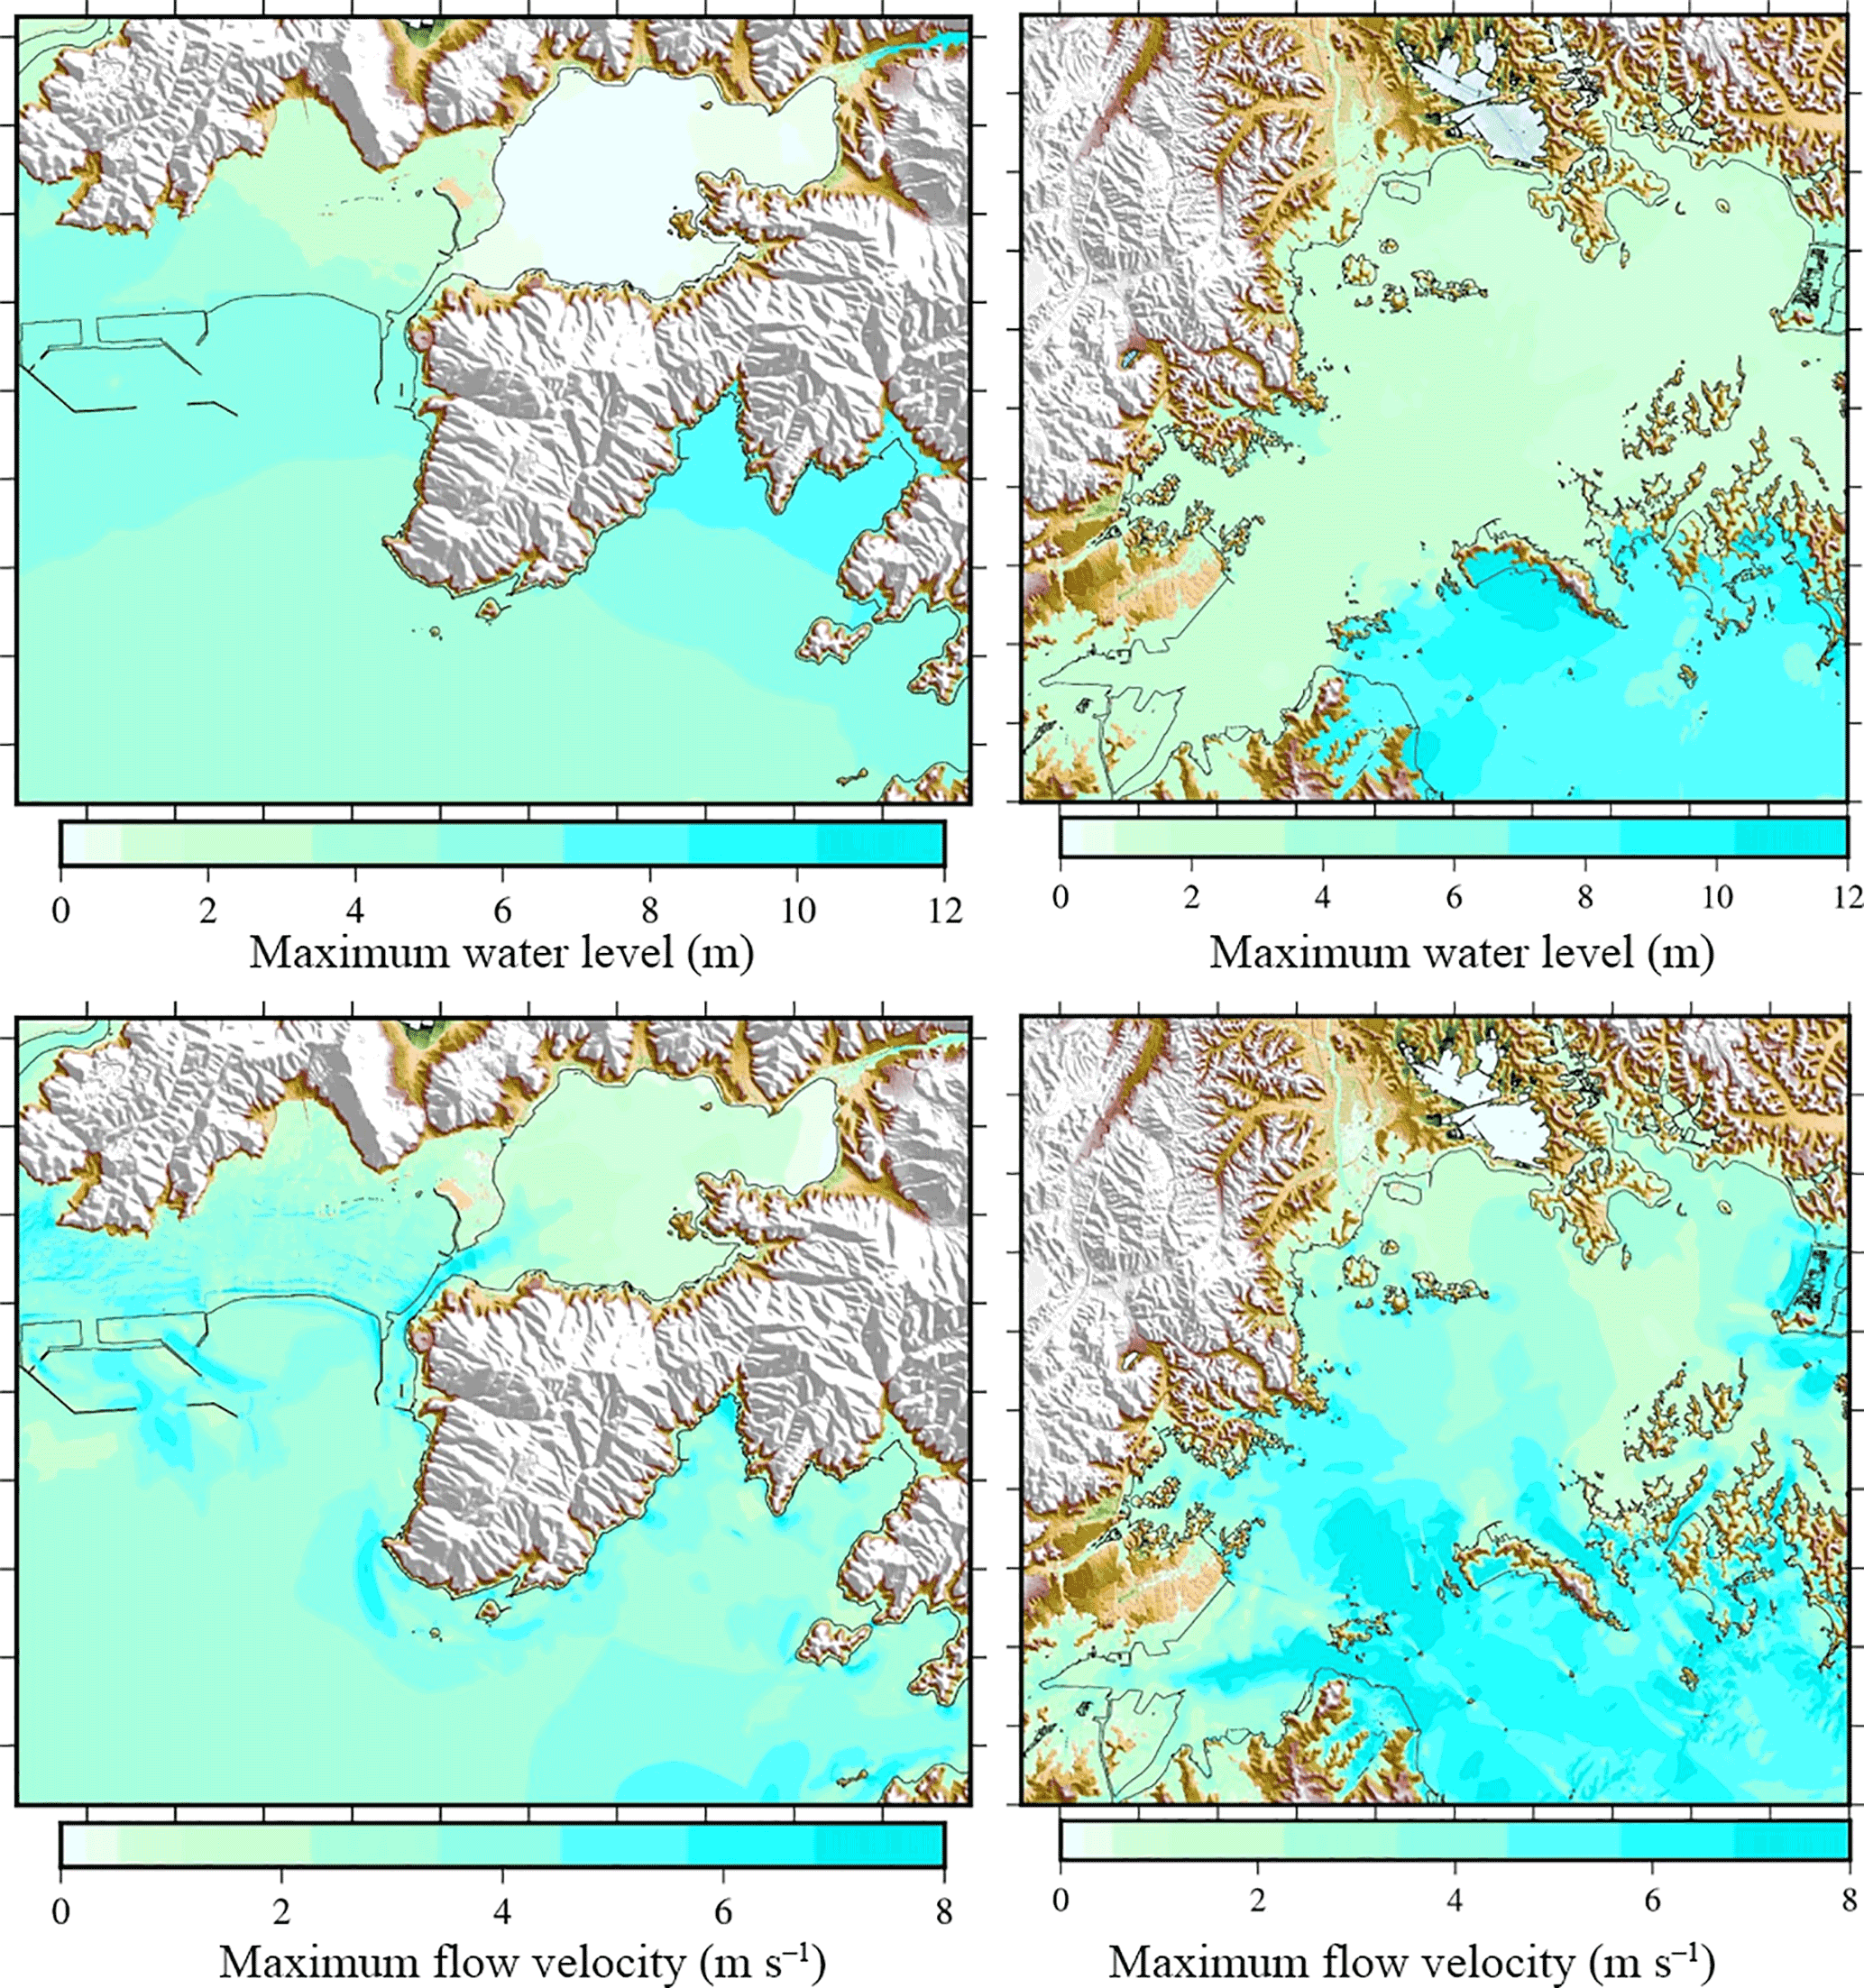
Figure 5Simulated maximum water level and flow velocity in Mangokuura Lake and Matsushima Bay.
Damage inspection was performed using satellite images taken before and after the tsunami through a visual inspection for the aquaculture rafts and an image analysis for the eelgrass.
3.1 Damage investigation of the aquaculture rafts
Based on criteria for the recovery process developed by the Japan Fisheries Agency (2010), aquaculture raft damage can be classified into four types: (1) complete damage (washed away), (2) major damage (70–100 % physical damage), (3) moderate damage (30–70 % physical damage), and (4) minor damage (less than 30 % physical damage). Because of the limitations encountered when using satellite images, only the complete-damage (washed away) level could be investigated using the satellite images taken before and after the tsunami, similar to other previous studies related to buildings (Koshimura et al., 2009; Suppasri et al., 2011). In this study, only the long-line type of aquaculture raft (Fig. 6) had sufficient quantities to develop the fragility function. This type of aquaculture raft is common in the study area and is used for oyster and seaweed farming. Examples of the visual inspection of the aquaculture rafts in the lake before (Fig. 7a) and after the tsunami (Fig. 7b) are shown. Approximately half of the rafts remained after the tsunami; the others were completely washed away. The aquaculture rafts that completely disappeared were classified as complete damage (washed away), whereas the damage levels of the remaining aquaculture rafts ranged from no damage to major damage. This classification is used to calculate the damage probability of complete damage in Sect. 4. Figure 7 also shows the visual-inspection results (presented as polygons) of complete damage versus no damage and other damage levels for the aquaculture rafts (long-line type) in Mangokuura Lake. Many completely damaged aquaculture rafts were found near the entrance to and in the middle of the lake. Then, the created polygons were gridded into 5 × 5 m2 regions corresponding to the finest tsunami simulation grid (region 6). The simulated maximum water level and flow velocity were assigned to each grid. For Matsushima Bay, there was an insufficient number of long-line-type aquaculture rafts, and many rafts could not be classified into types. Therefore, only those aquaculture rafts in Mangokuura Lake that were completely damaged were used to develop the fragility functions.
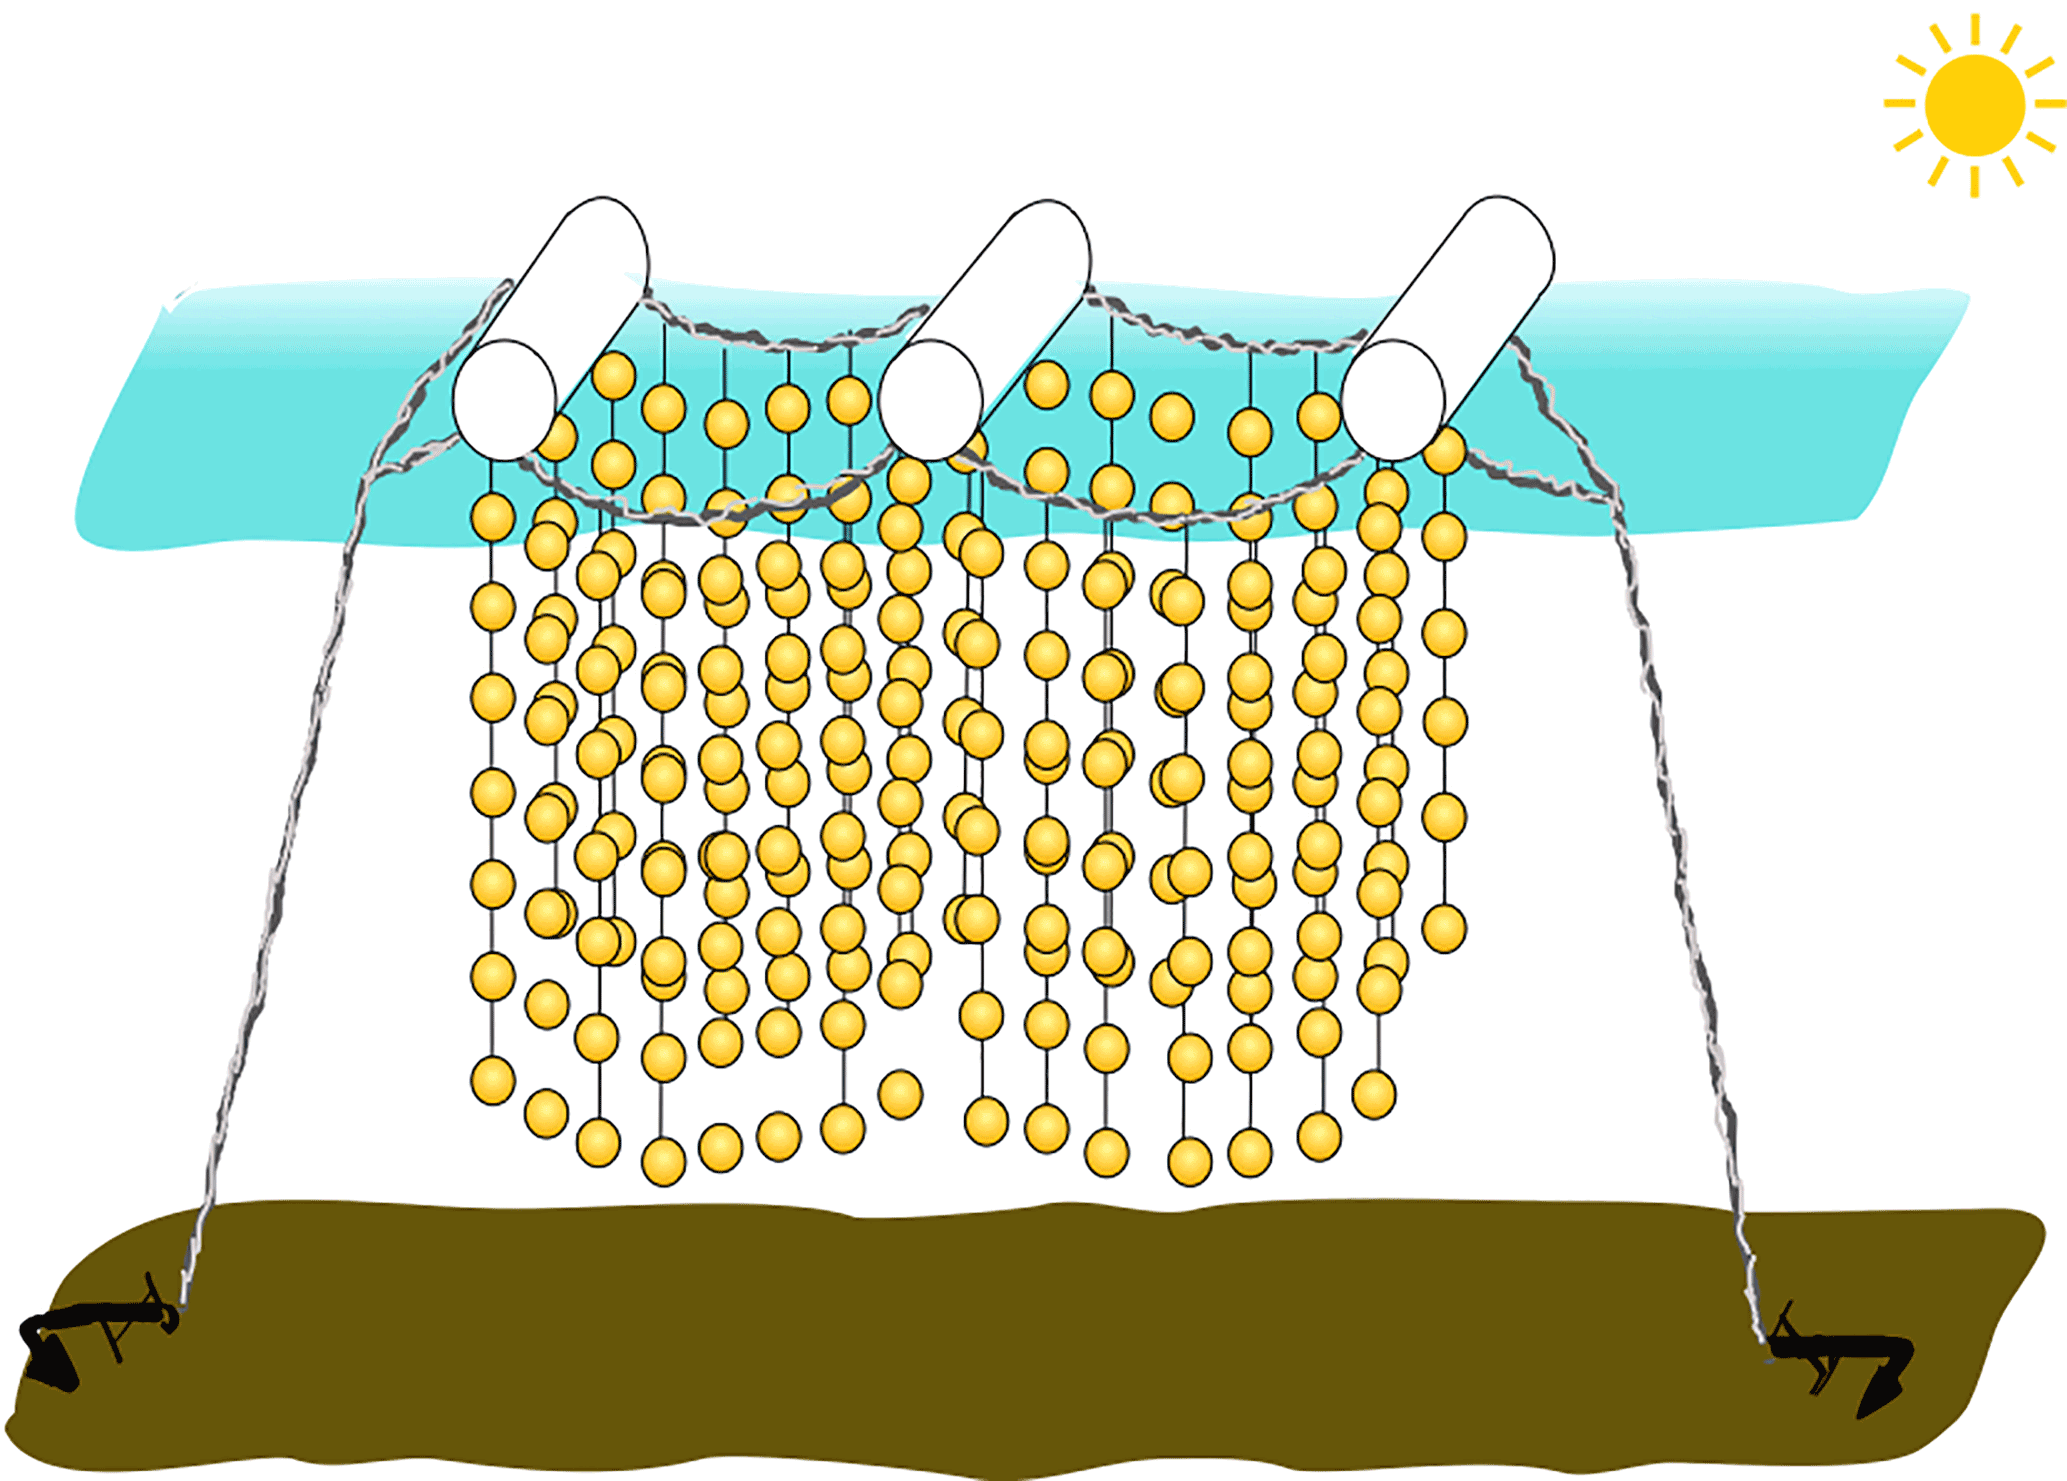
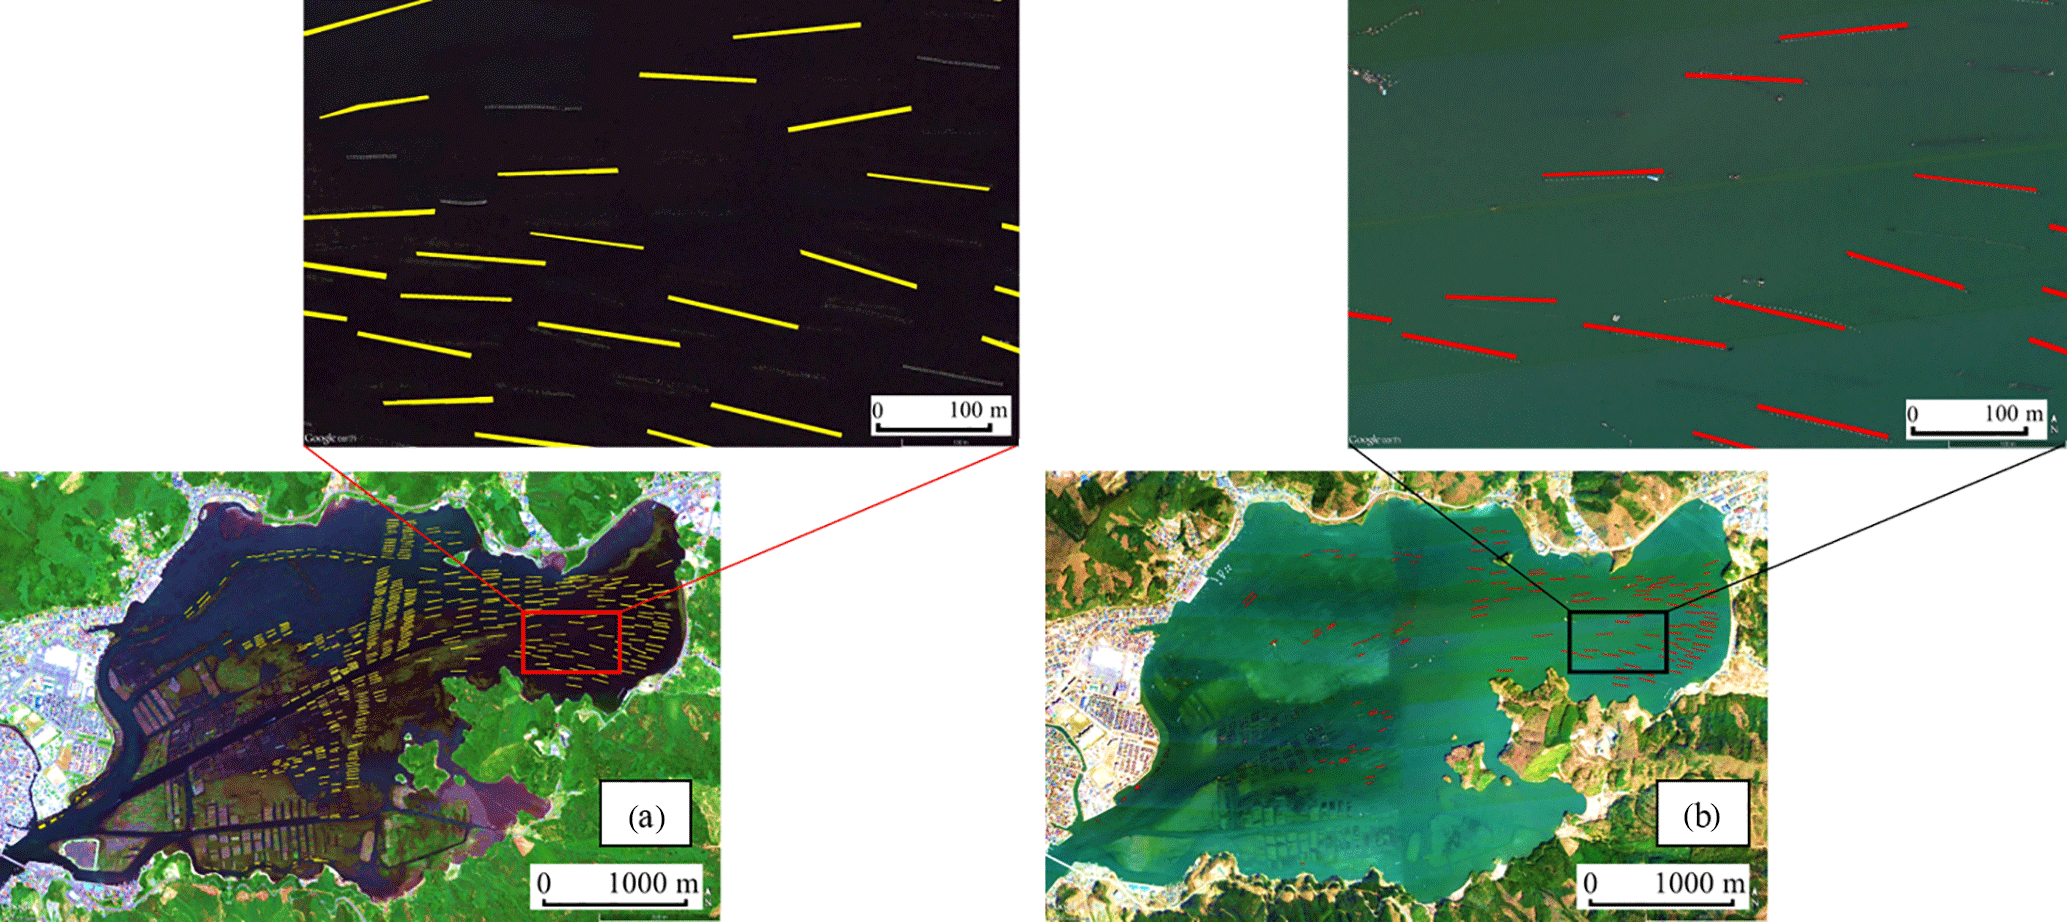
Figure 7Visual damage interpretation of aquaculture rafts (long-line type) (a) before and (b) after the 2011 tsunami.
3.2 Damage investigation of eelgrass
Damage to eelgrass occurs in one of three modes: cut-off, deposition, or erosion, as shown in Fig. 8. Although the deposition and erosion can be estimated using a sediment transport model, more detailed data and surveys are required to obtain the necessary data for the model input. This pilot study considered only the tsunami itself. In addition, the erosion was controlled primarily by the flow velocity. Therefore, the cut-off and erosion were considered damage from the horizontal force of the tsunami.
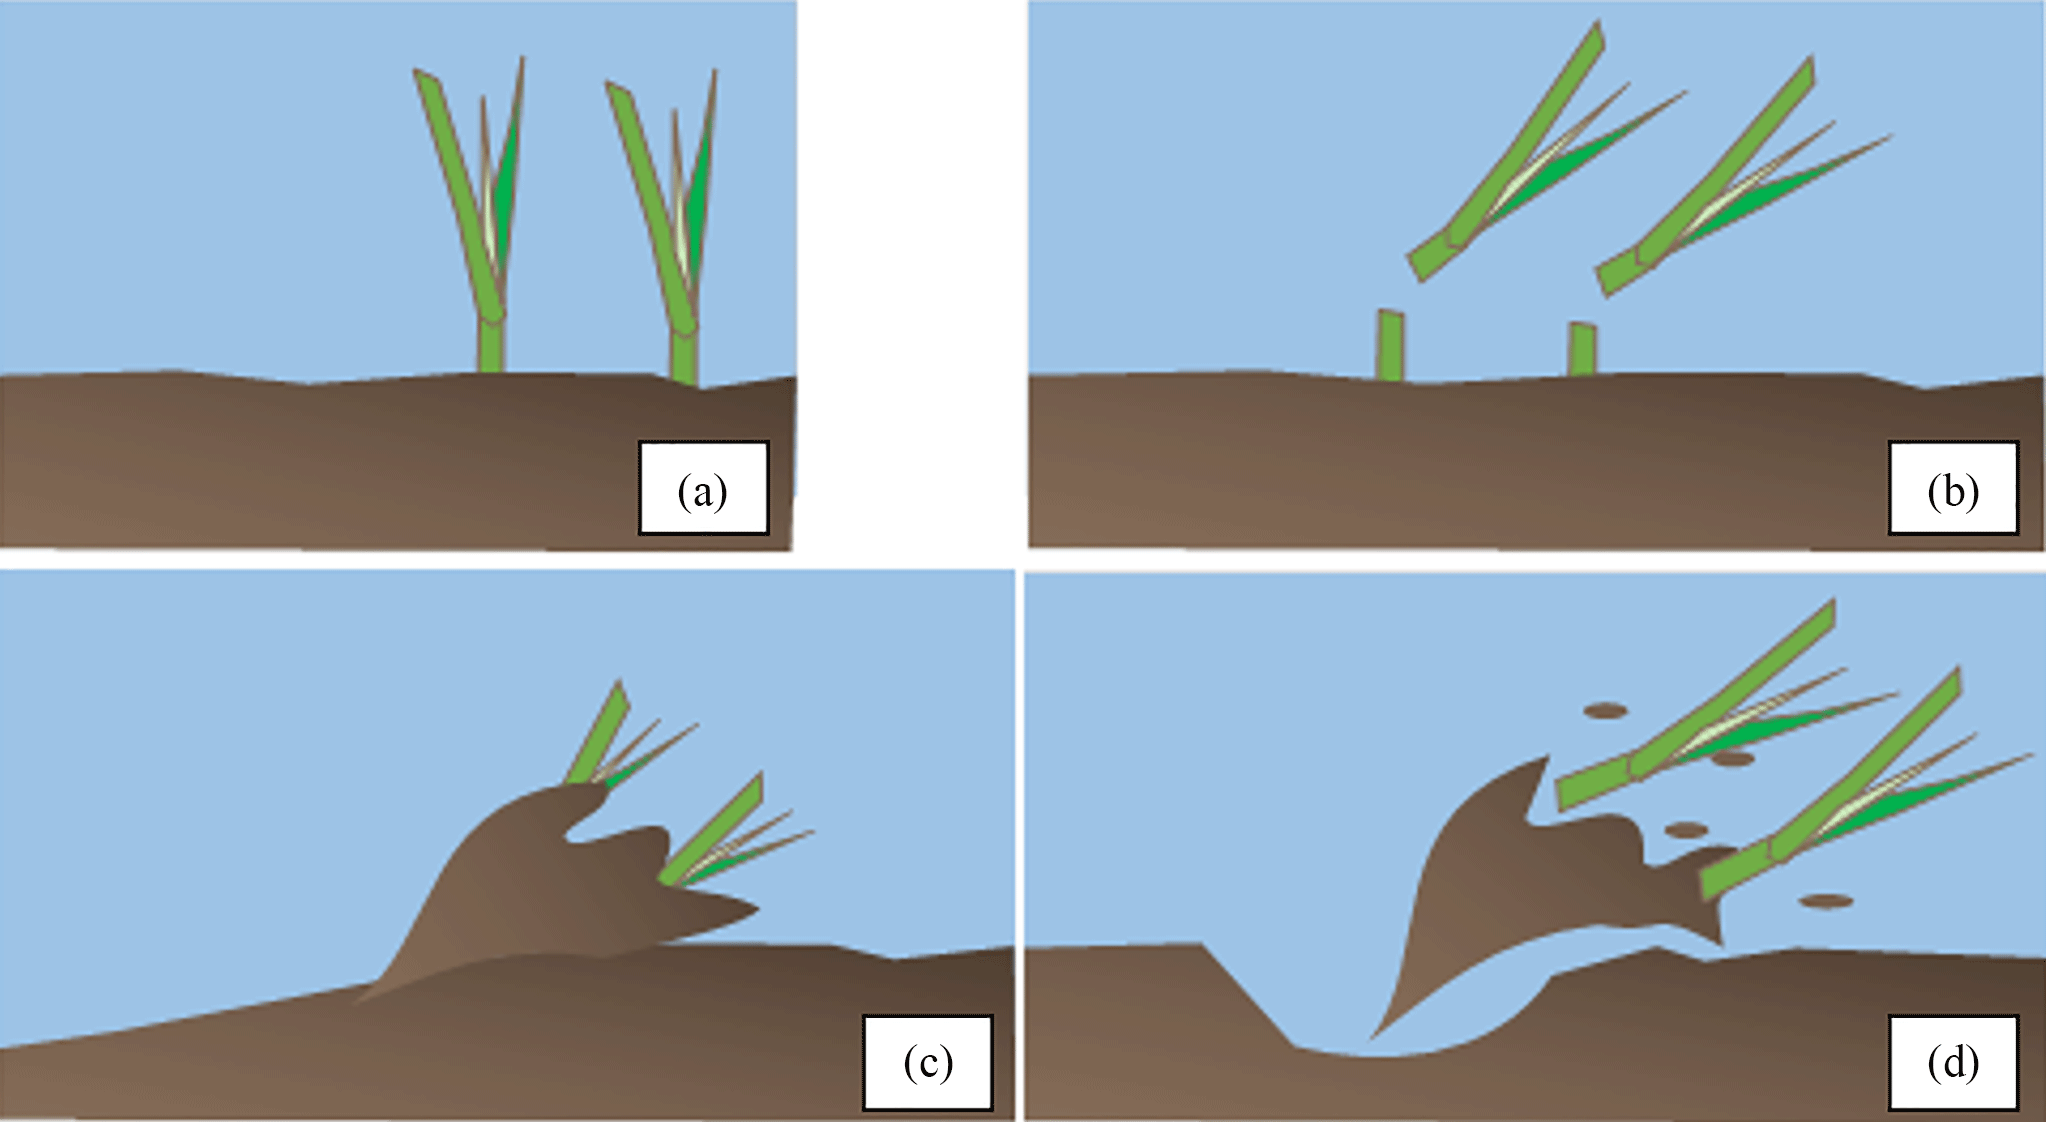
Figure 8(a) Eelgrass and its damage pattern: (b) cut-off, (c) sand deposition and (d) erosion.
Color images from an actual satellite image taken before the 2011 tsunami and after the 2011 tsunami were analyzed (Northwest Pacific Region Environmental Cooperation Center, 2016; Tsujimoto et al., 2016). At this stage, the areas for land, sea, aquaculture raft, eelgrass, and mudflat were first identified. To identify only the eelgrass area, the colored images were binarized to binary (black and white) images using the ImageJ image analysis software, which is being developed at the National Institutes of Health, the United States (ImageJ, 2016). This binarization helps distinguish eelgrass and non-eelgrass areas. Figures 9 and 10 show the eelgrass areas before and after the 2011 tsunami in Mangokuura Lake and Matsushima Bay, respectively. Similar to the aquaculture rafts, the eelgrass that was completely damaged could be investigated by comparing the images taken before and after the tsunami. The identified damaged and undamaged areas for both aquaculture rafts and eelgrass were gridded into 5 × 5 m2 regions. Then, the damage ratio of each grid was calculated, and the maximum simulated water level and flow velocity were assigned to each grid. Finally, another process was performed to create a list of the simulated tsunami characteristics (water level and velocity) and the damage ratio to develop the fragility function, as explained in the next section.

4.1 Preliminary analysis
A comparison of the aquaculture raft data in the cases of the 1960 Chilean tsunami (Fig. 1) and the 2011 Japan tsunami is shown in Fig. 11. Most of the aquaculture rafts that were not completely damaged in the 2011 tsunami were limited to a maximum flow velocity of less than 1.5 m s−1. For both target areas, the damage probabilities for each range of the simulated water level and maximum flow velocity of both aquaculture rafts and eelgrass were calculated and are shown against a median value in a specific range of the grids. In Fig. 12, the preliminary scatterplot does not show any significant trend between the simulated maximum water level and the damage to the aquaculture rafts (Fig. 12a) and eelgrass (Fig. 12b) in Mangokuura Lake or between the simulated maximum flow velocity and the damage to eelgrass in Matsushima Bay (Fig. 12c). Thus, another expected parameter was used to develop the fragility functions: the simulated maximum flow velocity in Mangokuura Lake. To verify that our regression model is better than the predicted average value, an analysis of variance (ANOVA) was performed. ANOVA is a statistical test to verify whether the regression model is significantly satisfactory in terms of predicting the variable's value. The analysis can test whether the proposed regression model provides a better estimation than that obtained using the average value of the predicted variables. The result shows that the calculated models significantly predict the damage ratio (F aquaculture raft = 74.73; p aquaculture raft < 0.001; F eelgrass = 89.70; p eelgrass < 0.001) in the model.
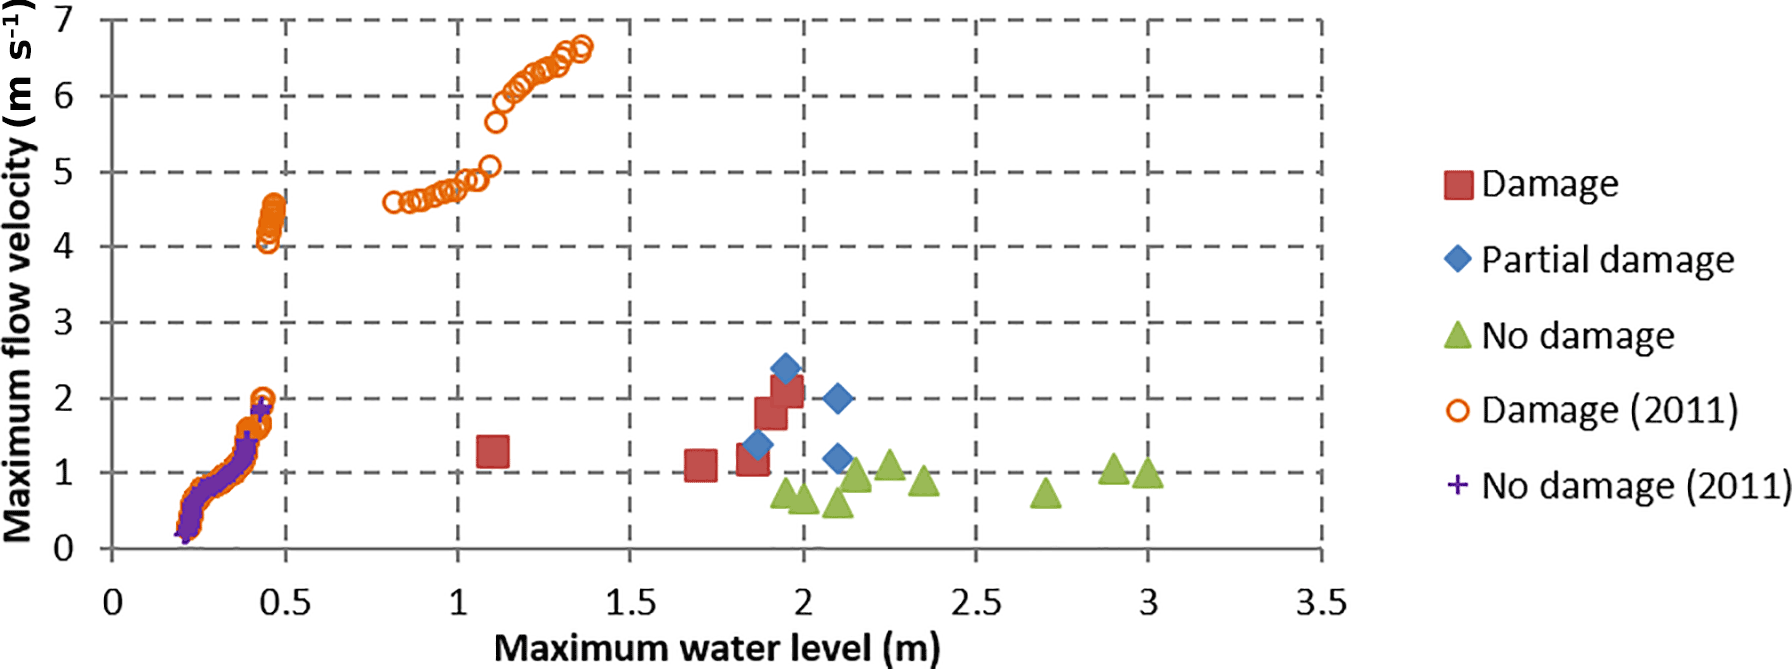
Figure 11Comparison of the aquaculture raft data from the 1960 Chilean tsunami (Fig. 1) and the present study on the 2011 Japan tsunami.
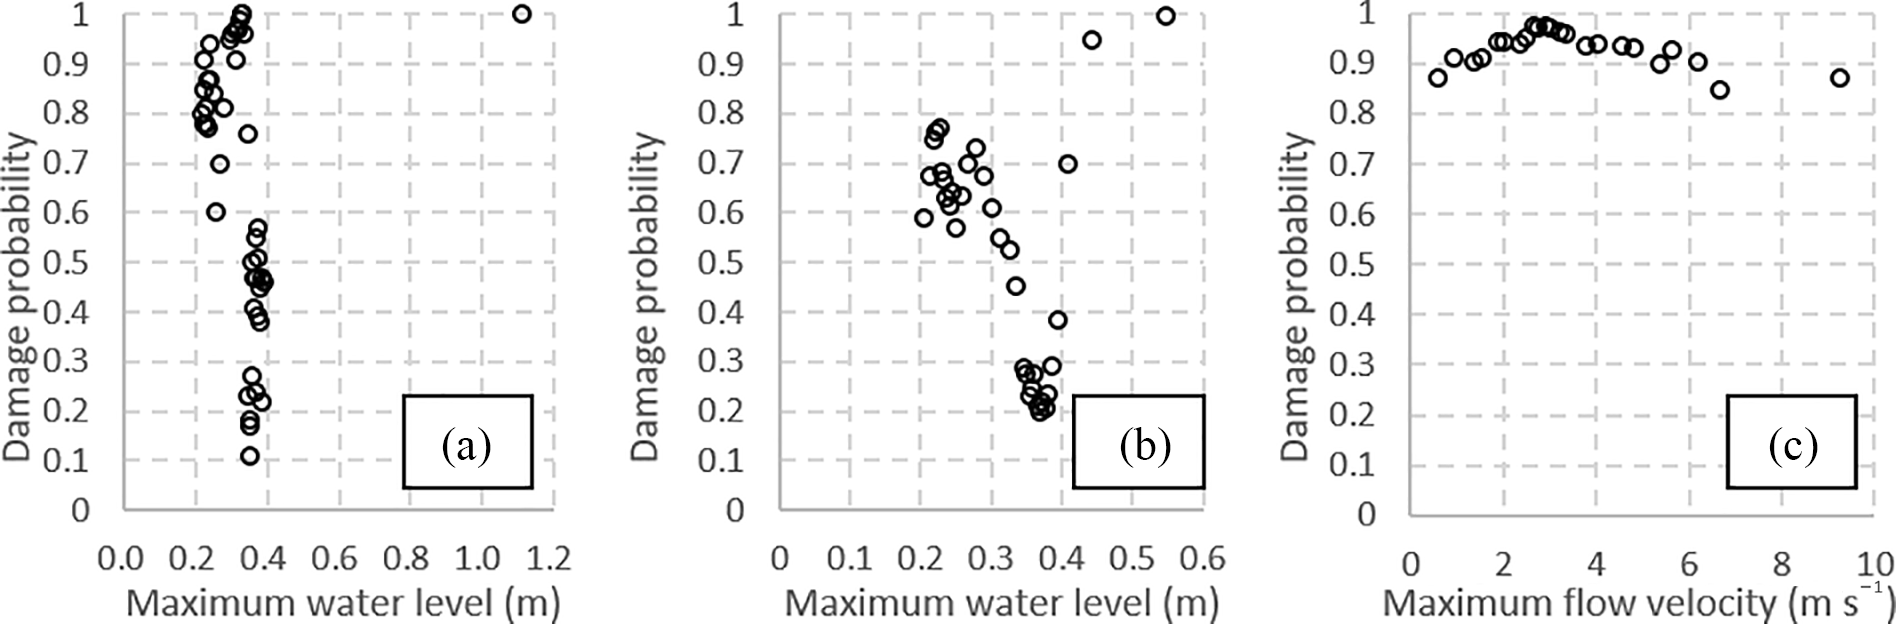
Figure 12Maximum water level and complete-damage probability for the (a) aquaculture rafts and (b) eelgrass in Mangokuura Lake and for (c) eelgrass in Matsushima Bay.
4.2 Linear regression analysis
Only the simulated maximum flow velocity and damaged-eelgrass data in Mangokuura Lake could be used to develop the fragility functions. The tsunami fragility functions were developed by applying the classical standardized lognormal distribution function throughout the linear regression analysis for both aquaculture rafts and eelgrass. For Mangokuura Lake, Fig. 12 shows the histograms of the numbers of damaged and undamaged aquaculture rafts in every 100 grids (Fig. 13a) and 0–50 % damaged and 50–100 % damaged eelgrass in every 5000 grids (Fig. 13b) in terms of the simulated maximum flow velocity range. Both histograms show that the damage data increase when the flow velocity increases. A linear regression analysis was performed to develop the fragility function. The cumulative probability P of occurrence of the damage is given in Eq. (4):
where Φ is the standardized lognormal distribution function; x is the hydrodynamic feature of the tsunami (simulated maximum velocity); and μ′ and σ′ are the mean and standard deviation of ln x, respectively. The statistical parameters μ′ and σ′ of the fragility function were obtained by plotting ln x against the inverse of Φ−1 on lognormal probability papers and performing least-squares fitting of this plot (Fig. 14a and b). Consequently, two parameters are obtained as the intercept ( and angular coefficient ( in Eq. (5).
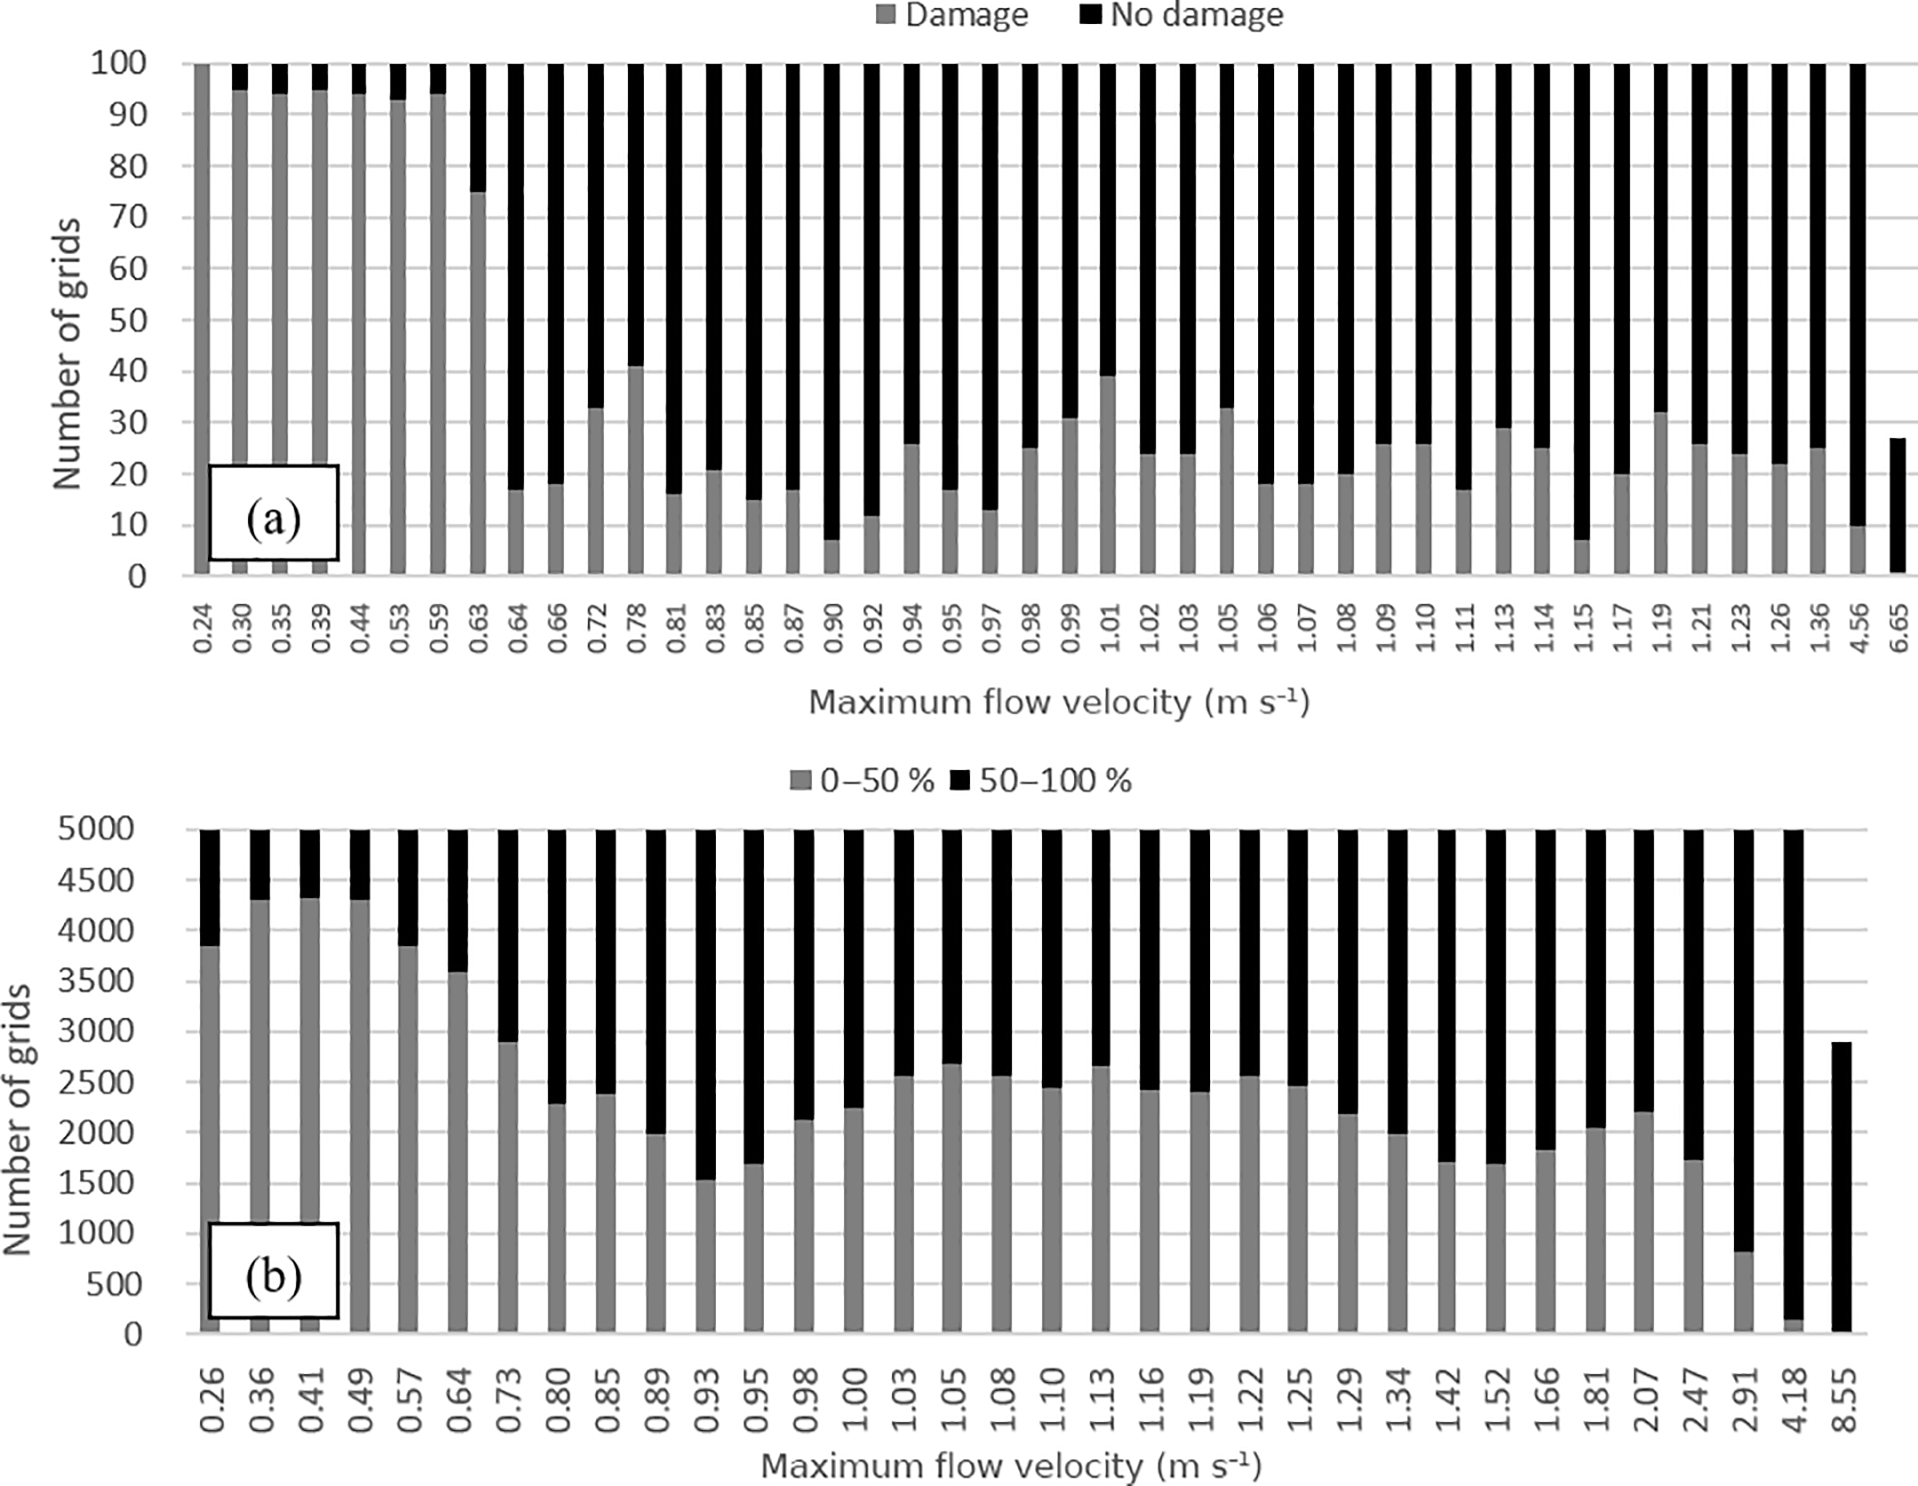
Figure 13Histogram of the numbers of (a) damaged and undamaged aquaculture rafts and (b) 0–50 % damaged and 50–100 % damaged eelgrass in terms of the simulated flow velocity range in Mangokuura Lake.
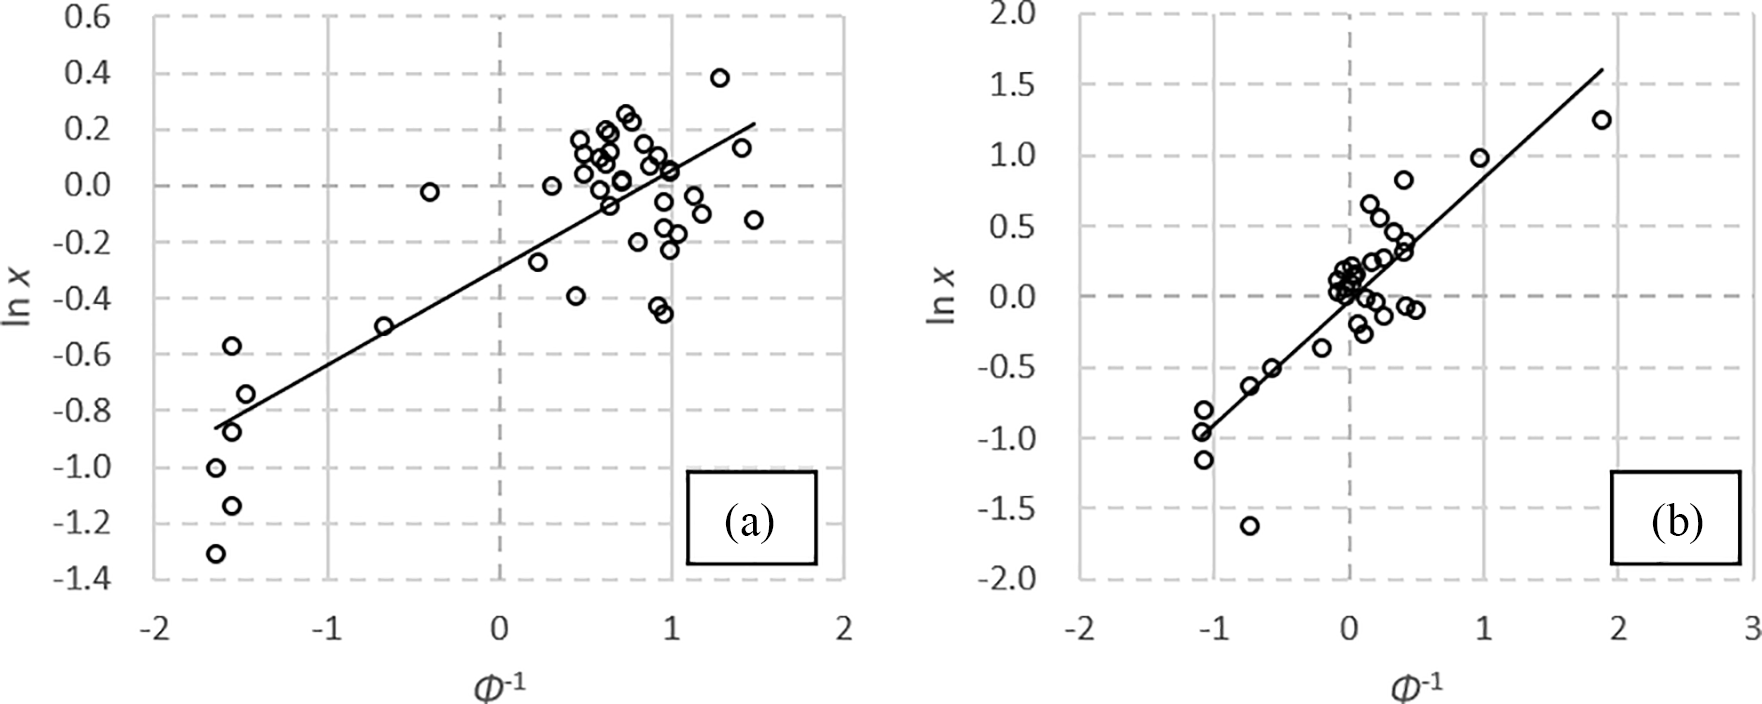
Figure 14Least-squares fit on lognormal probability paper for the (a) aquaculture rafts and (b) eelgrass in Mangokuura Lake.
4.3 Tsunami fragility functions for the aquaculture rafts and eelgrass
With the regression analysis, the parameters that best fit the fragility functions with respect to the maximum flow velocity are shown in Table 2. The tsunami fragility curves for the aquaculture rafts and eelgrass were developed as shown in Fig. 15a and b, respectively. The proposed fragility functions show that a complete-damage ratio above 0.5 corresponds to maximum flow velocities of 0.8 m s−1 (aquaculture raft) and 1.0 m s−1 (eelgrass). A complete-damage ratio above 0.9 corresponds to maximum flow velocities of 1.3 m s−1 (aquaculture raft) and 3.0 m s−1 (eelgrass). The results for the aquaculture rafts are consistent with the previously proposed criteria (Nagano et al., 1991): at 1 m s−1 flow velocity, the damage ratio is almost 0.8.
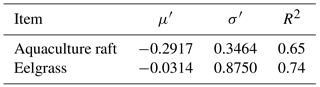
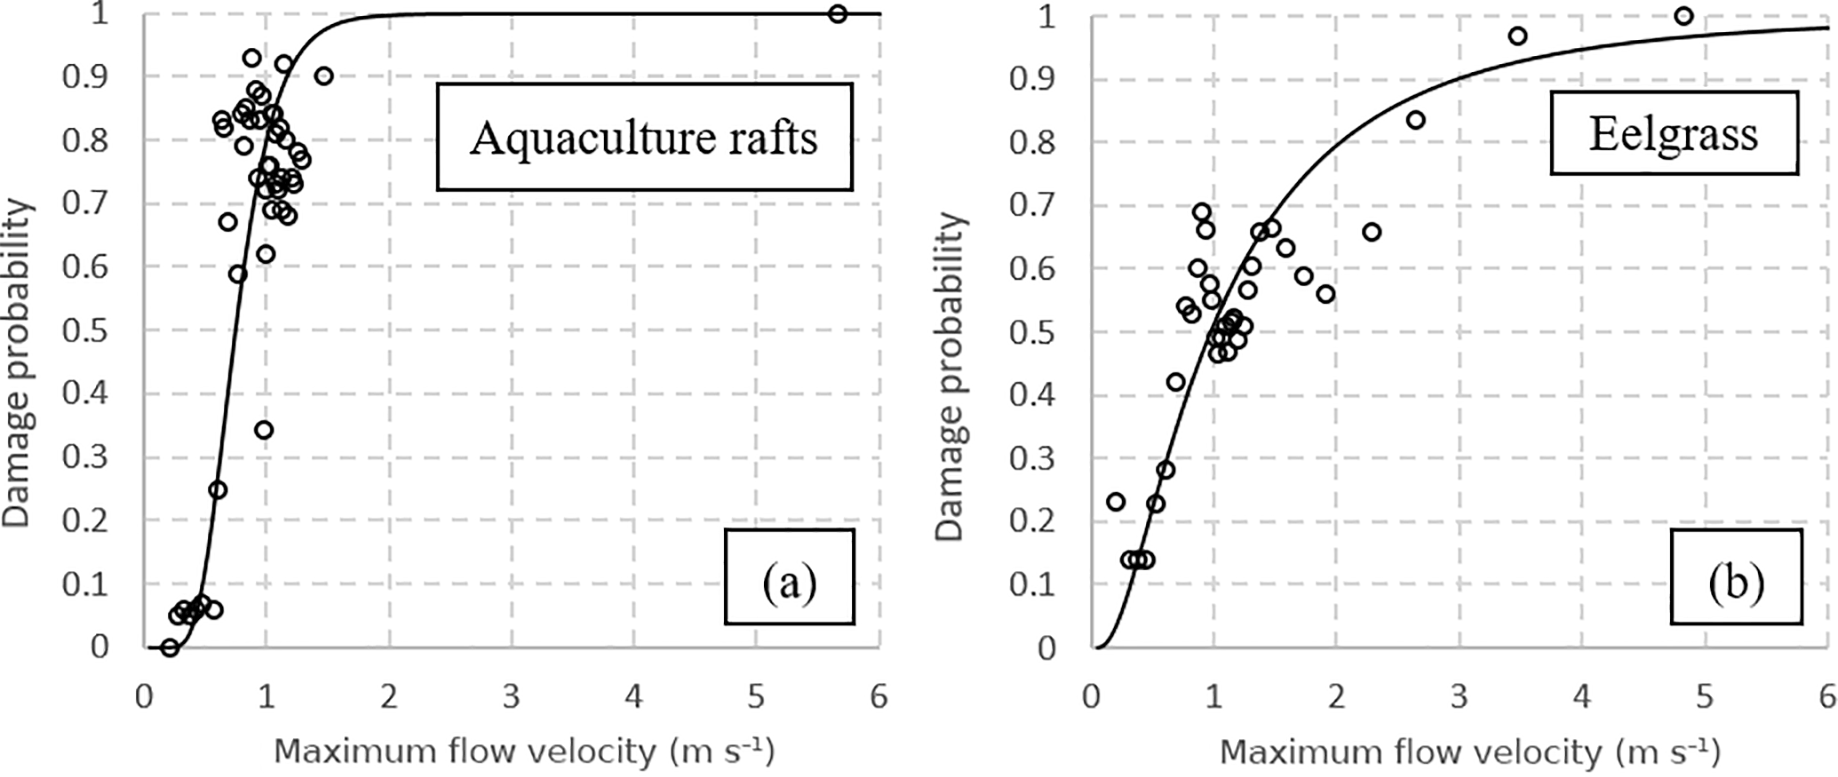
Figure 15Tsunami fragility functions for completely damaged (a) aquaculture rafts and (b) eelgrass based on data from Mangokuura Lake.
5.1 Main findings
This study was the first attempt in this field to develop fragility functions for aquaculture rafts and eelgrass. The careful selection of the study areas and availability of the damage data enabled this attempt. First, we reproduced the hydrodynamic characteristics, i.e., the water level and flow velocity of the 2011 tsunami, using the tsunami trace data for the model calibration and verification based on the finest grid of 5 × 5 m2 regions. The damage data for both aquaculture rafts and eelgrass were investigated by visually inspecting and analyzing the satellite images before and after the 2011 tsunami. Then, the fragility functions for the aquaculture rafts and eelgrass were developed using the data for Mangokuura Lake. This lake appears to be the only suitable location for a study based on tsunami characteristics because of its location and consequent damage range from no damage to minor damage to considerable damage. In addition, Matsushima Bay was exposed to a stronger tsunami and had fewer undamaged aquaculture rafts and less surviving eelgrass. The main conclusions are as follows:
-
Based on the reproduced hydrodynamic characteristics of the 2011 tsunami, Matsushima Bay was hit by a stronger tsunami than Mangokuura Bay (Fig. 5).
-
The maximum water level is not related to the damage to aquaculture rafts and eelgrass (Fig. 12).
-
The threshold value (at 90 % damage probability) of the maximum flow velocity for completely damaged aquaculture rafts and eelgrass is 1.3 and 3.0 m s−1, respectively (Fig. 15).
-
The proposed fragility function for the aquaculture rafts is consistent with the previously proposed damage criteria and can further provide the values of the damage ratio at other flow velocities in addition to the threshold value.
-
This information on the tsunami damage in offshore areas is expected to be useful for marine product and environmental damage assessment and recommendations for aquaculture raft zoning to mitigate the effects of tsunamis in the future.
5.2 Limitations, considerations, and future studies
Although this study successfully developed fragility functions for aquaculture rafts and eelgrass for the first time, certain limitations and considerations exist when applying the fragility functions, and possible improvements to be pursued in future studies are as follows.
-
The developed fragility functions may underestimate the economic damage related to aquaculture rafts because the loss of marine products may occur even when the rafts remain. For example, although the aquaculture rafts were present in the satellite image, in some cases the marine products were completely washed away or damaged when the rafts collided with each other.
-
This study simulated only the hydrodynamic characteristics of the tsunami, which can directly explain the damage caused by cut-off and erosion. However, the damage caused by deposition was not considered.
-
The use of the actual surveyed damage to the aquaculture rafts and eelgrass and the application of a sediment transport model may increase the accuracy of the fragility functions.
-
The fragility functions for both aquaculture rafts and eelgrass may differ based on the type of aquaculture raft and the environmental conditions of the eelgrass. Future studies of aquaculture rafts and eelgrass in other areas impacted by historical tsunami events may improve our understanding of these differences and the generalizability of the fragility functions.
Source code and details of tsunami simulation were sourced from Imamura (1996). Topography and bathymetry data were obtained from previous research (Macabuag et al., 2016), which sourced the original data from the Geospatial Information Authority of Japan (GSI, 2015). Damage data were obtained from published results (NPEC, 2016). Figures 2, 3, 5, 9, and 10 were made using an open-source collection of computer software tools called Generic Mapping Tools (GMT, 2016).
The authors declare that they have no conflict of interest.
We thank the Miyagi Prefecture Fisheries Cooperative Association (Japan
Fisheries Cooperatives (JF)), Ishinomaki Bay branch,
for their information on the aquaculture rafts and Daisuke Sugawara (Museum
of Natural and Environmental History, Shizuoka) for his help in developing
the bathymetry and topography data. This study was funded through
IRIDeS, Tohoku University, by the Tokio Marine & Nichido Fire Insurance Co., Ltd.; the Willis Research Network (WRN); and JSPS
Grant-in-Aid for Young Scientists (B) “Applying developed fragility
functions for the Global Tsunami Model (GTM)” (grant
no. 16K16371).
Edited by: Ira Didenkulova
Reviewed by: two anonymous referees
Aida, I.: Reliability of a tsunami source model derived from fault parameters, J. Phys. Earth, 26, 57–73, 1978.
Costanza, R., D'Arge, R., Groot, R. D., Farber, S., Grasso, M., Hannon, B., Limburg, K., Naeem, S., O'Neill, R. V., Paruelo, J., Raskin, R. G., Sutton, P., and Van Den Belt, M.: The value of the world's ecosystem services and natural capital, Nature, 387, 253–260, 1997.
Charvet, I., Suppasri, A., Kimura, H., Sugawara, D., and Imamura, F.: Fragility estimations for Kesennuma City following the 2011 Great East Japan Tsunami based on maximum flow depths, velocities and debris impact, with evaluation of the ordinal model's predictive accuracy, Nat. Hazards, 79, 2073–2099, 2015.
Charvet, I., Macabuag, J., and Rossetto, T.: Estimating tsunami-induced building damage through fragility functions: Critical review and research needs, Front. Built Environ., 3, 1–22, https://doi.org/10.3389/fbuil.2017.00036, 2017.
Generic Mapping Tools (GMT): Obtaining and installing GMT, available at: https://www.soest.hawaii.edu/gmt/ last access: 1 August 2016.
Geospatial Information Authority of Japan (GSI): High resolution digital elevation data, available at: http://www.gsi.go.jp/kankyochiri/Laser_demimage.html, last access: 1 April 2015.
ImageJ: ImageJ, Image Processing and Analysis in Java, available at: https://imagej.nih.gov/ij/index.html (last access: 10 February 2017), 2016.
Imamura, F.: Review of tsunami simulation with a finite difference method, in: Long-Wave Runup Models, edited by: Yeh, H., Liu, P., and Synolakis, C. E., World Scientific Publishing Co., Singapore, http://www.worldscientific.com/worldscibooks/10.1142/3327 (last access: 2 October 2007), 25–42, 1996.
Imamura, F., Koshimura, S., Mabuchi, Y., Oie, T., and Okada, K.: Tsunami simulation of the 2011 Great East Japan Tsunami using Tohoku University model (Version 1.1), available at: http://www.tsunami.civil.tohoku.ac.jp, last access: 7 November 2011 (in Japanese).
Japan Fisheries Agency: Survey of the aquaculture rafts damage and recovery by the tsunami on the 28th February 2010, 2010.
Kato, H., Tanji, Y., Fujima, K., and Shigihara, Y.: Study on Measures against Drifting of Cultivation Rafts by Tsunami (Report on the result of 2010 Chili Earthquake Tsunami), Collection of articles published by the Japanese Institute of fisheries Infrastructure and Communities, 21, 111–120, 2010 (in Japanese with English abstract).
Keen, A. S., Lynett, P. J., Eskijian, M. L., Ayca A., and Wilson, R.: Monte Carlo–based approach to estimating fragility curves of floating docks for small craft marinas, J. Waterway, Port, Coastal, Ocean Eng., 143, 04017004, https://doi.org/10.1061/(ASCE)WW.1943-5460.0000385, 2017.
Koshimura, S., Oie, T., Yanagisawa, H., and Imamura, F.: Developing Fragility Functions for Tsunami Damage Estimation using Numerical Model and Post-Tsunami Data from Banda Aceh, Indonesia, Coast. Eng. J., 51, 243–273, 2009.
Leelawat, N., Suppasri, A., Charvet, I., and Imamura, F.: Building damage from the 2011 Great East J apan tsunami: Quantitative assessment of influential factors – A new perspective on building damage analysis, Nat. Hazards, 73, 449–471, 2014.
Macabuag, J., Rossetto, T., Ioannou, I., Suppasri, A., Sugawara, D., Adriano, B., Imamura, F., and Koshimura, S.: A proposed methodology for deriving tsunami fragility functions for buildings using optimum intensity measures, Nat. Hazards, 84, 1257–1285, https://doi.org/10.1007/s11069-016-2485-8, 2016.
Mori, N., Takahashi, T., and 2011 Tohoku Earthquake Tsunami Joint Survey Group: Nationwide Post Event Survey and Analysis of the 2011 Tohoku Earthquake Tsunami, Coast. Eng. J., 54, 1250001, https://doi.org/10.1142/S0578563412500015, 2012.
Muhari, A., Charvet, I., Futami, T., Suppasri, A., and Imamura, F.: Assessment of tsunami hazard in port and its impact on marine vessels from tsunami model and observed damage data, Nat. Hazards, 78, 1309–1328, 2015.
Nagano, O., Imamura, F., and Shuto, N.: A numerical model for far-field tsunamis and its application to predict damages done to aquaculture, Nat. Hazards, 4, 235–255, 1991.
Northwest Pacific Region Environmental Cooperation Center (NPEC), Atmosphere and Ocean Research Institute, The University of Tokyo: Damage condition of seaweed bed and tideland based on the 2011 Great East Japan tsunami in Mangokuura Lake, available at: http://ocean.nowpap3.go.jp/wp-content/uploads/2014/07/mangoku_higai.pdf, last access: 6 August 2016.
Okada, Y.: Surface deformation due to shear and tensile faults in a half space, B. Seismol. Soc. Am., 75, 1135–1154, 1985.
Sakamaki, T., Sakurai, Y., and Nishimura, O.: Tsunami impacts on eelgrass beds and acute deterioration of coastal water quality due to the damage of sewage treatment plant in Matsushima Bay, Japan, Tsunamis and earthquakes in coastal environments: Significance and restoration, Coastal Research Library, 14, 187–199, 2016.
Satake, K., Fujii, Y., Harada, T., and Namegaya Y.: Time and Space Distribution of Coseismic Slip of the 2011 Tohoku Earthquake as Inferred from Tsunami Waveform Data, B. Seismol. Soc. Am., 103, 1473–1492, 2013.
Shoji, G. and Nakamura, T.: Damage assessment of road bridges subjected to the 2011 Tohoku Pacific earthquake tsunami, Journal of Disaster Research, 12, 79–89, 2017.
Sugino, H., Wu, C., Korenaga, M., Nemoto, M., Iwabuchi, Y., and Ebisawa, K.: Analysis and verification of the 2011 Tohoku earthquake tsunami at nuclear power plant sites, Journal of Japan Association for Earthquake Engineering, 3, 2–21, 2013 (in Japanese).
Suppasri, A., Koshimura, S., and Imamura, F.: Developing tsunami fragility curves based on the satellite remote sensing and the numerical modeling of the 2004 Indian Ocean tsunami in Thailand, Nat. Hazards Earth Syst. Sci., 11, 173–189, https://doi.org/10.5194/nhess-11-173-2011, 2011.
Suppasri, A., Koshimura, S., Imai, K., Mas, E., Gokon, H., Muhari, A., and Imamura, F.: Damage characteristic and field survey of the 2011 Great East Japan tsunami in Miyagi prefecture, Coast. Eng. J., 54, 1250005, https://doi.org/10.1142/S0578563412500052, 2012.
Suppasri, A., Mas, E., Charvet, I., Gunasekera, R., Imai, K., Fukutani, Y., Abe, Y., and Imamura, F.: Building damage characteristics based on surveyed data and fragility curves of the 2011 Great East Japan tsunami, Nat. Hazards, 66, 319–341, 2013.
Suppasri, A., Muhari, A., Futami, T., Imamura, F., and Shuto, N.: Loss functions of small marine vessels based on surveyed data and numerical simulation of the 2011 Great East Japan tsunami, J. Waterway, Port, Coastal, Ocean Eng., 140, 04014018, https://doi.org/10.1061/(ASCE)WW.1943-5460.0000244, 2014.
Suppasri, A., Latcharote, P., Bricker, J. D., Leelawat, N., Hayashi, A., Yamashita, K., Makinoshima, F., Roeber, V., and Imamura, F.: Improvement of tsunami countermeasures based on lessons from the 2011 great east japan earthquake and tsunami -Situation after five years-, Coast. Eng. J., 58, 1640011, https://doi.org/10.1142/S0578563416400118, 2016.
Suppasri, A., Leelawat, N., Latcharote, P., Roeber, V., Yamashita, K., Hayashi, A., Ohira, H., Fukui, K., Hisamatsu, A., Nguyen, D., and Imamura, F.: The 2016 Fukushima Earthquake and Tsunami: Preliminary research and new considerations for tsunami disaster risk reduction, Int. J. Disast. Risk Re., 21, 323–330, 2017.
Tsujimoto, R., Terauchi, G., Sasaki, H., Sakamoto, S. X., Sawayama, S., Sasa S., Yagi, H., and Komatsu, T.: Damage to seagrass and seaweed beds in Matsushima Bay, Japan, caused by the huge tsunami of the Great East Japan Earthquake on 11 March 2011, Int. J. Remote Sens., 37, 5843–5863, 2016.
Yamashita, K., Sugawara, D., Takahashi, T., and Imamura, F.: Influence of sediment transport on seaweed bed dissipation in Shizugawa Bay, Miyagi Prefecture in the 2011 Great East Japan Earthquake, Abstract of the 2015 Annual Seminar of Tohoku Disaster Science Research, 2016 (in Japanese).