the Creative Commons Attribution 4.0 License.
the Creative Commons Attribution 4.0 License.
 | 11 Feb 2025
The record-breaking precipitation event of December 2022 in Portugal
Tiago M. Ferreira
Ricardo M. Trigo
Tomás H. Gaspar
Joaquim G. Pinto
Alexandre M. Ramos
Extreme precipitation events (EPEs) potentially present an enormous societal risk and often lead to major human and economic impacts. In the mid-latitudes, such EPEs are often triggered by intense extratropical cyclones and their associated frontal systems. Over the last decade, several studies have shown the important and specific role played by atmospheric rivers (ARs) in the occurrence of EPEs in western Europe, particularly in the Iberia Peninsula. In this study we analyze the all-time 24 h record-breaking precipitation (120.3 mm) recorded in the historical Dom Luiz Observatory (records since 1863) in Lisbon, Portugal, between 12 and 13 December 2022. A synoptic evaluation of surface and upper-level fields from 5 to 14 December is performed using the European Centre for Medium-Range Forecasts (ECMWF) Reanalysis v5 (ERA5). The week before the EPE, there was a combined effect of a large-scale sea-level-pressure (SLP) gradient resembling the North Atlantic Oscillation (NAO) negative phase, a southerly position of the jet stream, and above-normal positive sea surface temperature (SST) anomalies over the North Atlantic that led to the development of several low-pressure systems at relatively low latitudes, all traveling along the same mean path towards western Europe. The atmospheric river associated with this event was first detected late on 10 December, associated with a deep extratropical cyclone. The combination of high integrated vapor transport (and moisture inflow by the warm conveyor belt), with a dynamical component characterized by a suitable uplift motion allowed the system to evolve and maintain its AR characteristics for 72 h. The extratropical cyclone and associated AR moved northeast towards Iberia, making landfall in Portugal on 12 December as an extreme AR event, leading to the 24 h record-breaking precipitation event.
- Article
(10914 KB) - Full-text XML
-
Supplement
(2295 KB) - BibTeX
- EndNote


In western Iberia, extreme precipitation events (EPEs) occur primarily in the winter half year and can lead to landslides and flooding that thus have major socioeconomic impacts (e.g., Liberato et al., 2012; Trigo et al., 2016). These events have been widely studied in the last decade throughout western Europe (Ramos et al., 2015; Stohl et al., 2008; Lavers et al., 2011). On the synoptic scale, most of these EPEs are associated with the passage of intense extratropical storms, their associated frontal systems, and sometimes the so-called atmospheric rivers (Dettinger et al., 2015). Extratropical cyclones (ETCs) are mid-latitude synoptic low-pressure systems that develop primarily over the large ocean basins thanks to a range of physical processes, primarily baroclinicity and latent heat release (e.g., Pinto et al., 2009; Schultz et al., 2019). These systems are largely responsible for the poleward transport of heat and moisture in the climate system (Peixoto and Oort, 1992) and have a major impact on regional temperature, precipitation, and cloudiness (e.g., Colle et al., 2015; Hawcroft et al., 2018). They are frequently responsible for extreme weather conditions, such as precipitation and wind extremes (Fink et al., 2009), which cause wind damage and flooding in either coastal or inland areas, playing an important role in the hydrological cycle.
According to the AMS Glossary of Meteorology (Ralph et al., 2018), an atmospheric river (AR) corresponds to a “long, narrow, and transient corridor of strong horizontal water vapor transport that is typically associated with a low-level jet ahead of the cold front of an ETC”. They are usually identified using a threshold of vertically integrated vapor transport and are typically located in regions where their dynamical and thermodynamical components are relatively large throughout the depth of the lower troposphere (Dacre et al., 2019). The abovementioned “low-level jet ahead of the cold front” is typically associated with the inflow of the warm conveyor belt (WCB) of an ETC (e.g., Dacre et al., 2015, 2019). Their moisture contents can either be of tropical origin (sometimes connected to tropical moisture exports, e.g., Knippertz et al., 2013) or result from local convergence along the AR's path, the latter sometimes being associated with the presence of an anticyclone on its southeast side that enhances evaporation (Guo et al., 2020; Ralph et al., 2018).
The large amounts of moisture embedded in ARs may support the development of intense convective storms in the maritime, (sub-)tropical air masses that often lead to extreme precipitation and flooding when interacting with the mountainous western coasts of North America and Europe (Dacre et al., 2015; Lee et al., 2022; Guo et al., 2020). However, it is important to stress that not all ARs are associated with detrimental impacts. In fact, ARs impacts can be, in some cases, beneficial by providing water and, in some cases, ending drought conditions (e.g., Dettinger, 2013). Furthermore, on the western coast of the Iberian Peninsula, the dynamical component is also an important factor due to the interaction between the ARs and extratropical cyclones, in particular their WCBs. This branch of an ETC consists of an uplift motion in which the warm and moist air typically ascends by at least 600 hPa in 48 h from the boundary layer to the upper troposphere, ahead of the cyclone's cold front (Blanchard et al., 2020; Martínez-Alvarado et al., 2014). In general, the horizontal component of the trajectories is almost parallel to the cold front, either running on the warm side of the surface cold front or riding up the frontal surface. This is the primary cloud- and precipitation-producing flow within an ETC as it originates in the cyclone's warm sector, resulting in the transport of both latent and sensible heat. Additionally, the outflow of the WCB can split into two flows, one branch that turns cyclonically around the poleward side of the cyclone center and the other branch that turns anticyclonically, potentially leading to modifications in the cyclone intensity for the former and upper-level large-scale flow for the latter (Catto et al., 2015; Martínez-Alvarado et al., 2014; Joos et al., 2023).
The coasts of western Europe are exposed to westerly flow, whose intensity is largely controlled by the pressure gradient between the sub-tropical (Azores) high and the sub-polar (Icelandic) low. This corresponds to the canonical North Atlantic Oscillation (NAO) pattern (Wanner et al., 2001), which has variability on different timescales (Pinto and Raible, 2012). Embedded in the westerly flow are ETCs and sometimes ARs, which contribute to the advection of high moisture contents towards western Europe. Every year the western coast of Portugal is struck by ARs (e.g., Ramos et al., 2015; Eiras-Barca et al., 2018). According to Ramos et al. (2015), the top 6 % of the most intense precipitation events in the Lisbon area occurred in combination with persistent ARs lasting more than 12 h, with a mean monthly occurrence of two ARs per winter month (October–March), from 1979 to 2012. In addition, Hay and Williams (2023) state that ARs deliver 20 %–30 % of annual precipitation in western Europe and the western USA. At the Dom Luiz Observatory (IDL) in Lisbon, continuous rainfall measurements have existed since December 1863. This makes it the only station with a nearly 160-year-long record of daily data in Portugal. Daily precipitation totals at Portuguese stations are calculated between 09:00 UTC of the previous day and 09:00 UTC of the current day. This station is particularly important in defining the maximum registered precipitation in the area and in inferring the evolution of rainfall affecting western Iberia. The top three maximum-precipitation events measured at IDL from 1863 to 2022 (excluding the EPE analyzed in this study) were on (1) 18 February 2008, with a precipitation value of 118.4 mm (Fragoso et al., 2010); (2) 5 December 1876, with a value of 110.7 mm (Trigo et al., 2014); and (3) 30 January 2004, with a value of 101.2 mm. Another intense precipitation event occurred in Lisbon on 24 October 2013, with a precipitation value of 102 mm in 24 h.
In this work, we focus on the events in December 2022, in particular on the EPE that took place on 12–13 December and strongly affected the Lisbon area. This event led to a 24 h precipitation value of 134.6 mm, measured between 12 December at 15:00 UTC and 13 December at 15:00 UTC (Dias, 2022). According to IPMA (2023, Portuguese Institute for Sea and Atmosphere), a value of 120.3 mm was measured at IDL between 12 December at 09:00 UTC and 13 December at 09:00 UTC, surpassing the previous highest value on 18 February 2008. This event triggered intense flooding in several areas of the Lisbon district that led the Portuguese civil authority to report over 150 incidents (Davies, 2023), including floods in several downtown areas, a damaged hospital, and flooding in several parts of the airport, resulting in EUR 185 million of damage (Lusa, 2023). The human impacts were likely minimized by the issuing of a red alert by the IPMA, but still several people had to be rescued or evacuated from the affected areas. Moreover, the intense precipitation was also registered in the Spanish region of Extremadura and in Madrid, where flood damage was also reported and over 200 incidents were responded to by the emergency services (Davies, 2023). According to AEMET (the Spanish State Meteorological Agency), the station at Navalvillar de Ibor in Cáceres Province of Extremadura recorded 120.4 mm of precipitation in 24 h on 13 December (Davies, 2023).
In this work we aim to provide a comprehensive synoptic characterization of the atmospheric circulation observed prior to and during this EPE (between 5 and 14 December), as well as of the associated atmospheric river. Specifically, the aims of this study are threefold: (1) to analyze the spatial distribution of precipitation measurements from 114 Portuguese meteorological stations, (2) to characterize the AR life cycle and associated mechanisms leading to the extreme precipitation values, and (3) to analyze the preconditions associated with the cyclone and AR formation and their development. Section 2 provides a brief description of the data and methodology used to detect ARs and analyze their atmospheric environment. Section 3 is devoted to the description of the spatial distribution of precipitation as well as the new maximum registered at the IDL station. Section 4 describes the large-scale atmospheric conditions throughout the North Atlantic from 5 to 11 December. Section 5 presents the analysis of the AR's life cycle, between the first and last time steps in which the detection algorithm defined it as an AR and the role played by the large-scale atmospheric circulation and the cyclone. Finally, a summary and conclusions are given in Sect. 6.
2.1 Meteorological data
The large-scale data used in this study are the ECMWF (European Centre for Medium-Range Weather Forecasts) Reanalysis v5 (ERA5; Hersbach et al., 2020). Several fields were extracted both from the surface and at specific atmospheric pressure levels. The former includes the mean sea level pressure (SLP) and the sea surface temperature (SST). The latter include the (1) zonal and meridional components of the vertically integrated water vapor transport (considering the entire atmospheric column), (2) 850 and 500 hPa geopotential height, (3) 200 and 850 hPa divergence, (4) 500 hPa temperature, (5) 250 hPa wind, and (6) total column water vapor. All these fields were obtained with a 0.25° latitude–longitude spatial resolution and a 6-hourly temporal resolution. The vertically integrated water vapor transport (IVT) and the integrated water vapor (IWV) correspond to the following metrics:
with
and
where g is the gravitational acceleration, q is the specific humidity, ps is surface pressure, p is maximum pressure, and u and v are the zonal and meridional wind components (Lavers et al., 2012). This field is internally computed by the ECMWF model, from the surface to the top of the atmosphere (1 hPa), considering all 37 pressure levels available in ERA5. While it is widely known that the upper levels of the atmosphere hold very little humidity, the use of the entire atmospheric column is mostly due to computational convenience. Instead of an additional computation of both IVT and IWV, ERA5 provides the variables “total column water vapor” (IWV), “vertical integral of eastward water vapor flux” (IVTu), and “vertical integral of northward water vapor flux” (IVTv) as a vertically integrated field considering all available atmospheric levels.
Data on the inflow, outflow, and ascent of moisture within the warm conveyor belt were provided by KIT (Karlsruhe Institute of Technology). The method, developed by Quinting and Grams (2022), uses convolutional neural networks to predict the footprints of the WCB inflow, ascent, and outflow stages by obtaining conditional probabilities of WCB occurrences from predictors derived from temperature, geopotential height, specific humidity, and horizontal wind components. The WCB air masses originate from the boundary layer in the warm sector of ETCs (WCB inflow, below 800 hPa), ascend across the cyclones' warm front (WCB ascent, at least 600 hPa ascent in 48 h), and reach the upper troposphere (WCB outflow, above 400 hPa).
Daily precipitation measurements from the historical Dom Luiz Observatory (IDL) in Lisbon from December 1863 to February 2020 were used, allowing for an objective comparison between the different EPE events. These data include only measurements from the classical measurements (performed by an observer). Since March 2020, partially as a result of the Covid-19 pandemic, only the automatic station has been operational. Data from 114 automated stations over mainland Portugal were provided by IPMA, with a 10 min temporal resolution. These were used to compute the daily accumulated precipitation between 09:00 UTC on 12 December 2022 and 09:00 UTC on 13 December 2022 in order to be compatible with the long-term IDL's classical observations since 1863. To extend the assessment of this EPE to the entire Portuguese territory, we employ an inverse distance weighting approach. This method, also known as inverse distance-based weighted interpolation, uses a weighted mean of nearby observations to estimate unknown values. In this case, values are estimated within the Portuguese territory.
2.2 Atmospheric river detection method
For the detection of atmospheric river events, we have implemented and adapted the global atmospheric river tracking method developed by Xu et al. (2020) and widely used in recent years (e.g., Fernández-Alvarez et al., 2023; Khouakhi et al., 2022). The detection algorithm is based on thresholds at the spatiotemporal scale of ARs and is independent of the IVT thresholds.
This method searches for ARs on an anomaly field that is calculated at each time step. For each IVT field, the algorithm replaces each grid point with the minimum value that surrounds it; i.e., it searches for the lowest value within the eight grid points around it. This “reconstructed” field is then subtracted from the original IVT, and the result (the anomaly) is used to detect AR objects. Afterwards, a threshold of 300 kg m−1 s−1 is applied to the anomaly field, and for each region the standard criteria for AR detection (length ≥ 2000 km; width < 1000 km; length width ratio > 2) are implemented. More details on this method can be found in Xu et al. (2020). Additionally, in order to exclude tropical-cyclone features from the analysis, we apply both a circularity criterion with a maximum value of 0.5 (following the work of Mahto et al., 2023) and a minimum value of 1000 km to the distance between the first and last points of the AR axis.
The month of December 2022 was classified by IPMA as a very wet month in terms of precipitation. According to their monthly summary report (IPMA, 2023), the total monthly average precipitation in Portugal has a value of 250.4 mm (corresponding to 174 % of the mean value). This was the second highest value since 2000 (311.5 mm in December 2000). In Fig. 1 we present the station-based precipitation measurements. At the IDL station, classical in situ precipitation measurements are available from December 1863 to February 2020. Daily precipitation records obtained at classical stations for any given day n correspond to the precipitation registered between 09:00 UTC of day n−1 and 09:00 UTC of day n. In Fig. 1a, we present the top five peak values measured up to 2020 in a dark-red color . These include the four events already mentioned in the Introduction and also the November 1983 episode, when a value of 95.6 mm was measured. Both the 95th (horizontal green line) and the 99th (horizontal purple line) percentiles were added, representing values of 89.93 and 106.09 mm, respectively. All these top five events are above the 95th percentile, but only December 1876, February 2008, and December 2022 are above the 99th percentile, confirming the exceptional rainfall events that took place on these days.
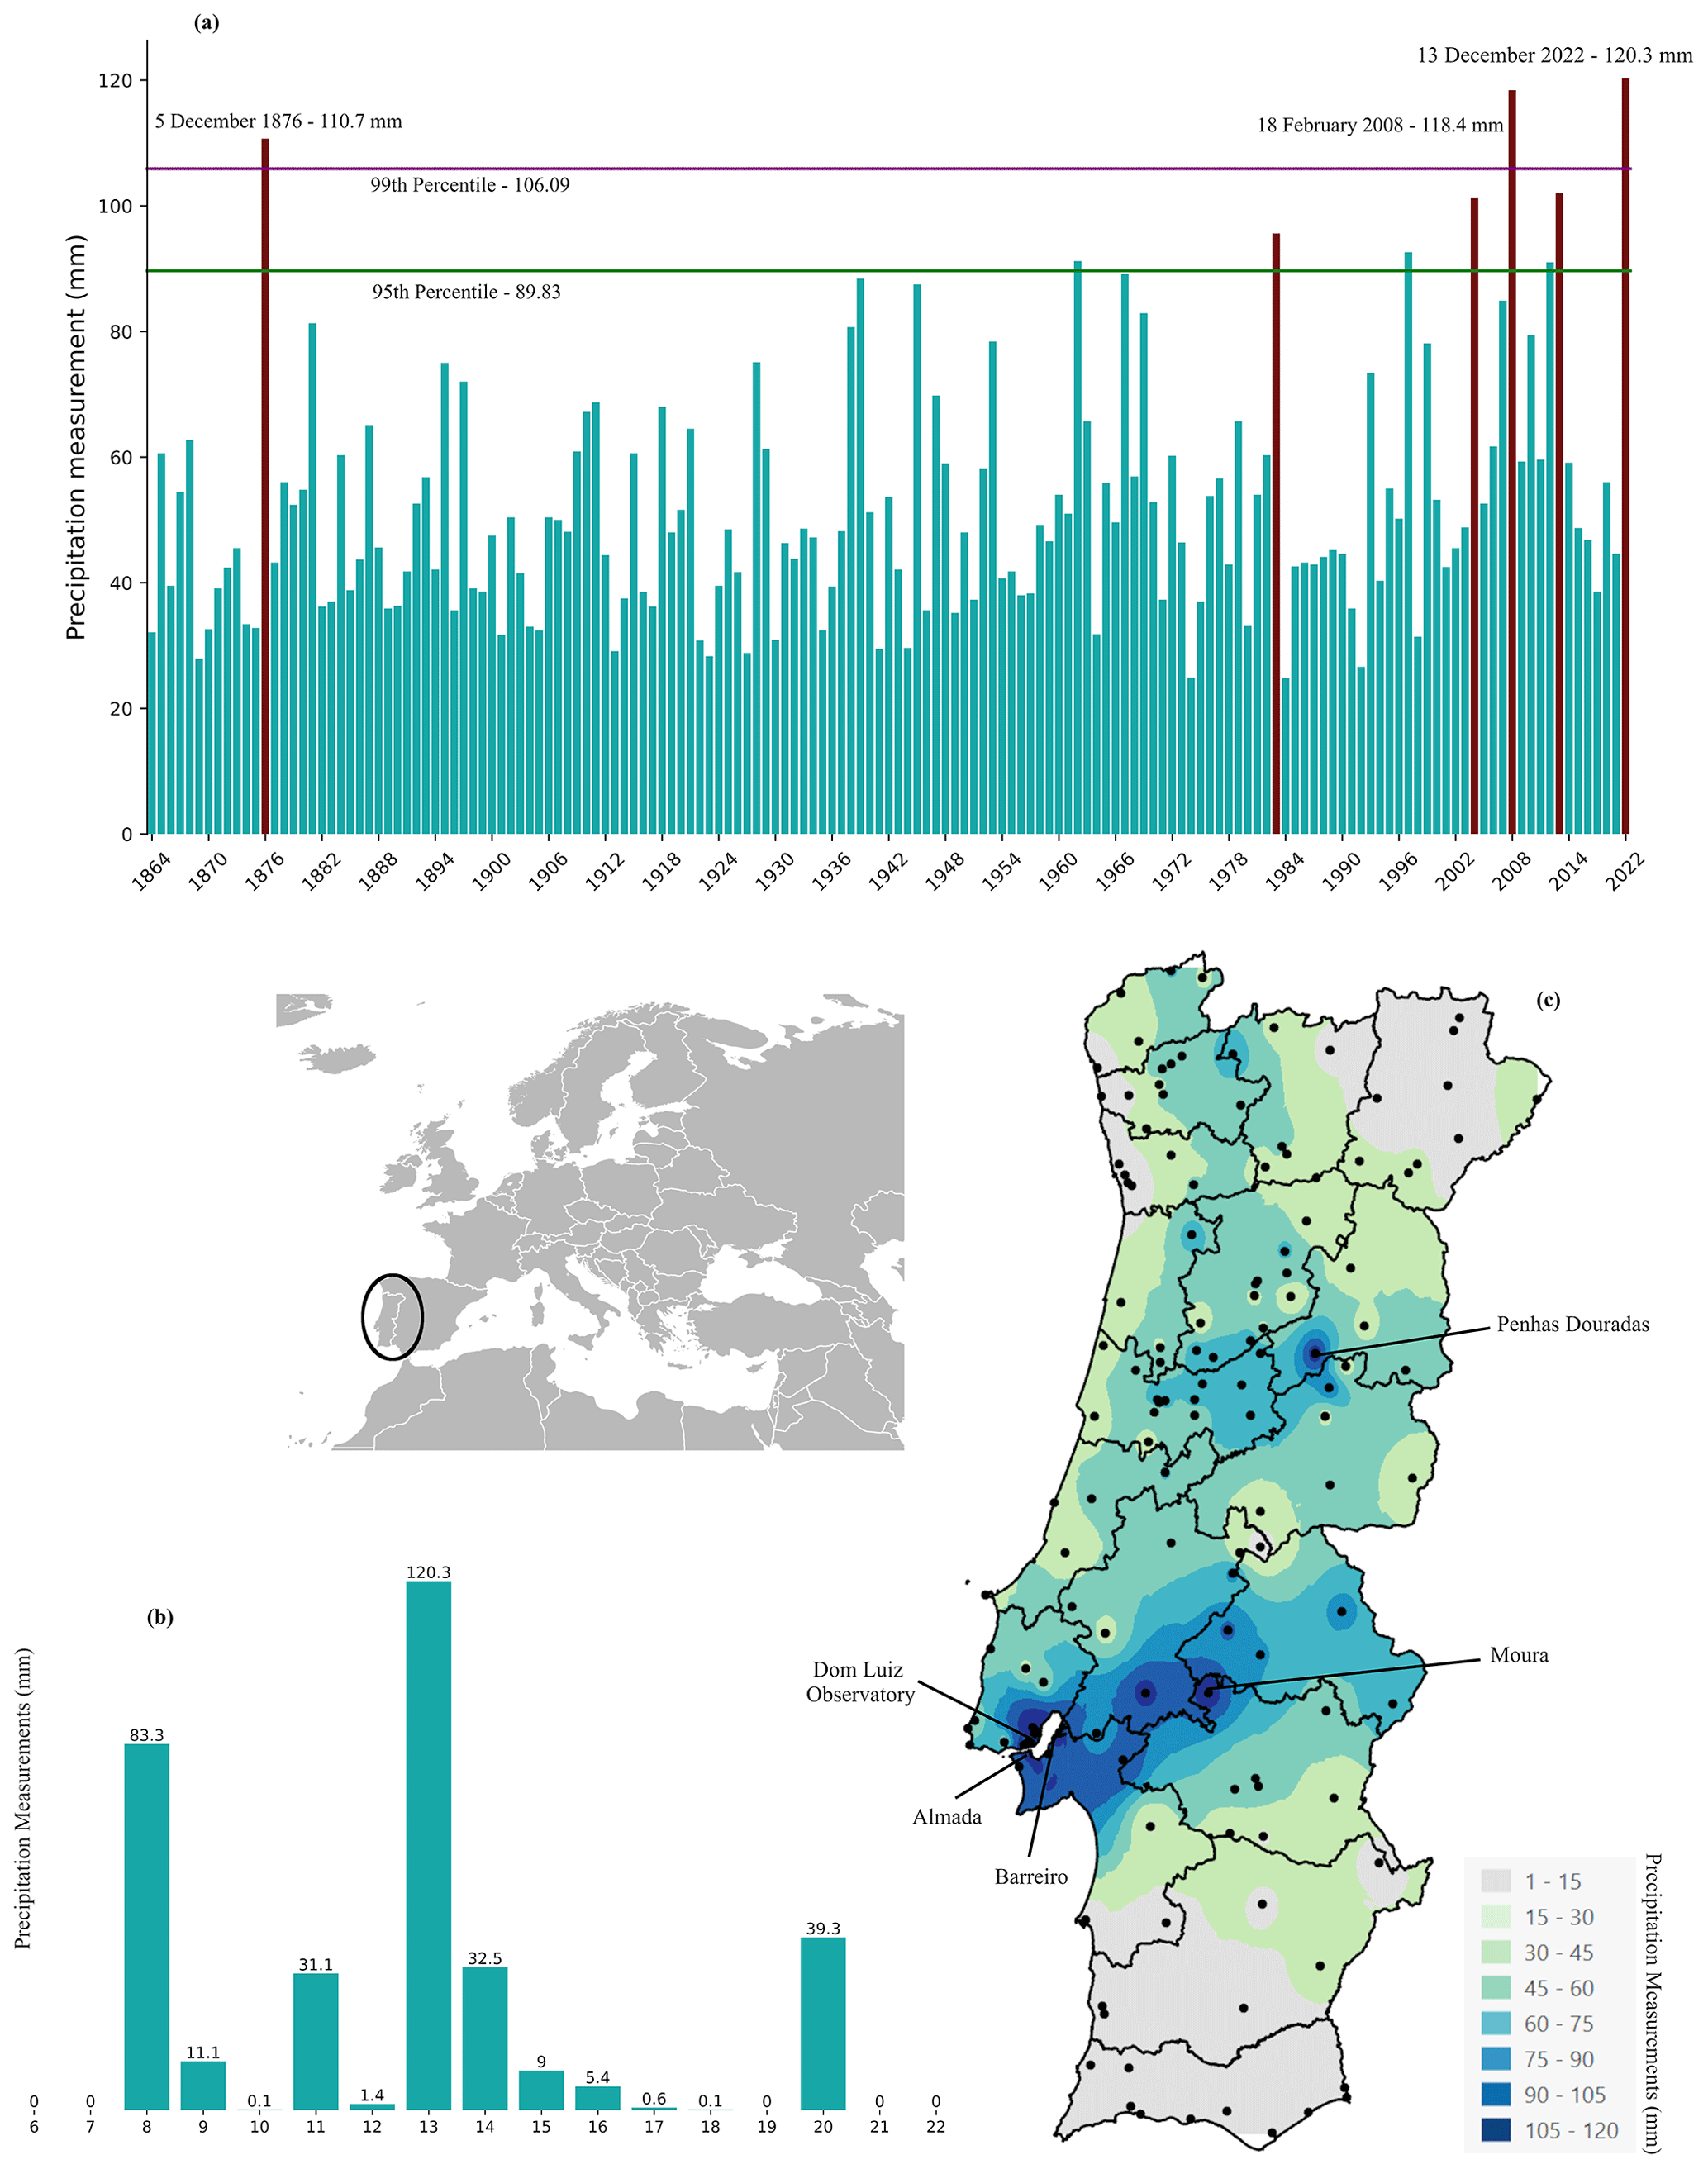
Figure 1Station-based precipitation measurements. (a) Dom Luiz Observatory's yearly maximum precipitation measurements from 1863 to 2020. The green (purple) horizontal line represents the 95th (99th) percentile. Dark-red bars represent the top five measurements. In addition, the 2022 record was added. (b) Precipitation measurements between 6 and 22 December at IDL. (c) Precipitation (in mm) from 114 Portuguese stations on 13 December (values calculated between 12 December, 09:00 UTC, and 13 December, 09:00 UTC). The black dots show the locations of the stations considered.
The rainfall amounts at IDL between 6 and 20 December 2022 are shown in Fig. 1b. The periods of 1–5 and 23–31 December show zero rainfall, and thus they were omitted. The intense rainfall had already struck the Lisbon district on 8 December, with a value of 83.3 mm (IPMA, 2023). In addition to this earlier event, three other moderate events occurred with rainfall values ranging between 30 and 40 mm, namely during 11, 14, and 20 December. However, all these moderate peaks were dwarfed by the rainfall value of 120.3 mm measured on 13 December, surpassing all the previous records presented in Fig. 1a. In Fig. 1c the spatial distribution of rainfall measurements throughout the Portuguese territory on 13 December is shown. Rainfall values above 60 mm were measured in Lisbon and the two closest districts. Most of the northern sector of Portugal experienced rainfall values between 15 and 45 mm, with a small region experiencing a rainfall amount higher than 75 mm.
According to the IPMA report (IPMA, 2023), one station (Penhas Douradas – Guarda) featured a rainfall amount of 99 mm, but it did not surpass previous records. In addition to the IDL station, several other meteorological stations registered the highest daily precipitation value to date, namely Barreiro (83.4 mm, surpassing 68.3 mm in December 1978), Almada (81.9 mm, surpassing 73.7 mm in January 2004), and Mora (98.8 mm, surpassing 81.5 mm in November 1983). Despite the absence of an official report of this event, flood damage and severe weather led to incidents in several parts of Portugal and Spain, with various Spanish areas registering precipitation values of at least 90 mm (Davies, 2022; AEMET, 2022).
The main characteristics of the large-scale atmospheric circulation, boundary conditions, and synoptic features leading to the extreme precipitation event on 13 December 2022 are now analyzed from 5 December onwards. The mean SLP anomaly, 250 hPa wind, 500 hPa geopotential height, and temperature from 5 to 11 December are presented in Fig. 2. A similar assessment was undertaken for the SST anomalies but for a slightly longer period (1 to 11 December). These different time frames of the two anomalies reside in the fact that the SST changes are much slower than changes in atmospheric conditions. The mean SLP anomaly relative to the reference to the 1980–2022 period and the 250 hPa wind (contour lines) are shown in Fig. 2a. Wind values higher than 30, 40, and 50 m s−1 are represented in green, light green, and yellow, respectively. During this period, the upper-level jet stream was located at a southerly location in the North Atlantic, with a direct trajectory towards the western coast of Iberia. The mean SLP anomaly shows a southwest–northeast dipole, with negative anomalies above western Europe and northeast Atlantic and positive anomalies above Greenland, in line with a negative NAO phase.
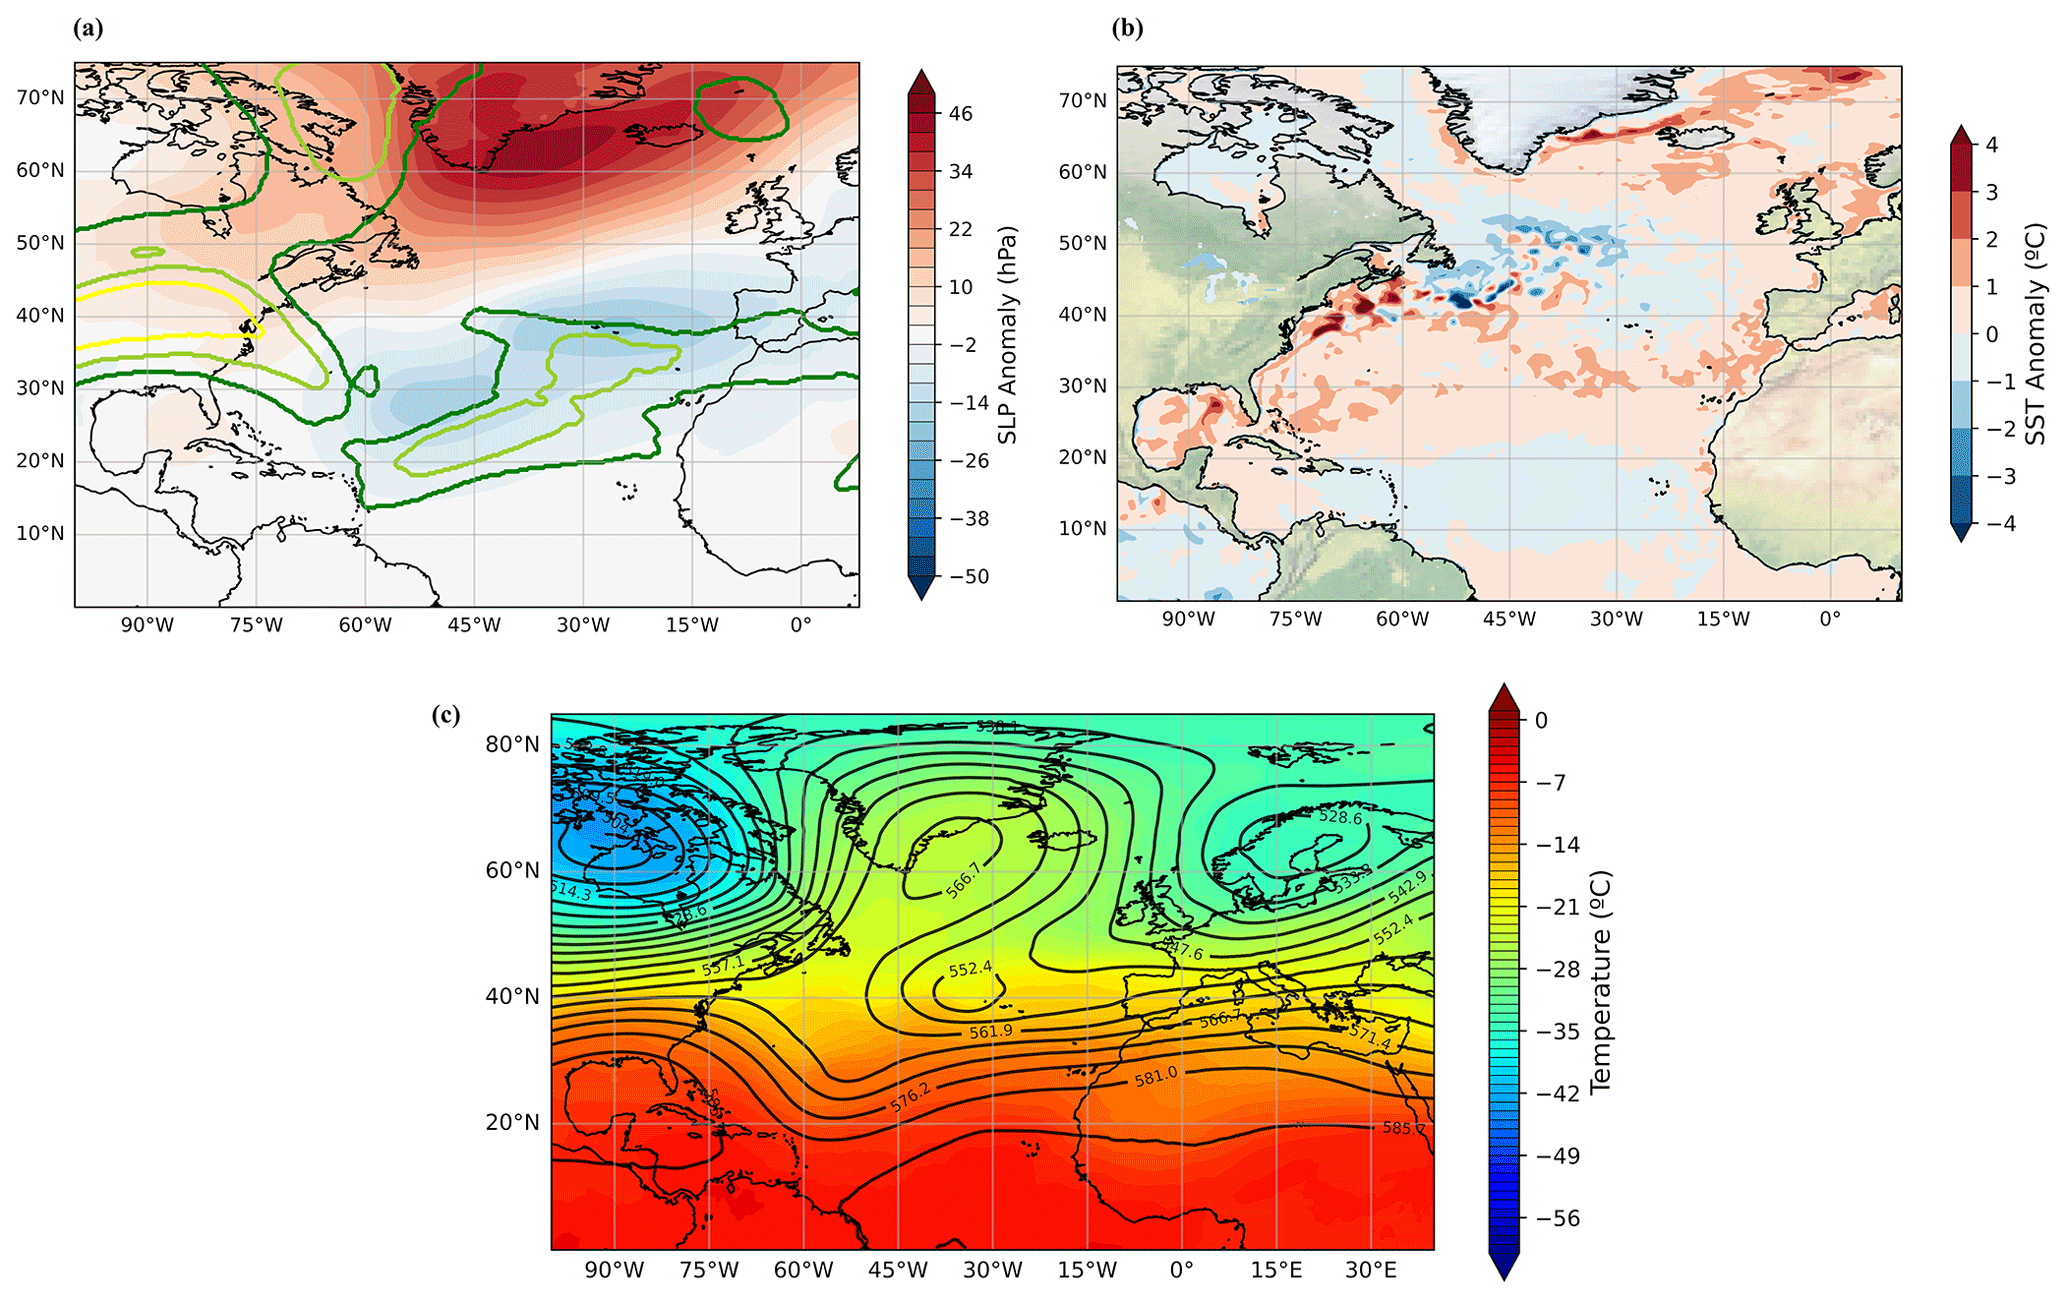
Figure 2(a) Mean SLP anomaly field (with reference to the 1980–2022 period) and mean 250 hPa wind (contour lines) (≥ 30 m s−1 – green; ≥ 40 m s−1 – light green; ≥ 50 m s−1 – yellow). (b) Mean SST anomaly field (with reference to the 1980–2022 period). (c) Mean 500 hPa geopotential height (black contours) and temperature (color scale). The SST anomaly is calculated for the period 1 to 11 December and the other variables for 5 to 11 December.
The mean SST anomalies for 1 to 11 December 2022 compared to the reference period of 1980–2022 are shown in Fig. 2b. In the latitudinal band between 20 and 40° N, the SST anomalies are positive, with coastal areas of north Africa and Iberia presenting an anomaly value of 1–2 °C. Additionally, the Gulf Stream presents anomalies above 2 °C. According to Climate Reanalyzer (https://climatereanalyzer.org/clim/sst_daily/, last access: 15 April 2024), SST anomalies for the entire North Atlantic were above 2 times the standard deviation, with a mean SST value of 21.5 °C (with reference to the 1982–2011 period). The mean 500 hPa geopotential height and temperature fields from 5 to 11 December are presented in Fig. 2c. There is a clear north–south dipole with temperatures higher than −20 °C predominantly located below the 40° N latitudinal band and lower temperatures above it. Following the same distribution, the geopotential height shows a clear Rex block pattern (Rex, 1951; Sousa et al., 2020) located at lower temperatures and a zonal flow equatorwards at higher temperatures. The combination of these two patterns led to the passage of several low-pressure systems on a southward track towards Iberia, leading to several rainfall events throughout December.
The evolution of the synoptic conditions over the North Atlantic sector on the days prior to the detection of the AR that led to the EPE is presented in Fig. 3. Several low-pressure systems were present over the North Atlantic on 6 December, one located near the Azores (C0 system) and another close to Puerto Rico (C1 system), each connected to a relatively intense IVT (above 500 kg m−1 s−1). As the C0 system moves towards the Iberian Peninsula, we suggest that the C1 system functioned as a conveyor, advecting moisture westwards towards the area of influence of C0 (Fig. 3a). The moisture advection feature extended from the western coast of north Africa to southern Iberia and was associated with intense precipitation through the Portuguese territory on 8 December (83.3 mm; see Fig. 1b), as reported by IPMA. Later that day, a small low-pressure system (C2 in Fig. 3b, 1011 hPa) formed in the northwest Atlantic, with relatively high convergence (divergence) at the low (high) levels (Figs. S2 and S3 in the Supplement, respectively), that contributed to the enhancement of moisture content in its warm sector, probably profiting from the high SST anomalies above the Gulf Stream (Fig. 2b) that intensified the evaporation rates. As the C0 system moved eastwards over central Europe and dissipated, the C1 cyclone, now located in central North Atlantic, tracked polewards with substantially higher IVT values, eventually higher than 1000 kg m−1 s−1, leading to the detection of an AR structure (AR0), involving both the region with high IVT and the C1 extratropical cyclone region (Fig. 3c). Both cyclones (C1 and C2) merged on 10 December at 06:00 UTC (Fig. 3d), and by 12:00 UTC a secondary IVT maximum could be identified (Fig. 3e region of interest, AR1 in Fig. 4). This AR was first detected on 10 December at 18:00 UTC (Fig. 4a) and is the one associated with the EPE in Iberia on 12–13 December 2022. In the next section, we will analyze in detail the further development of the ETC and the AR and how they led to the EPE.
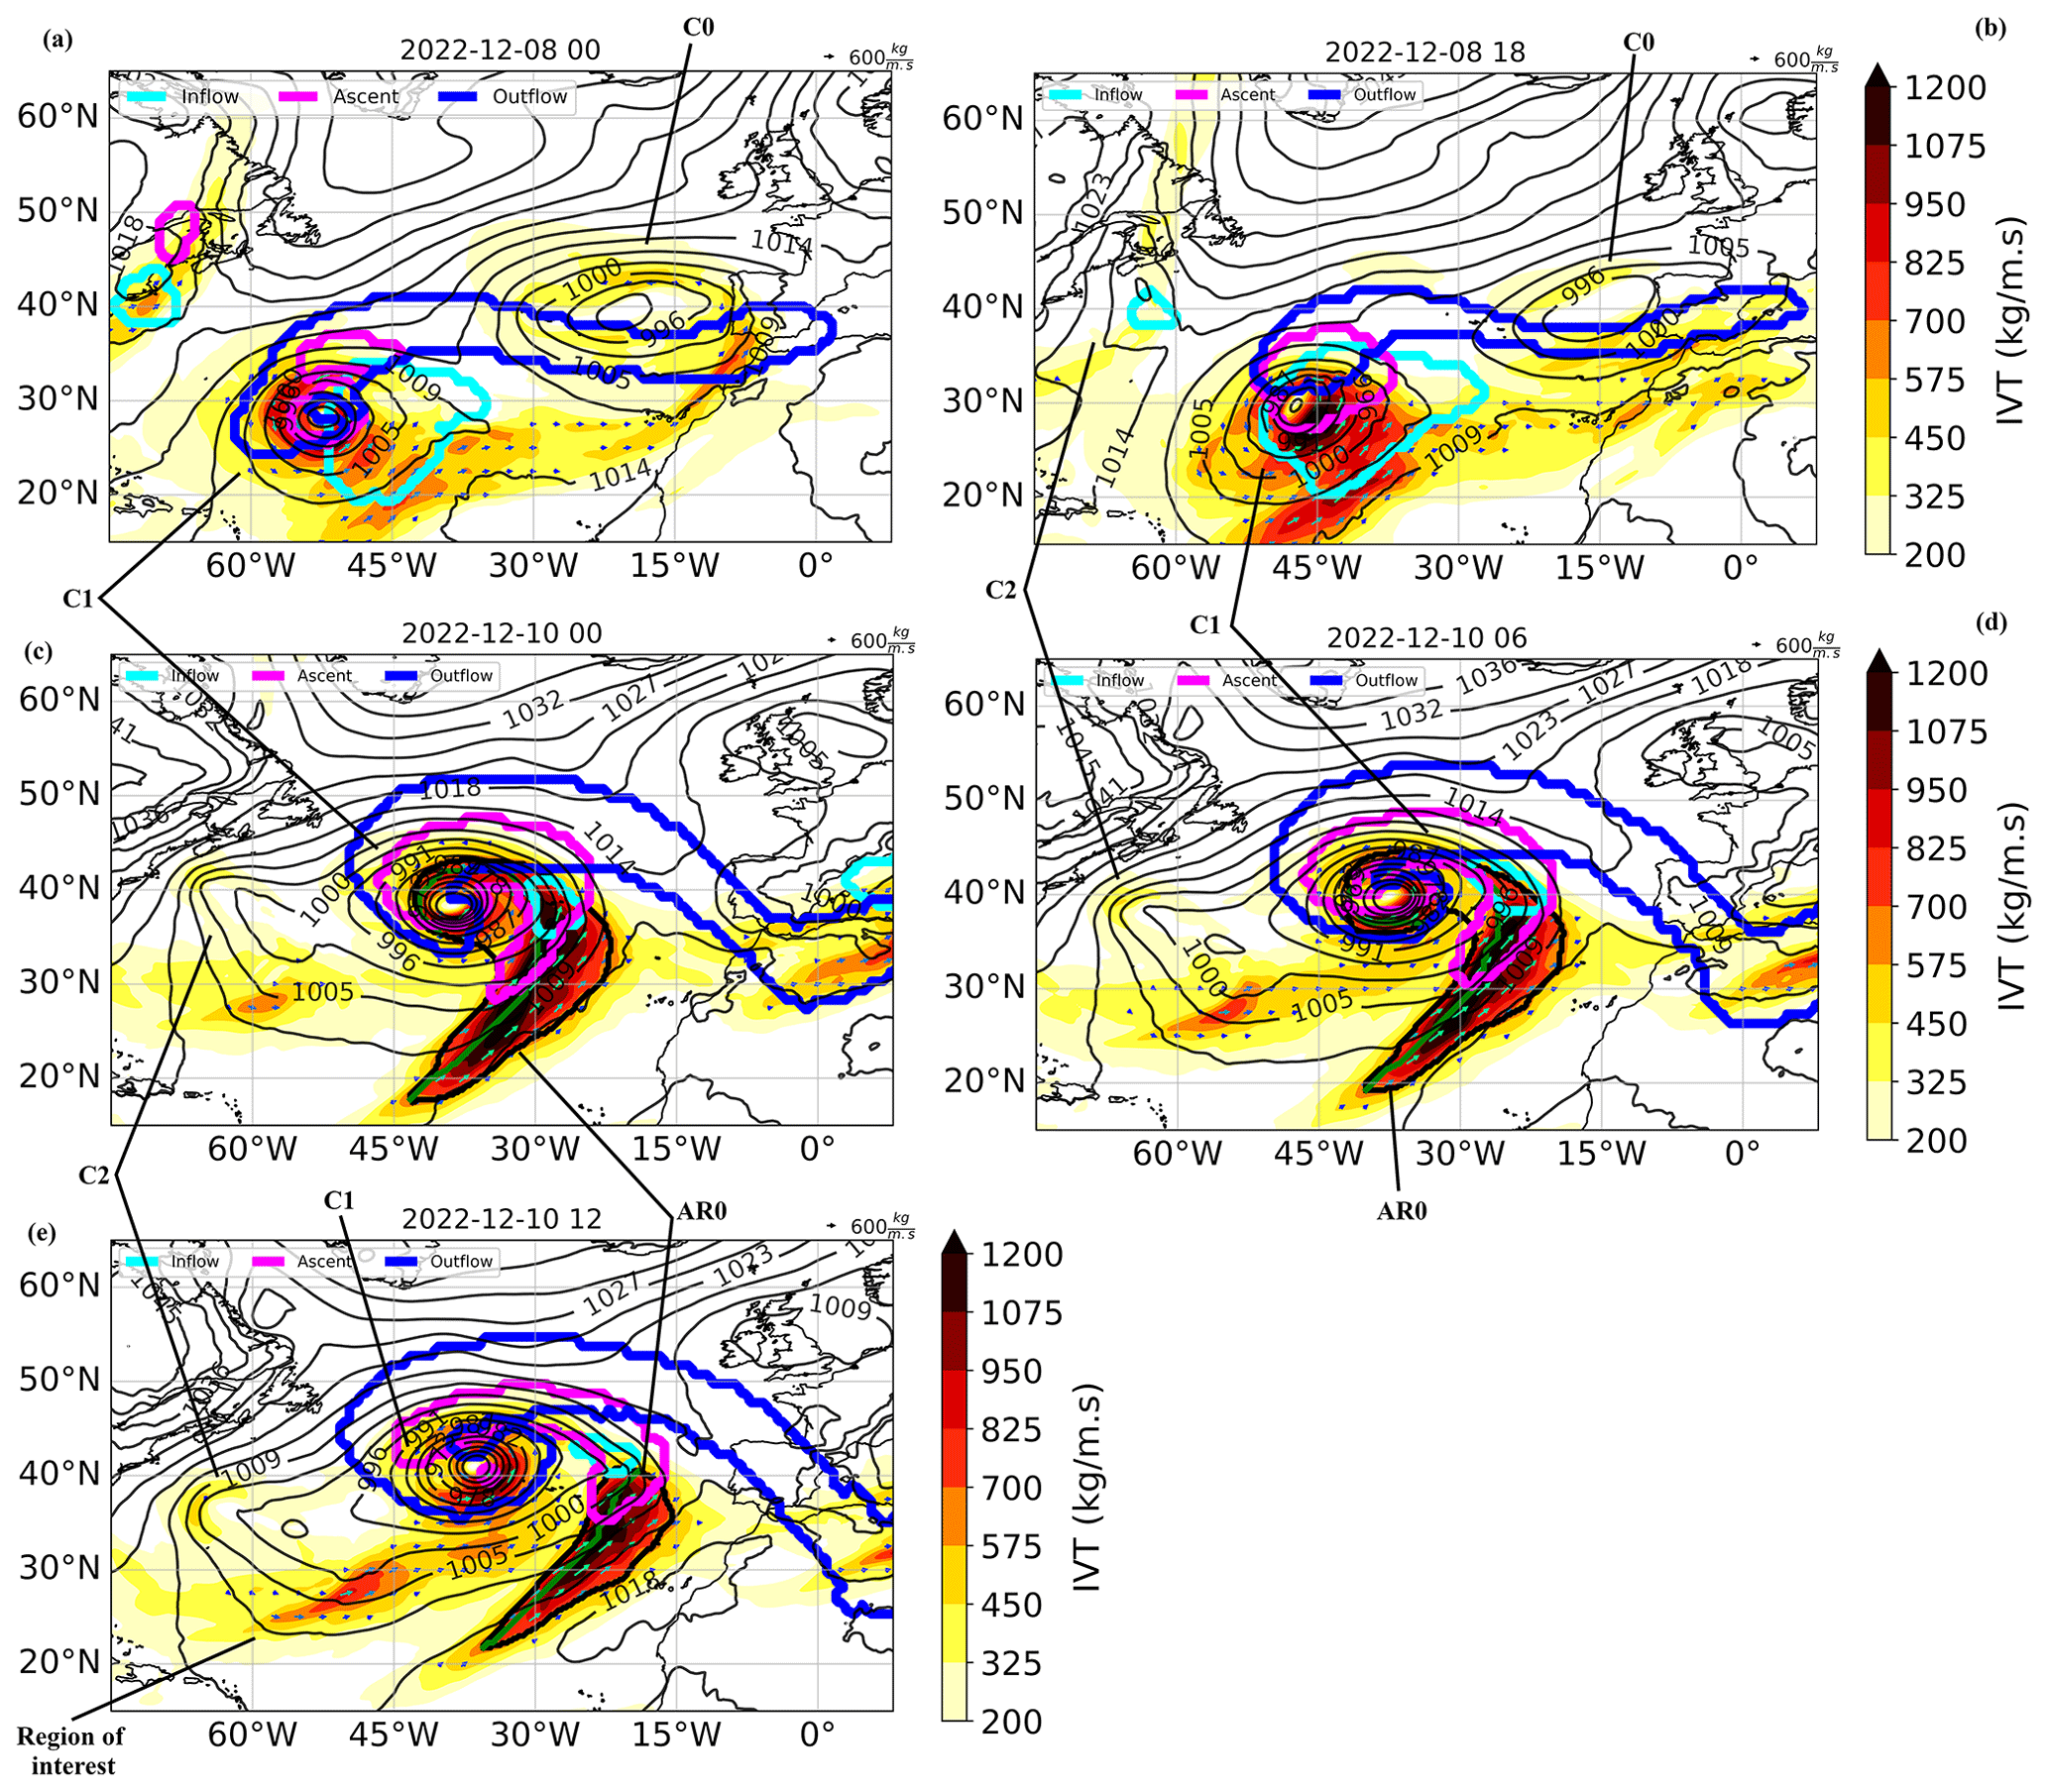
Figure 3Spatial patterns of the vertically integrated water vapor transport (IVT, shaded colors) and IVT vectors. The corresponding SLP fields are represented with black contour lines. The AR limits are represented with the bold black contour around the highest values of IVT, while the green line inside identifies its axis. Additionally, the WCB data are added, with the bolder contour lines representing inflow (light-blue contour), ascent (pink contour), and outflow (blue contour). C1 is the main extratropical cyclone, associated with the AR that led to the precipitation record; C2 is a small secondary low-pressure system that transported moisture from the Gulf Stream towards central North Atlantic before merging with C1 and developing the AR; and AR0 is an AR that occurred prior to the main AR but lost its AR characteristics before making landfall.
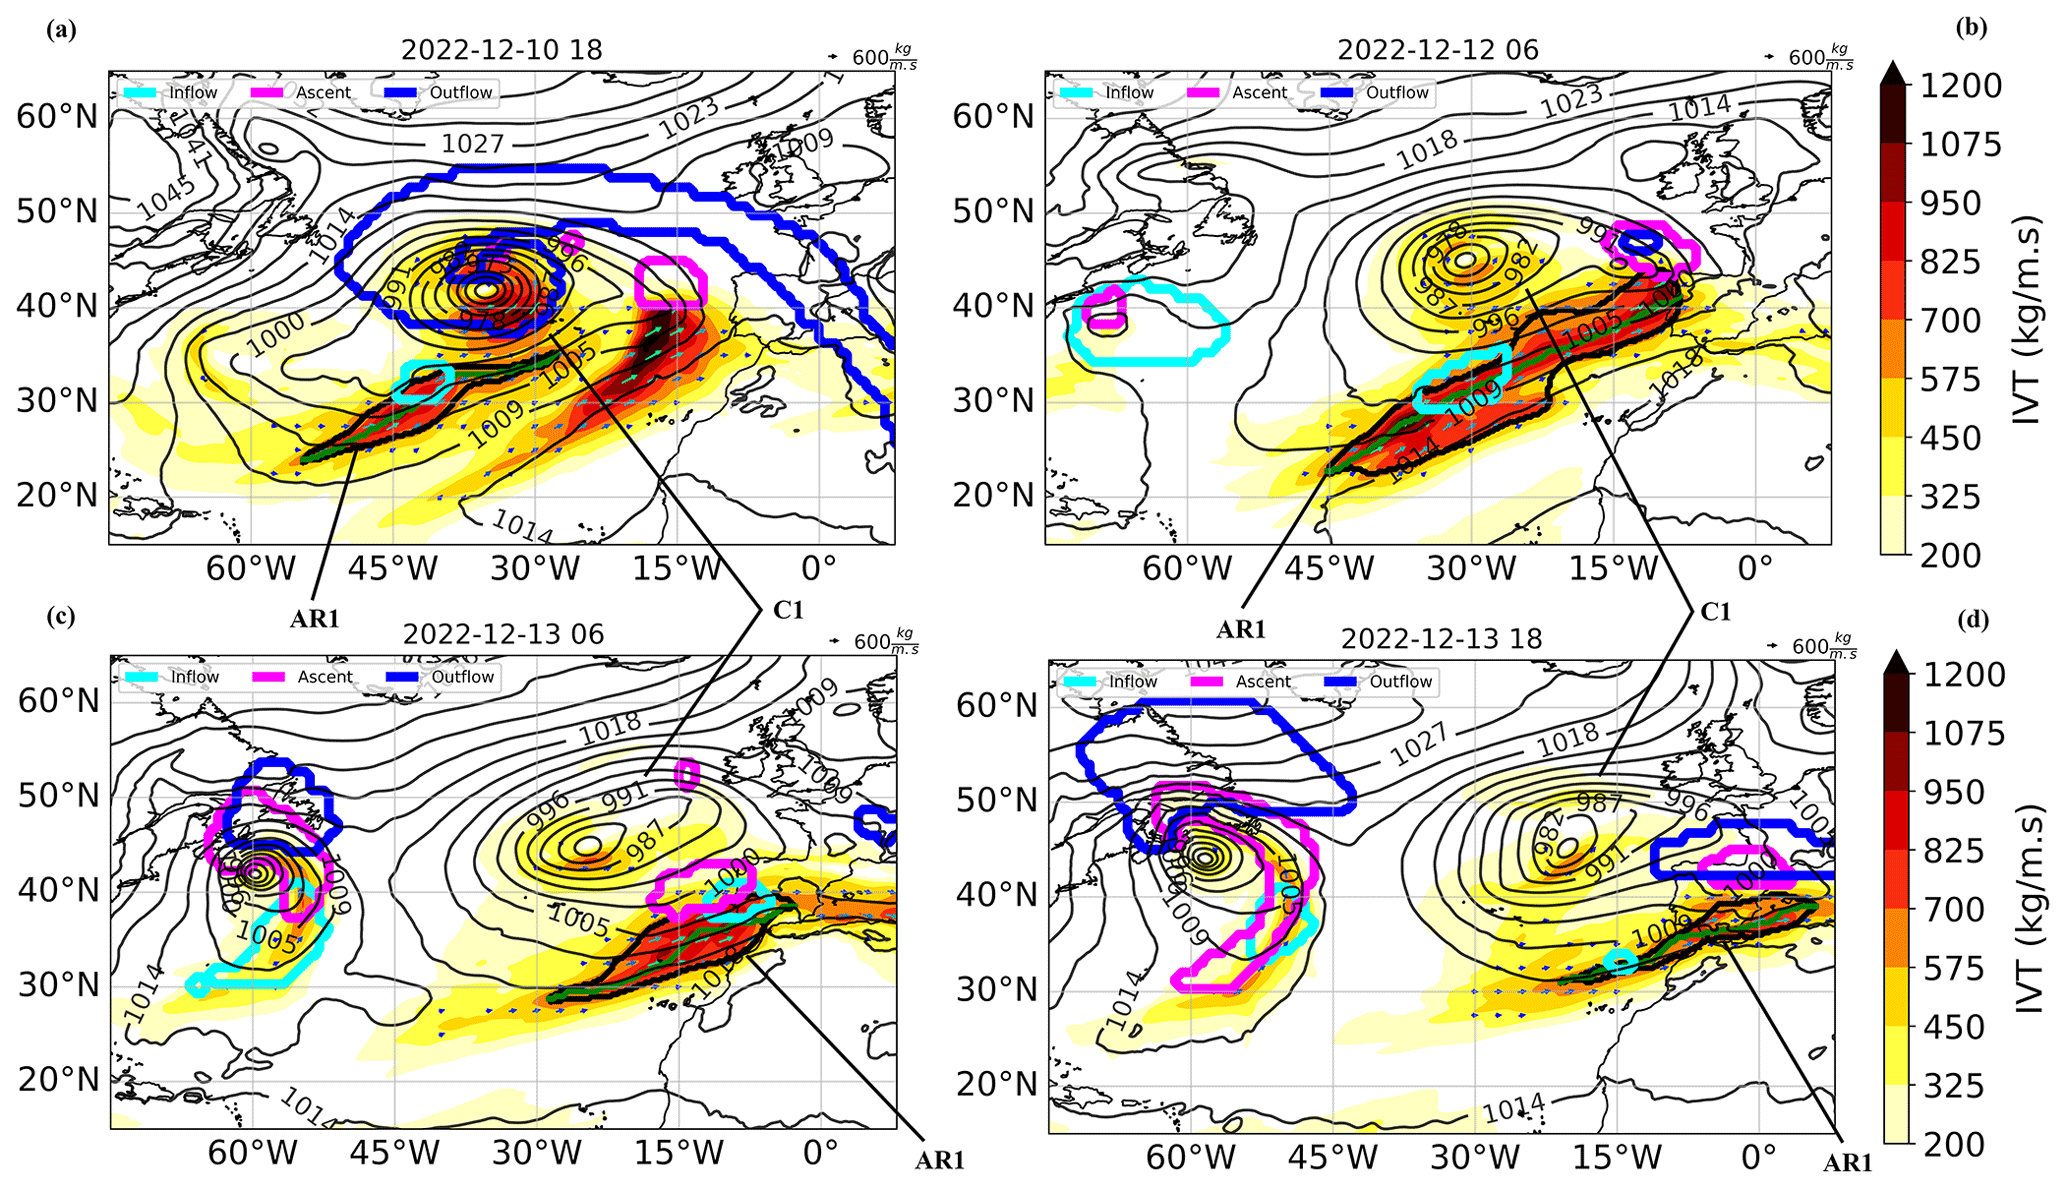
Figure 4Spatial patterns of the vertically integrated water vapor transport (IVT, shaded colors) and IVT vectors. The corresponding SLP fields are represented with black contour lines. The AR limits are represented with the bold black contour around the highest values of IVT, while the green line inside identifies its axis. Additionally, the WCB data are added, with the bolder contour lines representing inflow (light-blue contour), ascent (pink contour), and outflow (blue contour). C1 is the main extratropical cyclone, associated with the AR that led to the precipitation record.
In summary suitable large-scale conditions were available for the formation of both the ETC and the associated AR. These conditions include (1) a higher-than-usual SST in the region where the AR would obtain additional moisture, (2) the establishment of a clear Rex blocking structure that allowed the formation of several low-pressure systems, (3) the low-latitude location of the jet stream with a clear easterly trajectory spanning central North Atlantic towards Iberia, and (4) a negative NAO phase that has been shown to intensify the AR occurrence in southern Europe (Ramos et al., 2015).
The AR algorithm detected a total of four ARs that made landfall on western Iberia in December, namely on 12, 18, 22, and 30 December. The AR that made landfall on 12 December is analyzed in depth here as it was directly responsible for the highest 24 h value ever observed in Lisbon and also led to a significant precipitation fingerprint over a more continental area, leading to several record-breaking values outside Lisbon. According to our 6-hourly dataset, this AR event lasted for approximately 72 h, with a mean intensity ranging between 688 and 848 kg m−1 s−1 and a maximum IVT ranging between 947 and 1227 kg m−1 s−1, making it a category 4/5 (strong/extreme) AR event based on the Ralph et al. (2019) AR category scale and thus making landfall in Portugal as an extreme event. For the sake of simplicity, only four time steps are presented in this section's figures (Figs. 4, 5, and 6), namely the first time the algorithm detected the AR (panel a in each figure and panel b in Fig. 6), the time step in which the AR made landfall on the west coast of Iberia (panel b in Figs. 4 and 5, panels c and d in Fig. 6), 24 h later (panel c in Figs. 4 and 5, panels e and f in Fig. 6), and the last time step when the method detected the AR (panel d in Figs. 4 and 5, panels g and h in Fig. 6). Note that in Fig. 6, we represent two different patterns in each column, with the left column showing the four time steps of 250 hPa wind speed and high-level divergence pattern (Fig. 6a, c, e, and g) and the right column representing the corresponding Deutscher Wetterdienst (DWD) weather charts (Fig. 6b, d, f, and h).
The spatial distribution of IVT; corresponding IVT vectors; and associated configuration of AR, SLP field, and WCB phases are presented in Fig. 4. The AR was associated with a deep extratropical cyclone (merger of C1 and C2), with a minimum value of approximately 960 hPa on 10 December. A deep ETC leads to intensified cyclonic winds at the low levels that can intensify the moisture-driven IVT in the AR (e.g., Zhang et al., 2019; Eiras-Barca et al., 2018). At the AR's initial stage, first detected on 10 December at 18:00 UTC (Fig. 4a), a small region of moisture inflow was located at the center of the AR area (light-blue contour), intensifying the object's moisture content. After 36 h, the AR system made landfall on the western coast of Portugal (Fig. 4b) on 12 December at 06:00 UTC, with a mean IVT value of 792 kg m−1 s−1 and an inflow area located within the maximum IVT values, meaning that the system was still evolving through the convergence of moisture within its area, resulting from the WCB's inflow phase. This convergence of moisture along the AR path has been proved essential for maintaining the structure and ensuring the development of the system (Hu and Dominguez, 2019). The area located northwards of Iberia shows an uplift of moisture and a small outflow region, meaning that the associated dynamic uplift played a major role in achieving the high precipitation (Fig. 1c). On 13 December the AR had lost more than half of its spatial extent and it was mostly affecting central and southern Portugal, some regions of Spain, and the north of Africa (Fig. 4c), in agreement with precipitation recorded over continental Portugal (Fig. 1c). However, the IVT metric (considering both moisture and wind components) was still high, leading to intense rainfall over a few regions of Spain and incidents due to severe winds. At this time, there was an inflow of moisture around the southwest coast of Portugal and an ascent region just northwards of the AR. This ascent motion fits the divergent pattern well, showing a maximum just outside of central Portugal (Fig. 5c), a pattern that is related to the cyclone's mesoscale motion. The last step where the algorithm defined the object as an AR was on 13 December at 18:00 UTC (Fig. 4d), when the system was mostly affecting southern Spain and northern Africa. There was still an inflow of moisture just outside of the west coast of Africa, but there was a large ascent and outflow motion counteracting the inflow, leading to the dissipation of the system.
On the Portuguese coast, orographic uplift is less important than, for example, in California, where significant orography at the coast intensifies the precipitation occurrence (e.g., Lavers and Villarini, 2015). Thus, we analyze the features of the cyclone associated with the AR. With this aim, convergence fields are evaluated at two pressure levels, namely the convergence at low levels (850 hPa) and the divergence at high levels (200 hPa). Enhanced convergence at low levels co-located with enhanced divergence at upper levels indicated large-scale ascent, and these are optimal conditions for generating clouds and precipitation. Additionally, the jet stream and associated fronts are analyzed with the help of 250 hPa winds and the DWD weather charts, respectively. Figure 5 represents the IWV combined with the convergent pattern at low levels, and Fig. 6 represents the winds at 250 hPa combined with the divergent pattern at high levels (left column) and the meteorological weather charts (right column).
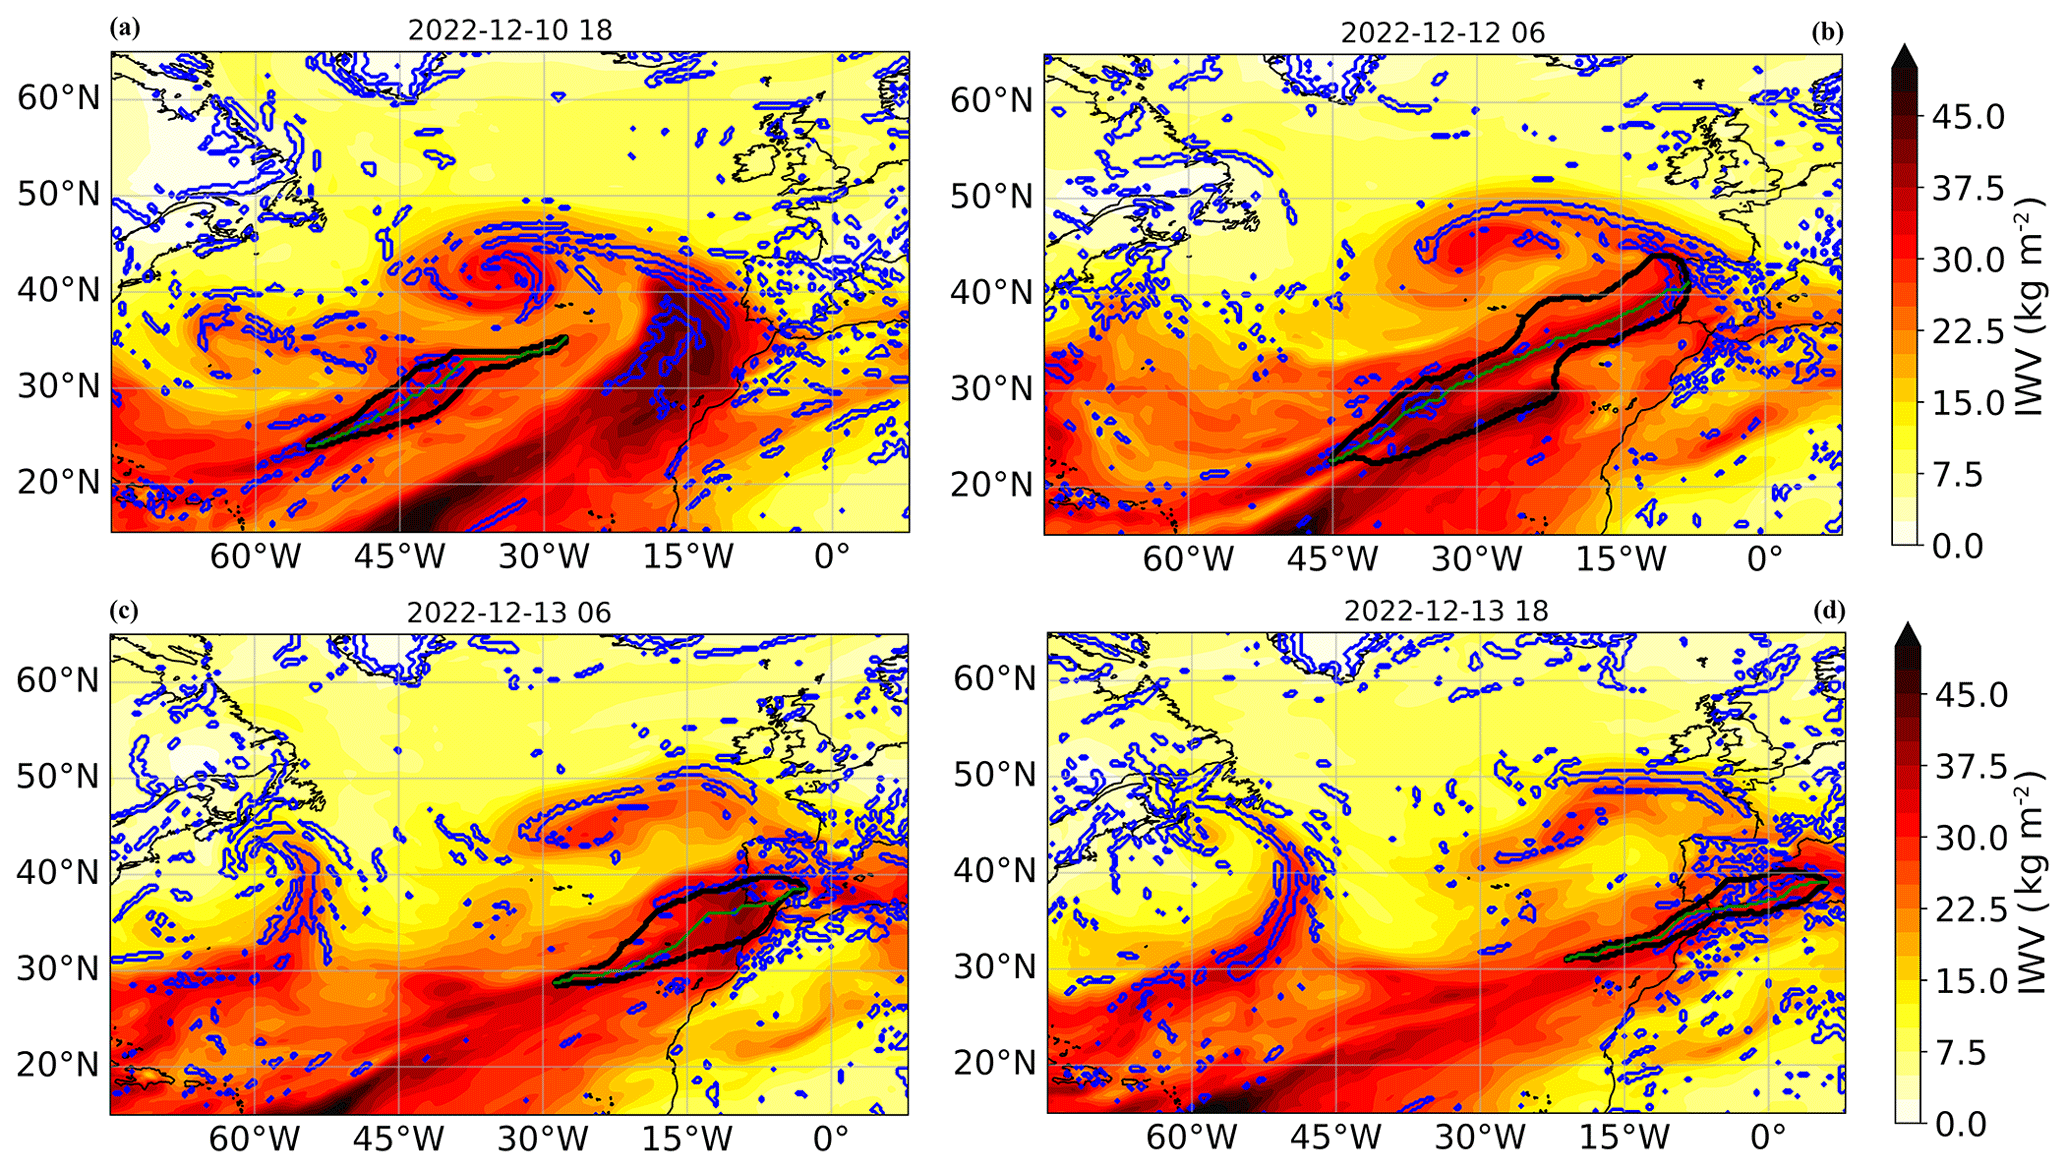
Figure 5Spatial pattern of the integrated water vapor (IWV, shaded). The blue contours represent the convergence of the wind field at 850 hPa (only represented for values lower than −0.3 × 10⁻⁴ s−1). The black contour (thin green line) represents the AR area (axis).
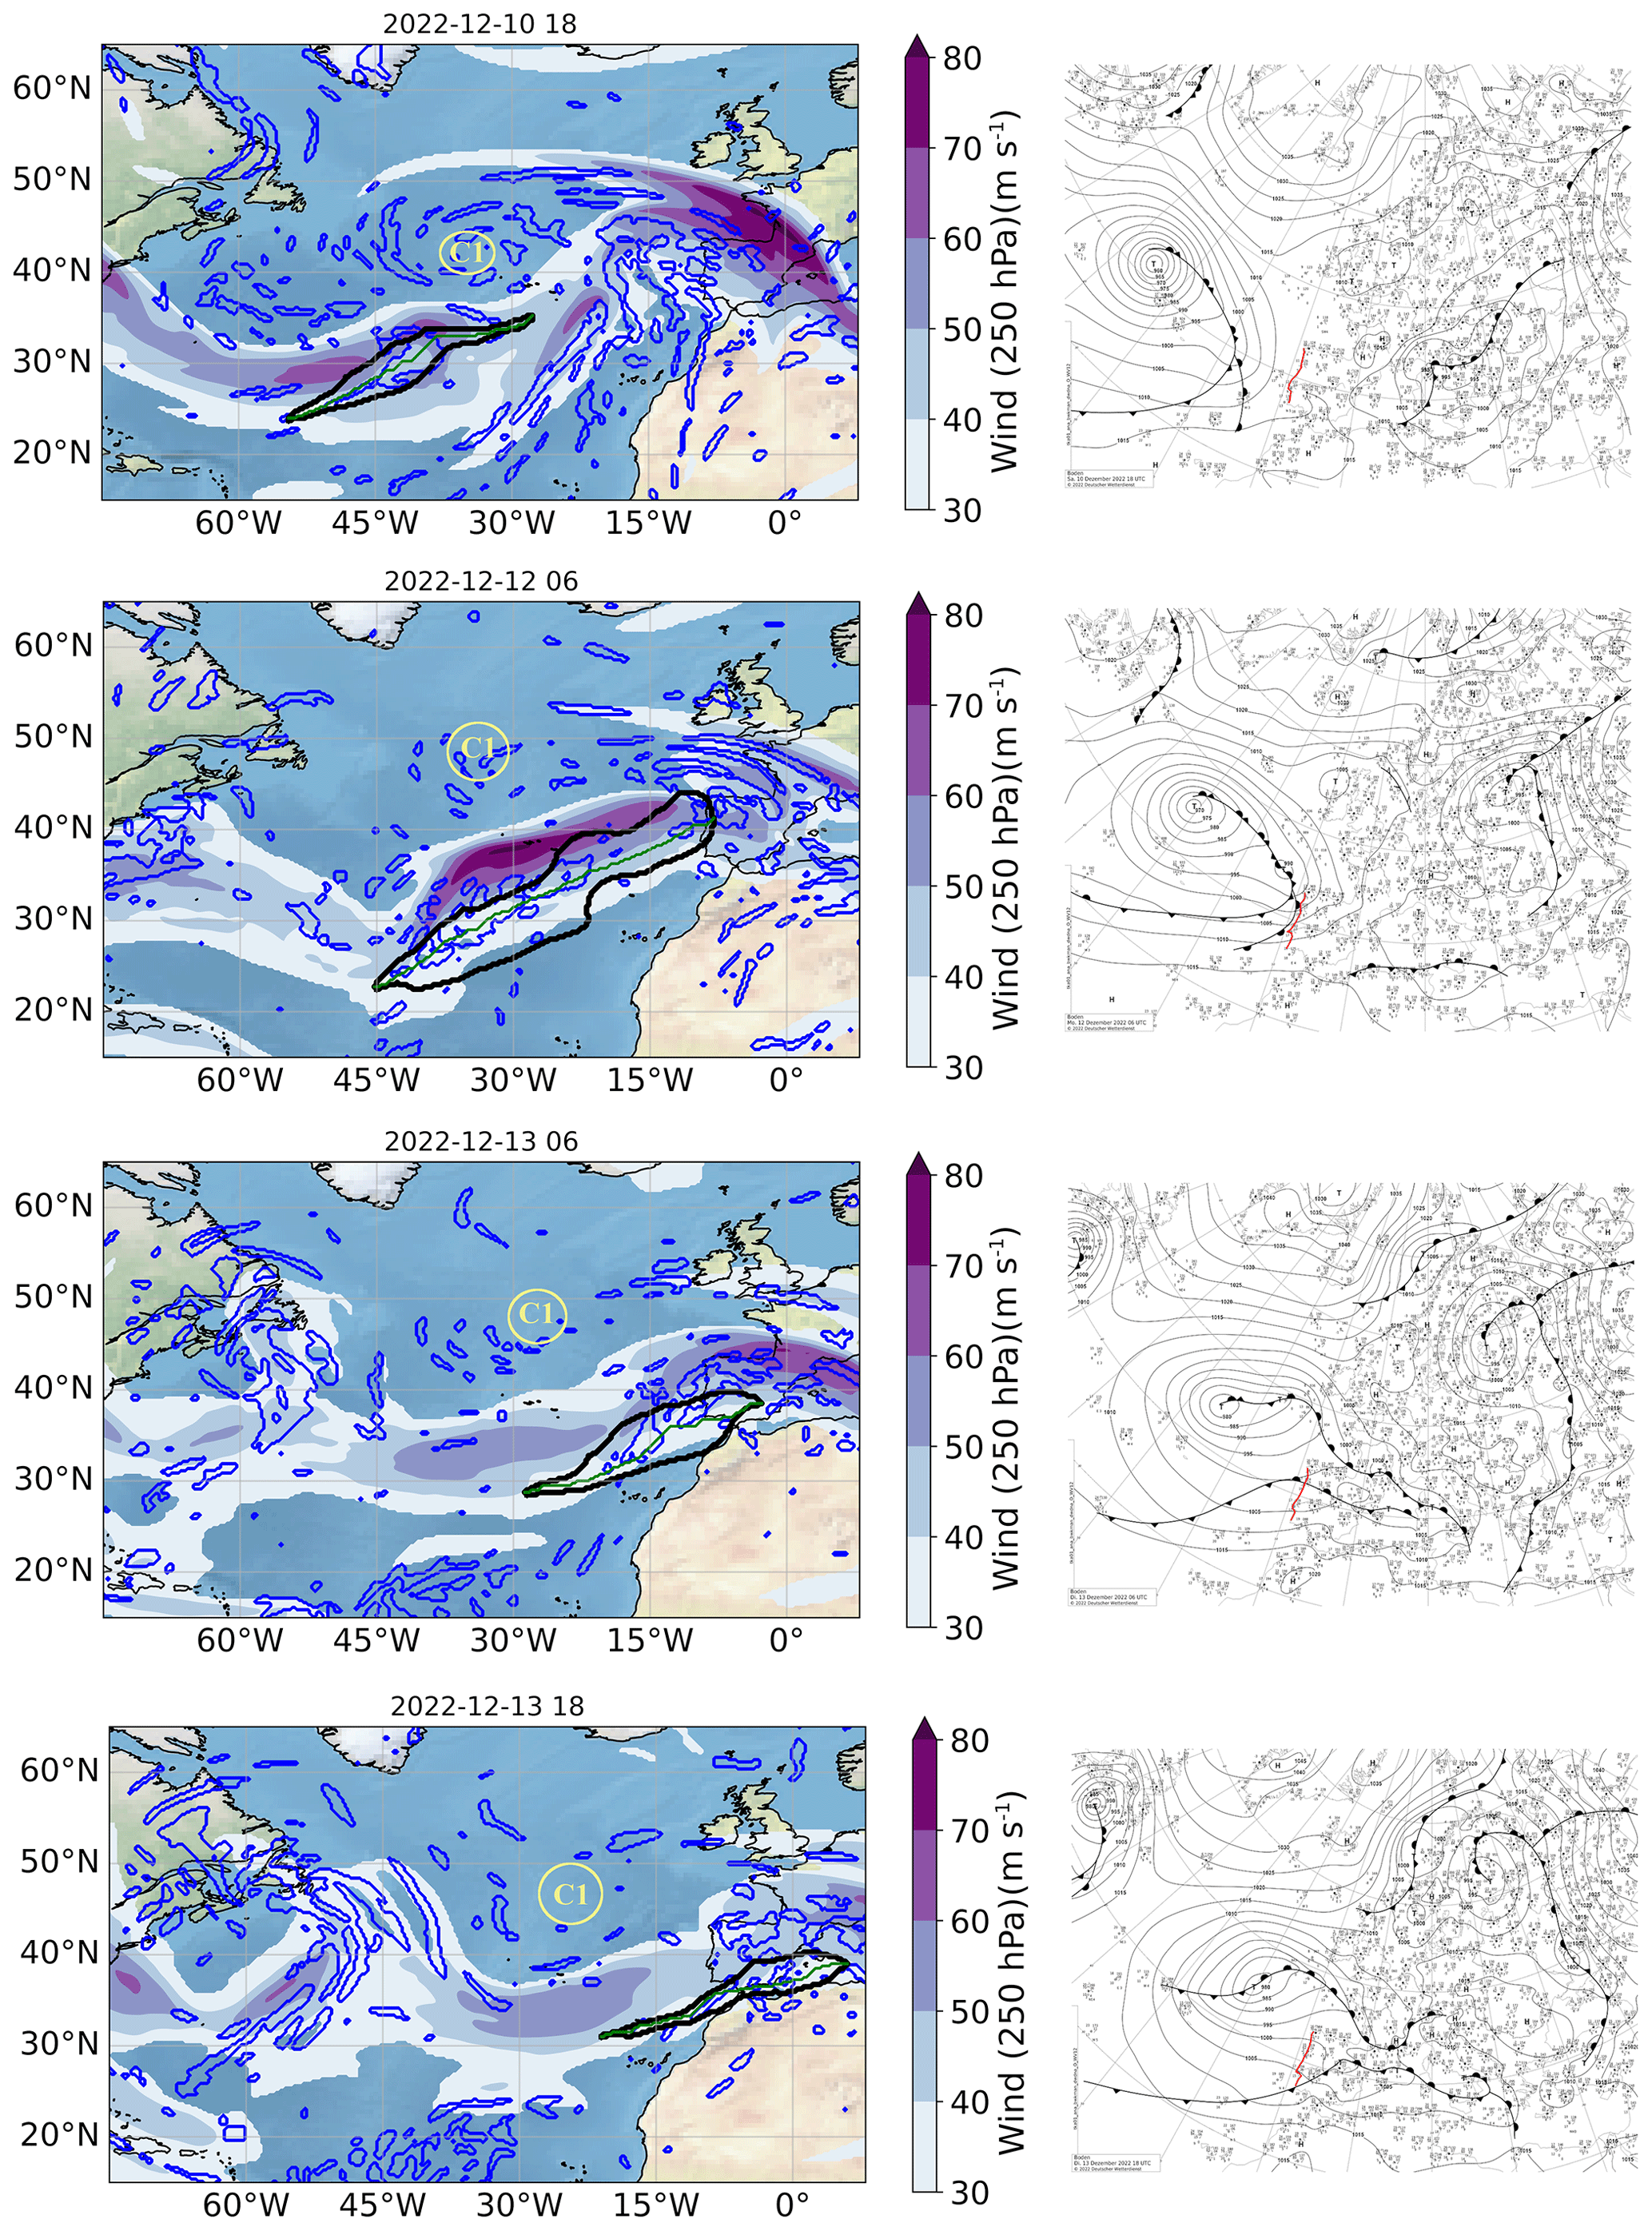
Figure 6Spatial pattern of the 250 hPa wind speed (a, c, e, g, shaded), with the blue contours representing the high-level divergent pattern for values higher than 0.3 × 10⁻⁴ s−1. The C1 system center is marked in each subplot to facilitate visualization comparison with previous figures. The right column (b, d, f, h) represents the DWD synoptic weather charts, retrieved from the wetter3 archive. The west coast of the Iberian Peninsula is marked with a red contour.
Figure 5 shows the integrated water vapor (IWV) as well as the low-level convergent pattern at 850 hPa. IWV values ranging between 25 and 35 kg m−2 were present within the AR area, with a convergent pattern close to the defined axis. As the system developed, the convergence of moisture intensified the AR, and by the time that it made landfall on 12 December, IWV values exceeded 37.5 kg m−2 along the AR axis (Fig. 5b). The landfall on the west coast of Iberia intensified the convergent field inside the AR area that was above land (Fig. 5c). The system started to decay, and on 13 December at 18:00 UTC the moisture content was within 25–30 kg m−2, with convergence throughout its entire area (Fig. 5d). Furthermore, based on the 500 hPa geopotential height field (black contour lines in Fig. S1 in the Supplement), it is recognizable that this AR traveled along a trough, with the ETC located northwards and an anticyclone placed to its southern side. Based on the study of Guo et al. (2020), this tripole pattern leads to an intensification of the horizontal pressure gradient that can force the transport of moisture to the AR.
In Fig. 6 we analyze the development of the jet stream with the divergent pattern at 250 hPa (left column) and the corresponding synoptic DWD weather charts (right column). The west coast of Iberia has been marked with a red contour line on the DWD weather charts for easier identification. The jet stream is located at comparatively low latitudes over the central North Atlantic, in a southwest–northeast orientation pointing towards the Iberian Peninsula. From its genesis to landfall, most of the AR area was embedded within upper (250 hPa) wind values of 50 to 70 m s−1. However, as the system made landfall (Fig. 6c), the AR and the cyclone warm sector became detached from the wind high values, decaying 1 d after. This detachment is observed on the DWD weather charts (Fig. 6b, d, f, h), in which the occlusion front associated with the ETC affects the AR system. While high wind values are present, by the time a new front is observed within the AR area, associated with a small secondary low-pressure system, a larger region of upper-level divergent flow (blue contours in Fig. 6a, c, e, g) is observed within the AR area, co-located with the convergent flow at low levels (blue contours in Fig. 5). This may have supported the formation of a secondary cyclone off the north coast of Iberia that led the warm front to rise and diverge as the cold front wrapped up. As the system approached the European continent, the cold front was present within the AR area. This is true not only for the region close to and within Iberia, meaning that some of the rainfall that occurred might have been generated by the ascent of moisture on the warm front, but also for the AR area northwards of its axis.
The western coast of the Iberian Peninsula is susceptible to the occurrence of extreme rainfall events, resulting in socioeconomic impacts, such as flooding and landslides (e.g., Liberato and Trigo, 2014; Fernández-Montes et al., 2014). On 12 and 13 December 2022, the western coast of Portugal was affected by an extratropical cyclone and associated atmospheric river, leading to an extreme precipitation event. This event registered 120.3 mm of precipitation at the IDL station in Lisbon, surpassing all previous events since continuous measurements began in December 1863. The previous maximum daily rainfall at IDL in Lisbon was registered on 18 February 2008 – 118.4 mm. The objective of this study was to analyze the synoptic features associated with the occurrence the all-time 24 h record-breaking precipitation values recorded in Lisbon, Portugal, between 12 and 13 December 2022, in particular the role of the AR and ETC involved.
The first research question dealt with the preconditions associated with the ETC and AR formation. The jet stream was located at around 30° N, resembling the southern jet stream location described in Woollings et al. (2010), with a clear trajectory towards western Iberia, and corresponding to a negative NAO phase. According to Ramos et al. (2015), this large-scale circulation pattern increases the probability of AR occurrence in southern Europe. Additionally, December 2022 was characterized by above-normal positive SST anomalies which could allow for potentially higher evaporation from the North Atlantic Ocean. In addition, the geopotential height at mid-levels shows a zonal flow at low latitudes, following the jet stream pattern, and a clear Rex blocking pattern at high latitudes near Greenland.
The combination of these synoptic features resulted in the development of several low-pressure systems at comparatively low latitudes over the Atlantic Basin, all traveling along the same path towards western Europe. Specifically, towards western Iberia, the combination of the dominant westerly flow and embedded cyclones leads to multiple intense precipitation events throughout the month of December (Fig. 1b). As stated by Dacre et al. (2015), a secondary cyclone that follows in the footprint of a previous cyclone may profit from the high moisture content left behind by the first one, potentially leading to more intense precipitation in subsequent cyclones. This sequence of events can be appreciated in our results, where we observe that the C1 system, with which the AR was associated, followed the C0 system's same overall path. In this context, we hypothesize that the moisture left behind by the first ETC was gathered by the follow-up C1 cyclone (Fig. 3), supported by the intensification of the AR, the increase in its spatial extent, and the convergence pattern through its life cycle.
The AR was first detected by the algorithm on 10 December, 18:00 UTC. Results show that this object was formed by the merging of two cyclones: (1) an ETC already present on the North Atlantic, characterized by a high moisture content, and (2) a small low-pressure system formed over the northeast coast of North America that was associated with enhanced moisture uptake as it moved over the Gulf Stream, a region characterized by an above-normal positive SST anomaly (Fig. 2). Moisture from the two cyclones, in combination with the high-convergence pattern in central North Atlantic, allowed the moisture content to increase, culminating in the AR formation.
Regarding the mechanisms that were associated with the AR movement and rainfall occurrence for this event (second research question), it was found that throughout its entire life cycle, an inflow of moisture occurred within the AR's area, associated with the inflow of the WCB of the ETC enhancing the development of the system. This allowed the AR to evolve and maintain its characteristics for 72 h, most of the time as an extreme AR event. On 12 and 13 December, the WCB ascent was located over the western coast of Iberia, connected to an occlusion formed off the northwestern coast. Combined with a strong pattern of both convergence at low levels and divergence at upper levels, the system was able to generate intensified rainfall, affecting almost the entire Portuguese territory, with the most extreme impacts and rainfall in central Portugal.
The interpretation of all variables allows us to conclude that this high-impact event was associated with (1) an intense ETC that supported the formation of an intense AR, combined with favorable strong convection and fueled by high moisture content (due to the presence of the WCB's inflow located within the AR area throughout its life cycle) in the region associated with the ETC; (2) a low-latitude location of the jet stream with a clear path towards western Iberia; (3) large-scale ascent due to the combined effect of high convergence at low levels and divergence at high levels; and (4) the presence of a front that could have intensified the convective motion locally over the Iberian Peninsula in addition to the WCB's ascent located around the same mean location.
Due to the increased importance of ARs for both freshwater resources and impacts, a lot of effort has been devoted to the analysis of and connection between ARs and the large-scale atmospheric circulation to which they are connected, e.g., considering extratropical cyclones. The prediction of ARs presents considerable uncertainties, namely in terms of landfall location or intensity (e.g., Wick et al., 2013; DeHaan et al., 2021). Given the fact that the large-scale circulation is more accurately represented in forecasts than moisture-related fields, a better characterization of the relationship between ARs and the surrounding systems (as done in this study) could be an effective way to improve the prediction skill of ARs themselves (DeHaan et al., 2023; Lavers et al., 2020a, b). For the Iberian Peninsula, Ramos et al. (2020) have analyzed the predictability of IVT (a proxy for AR) and of precipitation and have found that, for short lead times, the direct forecast of precipitation with the ECMWF model is more accurate than indirect precipitation forecast based on IVT. However, these authors also show evidence that for longer lead times (around the 10th day), there is an added value of considering the associated forecast of IVT for predicting rainfall in western Iberia.
These results are also important in the scope of ongoing climate change. The increase in global mean surface temperature in the last few decades has inevitably led to an increase in the water-holding capacity of the atmosphere and generally to more extreme precipitation events (IPCC, 2021). The enhanced number of extreme precipitation events in the 160-year IDL time series (see Fig. 1a) in the last 2 decades, with extreme values in 2004, 2008, 2013, and 2022 (this study), is consistent with this assumption. Regarding AR activity affecting the Iberian Peninsula, Ramos et al. (2016) provided evidence of an increase in AR frequency in future climates by the end of the twenty-first century. However, this increase is lower and more uncertain for Iberia compared to other Atlantic regions in Europe. Although the increase in AR occurrence is directly linked to the increase in moisture content, a robust precipitation decrease over Iberia is predicted for the last decades of the twenty-first century (Sousa et al., 2020). This indicates a possible extension of stable and dry summer conditions (Hadley cell expansion) and a decoupling between moisture availability and dynamical forcing for the region. This indicates that further research is needed for a better understanding of extreme precipitation events over Iberia and of the role of atmospheric rivers and the associated synoptic forcing in a warming climate.
ERA5 data are available from the Copernicus Climate Data Store (https://doi.org/10.24381/cds.adbb2d47, Copernicus Climate Change Service, 2023). Dom Luiz Observatory precipitation data for Lisbon were provided by Maria Antónia Valente and are available at https://arquivo.pt/wayback/20230321162517/http://sign.fc.ul.pt/anais.html# (IDL, 2024). Precipitation data from IPMA were provided by Ricardo Deus. The DWD surface maps are freely available via the following archive: https://wetter3.de/archiv_dwd_dt.html (German Weather Service, 2024). The WCB data were accessed through the LSDF Online Storage service of KIT, provided by Quinting and Grams (2022). The exact version of the time-lag models, the decision thresholds, the 30 d running mean trajectory-based WCB climatology, and code to process the input data for the models are archived on Zenodo (https://doi.org/10.5281/zenodo.5154980, Quinting and Grams, 2021).
The supplement related to this article is available online at https://doi.org/10.5194/nhess-25-609-2025-supplement.
AMR, RMT, and TMF conceived and designed the study. TMF performed the data analysis and prepared the figures. AMR, RMT, THG, and JGP contributed with methodologies. The initial draft was written by TMF, supported by RMT, AMR, and JGP. All authors contributed to discussions, comments, and text revisions.
At least one of the (co-)authors is a member of the editorial board of Natural Hazards and Earth System Sciences. The peer-review process was guided by an independent editor, and the authors also have no other competing interests to declare.
Publisher's note: Copernicus Publications remains neutral with regard to jurisdictional claims made in the text, published maps, institutional affiliations, or any other geographical representation in this paper. While Copernicus Publications makes every effort to include appropriate place names, the final responsibility lies with the authors.
The authors would like to thank Ricardo Deus for providing IPMA's precipitation data from the 114 meteorological stations. This work was supported by the Portuguese Foundation for Science and Technology (FCT) I.P./MCTES through the project AMOTHEC (DRI/India/0098/2020), with DOI https://doi.org/10.54499/DRI/India/0098/2020 (PTCRIS, 2022), and through national funds (PIDDAC) – UIDB/50019/2020 (https://doi.org/10.54499/UIDB/50019/2020, PTCRIS, 2020a), UIDP/50019/2020 (https://doi.org/10.54499/UIDP/50019/2020, PTCRIS, 2020b), and LA/P/0068/2020 (https://doi.org/10.54499/LA/P/0068/2020, PTCRIS, 2021). Joaquim G. Pinto acknowledges the AXA Research Fund for support. Alexandre M. Ramos was supported by the Helmholtz “Changing Earth – Sustaining our Future” program. We would like to thank the two anonymous reviewers and the editor for their valuable comments.
This research has been supported by the Portuguese Foundation for Science and Technology (FCT) (grant no. UI/BD/154496/2022).
The article processing charges for this open-access publication were covered by the Karlsruhe Institute of Technology (KIT).
This paper was edited by Maria-Carmen Llasat and reviewed by two anonymous referees.
AEMET: Borrasca Efrain – Agencia estatal de meteorolog, Borrasca Efrain – Agencia Estatal de Meteorología – AEMET. Gobierno de España, https://www.aemet.es/es/conocermas/borrascas/2022-2023/estudios_e_impactos/efrain (last access: 5 February 2024), 2022.
Blanchard, N., Pantillon, F., Chaboureau, J.-P., and Delanoë, J.: Organization of convective ascents in a warm conveyor belt, Weather Clim. Dynam., 1, 617–634, https://doi.org/10.5194/wcd-1-617-2020, 2020.
Catto, J. L., Madonna, E., Joos, H., Rudeva, I., and Simmonds, I.: Global Relationship between Fronts and Warm Conveyor Belts and the Impact on Extreme Precipitation, J. Climate, 28, 8411–8429, https://doi.org/10.1175/JCLI-D-15-0171.1, 2015.
Colle, B. A., Booth, J. F., and Chang, E. K. M.: A Review of Historical and Future Changes of Extratropical Cyclones and Associated Impacts Along the US East Coast, in: Current Climate Change Reports, Vol. 1, Issue 3, 125–143, Springer, https://doi.org/10.1007/s40641-015-0013-7, 2015.
Copernicus Climate Change Service: ERA5 hourly data on single levels from 1940 to present, Copernicus Climate Change Service (C3S) Climate Data Store (CDS) [data set], https://doi.org/10.24381/cds.adbb2d47, 2023.
Dacre, H. F., Clark, P. A., Martinez-Alvarado, O., Stringer, M. A., and Lavers, D. A.: How do atmospheric rivers form?, B. Am. Meteorol. Soc., 96, 1243–1255, https://doi.org/10.1175/BAMS-D-14-00031.1, 2015.
Dacre, H. F., Martínez-Alvarado, O., and Mbengue, C. O.: Linking atmospheric rivers and warm conveyor belt airflows, J. Hydrometeorol., 20, 1183–1196, https://doi.org/10.1175/JHM-D-18-0175.1, 2019.
Davies, R.: Spain – Flood Rescues After Heavy Rain in West and Central Regions, FloodList, https://floodlist.com/europe/spain-floods-extremadura-castilla-la-mancha-madrid-december-2022 (last access: 5 February 2024), 2022.
Davies, R.: Floods in Portugal and Spain, December 2022, Copernicus EMS – European Flood Awareness System, https://www.efas.eu/en/news/floods-portugal-and-spain-december-2022 (last access: 5 February 2024), 2023.
DeHaan, L. L., Martin, A. C., Weihs, R. R., Delle Monache, L., and Ralph, F. M.: Object-Based Verification of Atmospheric River Predictions in the Northeast Pacific, Weather Forecast., 36, 1575–1587, https://doi.org/10.1175/WAF-D-20-0236.1, 2021.
DeHaan, L. L., Wilson, A. M., Kawzenuk, B., Zheng, M., Monache, L. D., Wu, X., Lavers, D. A., Ingleby, B., Tallapragada, V., Pappenberger, F., and Ralph, F. M.: Impacts of Dropsonde Observations on Forecasts of Atmospheric Rivers and Associated Precipitation in the NCEP GFS and ECMWF IFS Models, Weather Forecast., 38, 2397–2413, https://doi.org/10.1175/WAF-D-23-0025.1, 2023.
Dettinger, M. D.: Atmospheric rivers as drought busters on the U.S. West Coast, J. Hydrometeorol., 14, 1721–1732, https://doi.org/10.1175/JHM-D-13-02.1, 2013.
Dettinger, M. D., Ralph, F. M., and Lavers, D. A.: Setting the stage for a global science of atmospheric rivers, Eos, Earth and Space Science News, 96, https://doi.org/10.1029/2015EO038675, 2015.
Dias, D.: Vivemos o dia de Dezembro em que mais Choveu em Lisboa, PÚBLICO, https://www.publico.pt/2022/12/13/azul/noticia/vivemos-dia-dezembro-choveu-lisboa-2031336 (last access: 21 March 2024), 2022.
Eiras-Barca, J., Ramos, A. M., Pinto, J. G., Trigo, R. M., Liberato, M. L. R., and Miguez-Macho, G.: The concurrence of atmospheric rivers and explosive cyclogenesis in the North Atlantic and North Pacific basins, Earth Syst. Dynam., 9, 91–102, https://doi.org/10.5194/esd-9-91-2018, 2018.
Fernández-Alvarez, J. C., Pérez-Alarcón, A., Eiras-Barca, J., Ramos, A. M., Rahimi-Esfarjani, S., Nieto, R., and Gimeno, L.: Changes in moisture sources of atmospheric rivers landfalling the Iberian Peninsula with WRF-FLEXPART, J. Geophys. Res.-Atmos., 128, e2022JD037612, https://doi.org/10.1029/2022JD037612, 2023.
Fernández-Montes, S., Seubert, S., Rodrigo, F. S., Rasilla Álvarez, D. F., Hertig, E., Esteban, P., and Philipp, A.: Circulation types and extreme precipitation days in the Iberian Peninsula in the transition seasons: Spatial links and temporal changes, Atmos. Res., 138, 41–58, https://doi.org/10.1016/j.atmosres.2013.10.018, 2014.
Fink, A. H., Brücher, T., Ermert, V., Krüger, A., and Pinto, J. G.: The European storm Kyrill in January 2007: synoptic evolution, meteorological impacts and some considerations with respect to climate change, Nat. Hazards Earth Syst. Sci., 9, 405–423, https://doi.org/10.5194/nhess-9-405-2009, 2009.
Fragoso, M., Trigo, R. M., Zêzere, J. L., and Valente, M. A.: The exceptional rainfall event in Lisbon on 18 February 2008, Weather, 65, 31–35, https://doi.org/10.1002/wea.513, 2010.
German Weather Service: DWD Analysis Archive, Soil Analysis, German Weather Service [data set], https://www.wetter3.de/archiv_dwd_dt.html, last access: 5 May 2024.
Guo, Y., Shinoda, T., Guan, B., Waliser, D. E., and Chang, E. K. M.: Statistical relationship between atmospheric rivers and extratropical cyclones and anticyclones, J. Climate, 33, 7817–7834, https://doi.org/10.1175/JCLI-D-19-0126.1, 2020.
Hawcroft, M., Walsh, E., Hodges, K., and Zappa, G.: Significantly increased extreme precipitation expected in Europe and North America from extratropical cyclones, Environ. Res. Lett., 13, 124006, https://doi.org/10.1088/1748-9326/AAED59, 2018.
Hay, J. E. and Williams, P. D.: Chapter 3 – Have atmospheric extremes changed in the past? In Developments in Weather and Climate Science, Science of Weather, Climate and Ocean Extremes, Elsevier, 81–126, ISBN 9780323855419, https://doi.org/10.1016/B978-0-323-85541-9.00009-2, 2023.
Hersbach, H., Bell, B., Berrisford, P., Hirahara, S., Horányi, A., Muñoz-Sabater, J., Nicolas, J., Peubey, C., Radu, R., Schepers, D., Simmons, A., Soci, C., Abdalla, S., Abellan, X., Balsamo, G., Bechtold, P., Biavati, G., Bidlot, J., Bonavita, M., and Thépaut, J. N.: The ERA5 global reanalysis, Q. J. Roy. Meteor. Soc., 146, 1999–2049, https://doi.org/10.1002/qj.3803, 2020.
Hu, H. and Dominguez, F.: Understanding the Role of Tropical Moisture in Atmospheric Rivers, J. Geophys. Res.-Atmos., 124, 13826–13842, https://doi.org/10.1029/2019JD030867, 2019.
IDL: Sign – Assinaturas de mudança ambiental nas séries de observação dos institutos geofísicos, Arquivo.PT [data set], https://arquivo.pt/wayback/20230321162517/http://sign.fc.ul.pt/anais.html#, last access: 22 February 2024.
IPCC: Climate Change 2021: The Physical Science Basis. Contribution of Working Group I to the Sixth Assessment Report of the Intergovernmental Panel on Climate Change, edited by: Masson-Delmotte, V., Zhai, P., Pirani, A., Connors, S. L., Péan, C., Berger, S., Caud, N., Chen, Y., Goldfarb, L., Gomis, M. I., Huang, M., Leitzell, K., Lonnoy, E., Matthews, J. B. R., Maycock, T. K., Waterfield, T., Yelekçi, O., Yu, R., and Zhou, B., Cambridge University Press, Cambridge, United Kingdom and New York, NY, USA, in press, https://doi.org/10.1017/9781009157896, 2021.
IPMA: Boletim Portugal Dezembro 2022 Continental, https://www.ipma.pt/pt/media/noticias/documentos/2022/Boletim_clima_IPMA_dez2022.pdf (last access: 5 February 2024), 2023.
Joos, H., Sprenger, M., Binder, H., Beyerle, U., and Wernli, H.: Warm conveyor belts in present-day and future climate simulations – Part 1: Climatology and impacts, Weather Clim. Dynam., 4, 133–155, https://doi.org/10.5194/wcd-4-133-2023, 2023.
Knippertz, P., Wernli, H., and Gläser, G.: A Global Climatology of Tropical Moisture Exports, J. Climate, 26, 3031–3045, https://doi.org/10.1175/JCLI-D-12-00401.1, 2013.
Khouakhi, A., Driouech, F., Slater, L., Waine, T., Chafki, O., Chehbouni, A., and Raji, O.: Atmospheric rivers and associated extreme rainfall over Morocco, Int. J. Climatol., 42, 7766–7778, https://doi.org/10.1002/joc.7676, 2022.
Lavers, D. A. and Villarini, G.: The contribution of atmospheric rivers to precipitation in Europe and the United States, J. Hydrol., 522, 382–390, https://doi.org/10.1016/j.jhydrol.2014.12.010, 2015.
Lavers, D. A., Allan, R. P., Wood, E. F., Villarini, G., Brayshaw, D. J., and Wade, A. J.: Winter floods in Britain are connected to atmospheric rivers, Geophys. Res. Lett., 38, L23803, https://doi.org/10.1029/2011GL049783, 2011.
Lavers, D. A., Villarini, G., Allan, R. P., Wood, E. F., and Wade, A. J.: The detection of atmospheric rivers in atmospheric reanalyses and their links to British winter floods and the large-scale climatic circulation. J. Geophys. Res.-Atmos., 117, D20106, https://doi.org/10.1029/2012JD018027, 2012.
Lavers, D. A., Ingleby, N. B., Subramanian, A. C., Richardson, D. S., Ralph, F. M., Doyle, J. D., Reynolds, C. A., Torn, R. D., Rodwell, M. J., Tallapragada, V., and Pappenberger, F.: Forecast Errors and Uncertainties in Atmospheric Rivers, Weather Forecast., 35, 1447–1458, https://doi.org/10.1175/WAF-D-20-0049.1, 2020a.
Lavers, D. A., Ralph, F. M., Richardson, D. S., and Pappenberger, F.: Improved forecasts of atmospheric rivers through systematic reconnaissance, better modelling, and insights on conversion of rain to flooding, Commun. Earth Environ. 1, 39, https://doi.org/10.1038/s43247-020-00042-1, 2020b.
Lee, S. H., Polvani, L. M., and Guan, B.: Modulation of Atmospheric Rivers by the Arctic Stratospheric Polar Vortex, Geophys. Res. Lett., 49, e2022GL100381, https://doi.org/10.1029/2022GL100381, 2022.
Liberato, M. L. R. and Trigo, R. M.: Extreme precipitation events and related impacts in western Iberia, in: Proceedings of FRIEND Water 2014, 171–176, https://www.researchgate.net/publication/266673929_Extreme_precipitation_events_and_related_impacts_in_western_Iberia/citations (last access: 19 June 2024), 2014.
Liberato, M. L. R., Ramos, A. M., Trigo, R. M., Trigo, I. F., Durán-Quesada, A. M., Nieto, R., and Gimeno, L.: Moisture sources and large-scale dynamics associated with a flash flood event, Geoph. Monog. Series, 200, 111–126, https://doi.org/10.1029/2012GM001244, 2012.
Lusa, A.: Inundações de Dezembro causaram 185 Milhões de Euros de prejuízos na Zona de Lisboa, Observador, https://observador.pt/2023/01/17/inundacoes-de-dezembro-causaram-185-milhoes-de-euros-de-prejuizos-na-zona-de-lisboa/ (last access: 11 November 2024), 2023.
Mahto, S. S., Nayak, M. A., Lettenmaier, D. P., and Mishra, V.: Atmospheric rivers that make landfall in India are associated with flooding, Commun. Earth Environ., 4, 120, https://doi.org/10.1038/s43247-023-00775-9, 2023.
Martínez-Alvarado, O., Joos, H., Chagnon, J., Boettcher, M., Gray, S. L., Plant, R. S., Methven, J., and Wernli, H.: The dichotomous structure of the warm conveyor belt, Q. J. Roy. Meteor. Soc., 140, 1809–1824, https://doi.org/10.1002/qj.2276, 2014.
Peixoto, J. P. and Oort, A. H.: Physics of Climate, American Institute of Physics, 1st edn., XXXIX, 520 pp., https://link.springer.com/book/9780883187128 (last access: 26 May 2024), 1992.
Pinto, J. G. and Raible, C. C.: Past and recent changes in the North Atlantic oscillation, WIREs Clim. Change, 3, 79–90, https://doi.org/10.1002/wcc.150, 2012.
Pinto, J. G., Zacharias, S., Fink, A. H., Leckebusch, G. C., and Ulbrich, U.: Factors contributing to the development of extreme North Atlantic cyclones and their relationship with the NAO, Clim. Dynam., 32, 711–737, https://doi.org/10.1007/s00382-008-0396-4, 2009.
PTCRIS: Instituto Dom Luiz, https://doi.org/10.54499/UIDB/50019/2020, 2020a.
PTCRIS: Instituto Dom Luiz,https://doi.org/10.54499/UIDP/50019/2020, 2020b.
PTCRIS: Instituto Dom Luiz, https://doi.org/10.54499/LA/P/0068/2020, 2021.
PTCRIS: Transporte de humidade para extremos hidrológicos num clima em mudança, https://doi.org/10.54499/DRI/India/0098/2020, 2022.
Quinting, J. and Grams, C. M.: EuLerian Identification of ascending AirStreams (ELIAS 2.0) in Numerical Weather Prediction and Climate Models, Zenodo [code], https://doi.org/10.5281/zenodo.5154980, 2021.
Quinting, J. F. and Grams, C. M.: EuLerian Identification of ascending AirStreams (ELIAS 2.0) in numerical weather prediction and climate models – Part 1: Development of deep learning model, Geosci. Model Dev., 15, 715–730, https://doi.org/10.5194/gmd-15-715-2022, 2022.
Ralph, F. M., Dettinger, M. C. L. D., Cairns, M. M., Galarneau, T. J., and Eylander, J.: Defining “Atmospheric river”: How the glossary of meteorology helped resolve a debate, B. Am. Meteorol. Soc., 99, 837–839, https://doi.org/10.1175/BAMS-D-17-0157.1, 2018.
Ralph, M. F., Rutz, J. J., Cordeira, J. M., Dettinger, M., Anderson, M., Reynolds, D., Schick, L. J., and Smallcomb, C.: A scale to characterize the strength and impacts of atmospheric rivers, B. Am. Meteorol. Soc., 100, 269–289, https://doi.org/10.1175/BAMS-D-18-0023.1, 2019.
Ramos, A. M., Trigo, R. M., Liberato, M. L. R., and Tomé, R.: Daily Precipitation Extreme Events in the Iberian Peninsula and Its Association with Atmospheric Rivers, J. Hydrometeorol., 16, 579–597, https://doi.org/10.1175/JHM-D-14-0103.1, 2015.
Ramos, A. M., Tomé, R., Trigo, R. M., Liberato, M. L. R., and Pinto, J. G.: Projected changes in atmospheric rivers affecting Europe in CMIP5 models, Geophys. Res. Lett., 43, 9315–9323, https://doi.org/10.1002/2016GL070634, 2016.
Ramos, A. M., Sousa, P. M., Dutra, E., and Trigo, R. M.: Predictive skill for atmospheric rivers in the western Iberian Peninsula, Nat. Hazards Earth Syst. Sci., 20, 877–888, https://doi.org/10.5194/nhess-20-877-2020, 2020.
Rex, D. F.: The Effect of Atlantic Blocking Action upon European Climate, Tellus, 3, 100–112, https://doi.org/10.1111/j.2153-3490.1951.tb00784.x, 1951.
Schultz, D. M., Bosart, L. F., Colle, B. A., Davies, H. C., Dearden, C., Keyser, D., Martius, O., Roebber, P. J., Steenburgh, W. J., Volkert, H., and Winters, A. C.: Extratropical Cyclones: A Century of Research on Meteorology's Centerpiece, Meteor. Mon., 59, 16.1–16.56, https://doi.org/10.1175/AMSMONOGRAPHS-D-18-0015.1, 2019.
Sousa, P. M., Ramos, A. M., Raible, C. C., Messmer, M., Tomé, R., Pinto, J. G., and Trigo, R. M.: North Atlantic Integrated Water Vapor Transport – From 850 to 2100 CE: Impacts on Western European Rainfall, J. Climate, 33, 263–279, https://doi.org/10.1175/JCLI-D-19-0348.1, 2020.
Stohl, A., Forster, C., and Sodemann, H.: Remote sources of water vapor forming precipitation on the Norwegian west coast at 60° N – A tale of hurricanes and an atmospheric river, J. Geophys. Res.-Atmos., 113, D05102, https://doi.org/10.1029/2007JD009006, 2008.
Trigo, R. M., Varino, F., Ramos, A. M., Valente, M. A., Zêzere, J. L., Vaquero, J. M., Gouveia, C. M., and Russo, A.: The record precipitation and flood event in Iberia in december 1876: Description and synoptic analysis, Front. Earth Sci., 2, 1–15, https://doi.org/10.3389/feart.2014.00003, 2014.
Trigo, R. M., Ramos, C., Pereira, S. S., Ramos, A. M., Zêzere, J. L., and Liberato, M. L. R.: The deadliest storm of the 20th century striking Portugal: Flood impacts and atmospheric circulation, J. Hydrol., 541, 597–610, https://doi.org/10.1016/j.jhydrol.2015.10.036, 2016.
Wanner, H., Bronnimann, S., Casty, C., Gyalistras, D., Luterbacher, J., Schmutz, C., Stephenson, D. B., and Xoplaki, E.: North Atlantic oscillation. Concepts and studies, Surv. Geophys., 22, 321–382, https://doi.org/10.1023/A:1014217317898, 2001.
Wick, G. A., Neiman, P. J., Ralph, F. M., and Hamill, T. M.: Evaluation of Forecasts of the Water Vapor Signature of Atmospheric Rivers in Operation Numerical Weather Prediction Models, Weather Forecast., 28, 1337–1352, https://doi.org/10.1175/WAF-D-13-00025.1, 2013.
Woollings, T., Hannachi, A., and Hoskins, B.: Variability of the North Atlantic eddy-driven jet stream, Q. J. Roy. Meteor. Soc., 136, 856–868, https://doi.org/10.1002/qj.625, 2010.
Xu, G., Ma, X., Chang, P., and Wang, L.: Image-processing-based atmospheric river tracking method version 1 (IPART-1), Geosci. Model Dev., 13, 4639–4662, https://doi.org/10.5194/gmd-13-4639-2020, 2020.
Zhang, Z., Ralph, F. M., and Zheng, M.: The Relationship Between Extratropical Cyclone Strength and Atmospheric River Intensity and Position, Geophys. Res. Lett., 46, 1814–1823, https://doi.org/10.1029/2018GL079071, 2019.
- Abstract
- Introduction
- Data and methodology
- The extreme precipitation's spatial distribution on 13 December
- Preconditions for the atmospheric river development
- Large-scale atmospheric conditions associated with the atmospheric river life cycle
- Conclusions
- Code and data availability
- Author contributions
- Competing interests
- Disclaimer
- Acknowledgements
- Financial support
- Review statement
- References
- Supplement