the Creative Commons Attribution 4.0 License.
the Creative Commons Attribution 4.0 License.
The effect of propagation saw test geometries on critical cut length
Karl W. Birkeland
Valentin Adam
Philipp L. Rosendahl
Alec van Herwijnen
For a slab avalanche to release, a crack in a weak snow layer beneath a cohesive snow slab has to initiate and propagate. Information on crack propagation is essential for assessing avalanche triggering potential. In the field, this information can be gathered with the propagation saw test (PST), a field test that provides valuable data on crack propagation propensity. The first PSTs were performed about 20 years ago and standards have since been established. However, there are still differences in how the PST is performed. Standards in North America require the column ends to be cut vertically, whereas in Europe they are typically cut normal to the slope. In this study, we investigate the effect of these different column geometries on the critical cut length. To this end, we conducted 27 pairs of PST experiments, each pair consisting of one PST with slope-normal cut ends and one PST with vertical-cut ends. Our experiments showed that PSTs with normal cut ends have up to 50 % shorter critical cut lengths, and the difference predominantly depends on the slope angle and slab thickness. We developed two load-based models to convert critical cut lengths between the test geometries: (i) a uniform slab model that treats the slab as one uniform layer and (ii) a layered model that accounts for stratification. For validation, we compare these models with a modern fracture mechanical model. For the rather uniform slabs of our experiments, both load-based models were in excellent agreement with measured data. For slabs with an artificial layering, the uniform load–model predictions reveal deviations from the fracture mechanical model, whereas the layered model was still in excellent agreement. This study reveals the influence that the geometry of field tests and the slope angle of the field site have on test results. It also shows that only accurately prepared field tests can be reliable and therefore meaningful. However, we provide models to correct for imprecise field test geometry effects on the critical cut length.
- Article
(3306 KB) - Full-text XML
- BibTeX
- EndNote
Accurate assessment of fracture initiation and crack propagation is essential to evaluate the potential for triggering avalanches (Schweizer et al., 2016). In this context, the propagation saw test (PST) is a field test that provides valuable insight into the propensity of cracks to propagate (Gauthier and Jamieson, 2006). In the past 20 years several studies investigated the influence of PST geometry. They aimed to provide recommendations for the PST column length (Bair et al., 2014) or looked into the effect of changing slab thicknesses (Simenhois and Birkeland, 2008). It was also reported that the critical cut length depends on whether the ends of the PSTs are cut slope-normally or vertically (Gaume et al., 2017). Although PSTs have been used for approximately 20 years and utilized in various studies (Bair et al., 2014; Bergfeld et al., 2021, 2022; Birkeland et al., 2019; Gauthier and Jamieson, 2008), the lack of widely accepted standards hinders its consistent and reproducible application across locations and practitioners. Standards in North America require the PST column ends to be cut vertically (CAA, 2016; Greene et al., 2022), whereas in Europe they are typically cut normal to the slope (Sigrist and Schweizer, 2007; van Herwijnen et al., 2016).
This methodological difference could possibly explain why previous studies were not conclusive as to whether the critical cut length decreases (Gaume et al., 2017, slope-normal cuts) or increases (Gauthier and Jamieson, 2008; McClung, 2009; both slope-vertical cuts) with increasing slope angle. In both North America and Europe the weak layer is most commonly cut upslope from the top, but in rare cases, the weak layer is also cut downslope. Gauthier and Jamieson (2006) investigated this difference experimentally and observed no significant dependence of critical cut length on cutting direction. However, they also found that critical cut length does not depend on slope angle – another contradictory statement about the cut-length-to-slope-angle relationship. However, the geometric and/or methodological differences (column geometry and cutting direction of PSTs) are likely to affect the results of PSTs (Gaume et al., 2017; Heierli et al., 2008; Fig. S3 in the Supplement). Our study aims to investigate the effect of different column geometries and cutting directions on the critical cut length, a major structural property. To achieve this, we conducted a series of side-by-side PST experiments with normal and vertical ends. In addition, we also investigated the influence of cutting direction (upslope or downslope).
The purpose of these experiments was to demonstrate the influence of PST column geometry and cutting direction on the critical cut length. We also explain where these differences come from and how the stratification of the snowpack influences these geometric effects. To this end, we developed both a uniform and a layered load-based model to convert between PST geometries. In addition, the developed conversion models were validated against a modern fracture mechanics model (Rosendahl and Weißgraeber, 2020; Weißgraeber and Rosendahl, 2023).
2.1 Field experiments
In January and March 2021, we performed field experiments above Davos in the eastern Swiss Alps and in Montana, USA. All field sites were around 2400 m a.s.l., and PSTs resulted in all possible propagation outcomes (slab fracture, crack arrest, and full propagation). In Davos, we tested a weak layer consisting of surface hoar (grain size: 2–4 mm), while in Montana the weak layer consisted of depth hoar (grain size: 1–4 mm) (Fierz et al., 2009). Slab thickness ranged from 52 to 96 cm.
In total 27 pairs of PSTs were performed, with each pair consisting of one test using slope-normal ends (results with superscript XN; Fig. 1a) and the other with vertical ends (superscript XV; Fig. 1b). For three pairs, hence for six PSTs, we performed additional PSTs in which the weak layer was cut in the downslope direction immediately next to the PST cut in the upslope direction ( and in Fig. 1b).
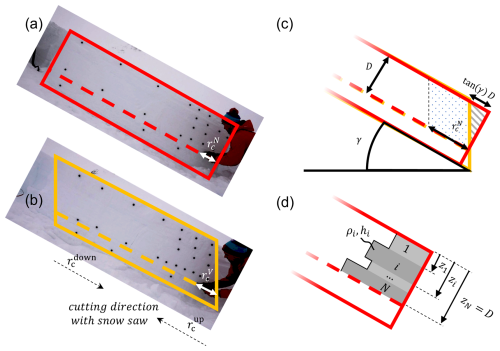
Figure 1(a) PST with normal ends and a critical cut length . The red outline indicates the PST geometry. The dashed line indicates the height of the weak layer. (b) PST with vertical ends and a critical cut length . Additionally, the different cutting directions and are indicated. The two cutting directions were used in both PST geometries. (c) Difference in PST geometry at the downslope end of a PST. The main difference is the additional slab load for the slope-normal geometry shown by the grey triangle. D is the slope-normal measured slab thickness and γ the slope angle. (d) In the layered load conversion model, each slab layer i (in both the vertical and normal PST configurations) contributes according to their density ρi, layer thickness hi, and depth in the slab zi.
For all PSTs, we recorded the critical cut length as for PSTs with normal ends and for vertical ends. We then compute the ratio of both cut lengths . To investigate the effect of cutting directions, we used the ratio , where and indicate whether the critical cut length was taken from an upslope or downslope cutting of the weak layer, respectively (Fig. 1b). Note that the ratio of the cutting direction was determined separately for the different PST geometries.
2.2 Conversion models
Mechanically, cutting a PST can be modeled as a cantilever beam that does not deform sufficiently to come into contact with the snow under the cut. The cantilever (unsupported part of the slab) is loaded by the gravitational body forces, i.e., its own mass. This loading has to be carried through a combination of reaction forces (normal forces, shear forces, and bending moments inside the slab), which all work together to resist the load and maintain the slab's structural integrity. The stress transmitted from the slab to the foundation is known as bearing stress or contact stress. As the foundation is provided by the intact weak layer, the contact stress is transmitted right ahead of the saw cut. Generally, the contact stress has stress intensity close to the saw cut, it fades out away from the saw cut, and it has normal and shear stress components. However, the actual distribution of contact stress is similar in the slope-vertical and slope-normal PST geometry. Simplified, the contact stress is related to a reaction force of the weak layer which supports the cantilever. For a cantilever beam, the mixed-mode (normal and shear) reaction force R at the bedding is related to the total load of the unsupported part of the slab: R=mg, where m is the total mass of the slab above the saw cut and g is the gravitational acceleration. The maximum load a weak layer can support before fracture is reached at the critical cut length. Hence, also R is at a maximum at the critical cut length (Rmax). In our load models, we assume that Rmax is specific to a weak layer, which enables us to state that , where and are the reaction forces at the critical cut length which bear the unsupported portion of the slab in the slope-vertical and slope-normal PST geometries, respectively. As the gravitational acceleration is constant, the masses of the unsupported slab of the two PST geometries are equal:
Note that the mass of the slab above the intact weak layer contributes to Rmax, but since these are additive terms which are independent of PST geometry, they cancel each other out in Eq. (1).
2.2.1 Uniform load model (ULM)
If we consider a uniform slab and express the mass m through snowpack properties, Eq. (1) becomes
where D is the slope-normal measured slab thickness, γ the slope angle, b the PST column thickness, and ρ the slab density (Fig. 1c). After rearranging, Eq. (2) results in the following model for the conversion of critical cut lengths (assumption of a uniform slab):
At this point we would like to point out that this relationship (Eq. 3) was already suggested in the context of anticrack nucleation. However, the derivation was based purely on geometric considerations, and no further verification was carried out (Heierli et al., 2008; Fig. S3).
2.2.2 Layered load model (LLM)
The temporal sequence of weather conditions inevitably produces layered slabs in a natural snowpack. The individual layers differ, among other parameters, in their layer thickness and density. A sloped PST with layered slabs in slope-normal geometry results in more (compared to the ULM) load above the saw cut if high-density layers are close to the snow surface (grey triangle in Fig. 1c and d). In addition to the slope angle γ, the extra load depends on the individual layer thickness hi, density ρi, and relative depth zi within the slab (Fig. 1d). Conceptually, the layered load model is based on the same assumptions as the uniform load model. However, it considers the layering which makes the formulation to compute the additional load of PSTs with slope-normal geometry more intricate:
where N is the number of layers. Hence for N=1, Eq. (4) simplifies to the ULM (Eq. 3). For a detailed derivation of the layered load model, see Appendix A.
2.2.3 Layered mechanical model (LMM)
For further verification of the load models, we use a closed-form analytical model for layered snowpacks (Weißgraeber and Rosendahl, 2023) that was recently validated with field data (Bergfeld et al., 2023). This model describes the slab as a shear-deformable, layered beam, and it allows cylindrical bending, while the weak layer is represented as a layer of smeared springs with Young's modulus and a shear modulus. We used the model to determine the critical energy release rate Gc from the measured critical cut length, depending of the geometric configuration ( or , respectively). This critical energy release rate, also called specific fracture energy, is a material property of the weak layer describing its resistance to crack growth, and it is hence a proxy for the fundamental physical process of crack growth in PSTs. Subsequently, we used the critical energy release rate determined from an experiment with slope-normal beam ends to calculate back to the critical cut length of a vertically cut PST. This model is therefore also suitable to convert a critical cut length measured in one PST configuration to another. Compared to the ULM (Eq. 3) and the LLM (Eq. 4), the LMM requires many more snowpack properties. However, it represents the specific snowpack layering of a PST and its influence on the critical cut length in much more detail, as it takes into account the full deformation behavior of the slab and weak-layer system. Uniform slabs or symmetrically (with respect to the center height of the slab) layered slabs are simplifications: usually slabs have a density gradient so that deeper layers have a higher density and are therefore stiffer. However, the load models take very little account of the effects of asymmetric slab layering. We therefore used the LMM to verify the influence of an asymmetrically layered slab on our load-based models (ULM, LLM).
In total we performed 66 PSTs at four different field sites. A total of 54 PSTs aimed to investigate the effect of PST geometry (Table C1); therefore the dataset includes 27 pairs of PSTs, and each pair consists of one PST with slope-normal and one with vertical PST beam ends. The remaining 12 PSTs were performed to investigate the difference between the upslope and downslope cutting of a PST (Table C2).
3.1 Normal vs. vertical PST ends
For upslope cutting, critical cut lengths were measured between 14 and 70 cm. Overall, was systematically larger than , on average almost 50 % (colored boxes in Fig. 2a).
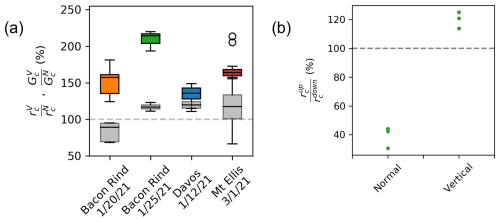
Figure 2(a) Ratio of critical cut lengths shown as boxplots for the different field days (colored). Ratio of the critical energy release rates computed with the mechanical model using the critical cut lengths of the experiments (grey). Boxes represent the interquartile range, with the middle line representing the median value. (b) Ratio of critical cut length from PSTs with downslope and upslope cuts. Results are shown for PSTs with normal and vertical PST ends. Both dashed lines represent a ratio of 1.
Differences in snowpack conditions (e.g., slab thickness, layering) at the various field sites resulted in different deviations between PST geometries. Median ratios ranged from 136 % to 214 % (Fig. 2a, horizontal lines in the colored boxes).
3.2 Upslope vs. downslope cutting
Besides PST geometry, the cutting direction also affects the critical cut length. For PSTs with normal ends, was about 40 % of (Fig. 2b, left), while for vertical PST ends was about 20 % longer than (Fig. 2b, right). Again, these rather large differences can be explained by slab loading and slab mechanics as will be detailed in the Discussion section.
3.3 Models
With Eqs. (3) and (4) we provide a uniform load model and a layered load model, respectively. The models allow us to convert critical cut lengths between the different PST geometries. Our experiments show very good agreement with both the uniform load model (Fig. 3a, dots) and the layered load model (Fig. 3a, crosses). The RMSE between the measured critical cut lengths in vertical geometry and the modeled counterpart is 4.4 cm for the uniform load model and 4.6 cm for the layered load model.
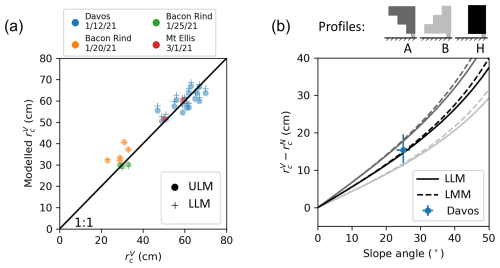
Figure 3(a) Modeled critical cut lengths for upslope cuts with vertical PST geometry with the corresponding measured values; dots represent the uniform load model (ULM; Eq. 2) and pluses the layered load model (LLM; Eq. 3). Different colors indicate the different field days. The black line is the 1:1 line and indicates a perfect model. (b) Modeled differences in critical cut lengths with slope angle (upslope cutting). The blue dot represents the mean and uncertainty of the measurements in Davos, as this field day served to define the artificial profiles by matching the mean density. The solid lines are the layered load model, and the dashed lines result from the layered mechanical model (LMM). The grey shades indicate different slab profiles given at the top of the figure.
Using the layered mechanical model to analyze the global energy balance at the onset of crack growth, we derived critical energy release rates from the experimental data. The model considers the layering and geometrical configuration of a PST experiment to determine the critical energy release rate at the critical cut length, i.e., the specific fracture energy. Unlike the critical cut length, the critical energy release rate is a material property of the weak layer and should thus not depend on test geometry. In fact, the determined critical energy release rates, measured in the different PST configurations (vertical or normal beam ends), differed by a maximum of 20 % (Fig. 2a, grey boxes), whereas the critical cut lengths were up to 6 times larger (Fig. 2a, colored boxes).
Our uniform load model considers a homogeneous slab and gives a tangential slope dependence (see Eq. 3 and solid black line in Fig. 3b). For comparison, the layered load model and the layered mechanical model were evaluated for many different slope angles (Fig. 3b, solid and dashed lines, respectively) and three different generic slab configurations (Fig. 3b, top). In profile H the mean slab density matched the observed snow cover from our experiments in Davos. The direct comparison for the artificial profile H shows a very good agreement between the load models and the mechanical model (compare solid black line and dashed black line in Fig. 3b). Note that for profile H the two load models are equal. The deviations of the critical cut lengths () measured in Davos can be reproduced very accurately with all models (Fig. 3b, black lines and blue dot). In the asymmetric profiles A and B, additional artificial layers with the minimum and maximum density of the Davos snow profile were inserted. For these highly asymmetric slabs (grey lines in Fig. 3) there are deviations between the models. Of course, the uniform model cannot represent any differences induced by the layering. However, the layered load model and the mechanical model show good agreement over the entire angle range, whereby the deviations slightly increase with increasing slope angles.
4.1 Normal vs. vertical PST ends
PSTs with slope-normal and vertical ends showed large differences in the measured critical cut length. These differences can be explained with the different PST geometries and the corresponding slab-induced loading of the weak layer. We assume that PST beams were long enough so that the tail end of the PST beam remains mechanically unchanged when the saw cut is increased and is therefore not relevant (Bair et al., 2014). The constellation is as shown schematically in Fig. 1c. Even with no saw cut, the slope-normal PST geometry already has an “unsupported” portion of the slab above the weak layer (Fig. 4a, blue area at the right beam end). This additional load, in normal geometry, generates higher stresses in the weak layer (and higher energy release rate), leading to shorter critical cut lengths. The shorter critical cut lengths can therefore easily be attributed to this additional load. However, the extent of the difference depends on snowpack properties (e.g., slab thickness, density layering) and slope angle.
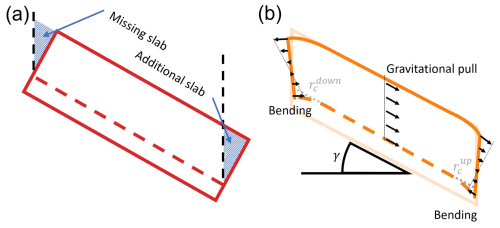
Figure 4(a) Schematic representation of a PST with normal ends and without a saw cut. The areas marked blue, at the right and left of the PST beam, indicate the additional and missing slab load, respectively, relative to vertical ends (dashed black lines). (b) PST with vertical ends and critical cut lengths and for upslope and downslope cutting, respectively. At both PST beam ends the saw cut leads to bending, which results in a stress profile across the slab thickness (black arrows). In the middle part of the PST, the black arrows represent stress in the slab due to the slope parallel gravitational pull. γ is the slope angle.
This emphasizes that a measured critical cut length can only be interpreted for stability assessment if the applied geometric PST configuration (including slope angle) is considered. In other words, our data show that two equal snowpacks, which should exhibit a similar crack propagation propensity, likely result in completely different critical cut lengths depending on how the PST beam ends were cut and on which slope angle the PST was performed. To ensure comparability of measured critical cut lengths, it is thus imperative to account for the geometrical configuration and snowpack layering using the models presented.
4.2 Upslope vs. downslope cutting
When cutting upslope, there is an additional part of the slab that induces an extra load on the weak layer in the slope-normal configuration (Fig. 4a, blue area at the right beam end). When cutting from the top, however, a part of the slab is missing, and there is less load (Fig. 4a, blue area at the left beam end). The critical cut length of the upslope cut is thus much shorter, in our experiments about 60 % shorter (left side in Fig. 2b).
In the vertical configuration, on the other hand, the load over the saw cut is always the same, independent of the cutting direction. The observed differences, however, come from the differences in shear stress at the crack tip. Indeed, at the weak layer, there are two shear stress components: (i) shear stress from the slope parallel gravitational pull on the slab (Fig. 4b, arrows in the middle) and (ii) bending-induced shear stresses (Fig. 4b, arrows at the left and right beam end). The slope parallel gravitational pull is always in the same direction (downslope). The bending-induced shear stresses at the height of the weak layer, on the other hand, are always in the cut direction. When cutting the weak layer from the bottom upwards, both contributions thus have an opposite effect and partially cancel each other out, while when cutting from the top, both shear stresses have the same sign and add up. This results in longer critical cut lengths when sawing upslope in vertical PSTs. In our measurements, these were 20 % longer (right side in Fig. 2b).
4.3 Models
Overall, the load models effectively explained our field results (Fig. 3a). If the RMSE of the uniform load model and layered load model is compared, the uniform load model performs slightly better than the layered load model. However, since our snowpack profiles show relatively homogeneous slabs without pronounced asymmetry (see Appendix D), we would not attach any significance to this minor difference, especially for inhomogeneous and asymmetrical slabs. We believe the layered load model is more accurate. This becomes clear in Fig. 3b. Profiles A and B have a density gradient within the slab (asymmetry). Deviations between the uniform and the layered load model seem plausible as higher-density layers which are close to the snow surface contribute more to the additional load present in slope-normal PSTs (blue areas in Fig. 4a) than if they are deeper in the snowpack. The difference in critical cut lengths is expected to be larger (profile A) or smaller (profile B) than predicted by the uniform load model.
Besides the overall good conversion performance of the models, a systematic offset for PSTs from 20 January 2021 seems to be present (orange dots in Fig. 3). We suspect that in these PSTs the beam length was too short: the ratio between slab thickness and beam length was only about 0.5 and the cut length to beam length ratio was 0.25. It is therefore very likely that the geometric difference at the tail end of the beam was also relevant (Bair et al., 2014). However, this is not considered in the models. Overall, our results thus show that the PST geometry plays an important role in the measured critical cut length, and this is mostly driven by differences in load from the slab.
Model application and limitation
PST datasets with different PST configurations can be homogenized using our models. This will increase the comparability and ultimately the scientific utility of these datasets. In addition, it is often the case that the PST ends are cut imprecisely (not perfectly vertical or slope-normal) on inclined terrain. The angle of the free edge can easily be determined from photos of the test, and a correction can then be applied using one of the load models with minor modifications (Appendix B). The scatter of the experimentally determined critical cut lengths should thus be reduced.
Besides applications, shortcomings of the suggested load models are evident. Although our experimental results show that the relationship is sufficiently accurate for the conversion of PST geometries, additional changes (e.g., different slope angles lead to different contributions of normal and shear loading of the weak layer, which may alter the critical loading that a weak layer can withstand, ultimately also influencing measured critical cut lengths) beyond the PST geometry are directly affecting model performance, so the relationship may no longer be sufficient. Imagine additional terms from factors A and contributions B in Eq. (1):
Both can have functional relationships on properties such as slope angle () and slab thickness ().
As long as such properties remain unchanged (, , the additional terms cancel each other out and our load models are applicable.
However, if the critical cut length measured at a certain slope angle and snow cover has to be transferred to a different situation, the applicability of our models still needs to be confirmed with more experimental work. If necessary, the functional relationships A and B will probably have to be identified and added. A more generally valid conversion for critical cut lengths would be of great practical benefit as it allows measured point information on crack propagation propensity to be extrapolated to other slope areas where experimental work is not possible.
This work has shown that the result of a PST, i.e., the measured critical cut length, is strongly influenced by the test geometry and cutting direction. PSTs with slope-normal beam ends (upslope cutting) systematically produce shorter critical cut lengths (48 % on average). It also makes a significant difference whether the saw cut in a PST is made in the upslope or downslope direction (deviations up to 60 %). Both deviations can be explained mechanically and are largely controlled by the difference in slab-induced loads. Based on the slab load, a load model was derived for uniform and for layered slabs. Both models agree well with the experimental results. The comparison with a more sophisticated validated fracture mechanical model shows good agreement between all models as long as the slab is largely homogeneous. For layered slabs, the uniform load model shows greater deviations. The layered load model, on the other hand, shows only minor deviations. This demonstrates that the fracture mechanical model (LMM) is also largely load-driven in this specific application. Overall, our results show that the interpretation of measured critical cut length in a PST is not straightforward, as it is influenced by weak-layer properties (specific fracture energy), slab properties (e.g., layering), and test geometry.
Based on our findings, we show that PSTs with slope-normal ends and a saw cut in the upslope direction (Fig. 1a) lead to the shortest critical cut lengths. Hence, this procedure gives us the most conservative information on crack propagation propensity (without post-processing). In addition, shorter critical cut lengths ensure that the overall column length is less likely to influence test results. However, the disadvantage of this approach is the greater effect of slope angle on critical cut lengths than for vertically cut PSTs. In order to compare tests on different slopes, this effect must be compensated for, which is not yet straightforward. For an unbiased interpretation of PST results, experiments therefore need to be post-processed before results from different snow packs, slope inclinations, etc. are compared or combined.
In general, the use of consistent PST standards will ensure that PST results are easy to interpret, will ensure scientific rigor, and will improve the comparability of tests and their results. In addition, standardization and conversion models facilitate the comparison of results between researchers, leading to a deeper understanding of snowpack behavior. Practitioners also benefit from standardized methods and interpretation aids that are invaluable in assessing avalanche risk based on stability tests.
The load above the saw cut of a PST with slope-vertical geometry (V-PST) is independent of the slope angle. However, the load of a PST with slope-normal edges (N-PST) is not. In sloped terrain, a N-PST has more load above the saw cut than a V-PST. The difference depends on the slope angle, but the layering also has an influence. Layers close to the snow surface contribute more to the extra load than layers close to the weak layer (of the saw cut). In order to express the relationship between critical cut lengths (, ), the loads of layered snowpacks (mV, mN) have to be formulated through density ρi, thickness hi, and the vertical location zi of the slab layers i (Fig. A1).
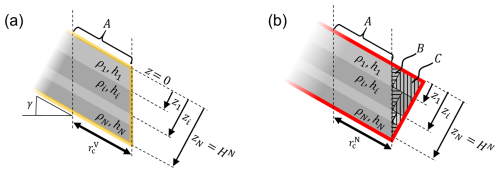
Figure A1(a) Schematic representation of a layered slab in a PST with slope-vertical geometry (V-PST). (b) PST with slope-normal geometry (N-PST). In both cases, “A” indicates the volume of the slab above the saw cut . The mass of volume A depends on column width b (not indicated), on , and on the density ρi and thickness hi of the slab layers i. In (b), the load of the N-PST depends additionally on the slope angle as volumes B and C of each layer i increase with increasing angle.
First for the simpler case of a V-PST (Fig. A1a) the mass mV is given by
In the N-PST volumes B and C also contribute to the overall mass located above the saw cut:
The expression for the mass of volume A remains the same as that given in Eq. (A1). Now, however, the critical crack length is relevant instead of . The masses mB and mC are given by
Putting this together results in the overall mass of
Inserting in Eq. (A1) results in the layered load model providing the relation between the critical cut lengths and :
The equations derived in Appendix A can be used to formulate a model to correct for imprecisely cut PST beam ends. For example, the sawing edge of a PST was close to cutting slope-normal but with a deviation of angle β from the normal to the slope (or vertical). As a result, the critical cut length is measured in such an experiment. To account for this deviation, we have to add a mass mD in Eq. (A2). Note that this “mass” can be negative in the case β is negative (less overhanging mass than the slope-normal cut). The mass mD has the same contributions as mB and mC but is computed from the angle of error β:
At the end, the loads (Eq. 1) provide the relation between the critical cut lengths:
By inserting the formulations for mA (Eq. A1), the formula to correct an imprecisely cut N-PST is derived as
Table C1Results of 27 pairs of PSTs. Critical cut lengths and indicate whether PST beam ends were cut vertically or slope-normally. Slab thickness HN was measured in the slope-normal direction. Slope angle is provided in degrees. For further snowpack data, refer to Appendix D.
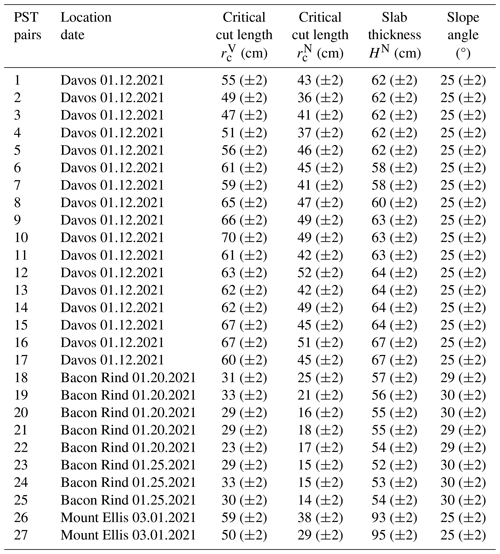
At each of our four field sites we took a manual profile including density measures. The following four figures are excerpts from the corresponding snow profile databanks.
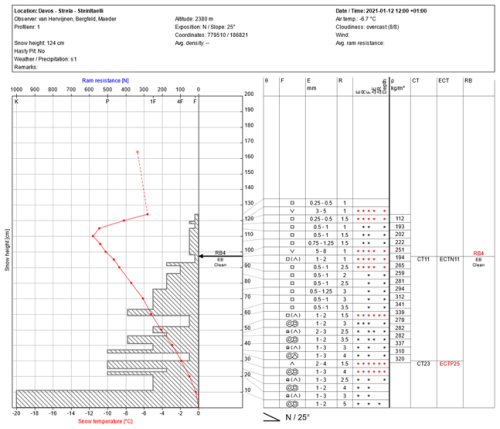
Figure D1Manual profile taken at the Davos field site. The hashed area on the left side represents the hand hardness with snow height, and the red line shows snow temperature with snow height. On the right side, grain type, grain size, hand hardness, lemons, and snow density are given. On the very right, stability test results are written at the height of the tested weak layer.
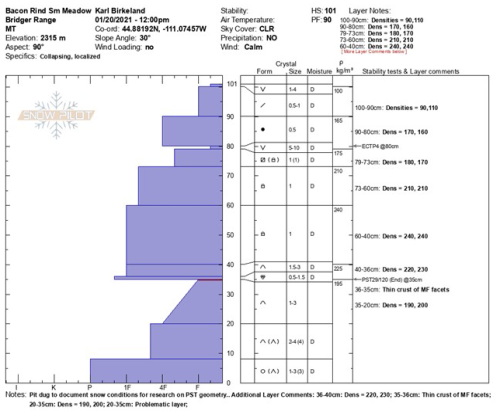
Figure D2Manual profile taken at the Bacon Rind field site on 20 January 2021. The blue area on the left side represents the hand hardness with snow height. On the right side, grain type, grain size, moisture, and snow density are given. On the very right, stability test results are written at the height of the tested weak layer.
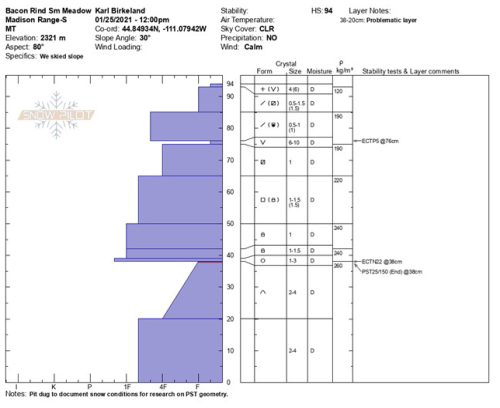
Figure D3Manual profile taken at the Bacon Rind field site on 25 January. The blue area on the left side represents the hand hardness with snow height. On the right side, grain type, grain size, moisture, and snow density are given. On the very right, stability test results are written at the height of the tested weak layer.
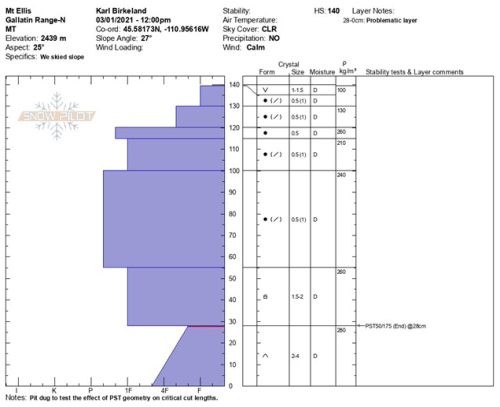
Figure D4Manual profile taken at the Mount Ellis field site on 25 January. The blue area on the left side represents the hand hardness with snow height. On the right side, grain type, grain size, moisture, and snow density are given. On the very right, stability test results are written at the height of the tested weak layer.
The LMM can be found at https://doi.org/10.5281/zenodo.5773113 (Rosendahl et al., 2022). The load models were computed with the formula provided in Eq. (A6). No software package was used.
All necessary data are summarized in Tables C1 and C2. Additional metadata are provided in Figs. D1–D4.
BB, AvH, and KB designed the project and collected the field data. BB and AvH developed the ULM and LLM. VA and PR applied the LMM. All authors contributed to the interpretation of the results. BB prepared the original draft, which was reviewed and edited by all authors.
The contact author has declared that none of the authors has any competing interests.
Publisher's note: Copernicus Publications remains neutral with regard to jurisdictional claims made in the text, published maps, institutional affiliations, or any other geographical representation in this paper. While Copernicus Publications makes every effort to include appropriate place names, the final responsibility lies with the authors.
This article is part of the special issue “Latest developments in snow science and avalanche risk management research – merging theory and practice”. It is a result of the International snow science Workshop, Bend, Oregon, USA, 8–13 October 2023.
We would like to thank Flavia Maeder, Erika Birkeland, and Alex Marienthal for assisting in the field.
This research has been supported by the Schweizerischer Nationalfonds zur Förderung der Wissenschaftlichen Forschung (grant no. 200021_169424) and the Deutsche Forschungsgemeinschaft (grant no. 460195514).
This paper was edited by Ingrid Reiweger and reviewed by two anonymous referees.
Bair, E. H., Simenhois, R., van Herwijnen, A., and Birkeland, K.: The influence of edge effects on crack propagation in snow stability tests, The Cryosphere, 8, 1407–1418, https://doi.org/10.5194/tc-8-1407-2014, 2014.
Bergfeld, B., van Herwijnen, A., Reuter, B., Bobillier, G., Dual, J., and Schweizer, J.: Dynamic crack propagation in weak snowpack layers: insights from high-resolution, high-speed photography, The Cryosphere, 15, 3539–3553, https://doi.org/10.5194/tc-15-3539-2021, 2021.
Bergfeld, B., van Herwijnen, A., Bobillier, G., Larose, E., Moreau, L., Trottet, B., Gaume, J., Cathomen, J., Dual, J., and Schweizer, J.: Crack propagation speeds in weak snowpack layers, J. Glaciol., 68, 557–570, 2022.
Bergfeld, B., van Herwijnen, A., Bobillier, G., Rosendahl, P. L., Weißgraeber, P., Adam, V., Dual, J., and Schweizer, J.: Temporal evolution of crack propagation characteristics in a weak snowpack layer: conditions of crack arrest and sustained propagation, Nat. Hazards Earth Syst. Sci., 23, 293–315, https://doi.org/10.5194/nhess-23-293-2023, 2023.
Birkeland, K. W., van Herwijnen, A., Reuter, B., and Bergfeld, B.: Temporal changes in the mechanical properties of snow related to crack propagation after loading, Cold Reg. Sci. Technol., 159, 142–152, 2019.
CAA: Technical Aspects of Snow Avalanche Risk Management-Resources and Guidelines for Avalanche Practitioners in Canada, Canadian Avalanche Association, Revelstoke, BC, Canada, ISBN 978-1-926497-00-6, 2016.
Fierz, C., Armstrong, R. L., Durand, Y., Etchevers, P., Greene, E., McClung, D. M., Nishimura, K., Satyawali, P. K., and Sokratov, S. A.: The International Classification for Seasonal Snow on the Ground, IHP-VII Technical Documents in Hydrology No. 83, IACS Contribution No. 1, UNESCO-IHP, Paris, https://unesdoc.unesco.org/ark:/48223/pf0000186462 (last access: 21 January 2025), 2009.
Gaume, J., van Herwijnen, A., Chambon, G., Wever, N., and Schweizer, J.: Snow fracture in relation to slab avalanche release: critical state for the onset of crack propagation, The Cryosphere, 95, 217–228, https://doi.org/10.5194/tc-11-217-2017, 2017.
Gauthier, D. and Jamieson, J. B.: Towards a field test for fracture propagation propensity in weak snowpack layers, J. Glaciol., 52, 164–168, https://doi.org/10.3189/172756506781828962, 2006.
Gauthier, D. and Jamieson, B.: Fracture propagation propensity in relation to snow slab avalanche release: Validating the Propagation Saw Test, Geophys. Res. Lett., 35, L13501, https://doi.org/10.1029/2008GL034245, 2008.
Greene, E., Birkeland, K. W., Elder, K., McCammon, I., Staples, M., Sharaf, D., Trautman, S., and Wagner, W.: Snow, Weather, and Avalanches: Observation Guidelines for Avalanche Programs in the United States, American Avalanche Association, Denver, CO, USA, 110 pp., ISBN 979-8218057657, 2022.
Heierli, J., Gumbsch, P., and Zaiser, M.,: Anticrack nucleation as triggering mechanism for snow slab avalanches, Science, 321, 240–243, 2008.
McClung, D. M.: Dry snow slab quasi-brittle fracture initiation and verification from field tests, J. Geophys. Res.-Earth, 114, F01022, https://doi.org/10.1029/2007JF000913, 2009.
Rosendahl, P. L. and Weißgraeber, P.: Modeling snow slab avalanches caused by weak-layer failure – Part 1: Slabs on compliant and collapsible weak layers, The Cryosphere, 14, 115–130, https://doi.org/10.5194/tc-14-115-2020, 2020.
Rosendahl, P. L., Schneider, J., and Weissgraeber, P.: Weak Layer Anticrack Nucleation Model (WEAC), Zenodo [code], https://doi.org/10.5281/zenodo.5773113, 2022.
Schweizer, J., Reuter, B., van Herwijnen, A., and Gaume, J.: Avalanche release 101, in: Proceedings ISSW 2016, International Snow Science Workshop, 3–7 October 2016, Breckenridge CO, USA, 1–11, https://arc.lib.montana.edu/snow-science/item.php?id=2235 (last access: 21 January 2025), 2016.
Sigrist, C. and Schweizer, J.: Critical energy release rates of weak snowpack layers determined in field experiments, Geophys. Res. Lett., 34, L03502, https://doi.org/10.1029/2006GL028576, 2007.
Simenhois, R. and Birkeland, K. W.: The effect of changing slab thickness on fracture propagation, in: Proceedings ISSW 2008, International Snow Science Workshop, 21–27 September 2008, Whistler, Canada, 755–760, https://arc.lib.montana.edu/snow-science/item.php?id=125 (last access: 21 January 2025), 2008.
van Herwijnen, A., Gaume, J., Bair, E. H., Reuter, B., Birkeland, K. W., and Schweizer, J.: Estimating the effective elastic modulus and specific fracture energy of snowpack layers from field experiments, J Glaciol, 62, 997–1007, 2016.
Weißgraeber, P. and Rosendahl, P. L.: A closed-form model for layered snow slabs, The Cryosphere, 17, 1475–1496, https://doi.org/10.5194/tc-17-1475-2023, 2023.


