the Creative Commons Attribution 4.0 License.
the Creative Commons Attribution 4.0 License.
 | 28 Mar 2025
Causes, consequences and implications of the 2023 landslide-induced Lake Rasac glacial lake outburst flood (GLOF), Cordillera Huayhuash, Peru
Adam Emmer
Oscar Vilca
Cesar Salazar Checa
Simon Cook
Elena Pummer
Jan Hrebrina
Wilfried Haeberli
Glacierised Peruvian mountain ranges are experiencing accelerated, climate-change-driven glacier ice loss. Peru's second highest mountain range, the Cordillera Huayhuash, has lost about 40 % (∼ 34 km2) of its glacier cover since the 1970s. Newly exposed landscapes are prone to a number of hazard processes including the formation and evolution of glacial lakes, changing stability conditions of mountain slopes, and rapid mass movements. In this study, we integrate the analysis of meteorological data, remotely sensed images and field observations in order to document the most recent (February 2023) large mass-movement-induced glacial lake outburst flood (GLOF) from the moraine-dammed Lake Rasac. The GLOF was triggered by a mass movement from the failure of a part of an arête ridge (i.e. narrow ridge separating parallel glacial valleys) with an estimated volume of 1.1×10⁶ m3–1.5×10⁶ m3. This occurred in a rock zone where climate information – primarily from reanalysis data – indicates cold, deep permafrost and was preceded by several small-magnitude precursory rockfall events. The reduced stability of the frozen rocks in the detachment zone is most likely related to deep warming but not to especially critical conditions of warm permafrost with higher amounts of unfrozen water. Further, we describe the surprisingly short-distance process chain (attenuated by Lake Gochacotan, located 3.5 km downstream from the detachment zone) and analyse the transport of large boulders with the use of hydrodynamic modelling, revealing that flow velocities >5 m s−1 must have been reached in the case of translational motion and >10 m s−1 in the case of rotational motion of the largest transported boulders (diameter >3.5 m). In addition, we analyse climate trends over the past 8 decades and meteorological conditions in the days prior to the GLOF, revealing a statistically significant temperature increase trend over the past 8 decades, as well as an atmospheric temperature rise and positive thermal anomaly in different soil layers before the event. We argue that climate change effects (warming air and permafrost temperatures) served to hasten the failure. This study helps us to understand (i) mechanisms, amplification and attenuation elements in GLOF process chains and (ii) frequency–magnitude relationships of extreme geomorphic processes that undergo alteration due to the rapidly changing high-mountain environments on a regional scale (both large-magnitude rockfalls and GLOFs). This study supports earlier work that indicated an increasing frequency of large mass-movement-induced GLOFs originating from the warming cryosphere in recent decades.
- Article
(12433 KB) - Full-text XML
-
Supplement
(5422 KB) - BibTeX
- EndNote


The world's high-mountain regions are losing glacier ice and permafrost at an accelerated pace in response to climate change (Hugonnet et al., 2021), with important implications for downstream areas (Clague et al., 2012; Knight and Harrison, 2013; Huss et al., 2017; Immerzeel et al., 2020). There are growing concerns about potentially disastrous, far-reaching process chains originating from a warming cryosphere (Haeberli et al., 2017; Ding et al., 2021), as exemplified by recent disasters such as the 2020 Lake Jinwuco outburst (Zheng et al., 2021), the 2021 rock and ice avalanche in Chamoli in India (Shugar et al., 2021), the 2022 Marmolada glacier collapse in Italy (Bondesan and Francese, 2023; Olivieri and Bettanini, 2023), and the 2023 South Lhonak Lake cross-border outburst impacting vast areas along the Teesta River in India and Bangladesh (SANDRP, 2023). Among the hazard processes of greatest concern for mountain communities and foothill areas are glacial lake outburst floods (GLOFs) – sudden releases of water from glacial lakes (Costa and Schuster, 1988; Korup and Tweed, 2007; O'Connor et al., 2013; Emmer et al., 2021; Zhang et al., 2024).
The Peruvian Andes have witnessed >100 GLOFs in the past century, some of which have had catastrophic consequences (Carey, 2005; Emmer et al., 2022b). Strikingly, the two cordilleras located in northern Peru (Cordillera Blanca and Cordillera Huayhuash) exhibit a higher concentration of major GLOFs (Kinzl et al., 1954; Zapata, 2002), including the 1941 Lake Palcacocha disaster that destroyed part of Huaraz (Huggel et al., 2020; Wegner, 2024). The most recent catastrophic Peruvian GLOF was the 2020 GLOF triggered by an ice–rock avalanche at the moraine-dammed Lake Salkantaycocha in Cordillera Vilcabamba in 2020 (Vilca et al., 2021). Emmer et al. (2020) showed that while major GLOFs induced by moraine dam failure in the late 1930s to early 1950s were predominantly triggered by ice avalanches and calving processes, more recent events such as the 2020 Salkantaycocha GLOF were more frequently triggered by landslides and rockfalls. Despite recent advances in compiling GLOF inventories (Emmer et al., 2022a; Veh et al., 2022; Lützow et al., 2023), forecasting and predicting GLOF occurrence in space and time is challenging due to (i) a wide range of possible combinations of lake and dam characteristics favouring GLOF occurrence, triggers and mechanisms (Emmer and Cochachin, 2013); (ii) the often non-periodic, one-off nature of GLOFs (especially GLOFs originating from bedrock- and moraine-dammed lakes; Lützow et al., 2023); and (iii) dynamic conditions, including the evolution of proglacial lakes driven by glacier retreat (Shugar et al., 2020), and changing slope stability conditions driven by glacier recession and permafrost warming (Stoffel and Huggel, 2012; Haeberli et al., 2017). Therefore, the frequency–magnitude relationship and derived recurrence interval approaches traditionally used in flood hazard assessments on a catchment scale cannot be applied to GLOFs; the estimates of GLOF probabilities are instead derived from detailed understanding of past events at a regional scale, with consideration for how future conditions will evolve (Haeberli et al., 2022; Emmer, 2024).
This study aims to examine the preconditions, triggers and impacts of the 2023 Lake Rasac GLOF triggered by large ice–rock failure (Cordillera Huayhuash) and to discuss whether and, if so, to what extent this event can be attributed to climate change. The importance of documenting such events lies in better evidence-driven understanding of (i) mechanisms as well as amplification and attenuation elements in GLOF process chains and (ii) altering frequency–magnitude relationships of extreme processes in rapidly changing high-mountain environments on a regional scale (both high-magnitude rockfalls and GLOFs). Such outcomes can serve the scientific community (in particular geomorphologists, natural hazard scientists and process chain model developers) as well as disaster risk reduction authorities and practitioners.
2.1 The Cordillera Huayhuash
The Cordillera Huayhuash (10.0–10.5° S, 76.8–77.0° W; Fig. 1), located 200 km north of Lima, is the second highest mountain range in Peru (Nevado Yerupajá, 6617 m a.s.l.), covering an area of nearly 1200 km2 (INAIGEM, 2018). The geological setting of Cordillera Huayhuash is complex and comprises faulted and folded Cretaceous sedimentary carbonates of marine origin, Tertiary silicic volcanic rocks, and intrusive rocks (tonalite, granite, granodiorite, diorite), in places covered by Quaternary deposits of glacial and glaciofluvial origin, alluvium and colluvium. The main fault zone is oriented in the north–south direction and is parallel to the main massif of the Cordillera Huayhuash (IGM, 1975; Hall et al., 2009). Situated in the outer tropics, the climate of the Cordillera Huayhuash is characterised by relatively consistent temperatures year-round, with minimal seasonal variation. Air temperatures are about 1–2 °C warmer during the austral summer compared to the austral winter (Rabatel et al., 2013). The Cordillera Huayhuash exhibits a pronounced east–west precipitation gradient, with considerably wetter conditions on the eastern side, and approximately 75 % of the annual precipitation occurs between November and April (Bookhagen and Strecker, 2008; Hall et al., 2009)
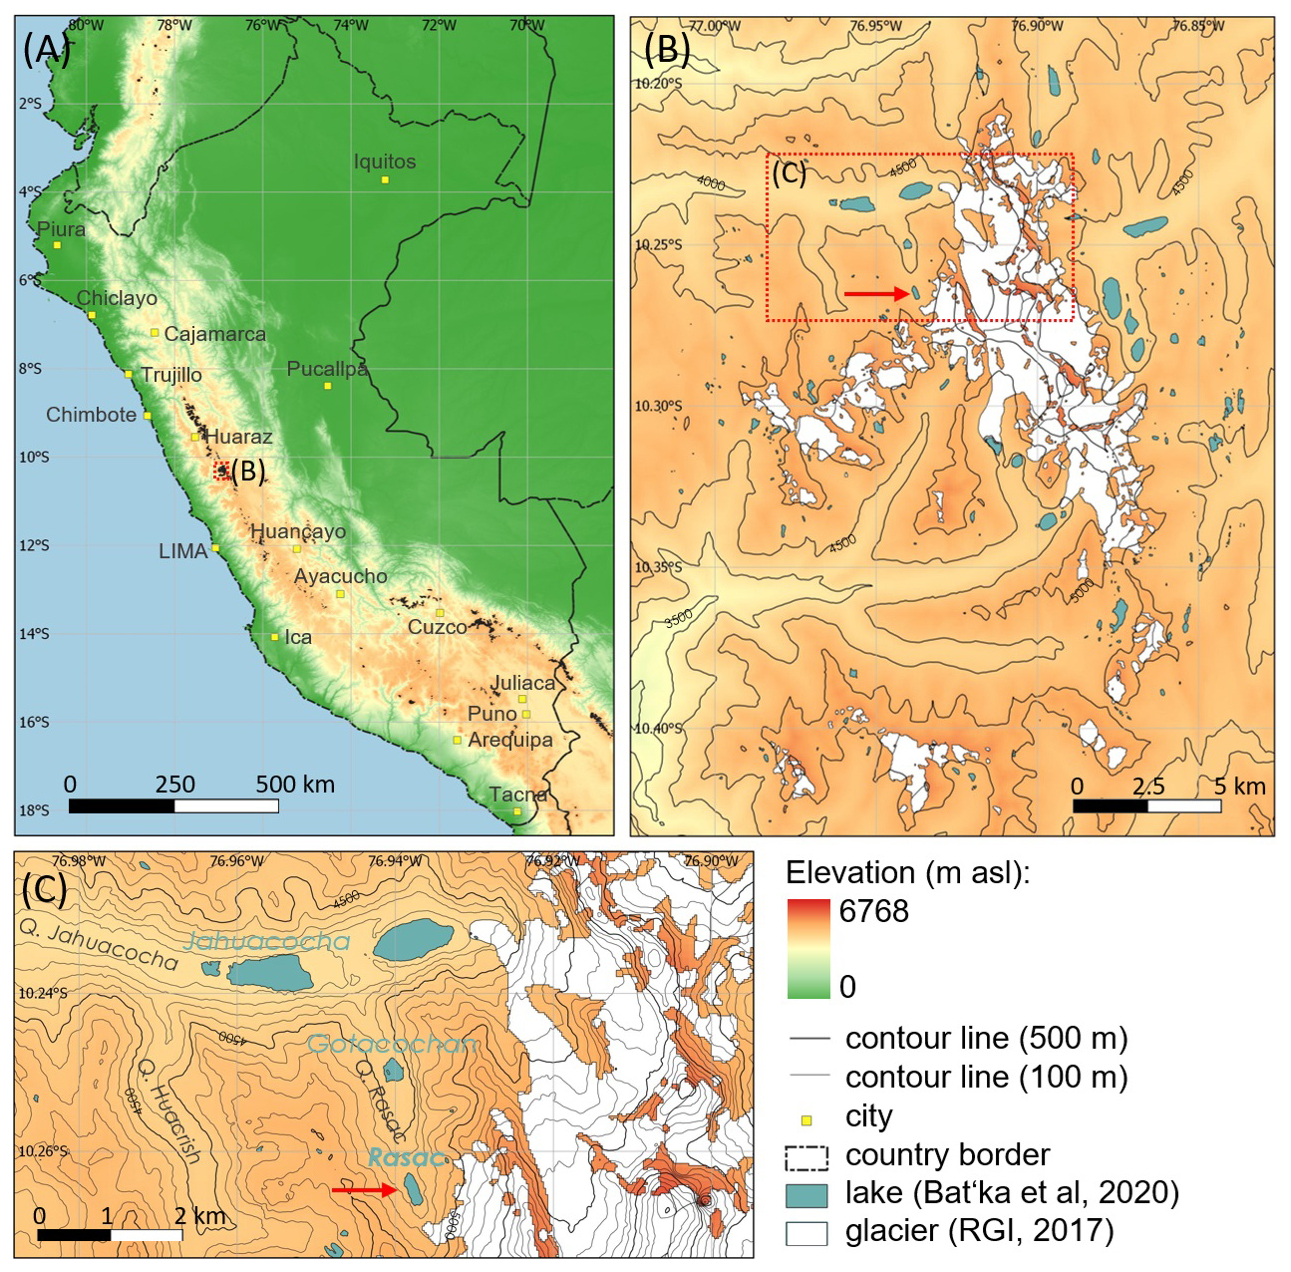
Figure 1Location of the Cordillera Huayhuash in Peru (a); lakes (Bat'ka et al., 2020), glaciers (RGI Consortium, 2017) and topography (ASF, 2024) of the Cordillera Huayhuash (b) and detail of the upper Jahuacocha and Rasac valleys (c).
The high-elevation areas of the Cordillera Huayhuash (above approximately 4500–5000 m a.s.l.) are glacierised and exhibit several generations of moraines from past glaciations (Hall et al., 2009). The last significant glacier advance occurred during the Little Ice Age, which subsided in the second half of the 19th century. According to INAIGEM (2018), the total glacier extent decreased from 86.89 km2 in 1975 to 53.06 km2 in 2016. The estimated average snow-line altitude (an approximation of equilibrium altitude) was 5051 m a.s.l. in 1986–2005 (McFadden et al., 2011), and this elevation has most likely increased since then. Repeated Holocene advance–retreat cycles of glaciers preconditioned the formation of different types of glacial lakes. Using Landsat imagery with a resolution of 30 m, Wood et al. (2021) mapped 129 lakes with a total area of 6.92 km2, within a 1 km buffer distance from the glaciers, while Bat'ka et al. (2020) used high-resolution (sub-metre) images from the Google Earth collection to map 270 lakes with a total area of 6.32 km2 in the whole Cordillera Huayhuash. This implies that accounting for small lakes influences the total number of mapped lakes while large lakes control total lake area. One of these lakes – Rasac ( S, W; 4654 m a.s.l.) – and the GLOF it produced in 2023 are the subject of this study (see Sect. 2.2).
2.2 Lake Rasac
Lake Rasac (Figs. 1 and 2) was a moraine-dammed water body located at 4654 m a.s.l. behind the moraine deposited by Rasac glacier in the north-facing Rasac valley, a left bank tributary of the Jahuacocha/Achin stream (Salazar and Valverde, 2022). Considering the elevation of this moraine and its position in the valley system of moraine assemblages, it is assumed they were last reached during the Little Ice Age advance. While the lake did not have surface outflow (dam freeboard was 10–15 m, depending on lake water level), it was drained by a system of subsurface channels through the moraine dam and the water level (area and volume) fluctuated both inter- and intra-seasonally. The area of the lake varied between 53 000 and 64 000 m2 (ANA, 2014; INAIGEM, 2018) and the depth was not known. Using the empirical equation developed by Muñoz et al. (2020), the estimated mean lake depth is 5 m and so the estimated lake volume is approximately 300 000 m3. Another lake – Gochacotan ( S, W; 4285 m a.s.l.) – is located approx. 1.5 km downstream from Lake Rasac (see Fig. 2).
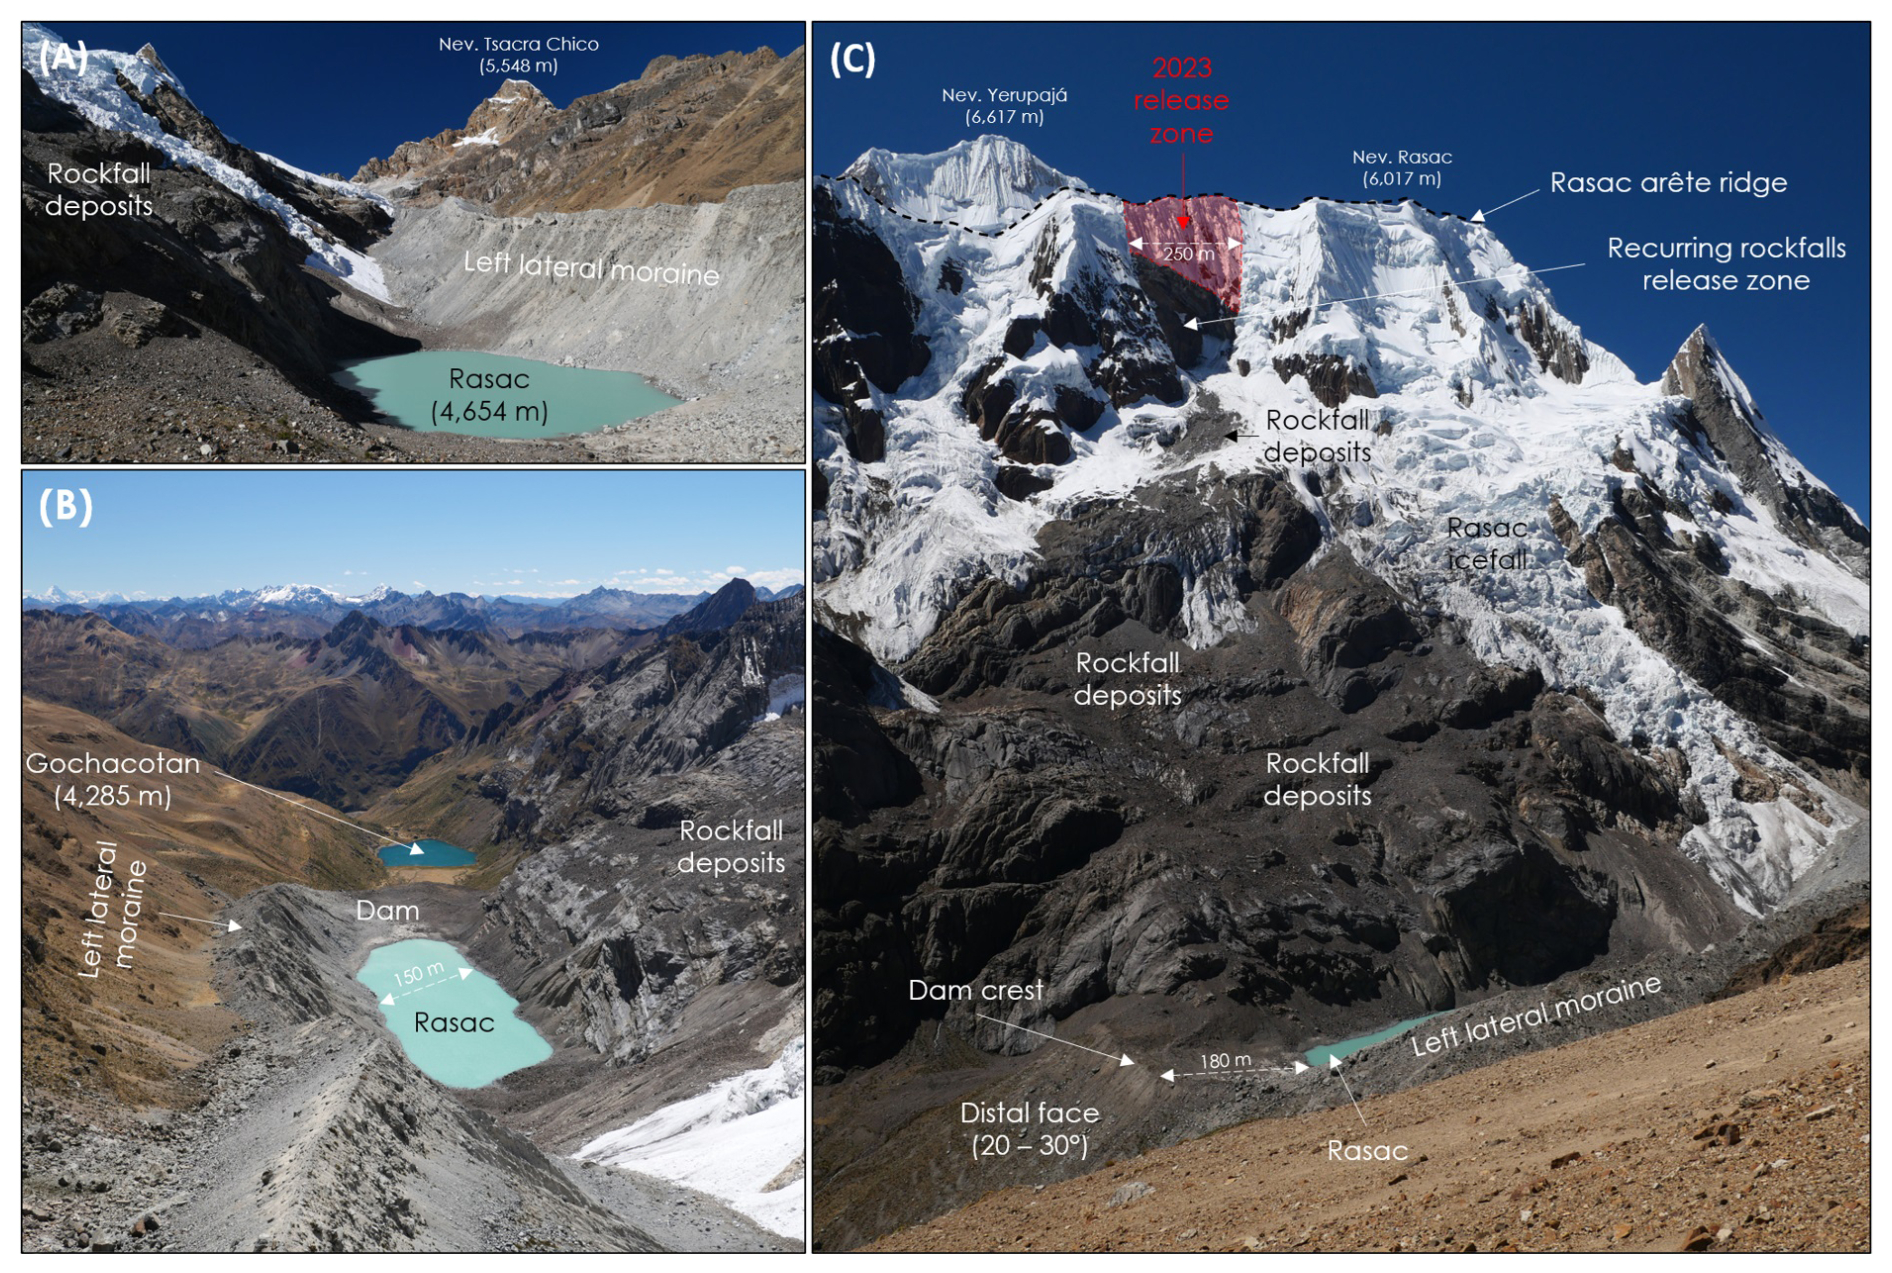
Figure 2Lake Rasac and its surroundings in July 2019. (a) Upstream view towards the head of the Rasac valley (looking south); (b) downstream view towards both lakes Rasac and Gochacotan (looking north) from near Rasac peak (5129 m a.s.l.); (c) a view towards the Rasac arête ridge (looking east), with the 2023 release zone highlighted. Field images: Adam Emmer.
Bat'ka et al. (2020) conducted a comprehensive assessment of mountain range-wide GLOF susceptibility of 46 lakes larger than 20 000 m2. They found that for Lake Rasac, the most probable GLOF scenario involved dam overtopping as a result of a landslide into the lake and ranked this lake as the 16th most susceptible from all assessed lakes in the Cordillera Huayhuash (other moraine-dammed lakes reached higher scores because of their surface outflows; see the assessment methodology of Emmer and Vilímek, 2014).
3.1 Remotely sensed data and analysis
We analysed satellite images and derived products (such as digital elevation models, DEM; see Table 1) from various sources for event description and geomorphic interpretation. These data were used to (i) characterise mapped features from high-resolution optical images (e.g. area of the lake, areas of landslide release and GLOF impact zones, location of largest transported boulders), (ii) derive topographical and morphometric characteristics (e.g. a slope of the longitudinal profile along the process chain), and (iii) narrow down the timing of the GLOF from images with fine temporal resolution (Planet and Sentinel images). Further, we cross-checked the interpretation of remotely sensed images against field observations (field visit in July 2019; post-event field images and testimony of an eyewitness – a member of the community settled in the Rio Jahuacocha valley a few kilometres downstream). All the analyses of remotely sensed images were undertaken in the open-source QGIS software (https://qgis.org/, last access: 18 March 2025).
Table 1Remotely sensed data used in this study.
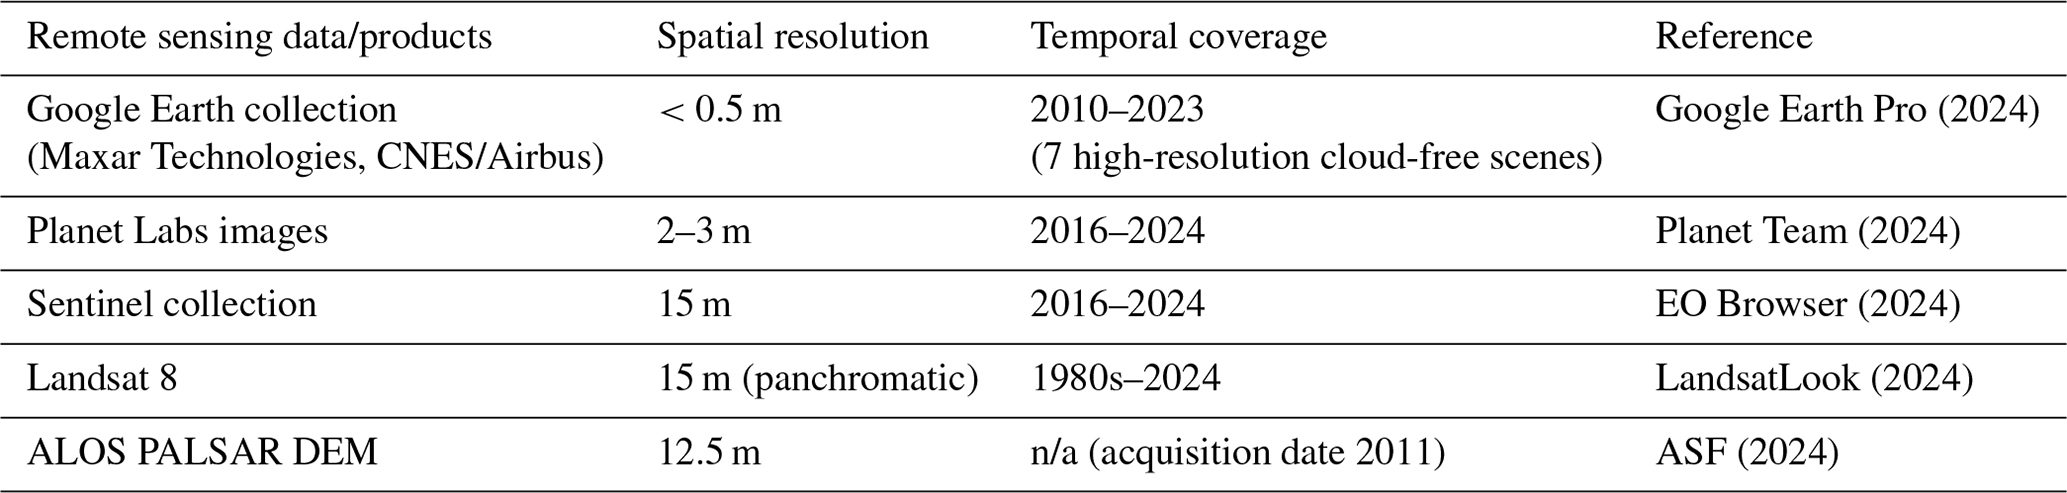
n/a: not applicable.
3.2 Climate data and analysis
3.2.1 Climate trends
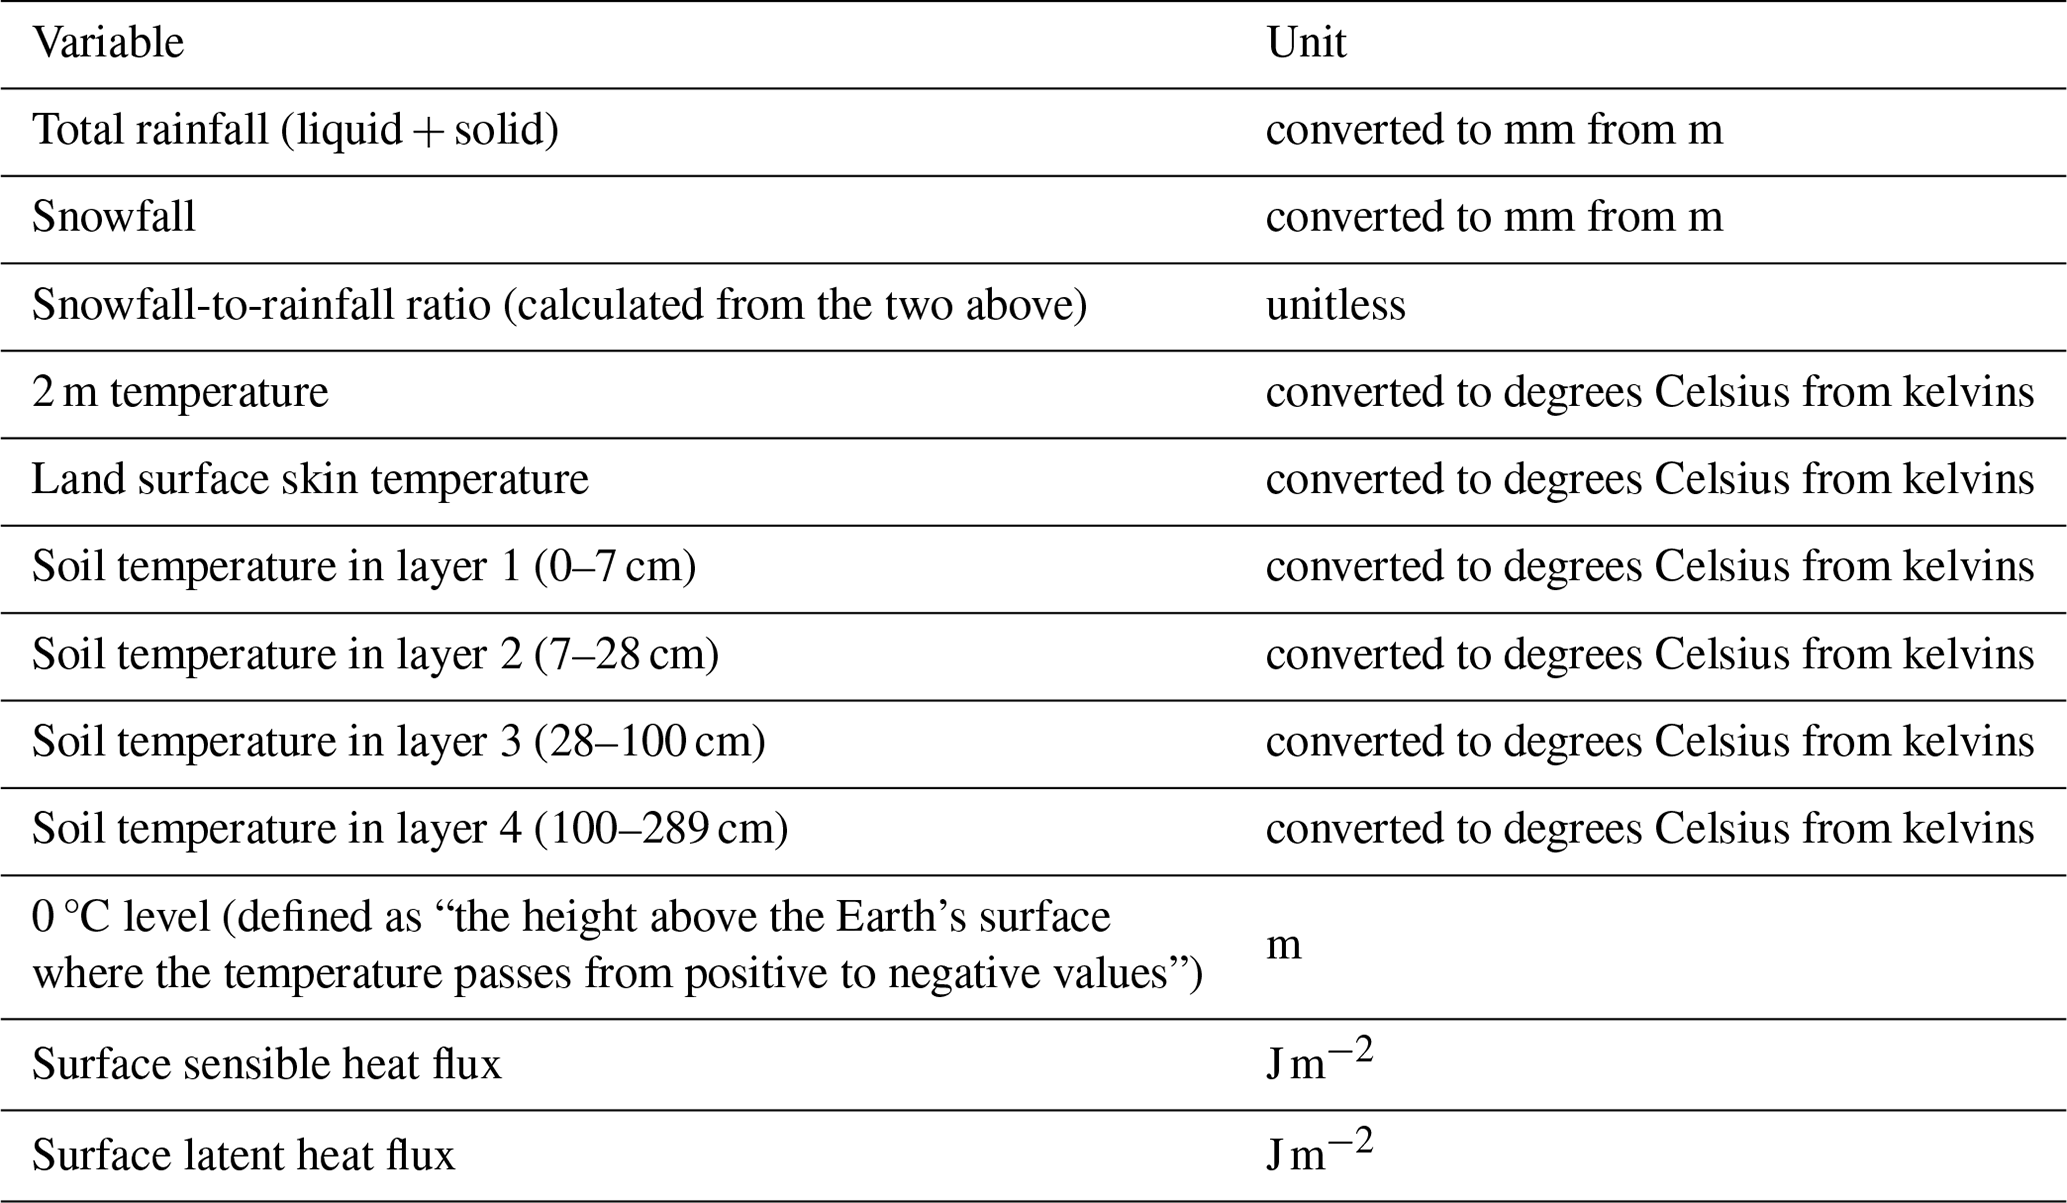
Given that meteorological station records in Peru are very sparse and limited (none of which have consistent records going to 2023), we employed the state-of-the-art ERA5 gridded reanalysis products (∼ 31 km horizontal resolution) with records starting in 1940 through the present, from the European Centre for Medium-Range Weather Forecasts (Hersbach et al., 2020). The list of variables analysed is detailed in Table 2. For the climate analysis, we used the average value over a 1° × 1° box (−77.5°, −76.5°, −10.75°, −9.75°) covering Rasac, representing the meteorological conditions of the lake, to investigate (1) the long-term trend over the past 8 decades 1940–2023 and (2) the anomalous states (compared with the climatological mean averaged over 1981–2010) that occurred in the near-surface atmosphere and in the land surface and subsurface of different soil layers for the time period prior (up to 2 years) to the event. Monthly products were used to analyse the climate trends and daily products were used to analyse the anomalous conditions prior to the GLOF event. The atmospheric circulation variables zonal (U) wind, meridional (V) wind and geopotential height at different vertical levels (850, 500 and 250 hPa, representing the lower, middle and upper troposphere) were also extracted from ERA5 covering the region (−85.0, −65.0, −20.0, and 0.0°) to investigate any possible anomalous circulation patterns associated with the event but did not reveal any notable changes prior to the event and are hence not shown here. It should be noted that the variables from ERA5 are not directly assimilated but are generated by the atmospheric components of the Integrated Forecast System (IFS) modelling framework.
Table 2Climate variables analysed from ERA5 products in this study.
3.2.2 Climate change attribution
We use the meteorological variables averaged over the 1° × 1° box covering Rasac, taking the February 1 d maximum as the event definition. As outlined in Philip et al. (2020), we assess how the likelihood of occurrence of the event has changed due to anthropogenic climate change. We use a generalised extreme value (GEV) distribution that scales with global mean surface temperature – GMST (i.e. using GMST as covariate, Philip et al., 2020, and Van Oldenborgh et al., 2021). The resulting probability ratio for the event is calculated for the comparison between the climate of 2023 and the pre-industrial climate – 1.2 °C cooler than the current climate. The probability ratio is calculated as the probability of occurrence under the current climate divided by the probability of occurrence under the pre-industrial climate.
We acknowledge that in typical statistical event attribution studies, climate model outputs are also analysed (often taken from the most up-to-date Coupled Model Intercomparison Project global Earth system models or regional model experiments) through model validation or multi-method attribution (combining observed and model results) to arrive at a synthesised attribution statement. In this study, we did not perform analyses based on climate model outputs for two reasons: (1) the Rasac 2023 GLOF was a localised event with no identifiable impact on humans and the built environment and was not directly triggered by meteorological variables but triggered by mass movements (as detailed below) and (2) the attribution of temperature anomalies is mainly to demonstrate the anthropogenic climate change impact on local warming associated with the GLOF rather than establishing a causal chain directly linking meteorological anomaly to the GLOF occurrence.
3.3 Hydrodynamic analysis
If the slope conditions and the composition of the terrain are known and there is clear evidence of deposited boulders and cobbles, the minimum water velocity that moved them can be estimated. Various empirical relationships exist for calculating the critical flow velocity and shear stress required to initiate particle motion (Van Rijn, 2019). However, these formulae are predominantly derived for fine spherical sediments or stones and under boundary conditions that do not align with the impulse waves generated by landslides. To calculate boulder transport, we employ a method considering the balance of forces and torque acting on boulders modelled as simplified rectangular shapes (Bressan et al., 2018). Since there is no available survey detailing the size and shape of the boulders in the impact area for this analysis, we assume that the boulder's dimensions are characterised by a height half the size of their width and length, which are considered equal. This assumption aims to approximate the realistic shape of boulders where, typically, the boulder height does not match the width and length. Like other sediment transport phenomena, the forces acting on the boulder include the following.
Here, g stands for acceleration due to gravity (9.81 m s−2), V is the volume of the boulder (m3), Vw is the submerged volume based on the water depth h (m), ρs is boulder density (for granodiorite we assumed 2700 kg m−3), ρw is water density (1000 m3 s−1), Af represents the front wetted area of the boulder (m2) based on the water depth h (m), Ab represents the bottom area of the boulder (m2) and v is the depth-averaged approaching speed velocity (m s−1). The drag coefficient Cd is assumed to be 2.05 for a partially submerged boulder and 1.05 for a fully submerged boulder of cubic shape (Bressan et al., 2018). Cl is the lift coefficient with a constant value of 0.178, and μ is the friction coefficient with a constant value of 0.5 (Nott, 2003; Lorang, 2011; Bressan et al., 2018). The current literature does not provide comprehensive guidelines for boulder transport. Friction, drag and lift coefficients, as used in our study, are sourced from the general literature (Çengel and Cimbala, 2013). Accurate determination of these coefficients would require specific experimental or mathematical models, which are beyond the scope this study.
By applying a force balance in the direction of flow and a torque balance around the rear edge of the boulder, the required velocity v (m s−1) to disrupt this balance and initiate the incipient motion of the boulder can be calculated. It is assumed that if the velocity disrupts the force balance, translational motion begins, while if the velocity disrupts the torque balance, rotational motion is initiated (Nandasena and Tanaka, 2013; Bressan et al., 2018). It is evident from the above discussion that certain parameters are contingent on water depth. Due to the absence of data, a simplified relationship between wave depth and averaged velocity must be assumed.
3.4 Assessment of permafrost conditions
The assessment of permafrost conditions is based on the analysis of Google Earth images, (sparse) climatic information, experience of borehole temperatures available in Europe, and scientific literature about the slope stability of ice-clad and perennially frozen mountain peaks. They constitute “best estimates” for a site without direct measurements, dealing with thermal conditions, subsurface and surface ice properties, and the resulting hydro-mechanical aspects in view of climate-related stability changes. Large-scale (global) model results relating to patterns of permafrost occurrence are available from Gruber (2012) based on climate data for the second half of the 20th century (1960–1990) and from Obu (2021) based on climate data (freezing–thawing indices) for the beginning of the 21st century (2000–2016) in combination with empirical thermal offsets mainly related to effects from vegetation and winter snow cover; comparison with measured borehole temperatures indicate an uncertainty range of ±2 °C. Due to the low spatial resolution (about 1 km) of these two important approaches, topo- and microclimatic effects at the local Rasac detachment site on an extremely steep slope must be assessed using additional process-related indications as described further below.
4.1 Surface and subsurface ice, prior rockfall activity, and the 2023 arête ridge failure
4.1.1 Surface and subsurface ice in relation to slope stability
The NW–SE-oriented Rasac arête ridge reaches elevations exceeding 6000 m a.s.l. and is partly glacier-covered. Surface ice on very steep slopes (generally > 45°) occurs in two main forms: ice aprons (ice faces; for additional info, see Ravanel et al., 2023) and hanging glaciers. Both forms, together with ice crests and small summit ice caps, are abundant in the region. Ice aprons or ice faces are thin (a few metres), smooth, near-static, cold ice covers frozen onto steep perennially frozen rock faces. Like perennial ice patches in less inclined topography, such ice covers cool the ground because they have a high albedo and because they buffer against the penetration of above-zero temperatures whilst allowing penetration of cold waves to the ground below. The ice itself may be thousands of years old, and its disappearance due to atmospheric temperature rise induces freeze–thaw cycles within the uncovered frozen rocks, followed by minor-to-major rock destabilisation (Ravanel et al., 2023). Hanging glaciers are much thicker and move from a less inclined accumulation area towards the front, where ablation tends to be by dry calving. Even with strongly negative mean annual air temperatures, they can be polythermal in that meltwater percolating from the surface and refreezing at depth of the firn constitutes a strong source of latent heat, often inducing temperate firn/ice with high water pressure (Margreth et al., 2017). Two important consequences of such conditions are that (i) the stability of such glaciers in steep terrain is mainly related to the cold, near-vertical ice front frozen to bedrock in a narrow zone at the lower margin and (ii) the temperate firn area with percolating meltwater can introduce strong local thermal anomalies (Haeberli et al., 1997) and complex thermo-hydraulic conditions in the underlying permanently frozen rocks (Haeberli et al., 2004). Macroscopic subsurface ice in perennially frozen bedrock usually fills cracks and fissures. As the original formation of such ice involves efficient frost cracking and frost wedging, such ice fillings can be massive, as is sometimes visible in permafrost tunnels (Haeberli et al., 1979; Mamot et al., 2021) or uncovered immediately after detachments of rock avalanches (Gruber and Haeberli, 2007).
One of the areas that developed frequent rockfall activity is located upstream from Lake Rasac at an elevation between 5500 and 5750 m a.s.l. (see Fig. 2c). The detachment zone of the 2023 event was covered by ice aprons rather than hanging glaciers. As a consequence, rather homogenous spatial patterns of subsurface temperatures can be expected. The existence of ice aprons on the WSW-oriented detachment side of the Rasac arête ridge and the lack of any ice cover on its other, ENE-oriented, side is likely to enhance the temperature differences between the two sides and the related horizontal flux of heat across the ridge towards the detachment site.
4.1.2 Prior rockfall activity and the 2023 GLOF-triggering failure
The Rasac arête ridge is formed of tilted layers of sedimentary and metamorphic rocks inclined towards the Rasac valley (i.e. parallel with the slope inclination; see Fig. 3a) that favour disintegration and that precondition mass movements. Available high-resolution satellite images with sub-metric resolution going back to 2010 (Fig. 3b–e) reveal that the release zone gradually migrated to higher elevations, continuously undermining an overhanging block that eventually failed in February 2023. Small rockfalls from this release zone have occurred frequently since 2018, i.e. 5 years before the major failure, as documented by the Sentinel time series 2017–2023 (Fig. 4; see also Fig. 2c) and the analysis of Planet images.
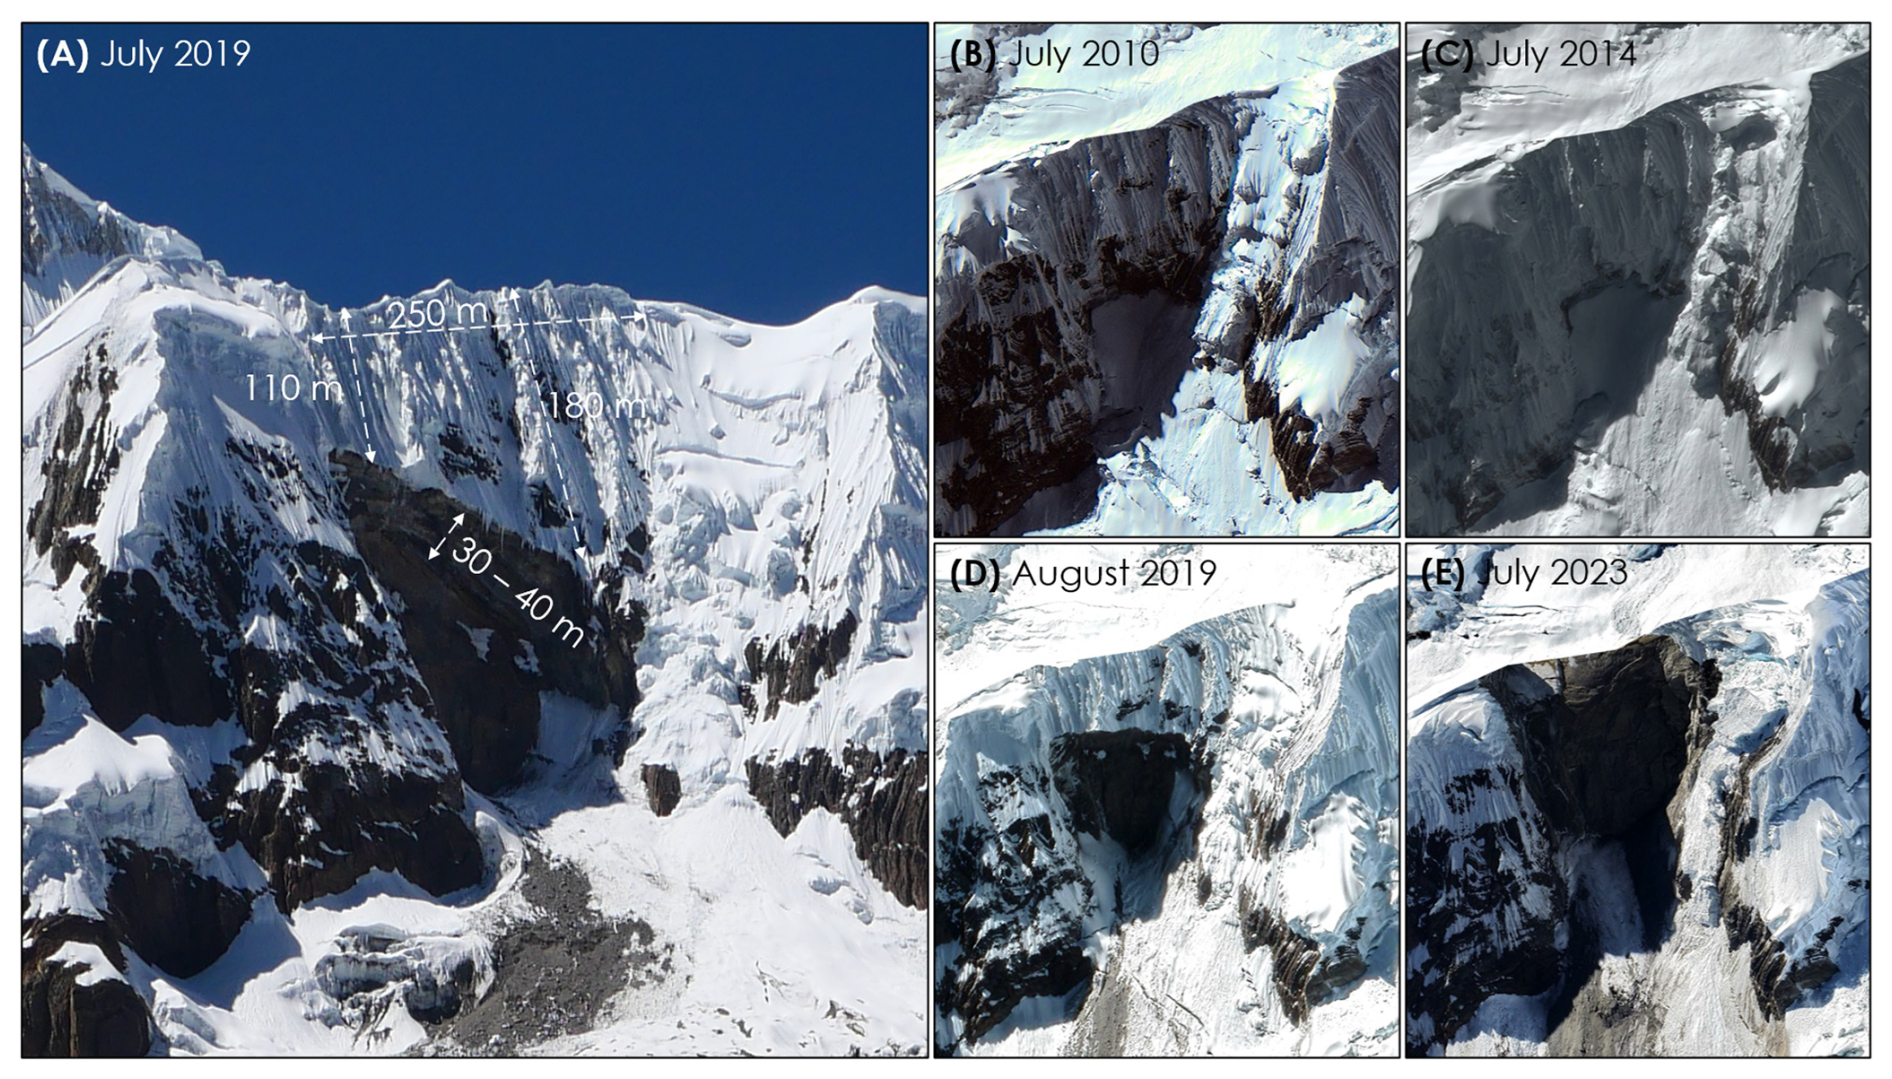
Figure 3Release zone of the GLOF-triggering landslide. Panel (a) shows a field image of the hanging block as seen from the opposite slope in July 2019 (image: Adam Emmer); panels (b) to (e) show pseudo-3D views of the release zone between 2010 and 2023 in © Google Earth (Maxar images, CNES/Airbus images). Note the very little rockfall activity (change of the release zone) between 2010 and 2014.
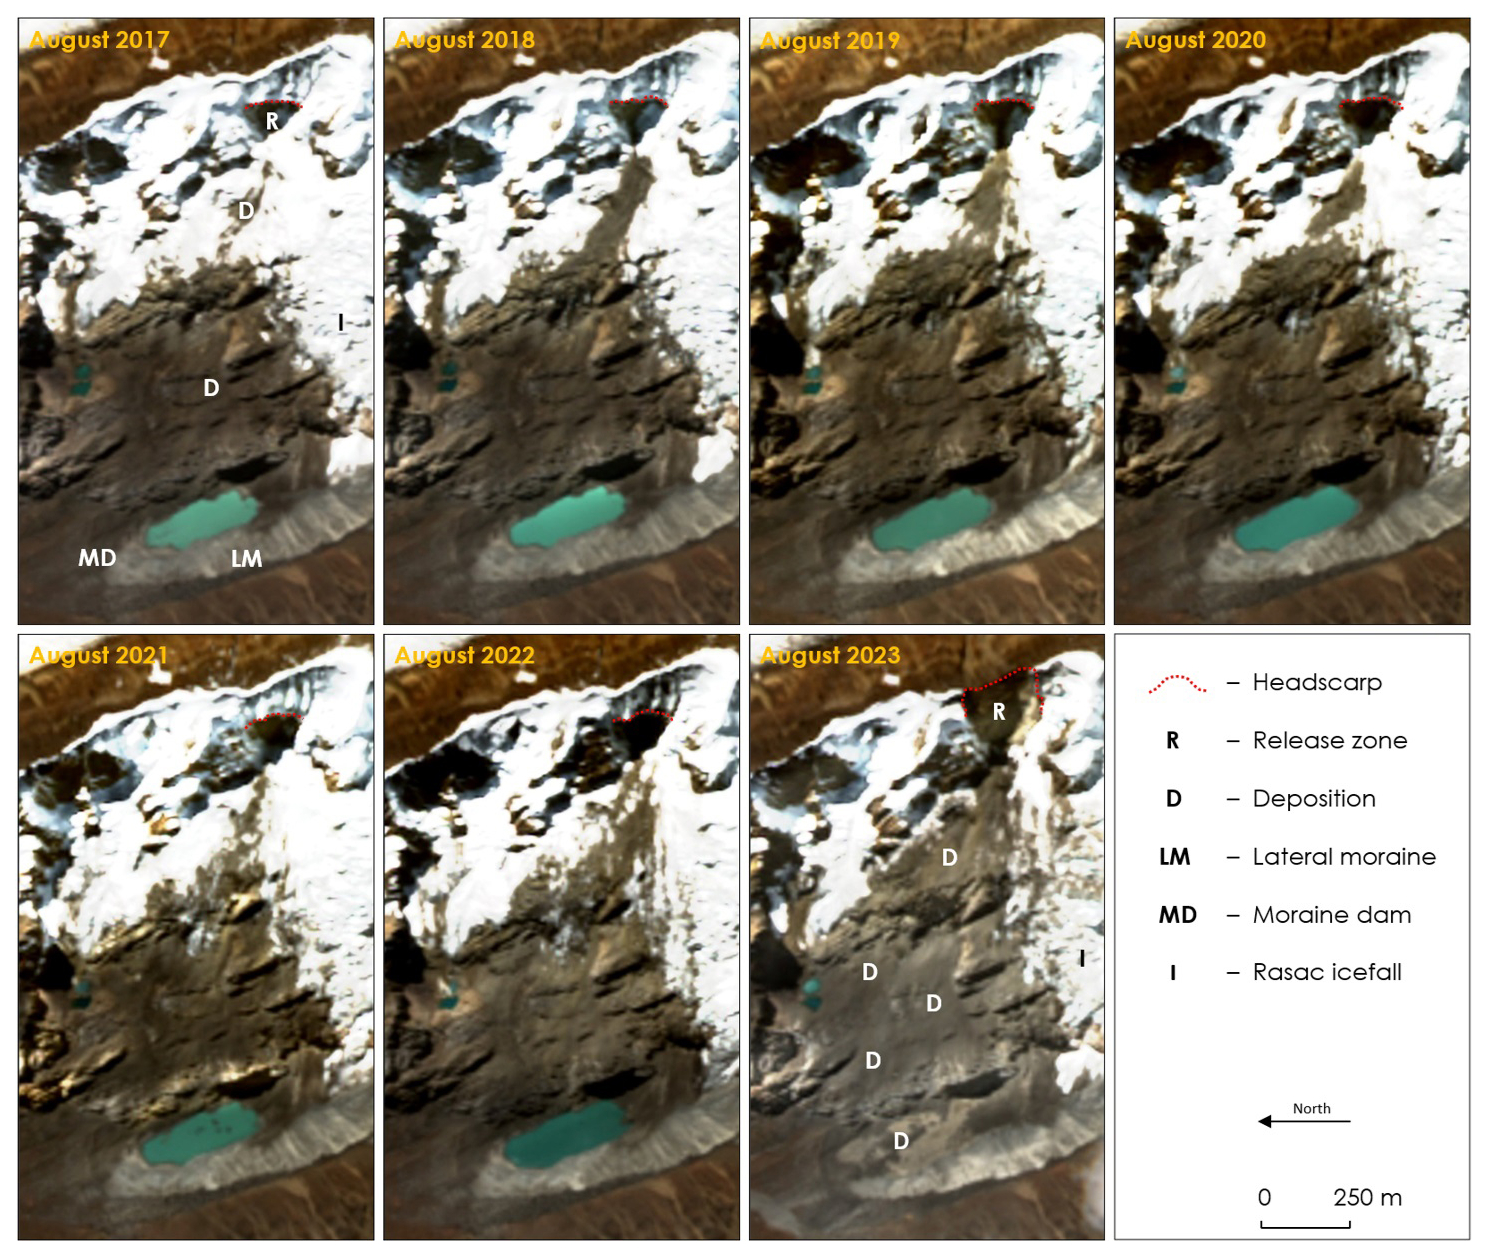
Figure 4Sentinel image time series depicting rockfall activity and development of the release zone between 2017 and 2023. Note gradually developing head scarp and release zone (R) and increasing amount of material deposited on the glacier and slopes above the eastern bank of the lake (D).
According to a member of the community settled in the Jahuacocha valley, the GLOF-triggering failure of an overhanging section of a very steep (>60°) part of the Rasac arête ridge occurred around noon on 12 February 2023. The head scarp was located at an elevation between 5750 and 5800 m a.s.l.; the approximated planar extent of the release zone is 250 m wide and 150 m high on average (Fig. 3a). Field images taken in 2019 reveal that the thickness of the hanging block was approximately 30 to 40 m, resulting in a volume estimation of 1.1×10⁶ m3–1.5×10⁶ m3. This means that the landslide would be considered “large” under the landslide classification scheme of McColl and Cook (2024). The 2023 landslide material was rock mixed with ice. In view of the thin (a few metres), co-detached ice aprons, the relative amount of ice in the 2023 rock–ice avalanche was probably on the order of 10 % to 20 %. The vertical drop between the head scarp and Lake Rasac is 1200 m (Fig. 5).
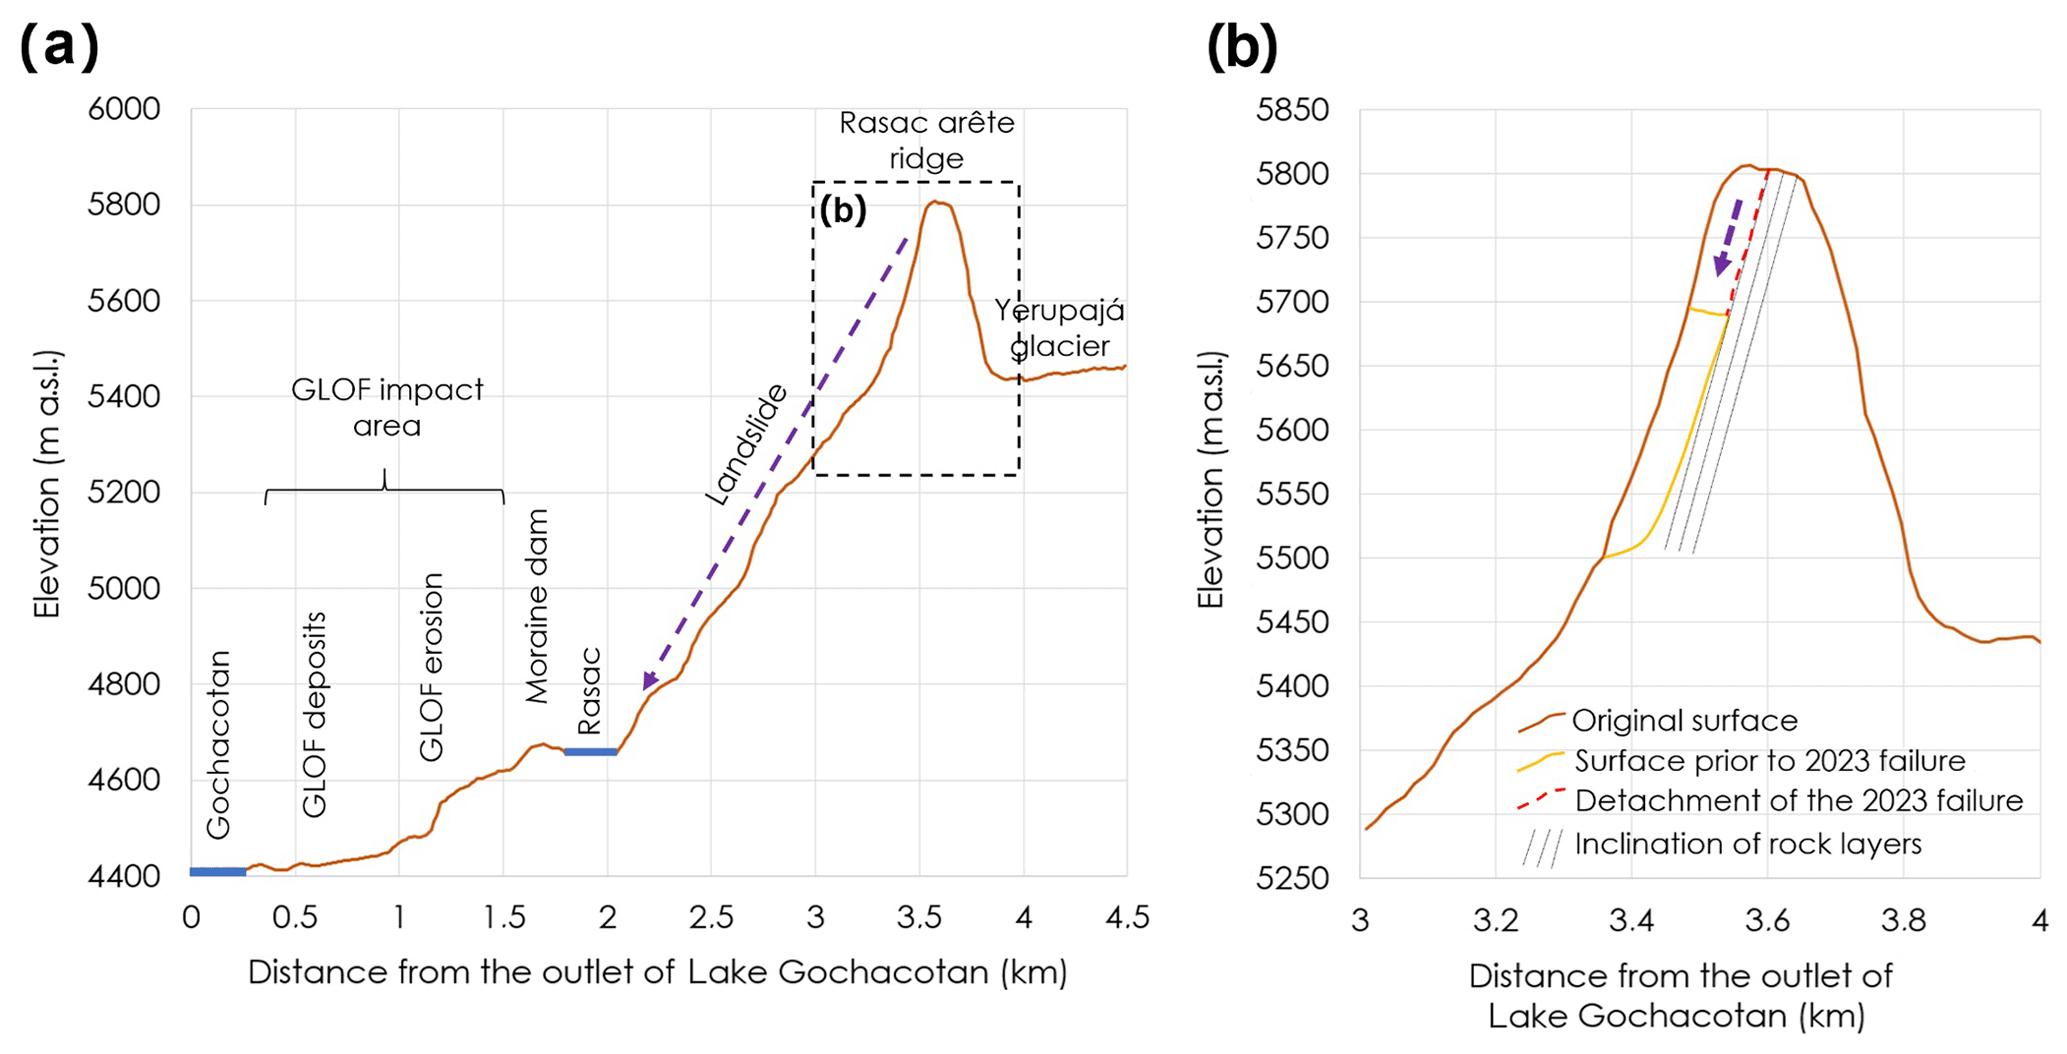
Figure 5Topographical profile of the whole process chain (a) and schematic sketch of the 2023 Rasac arête ridge failure (b). Note the x:y ratio of 2:1. DEM: 12.5 m ALOS PALSAR (ASF, 2024).
Large slope failures are often triggered by earthquakes or extreme hydro-meteorological conditions. According to the USGS earthquake catalogue (USGS, 2024), 71 earthquakes with magnitude > 4.5 occurred within the 200 km buffer distance from the landslide site between 2015 and 2024, with the highest magnitude reaching M 5.6 (95.8 km deep near Lima in June 2022). However, if the buffer is decreased to 100 km, the search returns only five earthquakes (highest magnitude M 4.9). No earthquakes occurred within the 200 km buffer distance from the landslide site near the time of its occurrence, and so we exclude the possibility of direct earthquake triggering as well as preconditioning. Instead, we examine climate change preconditions and evaluate the role of subsurface ice and permafrost warming (see Sect. 4.2).
4.2 Climate change and thermal and permafrost conditions
4.2.1 Changing climate in the study area between 1940 and 2023
From a longer-term climate change perspective over several decades, the study region has been warming significantly, receiving less snowfall and experiencing a rise in the 0 °C elevation. Over the studied region, all temperature metrics showed a substantial increase over the 84 years prior to 2023 (Fig. 6 and Figs. S1–S9 in the Supplement). The linear regression of the 2 m air temperature trend revealed an increase of +1.97 °C for February temperatures and +2.06 °C for January temperatures between 1940 and 2023. February 2023 was warmer compared to the historical mean but does not stand out as anomalously warm compared to other individual years (Fig. 6a), and it is also worth noting that in the previous 2 years, the temperature was also slightly warmer than the long-term mean. Although there is no significant trend in total rainfall (Fig. 6d), snowfall in February and January has shown a consistent decrease, with February experiencing a stronger decrease (Fig. S1). As a result, the ratio of snowfall to rainfall has also been decreasing over the study region in January and February. Interestingly, but not surprisingly, the 0 °C elevation has also been rising significantly in January and February, with February experiencing a stronger increase (Fig. 6e and f). The linear regression of the 0 °C elevation trend between 1940 and 2023 revealed an increase of +258 m for February and +248 m for January.
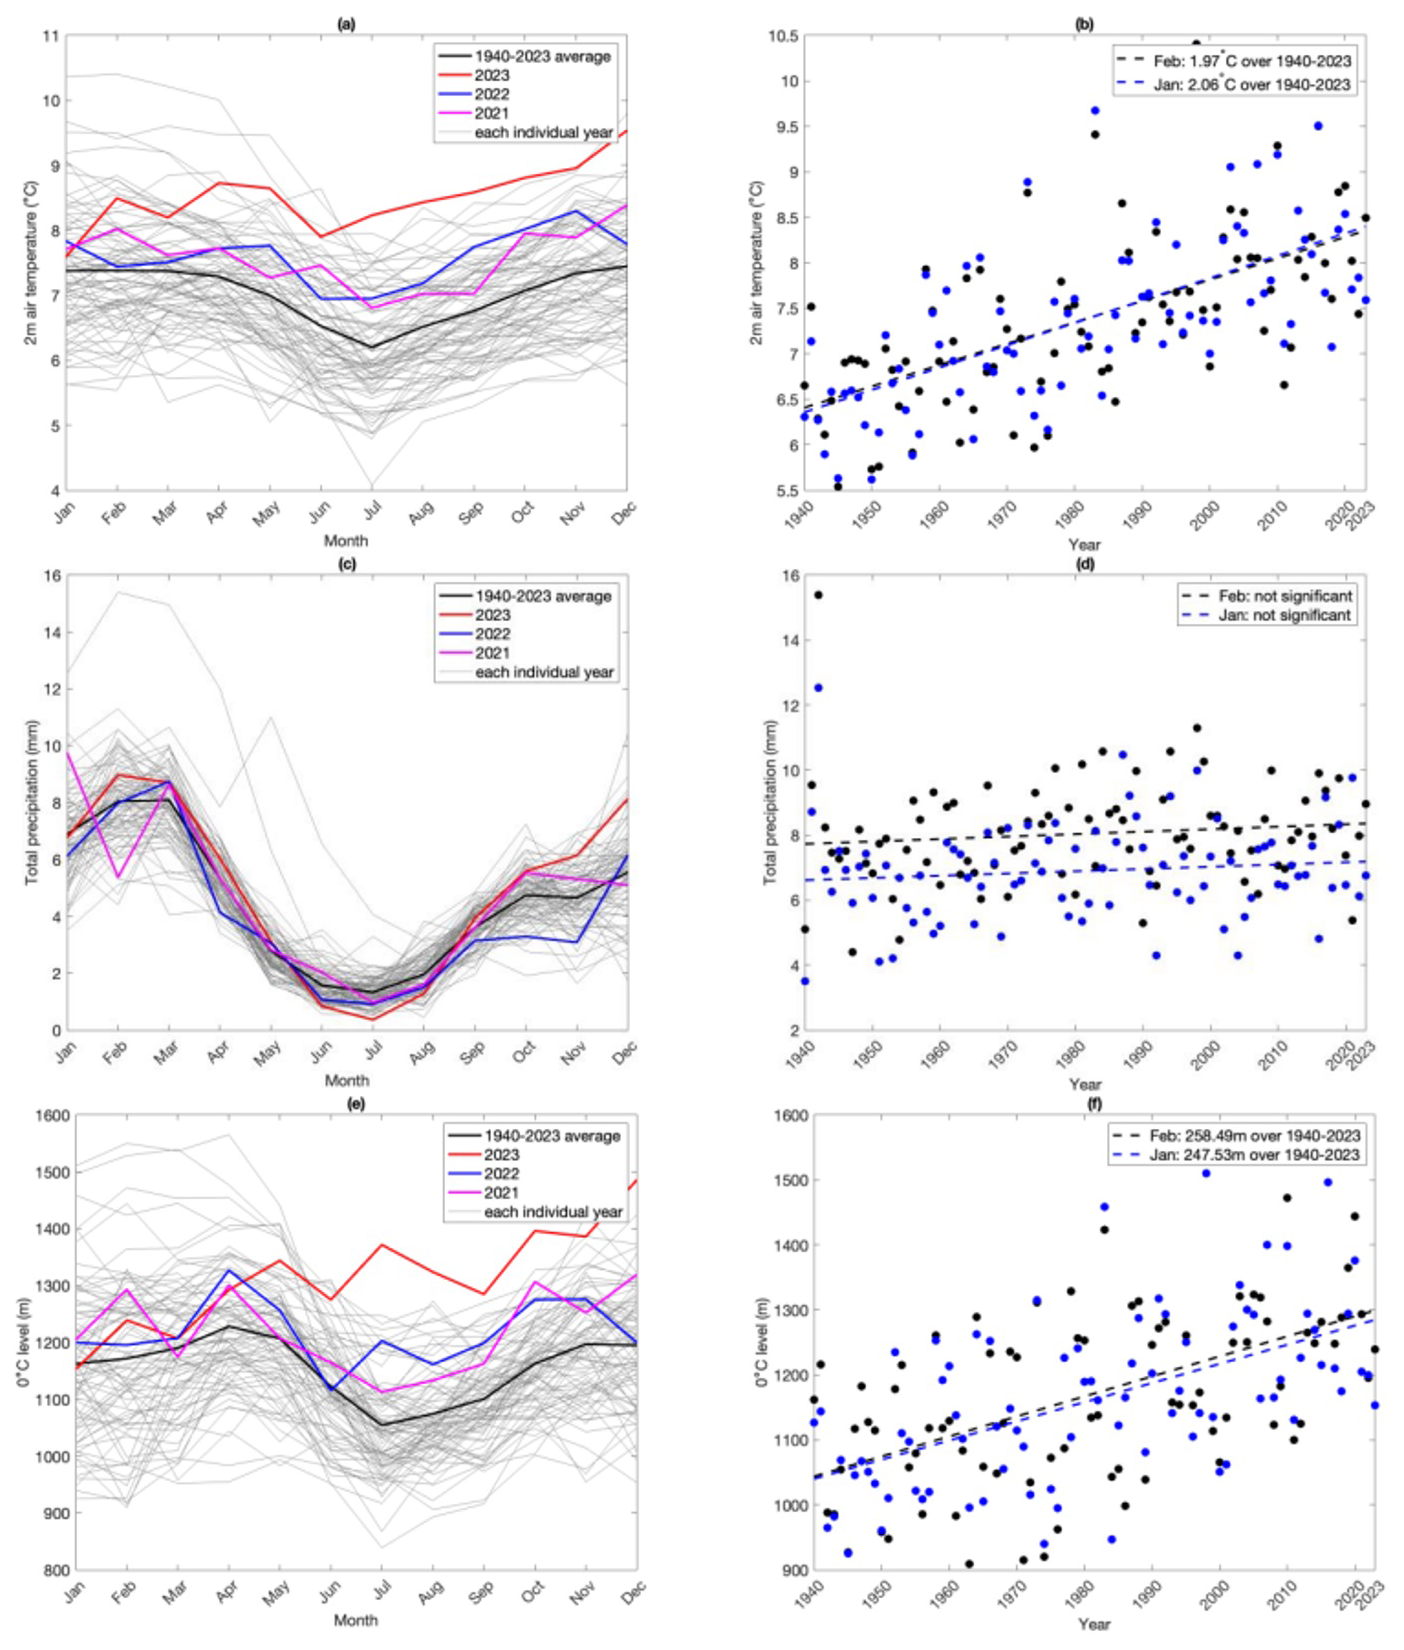
Figure 6Selected climate variables, averaged over the 1° × 1° box covering Rasac, showing their seasonal cycles and historical trends. Seasonal cycle of 2 m air temperature (°C) for 1940–2023 shown in panel (a), and the historical trend for February and January shown in panel (b). Seasonal cycle of total precipitation (rainfall plus snowfall, in mm d−1) for 1940–2023 shown in panel (c), and the historical trend for February and January shown in panel (d). Seasonal cycle of 0 °C level (m) for 1950–2023 shown in panel (e), and the historical trend for February and January shown in panel (f). The 2 prior years – 2021 and 2022 – are also highlighted in panels (a), (c) and (e).
4.2.2 Thermal conditions, the role of permafrost and hydro-mechanical aspects
Ice-filled clefts and negative temperatures have strong hydro-mechanical effects on the stability of steep icy peaks. The ice-filling of cracks and fissures reduces the hydraulic permeability of the frozen rock mass to essentially zero. New cracks without ice may, however, form through slow rock deformation. Where water enters these open cracks, efficient advective heat transport, local rock wedging and high water pressures can result (see Hasler et al., 2012; Walter et al., 2019). The strength of negative-temperature rocks with ice-filled clefts is high but decreases with increasing temperature (Fig. 7). Critical conditions develop especially in “warm” permafrost with increasing amounts of unfrozen water at temperatures between about −1.5 and 0 °C. This is due to the fact that not only do the rock and ice components lose strength, but so do the rock–rock and rock–ice contacts, where temperatures and unfrozen water contents increase (Krautblatter et al., 2013). Complete permafrost thawing with elimination of ice then leads to a slight recovery of stability but still at a much lower level than with cold permafrost (Fig. 7).
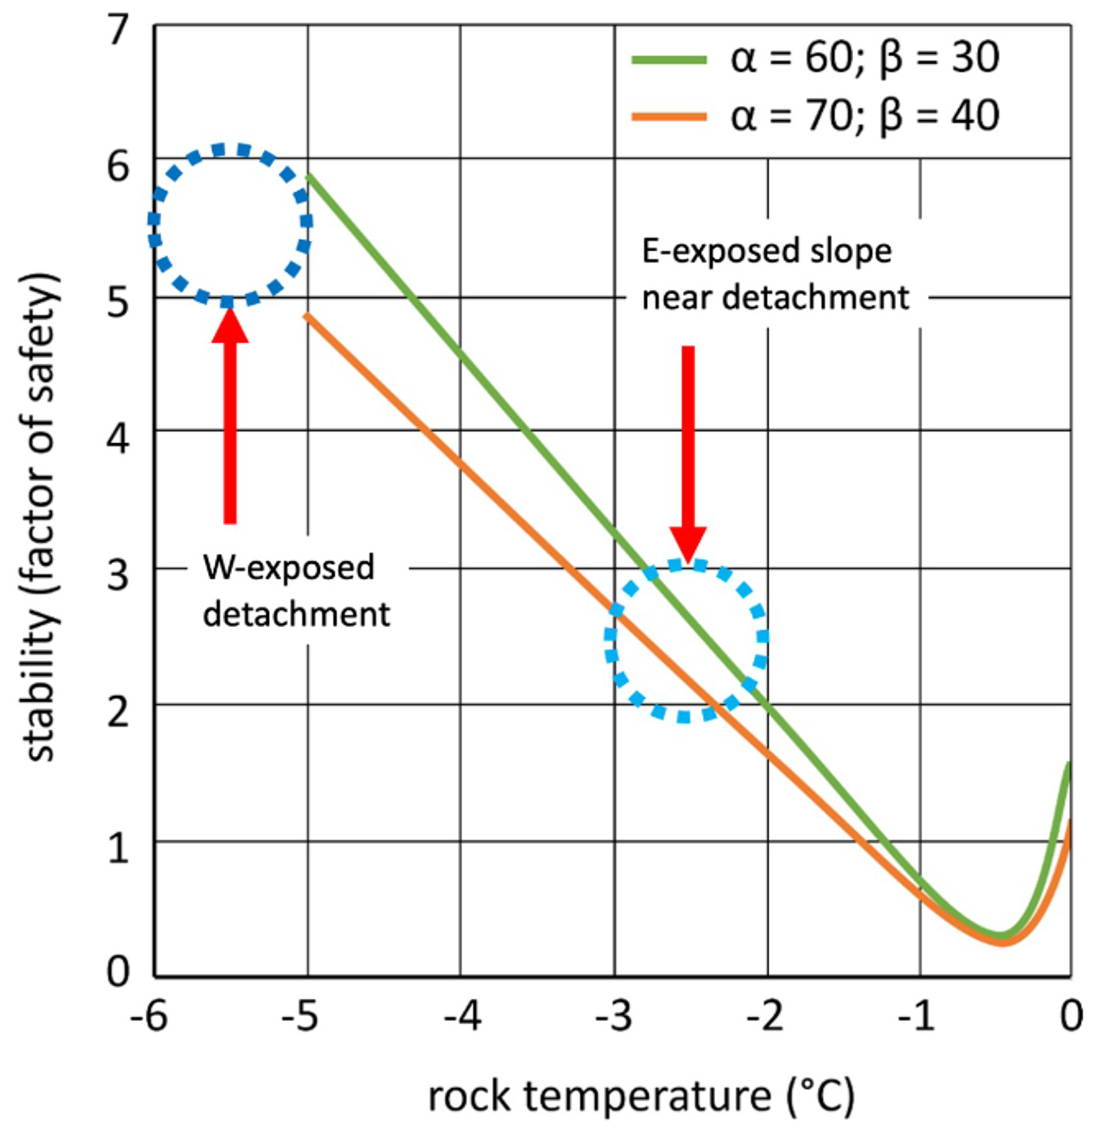
Figure 7Stability of frozen rocks with ice-filled clefts as a function of rock temperature from centrifuge experiments for two sets of slope angle α and inclination of discontinuity β (redrawn from Davies et al., 2001). Red arrows point to best guesses of permafrost temperatures at the Rasac detachment site.
The detachment site is in a very steep, WSW-oriented slope at an altitude of 5600 m a.s.l. reaching up to the ridge top at 5780 m a.s.l. (Fig. 1c). As such steep faces cannot accumulate a thick, thermally insulating snow cover, their mean surface temperature is close to the mean annual air temperature. Schauwecker et al. (2017) estimate the altitude of zero mean annual air temperature in the region to be about 5000 m a.s.l. Applying an environmental lapse rate of 6 ± 2 °C km−1 (Stewart-Jones and Gruber, 2023) provides a rough estimate of the mean annual air and surface temperature at the altitude of the detachment site of around −4 ± 2 °C. This indicates cold and deep permafrost.
The N–S-oriented Rasac arête ridge induces pronounced thermal contrasts between its E- and W-facing slopes. Due to atmospheric humidity on average increasing during the day as a consequence of convection and cloud formation, E-oriented slopes, which receive morning sun, tend to be considerably warmer than W-exposed slopes receiving evening irradiation reduced by increased atmospheric humidity and clouds. This effect is independent of latitude. In the European Alps, the difference between permafrost occurrence on E- and W-oriented slopes is around 500 m as noted by Haeberli (1975) and implemented by Keller (1992); see later model approaches by Boeckli et al. (2012), or Kenner et al. (2019). This translates into a temperature difference between the two orientations of about 3 °C. Correspondingly adjusting the estimated mean surface temperature for W exposure by −1.5 °C leads to a best estimate of about −5.5 ± 2 °C at the W-oriented detachment site (Fig. 7). Applying a corresponding adjustment of +1.5 °C to the E-oriented slope of the ridge results in a mean surface temperature at the same altitude of −2.5 ± 2 °C. It follows that the temperature pattern is strongly asymmetric. The isotherms between the two sides with a temperature difference of about 3 °C must be near-vertical, causing heat flow inside the ridge to have a correspondingly strong horizontal component across the ridge from the warmer E- to the colder W-oriented face (see Noetzli et al., 2007). Such thermal asymmetries are not uncommon in detachment zones with permafrost of rock avalanches: Cathala et al. (2024) provide a detailed analysis of slightly warmer but comparable NW–SE asymmetric thermal conditions at the detachment site of the Étache rock avalanche in the French Alps, using in situ measurements and numerical model calculations. In the uppermost part of the Rasac detachment, where the ridge width is around 100–200 m, temperature gradients (around 1–3 °C per 100 m) indicate a horizontal heat flow component, which is comparable to the geothermal heat flow in flat topography under conditions of thermal equilibrium. Such horizontal asymmetries and related relatively weak heat fluxes nevertheless have the potential to become critical for slope stability in connection with warming-induced water infiltration from the warm side of ridges.
Due to atmospheric warming since the Little Ice Age, subsurface temperature gradients at depth, as documented by thermal monitoring of deep mid- and high-latitude boreholes, are generally reduced roughly within the uppermost 100 m below the surface (Etzelmüller et al., 2020). The observation by Thompson et al. (1995), that the coldest temperature of −5.2 °C in their borehole on the cold firn–ice saddle of Huascarán (6048 m a.s.l.) was measured at the ice–rock interface at 82.5 m depth, is in general agreement with the above-estimated surface temperatures and the warming-induced reduction of subsurface temperature gradients and related (vertical) heat flow as documented in mountain borehole temperatures at higher latitudes (Etzelmüller et al., 2020). The uppermost part of the Rasac arête ridge, including the detachment site, is most probably frozen throughout. Subsurface heating due to ongoing atmospheric temperature rise comes from both sides of the ridge. Only small remaining parts unaffected by colder historical/Holocene times may still exist deep inside the mountain (see transient 3D model calculations by Noetzli and Gruber, 2009).
4.2.3 Meteorological conditions before the GLOF
To investigate whether anomalous meteorological conditions contributed to triggering the event on 12 February, we investigated the evolution of different temperature and precipitation metrics over the study region, focusing on both the short term (a few days up to 2 months prior to the GLOF) and long term (2 years prior to 2023). In Fig. 8, the anomaly patterns compared to climatology (30-year average over 1981–2010) are shown because in extreme events it is important how anomalous the conditions are. The anomaly is calculated with respect to each month, i.e. the January 2023 anomaly is calculated by subtracting the January climatology from the January 2023 absolute values, to take away the influence of seasonality. Figure 8a presents temperature anomalies from January to February for variables including 2 m air temperature, skin temperature and soil temperatures at different depths. Before 12 February, temperature anomalies for 2 m air temperature, skin temperature and soil layers exhibit notable fluctuations. In early January, all variables are below the climatological average, with 2 m air temperature and skin temperature showing negative anomalies of approximately −1.5 °C, while soil temperature anomalies at all depths range between −1.0 and −0.5 °C. From late January to 10 February, all variables increase, with 2 m air temperature and skin temperature peaking at anomalies above +1.5 °C around 10 February. Soil temperature positive anomalies are more dampened, with surface soil (layer 1) reaching a maximum anomaly of about +0.8 °C, while deeper soil layers (3 and 4) exhibit a smoother, lagged and subtle increase up to ∼ +0.4 °C on 12 February. By 15 February, 2 m temperature and skin temperature anomalies drop to approximately −1.5 °C, with soil temperature anomalies also declining but more gradually. Surface soil (layer 1) anomalies decrease to −1.0 °C, while deeper layers (3 and 4) show smaller and lagged declines. This highlights the thermal buffering effect of deeper soil layers, which respond more slowly to atmospheric changes. Rainfall anomalies remain consistently negative, fluctuating around −7 mm, with a drop to −8 mm at the beginning of February. Snowfall anomalies, in contrast, remain near 0 mm throughout the period, suggesting limited deviation from the snowfall climatology. In the previous 2 years, the anomaly patterns align with broader seasonal cycles, with 2 m temperature and skin temperature peaking in summer and reaching lows in winter. Soil temperature anomalies are more dampened, with deeper soil layers (3 and 4) exhibiting even more subdued variations, rarely exceeding ±0.5 °C, reflecting the thermal inertia of deeper soil. In 2021 and 2022, precipitation anomalies are dominated by persistent negative anomalies. Periodic reductions in rainfall deficits are observed, also reflecting seasonal increases of precipitation in this region. Snowfall anomalies are negligible across the entire period, fluctuating around 0 mm, indicating minimal deviation from climatological average snowfall conditions. In summary, the most salient feature is that almost all temperature metrics investigated here (apart from deep soil layer temperature; see the Supplement) started to become anomalously warmer compared to the long-term mean (Fig. 8).
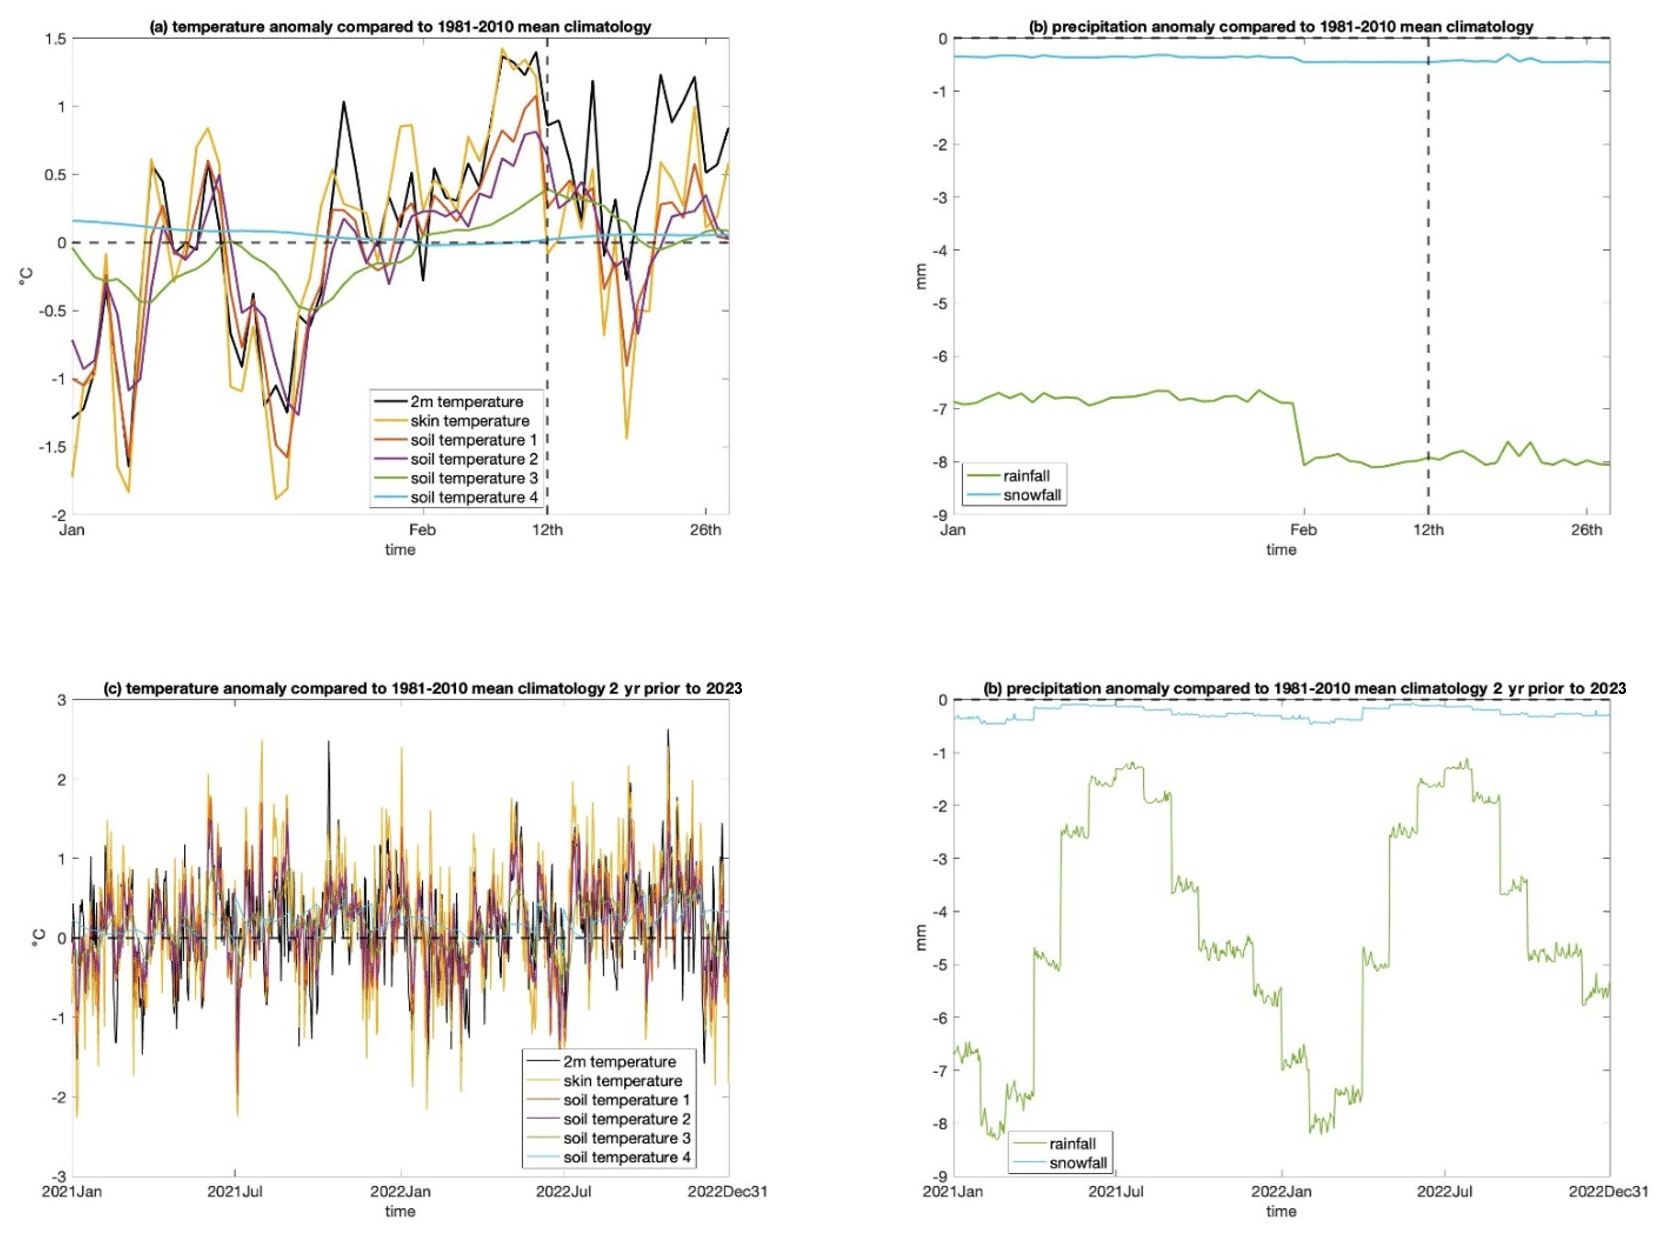
Figure 8Anomalies in temperature and precipitation compared to the 1981–2010 mean climatology. Panel (a) shows the daily temperature anomalies for January and February of 2023, showing variables across 2 m air temperature, surface skin temperature and soil temperatures at different soil column depths. Panel (b) shows the corresponding precipitation anomalies during the same period. Panel (c) expands the temperature anomalies over 2 years prior to 2023, and panel (d) shows the corresponding precipitation anomalies over the same 2-year period. Dashed vertical line indicates the timing of the Rasac landslide and GLOF event on 12 February 2023.
4.3 GLOF process chain, hydrodynamics and transport of large boulders
4.3.1 GLOF process chain
The 2023 rockfall into Lake Rasac created a displacement wave that overtopped the crest of the lake's moraine dam at two locations and impacted the section of valley between Lake Rasac and Lake Gochacotan (Fig. 9c). The impact area between the crest of the dam of the GLOF-producing Lake Rasac and the downstream Lake Gochacotan covers 142 200 m2. The reach of geomorphologically effective GLOF impacts is approximately 1.4 km with a vertical drop of 220 m (average slope of the trajectory 10°). The impact area is characterised by the presence of several large boulders with diameters > 3 m (Fig. 9d). These boulders were transported by the GLOF from the dam for a distance of > 600 m. Further geomorphic impacts include the erosion of existing stream networks as well as the creation of new branches of the stream network. The rockfall also hit a small bedrock-dammed lake located east of the moraine dam of Lake Rasac. High-resolution Planet Labs images reveal minor geomorphic impacts on the east-facing side of the ridge (part of the released material was deposited there, i.e. in the direction towards Yerupajá glacier). Interestingly, and fortunately, only very limited impacts are observed further downstream from Lake Gochacotan, and the GLOF did not reach the community settled near Lake Jahuacocha (3 km downstream from Gochacotan; see also Sect. 5.1).
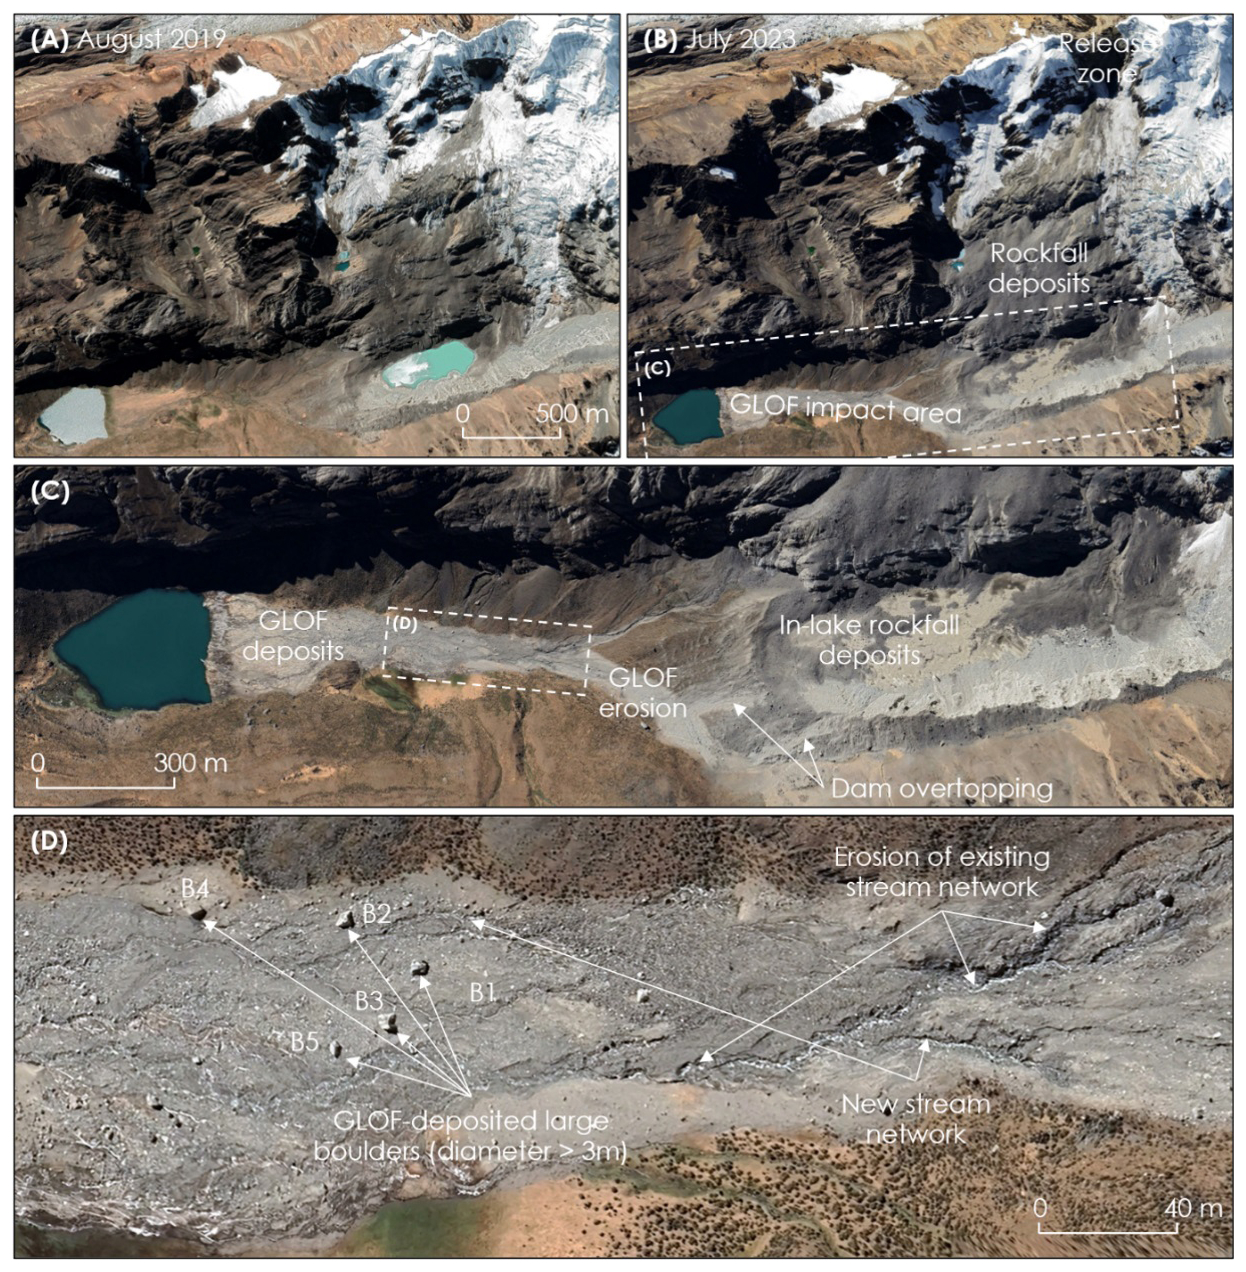
Figure 9Impact area of the 2023 process chain. Panels (a) and (b) show the location before (August 2019) and after (2023); (c) shows the disappeared lake and entire GLOF impact area and (d) shows detail of the impact area, where both erosional and depositional features associated with the 2023 GLOF are visible. B1 to B5 refer to large boulders analysed in Sect. 4.3.2. Maxar and CNES/Airbus satellite images available from © Google Earth collection.
4.3.2 Transport of large boulders
Large boulders (diameter > 3 m) were transported within the GLOF impact area, indicating that a transient, high-energy flow mobilised them. The boulders probably originated from the moraine dam, and their transport was facilitated by the steepness of the first section of the downstream face of the moraine (up to 30° in places) after wave impact. There are no apparent indications within the impact zone suggesting the occurrence of hyper-concentrated flows or debris flows, characterised by densities exceeding 1800 kg m−3 (Costa, 1988). According to Google Earth Pro imagery (July 2023) and in situ photographs of the post-GLOF impact area, no substantial morphological changes can be associated with any such high-density flows. Such flows typically induce substantial morphological alterations, resulting in the stripping of the entire surface layer of the landscape (Jakob and Hungr, 2005). Nevertheless, clear evidence of erosion and deposition processes in regions 2 and 3 (Fig. 9c) indicates a possibility of stratified flows. Given the above, it is reasonable to classify this event as a regular flood with a combination of water and sediment, displaying Newtonian fluid characteristics.
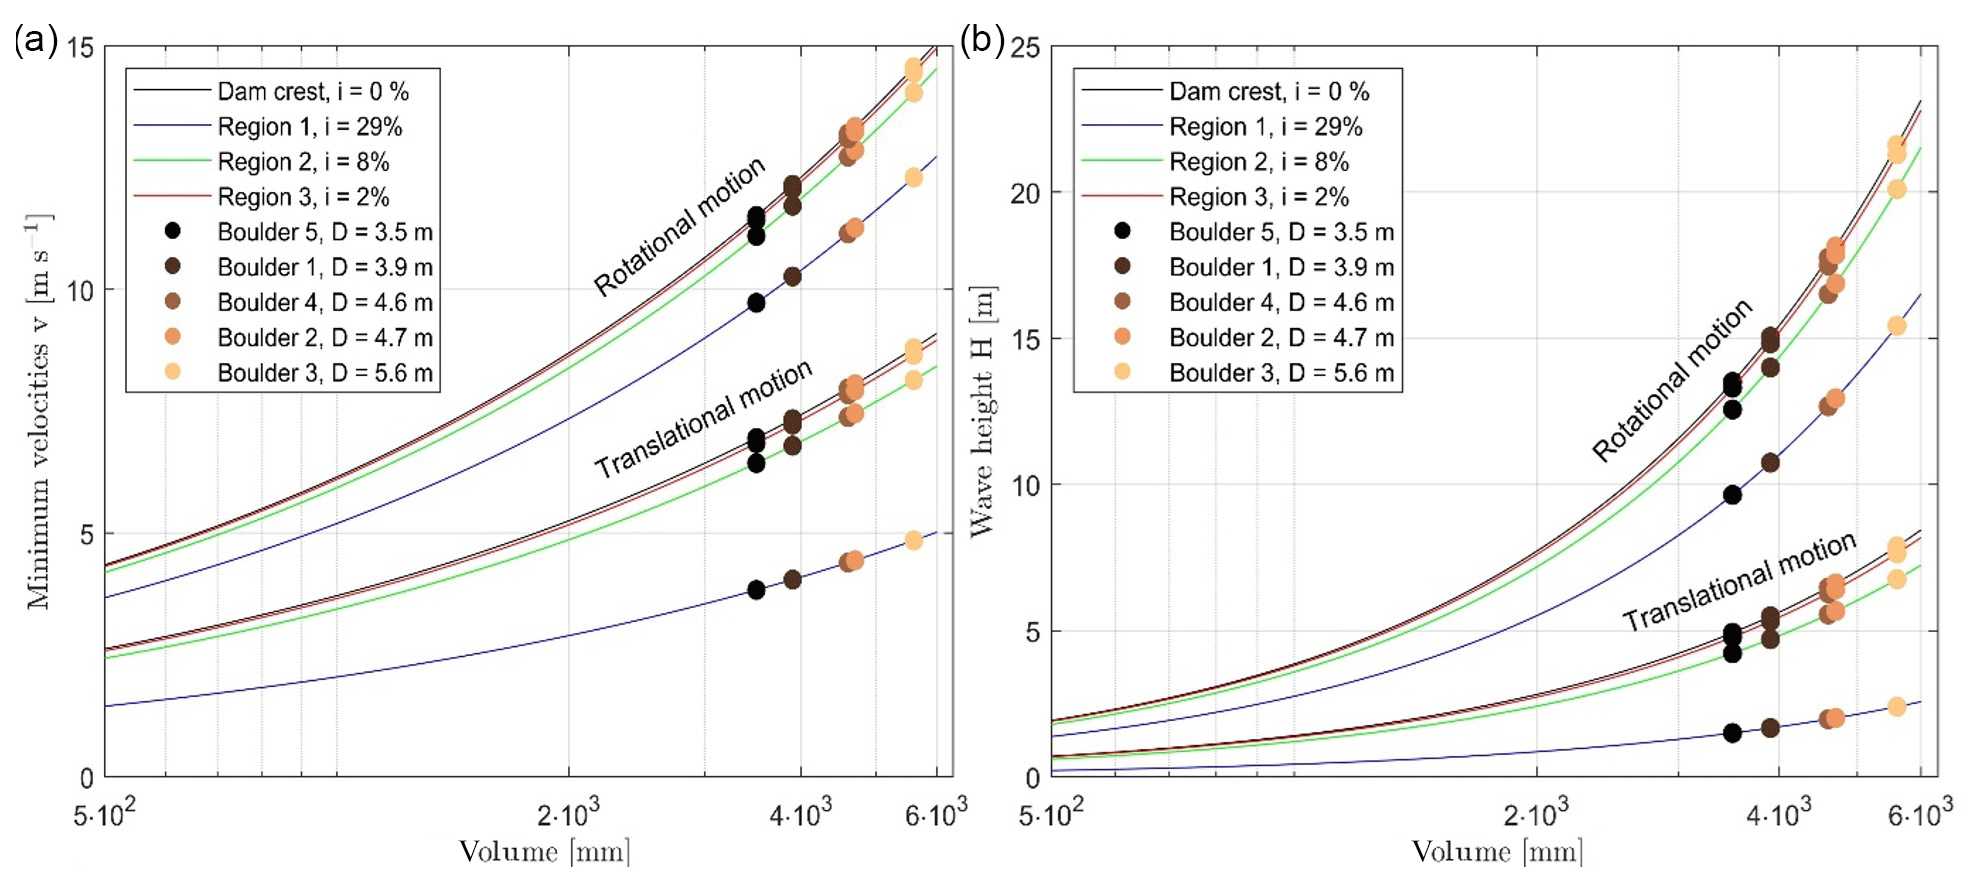
The minimum velocities required for translational and rotational motion and corresponding wave height are illustrated in Fig. 10. The results encompass a range of boulder dimensions (corresponding to width and length respectively) from 0.5 to 6 m, with observed boulder dimensions estimated from aerial imagery. Each curve represents a distinct region within our study site. It is assumed that the boulders originate from the dam crest with zero slope. For the largest observed boulder with a dimension of 5.6 m, the minimum velocity required for incipient translational motion is shown to be 8.8 m s−1, with a corresponding wave height of approximately 7.9 m (see Fig. 10). Additionally, the minimum velocity for incipient rotational motion is determined to be 14.6 m s−1, resulting from an approximate wave height of 21.6 m.
5.1 The limited GLOF impacts
The 2023 Rasac GLOF is characterised by limited reach and impacts (see Figs. 9 and 11). This observation is in contrast with the 2020 Salkantaycocha GLOF that was induced by an ice–rock avalanche of similar volume and characteristics (estimated volume 1.0×10⁶ m3–2.0×10⁶ m3, vertical drop 1000 m), but the reach of impacts exceeded tens of kilometres (Vilca et al., 2021). This could be explained by (i) dissipation of triggering rockfall energy on the bedrock slope before reaching Rasac Lake; (ii) possible gradual (not one-off) failure of the overhanging block (this may explain the two dam overtopping locations visible in Fig. 9c); (iii) the impact of a rockfall at the frontal part of the lake, diverting the primary direction of displacement wave towards the rear part of the lake; (iv) relatively small lake volume (0.3×10⁶ m3 in Rasac vs. 0.8×10⁶ m3 in Salkantaycocha); and (v) the attenuation role of Gochacotan Lake.
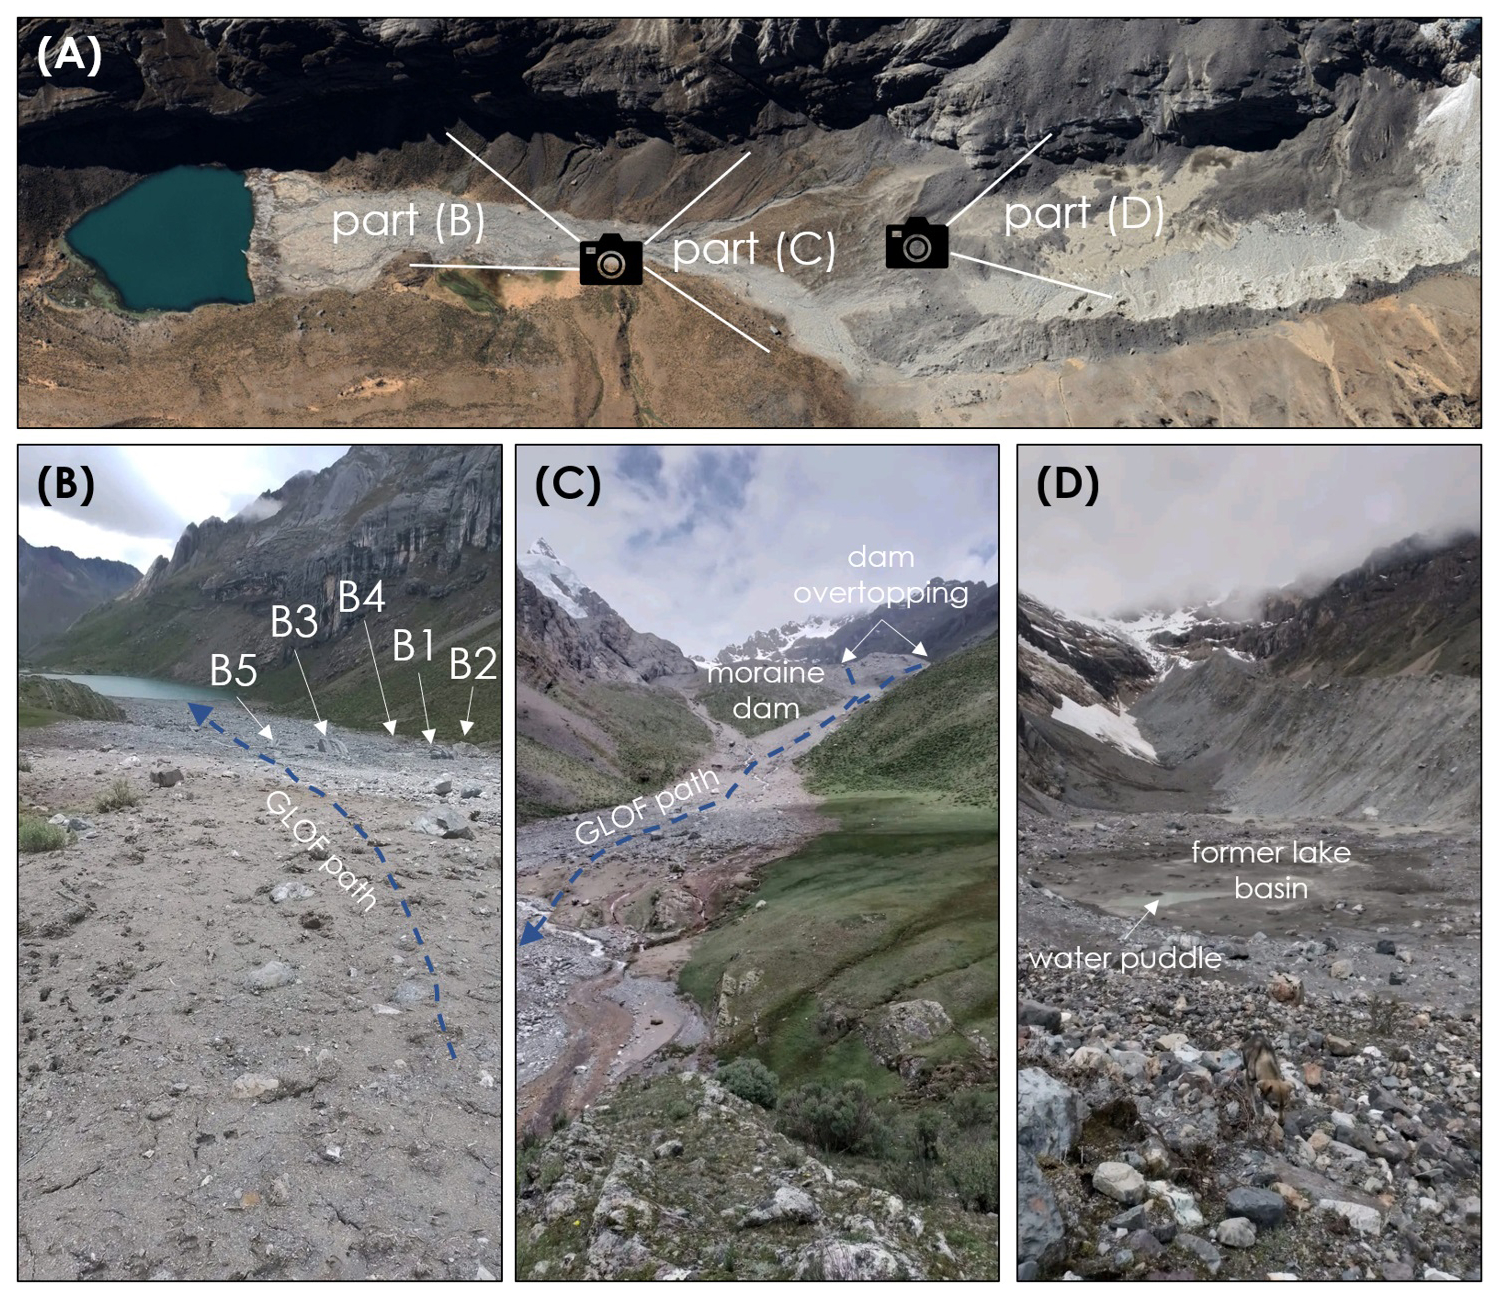
Figure 11The GLOF impacts and Lake Rasac shortly after the GLOF. Panel (a) shows standpoints of the photographer and captured scenes; panel (b) shows a downstream view of the GLOF impact zone towards Lake Gochacotan, with large boulders analysed in Sect. 4.3.2 visible; panel (c) shows an upstream view of the GLOF impact zone towards the moraine dam of Lake Rasac; panel (d) shows the formed lake basin infilled with deposited material with still-visible water puddles remaining. Satellite image in panel (a) is the 2023 Maxar image available from © Google Earth collection. Field images are reproduced with kind permission of the author, a resident of the local Jahuacocha community, Javier Ramirez.
The Sentinel and Landsat time series reveal that Lake Rasac persisted in a limited areal extent shortly after the GLOF. The 19 March 2023 Sentinel scene (i.e. 4 weeks after the GLOF) shows a clear water body in the frontal part of the former lake basin, while no lake is identifiable on the next cloud-free Sentinel image taken on 23 March 2023. Such post-GLOF lake emptying is noticeably similar to what was observed in the case of the 2020 Salkantaycocha GLOF in Cordillera Vilcabamba (Vilca et al., 2021). The reasons for this unusual post-GLOF complete lake emptying may include (i) enlargement of underground outflow channels caused by increased hydrostatic pressure immediately after the GLOF, (ii) opening of new underground channels associated with erosion of distal face of moraine dam and (iii) decreased water inflow into the lake resulting from landslide deposition in its headwater area. Considering the deposition of rockfall material in the frontal part of the lake, option (iii) is rather unlikely.
5.2 The role of climate change and meteorological conditions in Rasac slope failure
Both the long-term change and the anomalous conditions prior to the event, in particular the deeper soil layer temperature change, suggest the role of permafrost warming in this event (see Sect. 4.2.3). However, the cold temperatures of the permafrost at the detachment site of the 2023 Rasac event mean that permafrost thawing was not likely an important factor. The detachment must have taken place within the deeply frozen rocks. A general stability reduction due to deep permafrost warming, however, must be assumed to have played a partial role in the sense that the geological conditions must already have been in a critical state. Furthermore, penetration of some water from the warmer, E-oriented slope towards the detachment cannot be excluded. Numerous small-magnitude precursory events (see Sect. 4.1 and 4.2) were also initiated from cold and deep permafrost but eliminated the cooling ice aprons, which must have caused additional local warming and frost wedging. These precursory events must have led to the final destabilisation of the main 2023 event despite the fact that this uppermost part of the ridge face remained covered by thin but thermally protective ice aprons.
5.3 Challenges in attributing the 2023 event to climate change
There are several challenges in attributing a single GLOF event such as that of 2023 to climate change. First, typically the initial step in an event attribution study is to define the event in question. The central aim is to link the event definition as closely as possible to the impacts of the event, and quite often the event definition is focused on impacts on humans and/or the built environment. But in this case, the actual impact is mostly felt downstream and with no identifiable “traditionally defined” impacts. Second, event attribution studies are mostly focused on key contributing meteorological variables (e.g. temperature for heatwaves; heavy precipitation for flooding; heat, drought and winds for fires). However, as demonstrated earlier, this sudden 2023 event was triggered by a mass movement, preceded by a few small rockfalls, instead of meteorological triggers. Although local temperature had been anomalously warm prior to the GLOF event, it was not the main trigger. Third, isolating the exact role of anthropogenic climate change for the 2023 event is challenging due to the various timescales of concern here. The anthropogenic influence on climate is undeniable when looking at decadal and centennial timescales, and glacier retreat, lake formation and permafrost degradation are all clear consequences of a warming planet. These long-term changes increase the overall risk of GLOFs. However, for a single and sudden event like Rasac 2023 – with complex cumulative developments and effects – a complex system reaction influenced by ongoing anthropogenic climate change, it is challenging to conduct a meteorological variable-based attribution. Rasac 2023 is a case of climate change interacting with various natural processes (rockfalls, mass movements etc.) creating the conditions for a GLOF.
A detailed and systematic attribution of glacial lake expansion and GLOFs to climate change has not yet been undertaken, and there are a few roadblocks to such efforts which we further discuss here. First and foremost, there is a need to identify the causal physical process pathway linking a GLOF event to weather and climate variables (concurrent with the GLOF and/or antecedent conditions) that trigger the GLOF or make the GLOF more likely. In the case of Rasac 2023, this could be by either exploring the immediate weather conditions to establish whether they serve as triggers or investigating whether the antecedent meteorological conditions contributed to the mass movement processes. The lack of clear understanding and targeted modelling efforts to unpack the role played by weather and/or climate in the physical process chain leading to GLOFs is a major challenge. Currently, there is a great need to fill this gap to better understand glacial lake evolution processes and to develop physical-process-based modelling of such processes. Second, in “traditional” event attribution studies, the intensity, frequency of occurrence, spatial extent and/or persistence (duration) of an event are investigated and compared across the factual scenario (i.e. the current state) and a counterfactual scenario (i.e. removing the influences of climate change) to arrive at an attribution statement of whether and to what extent climate change had made the event more, less or equally likely to occur (and/or intense if event intensity is the focus). For Earth surface processes such as landslides and GLOFs, defining the counterfactual scenario involves defining how the regional land surface and glacial lake evolution processes would have unfolded without the effect of climate change. Currently, there are a lack of efforts modelling and defining what these potential counterfactual scenarios could look like. In this regard, a promising way forward to attribute GLOFs to climate change is to use integrated process chain climate–glacier–land surface process modelling to address if and how much glacial lake expansion and GLOFs are attributable to past total global warming and to an anthropogenic component. Nonetheless, while a single GLOF event might be hard to attribute to climate change, the overall trend of increasing GLOF risk due to climate change is clear, with ongoing climate change leading to glaciers vanishing, lake formation and expansion, deep permafrost warming and degradation, and the resulting reduction in slope stability through glacial de-buttressing and reduced strength of frozen rocks (Emmer, 2024; Zhang et al., 2024).
With that being said, it is still valuable to start exploring some initial steps to perform attribution analysis of GLOFs. Therefore, in this study we still perform a simple observational-based analysis, attributing the anomalous temperature leading up to the event (which is the most salient feature through the climate section analysis), averaged over the 1° × 1° box covering Rasac. Since the anomalous temperature was seen in a few different variables (Fig. 8a) and to make sure the results are robust, the attribution analysis was undertaken for four variables: February maximum daily mean 2 m temperature anomaly from ERA5-Land, February maximum daily mean land surface skin temperature anomaly from ERA5-Land, February maximum daily mean top layer soil temperature anomaly and February 1 d maximum daily maximum temperature anomaly. The detailed methods for observational-based attribution are used according to the World Weather Attribution Protocol, described in Philip et al. (2020), with supporting details found in van Oldenborgh et al. (2021) and Ciavarella et al. (2021). We also briefly outline the methods in Sect. 3.2.2 for the readers' benefit. The results shown in Fig. 12 suggest that the likelihood of events, in terms of February temperature extremes, at least as extreme as what happened in February 2023, is increased due to global warming, with a return period of 1.2, 1.3, 1.3 and 1.3 years (for the four variables respectively) under 2023 climate conditions, a return period of ∼ 11, ∼ 20, ∼ 22 and ∼ 9 years under −1.2 °C climate conditions, and a probability ratio of ∼ 9, ∼ 15, ∼ 17 and ∼ 7. This means that global warming has increased the likelihood of a February temperature anomaly at least as severe as that over Rasac in 2023 February by almost 10–20 times, highlighting the impacts of climate change on local warming.
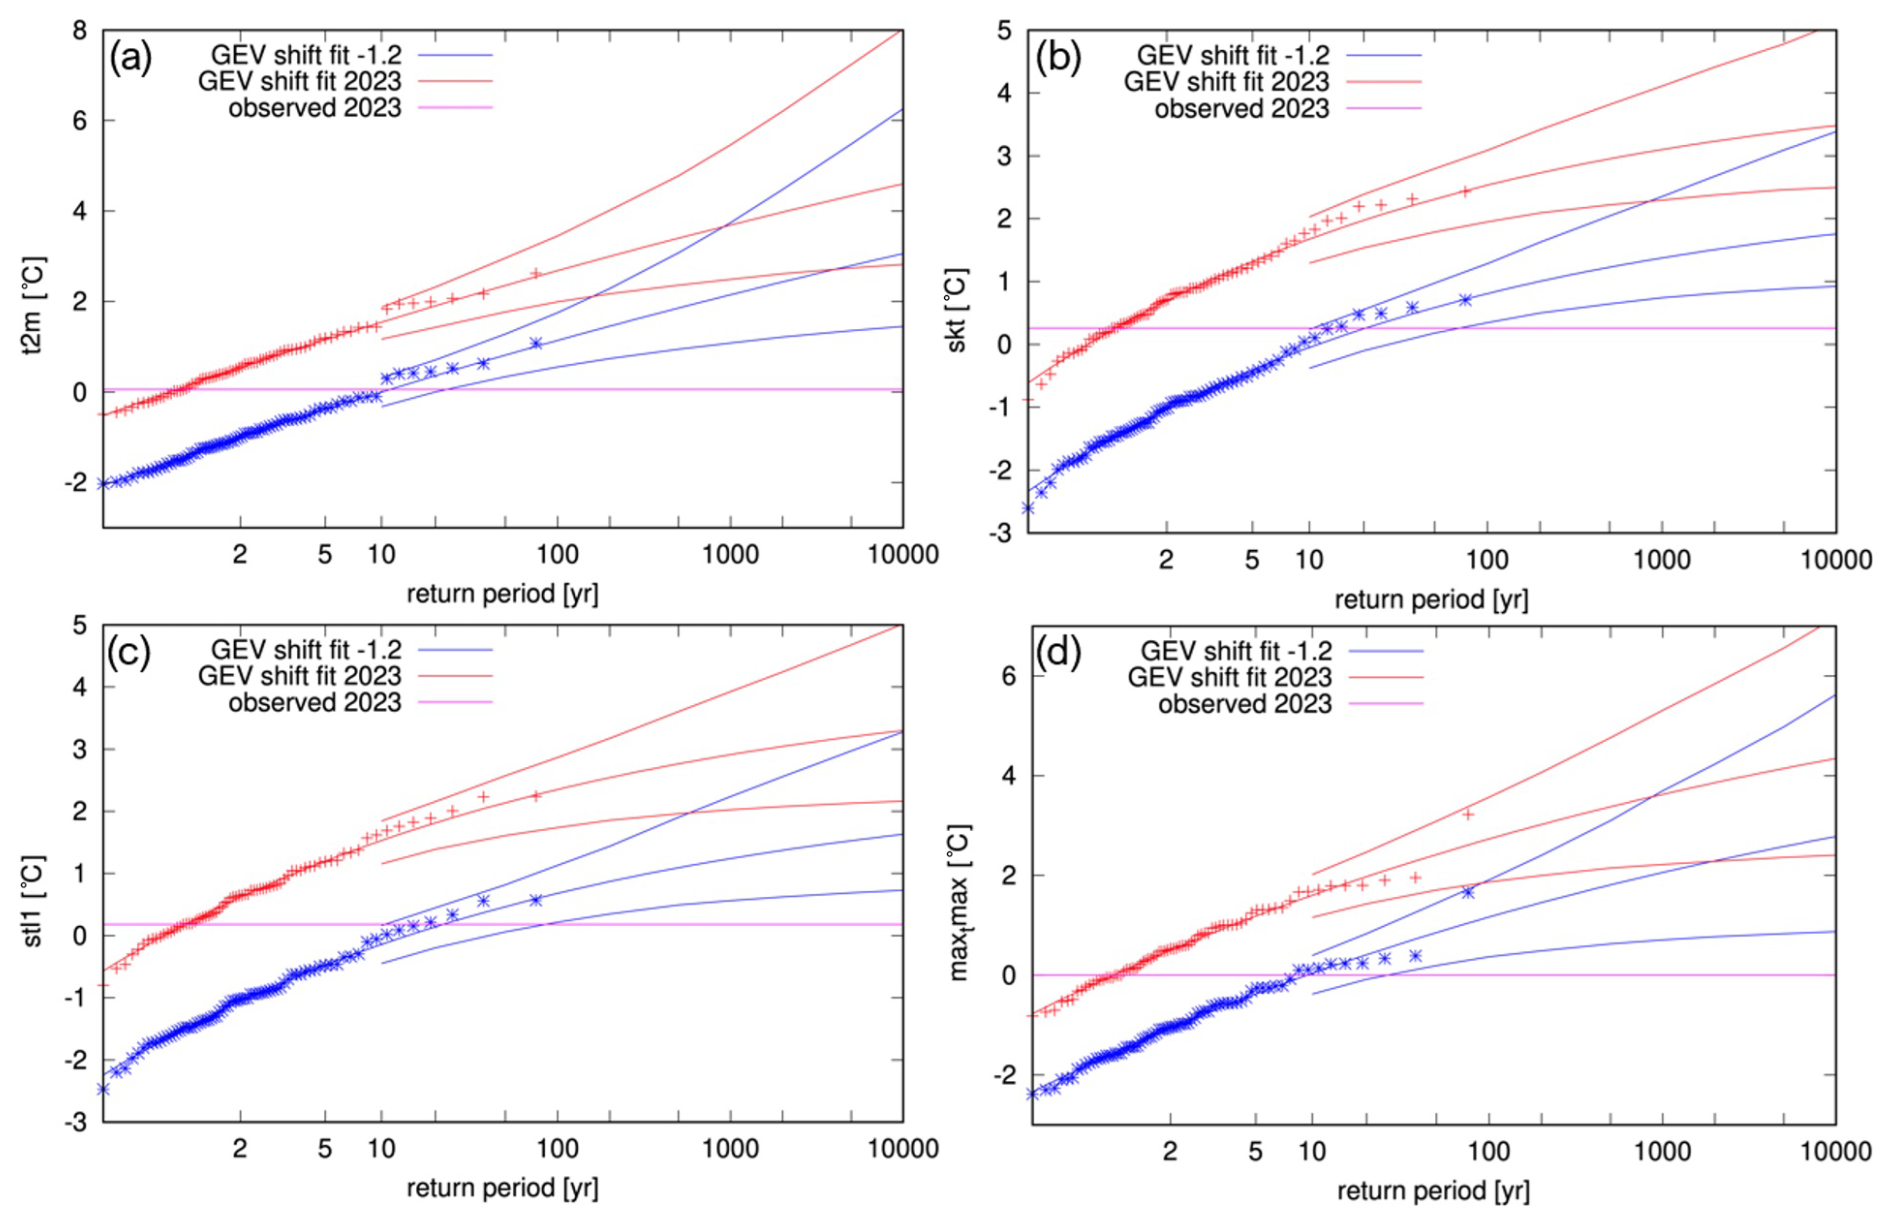
Figure 12The GEV fit to the data at two levels of the covariate global mean sea surface temperature: in 2023 (red line) and in a 1.2 °C cooler climate (pre-industrial, blue line). The purple line shows the magnitude of the February 2023 event. The four panels show results for four different event definitions: (a) event defined based on February maximum daily mean 2 m temperature anomaly from ERA5-Land, (b) event defined based on February maximum daily mean land surface skin temperature anomaly from ERA5-Land, (c) event defined based on February maximum daily mean top layer soil temperature anomaly and (d) event defined based on February 1 d maximum daily maximum temperature anomaly from ERA5 (as ERA5-Land does not provide this variable). Data over 1950–2023 are used, and all anomalies are with respect to 1980–2010 climatology period.
5.4 Regional implications of the 2023 Rasac GLOF
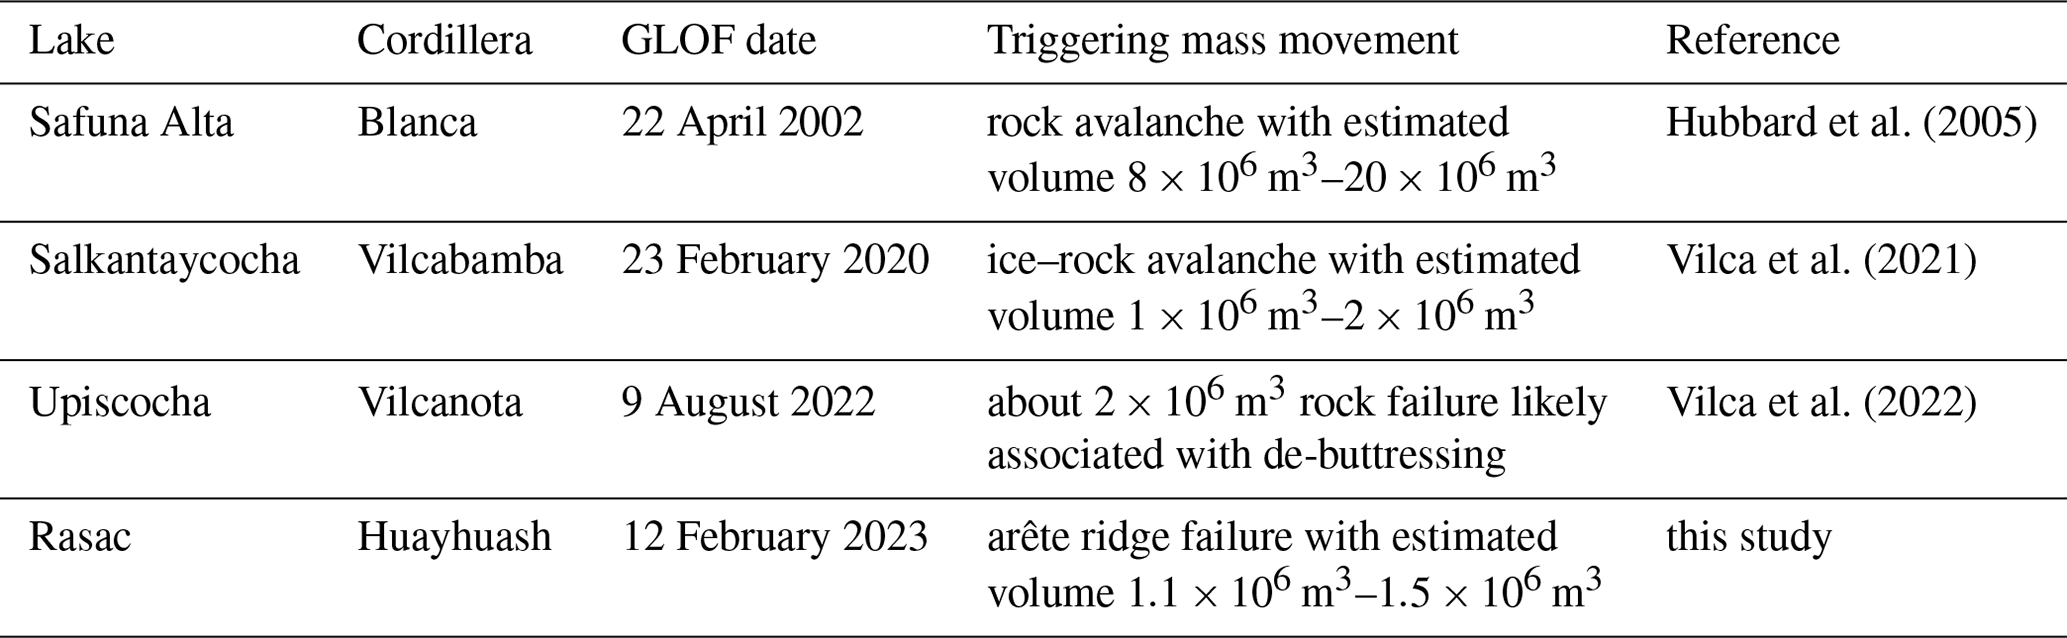
Regional-scale insights about possibly changing occurrence patterns of GLOFs in space and time can be derived from systematic analysis of events with specified triggering events (type and magnitude) in a homogenous geographical region. In this study, we consider a “large” (volume >106 m3, using the universal landslide size classification scheme of McColl and Cook, 2024) ice and rock mass failure, triggered in the glacierised cordilleras of the Peruvian Andes. Building on the regional GLOF inventory of Emmer et al. (2022b), we found four examples of such GLOFs that are documented from the Peruvian Andes in 21st century (see Table 3). Apart from the 2023 Rasac GLOF reported in this study, these are the 2002 Lake Safuna Alta rockslide-induced GLOF in Cordillera Blanca (Hubbard et al., 2005), the 2020 Lake Salkantaycocha ice–rock-avalanche-induced GLOF in Cordillera Vilcabamba (Vilca et al., 2021) and the 2022 Lake Upiscocha rockslide-induced GLOF in Cordillera Vilcanota (Vilca et al., 2022). Further, several GLOFs were triggered with similar processes but smaller initial volumes (Emmer et al., 2022b), for example, the GLOF triggered by an ice–rock avalanche at an unnamed lake located beneath the Panta peak in the Cordillera Vilcabamba in rainy season 2012/13, with an estimated landslide volume of >105 m3, and the 2012 Lake No. 513 ice–rock-avalanche-induced GLOF in Cordillera Blanca, with an estimated landslide volume 2×10⁵ m3–5×10⁵ m3 of ice and rock (Carey et al., 2012; Vilímek et al., 2015; Emmer et al., 2022b), although some sources indicate an initial volume exceeding 106 m3 (Valderrama and Vilca, 2010). The timing of these events implies that while there was on average one large GLOF triggered by a ice–rock mass failure per decade in the Peruvian Andes in 2000s, this figure increased 3-fold in the 2020s. Importantly, the rather rare nature of these events underscores the importance of careful reporting and analysis that is necessary to disentangle occurrence patterns and the role of climate change and associated processes (see Sect. 5.2).
Table 3Large GLOFs triggered by ice and mass failure in the Peruvian Andes in the 21st century (from Emmer et al., 2022b).
We performed the same set of climate analysis for two GLOF events that occurred in the 2020s (2022 Upiscocha and 2020 Salkantaycocha), focusing on the longer-term trend over the last 8 decades and shorter-term anomalous conditions prior to the events, to determine whether there are similar meteorological patterns (results shown in Figs. S10–S36) and whether there are clear signals of weather and/or climate factors serving as triggers. Similar to Rasac, these two lakes have also seen sustained significant warming over the past 8 decades, with the 0 °C isotherm rising significantly over time, exposing more glacier areas to above-freezing conditions. Although the short-term conditions preceding the GLOFs at Lake Upiscocha and Lake Salkantaycocha were also characterised by elevated temperatures and precipitation deficits (similar to Rasac), the short-term variability, intensity and timing suggest distinct meteorological processes for each GLOF. Unlike 2023 Rasac, which had seen a clear peak in temperature anomalies right before the GLOF, 2022 Upiscocha and 2020 Salkantay did not experience such clear peaks right before the GLOF. In the case of 2022 Upiscocha, the positive temperature anomalies peaked by the end of July then dropped continuously to even negative anomalies right before 9 August. This makes it even harder to derive key contributing meteorological metrics to perform attribution analysis in the “traditional way”, further highlighting the need for future research to integrate climate–glacier–land surface process modelling to perform GLOF attribution.
The GLOF process chain reported in this study is the most recent large GLOF process chain triggered by mass movement (initial volume >106 m3) in the Peruvian Andes. The triggering mass movement detached from cold, deep-reaching permafrost, and the failure of the main event must have occurred within the frozen rocks. These frozen rocks most likely underwent deep warming and a related stability reduction but not to especially critical conditions of warm permafrost with increased amounts of unfrozen water, which is corroborated by the observed period of 6 years of precursory small-magnitude rockfall activity. Our field observations emphasise the mobilisation of very large boulders (five boulders with diameter >3 m) and surprisingly limited geomorphic impacts downstream at Lake Gochacotan. While hydrodynamic analysis reveals flow velocities exceeding 5 m s−1 for translational motion and 10 m s−1 for rotational motion, understanding the attenuation role of floodplain topography and Lake Gochacotan requires detailed modelling. The 2023 Rasac GLOF in the context of similar events in the Peruvian Andes suggests that the frequency of such events has been increasing since the beginning of the 21st century. We assume that this increase may primarily be attributed to climate-change-induced ice effects, i.e. glacial de-buttressing and deep warming with stability reduction of perennially frozen rock slopes. These two dominant ice-related effects on changing preconditioning must be discussed in view of the challenges tied with attributing short-term triggering factors for individual events. In conclusion, we recommend that future research should especially address (i) quantitative analysis of stability conditions of lake-facing slopes with probable permafrost conditions, (ii) conceptual and modelling-based analysis of amplification and attenuation elements in GLOF process chains, and (iii) frequency–magnitude analysis of GLOF-triggering events in a changing climate.
The data analysed in this study (remote sensing data, climate reanalysis data) are freely available (see details in the main text). Any additional information will be provided by the corresponding author upon request.
The supplement related to this article is available online at https://doi.org/10.5194/nhess-25-1207-2025-supplement.
All co-authors contributed to the discussion of research design, data compilation, formal analysis and writing of the text. In particular, AE and SC analysed remotely sensed optical images and topographical data, OV and CSC provided data from the archives and talked to an eyewitness in the field in 2023, AE did the field visit in 2019, SL processed and analysed climate data and wrote the attribution part, JH and EP analysed transport of large boulders, and WH examined thermal conditions and the role of warming permafrost. All co-authors approved the final version of this text.
The contact author has declared that none of the authors has any competing interests.
Publisher's note: Copernicus Publications remains neutral with regard to jurisdictional claims made in the text, published maps, institutional affiliations, or any other geographical representation in this paper. While Copernicus Publications makes every effort to include appropriate place names, the final responsibility lies with the authors.
The authors thank Fabrizio Troilo and the anonymous referee for their comments that helped to improve the study.
The authors acknowledge financial support (APC coverage) by the University of Graz.
This paper was edited by Yves Bühler and reviewed by Fabrizio Troilo and one anonymous referee.
ANA: Inventario Nacional de Glaciares y Lagunas, https://hdl.handle.net/20.500.12543/199 (last access: 8 January 2025), 2014.
ASF: ALOS PALSAR, © JAXA/METI ALOS PALSAR; PALSAR_Radiometric_Terrain_Corrected_high_res, accessed through ASF DAAC in 2024, https://doi.org/10.5067/Z97HFCNKR6VA, 2024.
Bat'ka, J., Vilímek, V., Štefanová, E., Cook, S. J., and Emmer, A.: Glacial Lake Outburst Floods (GLOFs) in the Cordillera Huayhuash, Peru: Historic events and current susceptibility, Water, 12, 2664, https://doi.org/10.3390/w12102664, 2020.
Boeckli, L., Brenning, A., Gruber, S., and Noetzli, J.: Permafrost distribution in the European Alps: calculation and evaluation of an index map and summary statistics, The Cryosphere, 6, 807–820, https://doi.org/10.5194/tc-6-807-2012, 2012.
Bondesan, A. and Francese, R. G.: The climate-driven disaster of the Marmolada Glacier (Italy), Geomorphology, 431, 108687, https://doi.org/10.1016/j.geomorph.2023.108687, 2023.
Bookhagen, B. and Strecker, M. R.: Orographic barriers, high-resolution TRMM rainfall, and relief variations along the eastern Andes, Geophys. Res. Lett., 35, L06403, https://doi.org/10.1029/2007GL032011, 2008.
Bressan, L., Guerrero, M., Antonini, A., Petruzzelli, V., Archetti, R., Lamberti, A., and Tinti, S.: A laboratory experiment on the incipient motion of boulders by high-energy coastal flows, Earth Surf. Proc. Land., 43, 2935–2947, https://doi.org/10.1002/esp.4477, 2018.
Carey, M.: Living and Dying with Glaciers: People's historical vulnerability to avalanches and outburst floods in Peru, Glob. Planet. Change, 47, 122–134, https://doi.org/10.1016/j.gloplacha.2004.10.007, 2005.
Carey, M., Huggel, C., Bury, J., Portocarrero, C., and Haeberli, W.: An integrated socio-environmental framework for glacial hazard management and climate change adaptation: Lessons from Lake 513, Cordillera Blanca, Peru, Climatic Change, 112, 733–767, https://doi.org/10.1007/s10584-011-0249-8, 2012.
Cathala, M., Bock, J., Magnin, F., Ravanel, L., Asher, M. B., Astrade, L., Bodin, X., Chambon, G., Delinie, P., Faug, T., Genuite, K., Jaillet, S., Josnin, J.-Y., Revil, A., and Richard, J.: Predisposing, triggering and runout processes at a permafrost-affected rock avalanche site in the French Alps (Étache, June 2020), Earth Surf. Proc. Land., 49, 3221–3247, https://doi.org/10.1002/esp.5881, 2024.
Çengel, Y. and Cimbala, J.: Ebook: Fluid Mechanics Fundamentals and Applications (SI Units), McGraw Hill, 2013.
Ciavarella, A., Cotterill, D., Stott, P., Kew, S., Philip, S., van Oldenborgh, G. J., Skålevåg, A., Lorenz, P., Robin, Y., Otto, F., Hauser, M., Seneviratne, S. I., Lehner, F., and Zolina, O.: Prolonged Siberian heat of 2020 almost impossible without human influence, Climatic Change, 166, 9, https://doi.org/10.1007/s10584-021-03052-w, 2021.
Clague, J. J., Huggel, C., Korup, O., and McGuire, B.: Climate change and hazardous processes in high mountains, Rev. Asoc. Geol. Argent., 69, 328–338, 2012.
Costa, J. E.: Rheologic, geomorphic and sedimentologic differentiation of water floods, hyperconcentrated flows and debris flows, in: Flood Geomorphology, edited by: Baker, V. R., Kochel, R. C., and Patton, P. C., John Wiley and Sons, 113–122, ISBN 9780471625582, 1988.
Costa, J. E. and Schuster, R. L.: The formation and failure of natural dams, Geol. Soc. Am. Bull., 100, 1054–1068, https://doi.org/10.1130/0016-7606(1988)100<1054:TFAFON>2.3.CO;2, 1988.
Davies, M. C. R., Hamza, O., and Harris, C.: The Effect of Rise in Mean Annual Temperature on the Stability of RockSlopes Containing Ice-Filled Discontinuities, Permafrost Periglac., 12, 137–144, https://doi.org/10.1002/ppp.378, 2001.
Ding, Y. J., Mu, C. C., Wu, T. H., Hu, G. J., Zou, D. F., Wang, D., Li, W. P., and Wu, X. D.: Increasing cryospheric hazards in a warming climate, Earth-Sci. Rev., 213, 103500, https://doi.org/10.1016/j.earscirev.2020.103500, 2021.
Emmer, A.: Understanding the risk of glacial lake outburst floods in the twenty-first century, Nat. Water, 2, 608–610, https://doi.org/10.1038/s44221-024-00254-1, 2024.
Emmer, A. and Cochachin, A.: The causes and mechanisms of moraine-dammed lake failures in the Cordillera Blanca, North American Cordillera and Himalaya, AUC Geographica, 48, 5–15, https://doi.org/10.14712/23361980.2014.23, 2013.
Emmer, A. and Vilímek, V.: New method for assessing the susceptibility of glacial lakes to outburst floods in the Cordillera Blanca, Peru, Hydrol. Earth Syst. Sci., 18, 3461–3479, https://doi.org/10.5194/hess-18-3461-2014, 2014.
Emmer, A., Harrison, S., Mergili, M., Allen, S., Frey, H., and Huggel, C.: 70 years of lake evolution and glacial lake outburst floods in the Cordillera Blanca (Peru) and implications for the future, Geomorphology, 365, 107178, https://doi.org/10.1016/j.geomorph.2020.107178, 2020.
Emmer, A., Mergili, M., and Veh, G.: Glacial Lake Outburst Floods: Geomorphological Agents and Hazardous Phenomena, Treatise on Geomorphology, Elsevier, 313–329, https://doi.org/10.1016/B978-0-12-818234-5.00057-2, 2021.
Emmer, A., Allen, S. K., Carey, M., Frey, H., Huggel, C., Korup, O., Mergili, M., Sattar, A., Veh, G., Chen, T. Y., Cook, S. J., Correas-Gonzalez, M., Das, S., Diaz Moreno, A., Drenkhan, F., Fischer, M., Immerzeel, W. W., Izagirre, E., Joshi, R. C., Kougkoulos, I., Kuyakanon Knapp, R., Li, D., Majeed, U., Matti, S., Moulton, H., Nick, F., Piroton, V., Rashid, I., Reza, M., Ribeiro de Figueiredo, A., Riveros, C., Shrestha, F., Shrestha, M., Steiner, J., Walker-Crawford, N., Wood, J. L., and Yde, J. C.: Progress and challenges in glacial lake outburst flood research (2017–2021): a research community perspective, Nat. Hazards Earth Syst. Sci., 22, 3041–3061, https://doi.org/10.5194/nhess-22-3041-2022, 2022a.
Emmer, A., Wood, J. L., Cook, S. J., Harrison, S., Wilson, R., Diaz-Moreno, A., Reynolds, J. M., Torres, J. C., Yarleque, C., Mergili, M., Jara, H. W., Bennett, G., Caballero, A., Glasser, N. F., Melgarejo, E., Riveros, C., Shannon, S., Turpo, E., Tinoco, T., Torres, L., Garay, D., Villafane, H., Garrido, H., Martinez, C., Apaza, N., Araujo, J., and Poma, C.: 160 Glacial lake outburst floods (GLOFs) across the Tropical Andes since the Little Ice Age, Global Planet. Change, 208, 103722, https://doi.org/10.1016/j.gloplacha.2021.103722, 2022b.
EO Browser: Sentinel hub EO browser, https://apps.sentinel-hub.com/eo-browser (last access: 8 January 2025), 2024.
Etzelmüller, B., Guglielmin, M., Hauck, C., Hilbich, C., Hoelzle, M., Isaksen, K., Noetzli, J., Oliva, M., and Ramos, M.: Twenty years of European mountain permafrost dynamics – the PACE legacy, Environ. Res. Lett., 15, 104070, https://doi.org/10.1088/1748-9326/abae9d, 2020.
Google Earth Pro: Google, Inc., https://www.google.com/earth/about/versions/#earth-pro (last access: 8 January 2025), 2024.
Gruber, S.: Derivation and analysis of a high-resolution estimate of global permafrost zonation, The Cryosphere, 6, 221–233, https://doi.org/10.5194/tc-6-221-2012, 2012.
Gruber, S. and Haeberli, W.: Permafrost in steep bedrock slopes and its temperature-related destabilization following climate change, J. Geophys. Res., 112, F02S18, https://doi.org/10.1029/2006JF000547, 2007.
Haeberli, W.: Untersuchung zur Verbreitung von Permafrost zwischen Flüelapass und Piz Grialetsch (Graubünden), Dissertation der Universität Basel, Mitteilung VAW/ETHZ, https://ethz.ch/content/dam/ethz/special-interest/baug/vaw/vaw-dam/documents/das-institut/mitteilungen/1970-1979/017.pdf (last access: 19 March 2025), 1975.
Haeberli, W., Iken, A., and Siegenthaler, H.: Glaziologische Aspekte beim Bau der Fernmelde-Mehrzweckanlage der PTT auf dem Chli Titlis, Mitteilung VAW/ETHZ, 41, “Festschrift Peter Kasser”, 59–75, https://ethz.ch/content/dam/ethz/special-interest/baug/vaw/vaw-dam/documents/das-institut/mitteilungen/1970-1979/041.pdf (last access: 19 March 2025), 1979.
Haeberli, W., Wegmann, M., and Vonder Muehll, D.: Slope stability problems related to glacier shrinkage and permafrost degradation in the Alps, Eclogae Geol. Helv., 90, 407–414, 1997.
Haeberli, W., Huggel, C., Kääb, A., Zgraggen-Oswald, S., Polkvoj, A., Galushkin, I., Zotikov, I., and Osokin, N.: The Kolka-Karmadon rock/ice slide of 20 September 2002: an extraordinary event of historical dimensions in North Ossetia, Russian Caucasus, J. Glaciol., 50, 533–546, 2004.
Haeberli, W., Schaub, Y., and Huggel, C.: Increasing risks related to landslides from degrading permafrost into new lakes in de-glaciating mountain ranges, Geomorphology, 293, 405–417, 2017.
Haeberli, W., Allen, S., and Frey, H.: Estimating probabilities of occurrence related to impacts on glacial lakes from large rock-ice avalanches, EGU General Assembly 2022, Vienna, Austria, 23–27 May 2022, EGU22-2511, https://doi.org/10.5194/egusphere-egu22-2511, 2022.
Hall, S. R., Farber, D. L., Ramage, J. M., Rodbell, D. T., Finkel, R. C., Smith, J. A., Mark, B. G., and Kassel, C.: Geochronology of Quaternary glaciations from the tropical Cordillera Huayhuash, Peru, Quaternary Sci. Rev., 28, 2991–3009, 2009.
Hasler, A., Gruber, S., and Beutel, J.: Kinematics of steep bedrock permafrost, J. Geophys. Res., 117, F01016, https://doi.org/10.1029/2011JF001981, 2012.
Hersbach, H., Bell, B., Berrisford, P., Hirahara, S., Horányi, A., Muñoz-Sabater, J., Nicolas, J., Peubey, C., Radu, R., Schepers, D., Simmons, A., Soci, C., Abdalla, S., Abellan, X., Balsamo, G., Bechtold, P., Biavati, G., Bidlot, J., Bonavita, M., De Chiara, G., Dahlgren, P., Dee, D., Diamantakis, M., Dragani, R., Flemming, J., Forbes, R., Fuentes, M., Geer, A., Haimberger, L., Healy, S., Hogan, R. J., Hólm, E., Janisková, M., Keeley, S., Laloyaux, P., Lopez, P., Lupu, C., Radnoti, G., de Rosnay, P., Rozum, I., Vamborg, F., Villaume, S., and Thépaut, J. N.: The ERA5 global reanalysis, Q. J. Roy. Meteor. Soc., 146, 1999–2049, https://doi.org/10.1002/qj.3803, 2020.
Hubbard, B., Heald, A., Reynolds, J. M., Quincey, D., Richardson, S. D., Zapata, M. L., Santillan, N. P., and Hambrey, M. J.: Impact of a rock avalanche on a morainedammed proglacial lake: Laguna Safuna Alta, Cordillera Blanca, Peru, Earth Surf. Proc. Land., 30, 1251–1264, 2005.
Huggel, C., Carey, M., Emmer, A., Frey, H., Walker-Crawford, N., and Wallimann-Helmer, I.: Anthropogenic climate change and glacier lake outburst flood risk: local and global drivers and responsibilities for the case of lake Palcacocha, Peru, Nat. Hazards Earth Syst. Sci., 20, 2175–2193, https://doi.org/10.5194/nhess-20-2175-2020, 2020.
Hugonnet, R., McNabb, R., Berthier, E., Menounos, B., Nuth, C., Girod, L., Farinotti, D., Huss, M., Dussaillant, I., Brun, F., and Kaab, A.: Accelerated global glacier mass loss in the early twenty-first century, Nature, 592, 726–731, 2021.
Huss, M., Bookhagen, B., Huggel, C., Jacobsen, D., Bradley, R. S., Clague, J. J., Vuille, M., Buytaert, W., Cayan, D. R., Greenwood, G., Mark, B. G., Milner, A. M., Weingartner, R., and Winder, M.: Toward mountains without permanent snow and ice, Earths Future, 5, 418–435, 2017.
IGM: Mapa geologico del Peru 1:1 000 000, Instituto de Geologia y Mineria (IGM), Lima, Peru, 1 p., 1975.
Immerzeel, W. W., Lutz, A. F., Andrade, M., Bahl, A., Biemans, H., Bolch, T., Hyde, S., Brumby, S., Davies, B., Dahe, Q., Elmore, A. C., Emmer, A., Feng, M., Fernandez Rivera, A., Haritashya, U., Kargel, J. S., Koppes, M., Kulkarni, A. V., Mayewski, P., Nepal, S., Pacheco, P., Painter, T., Pellicciotti, F., Rajaram, H., Rupper, S., Sinisalo, A., Shrestha, A. B., Viviroli, D., Wada, Y., Xiao, C., Yao, T., and Baillie, J.: Importance and vulnerability of world's water towers, Nature, 577, 364–369, 2020.
INAIGEM: The National Inventory of Glaciers: The Glacial Mountain Ranges of Peru, https://hdl.handle.net/20.500.12543/2623 (last access: 8 January 2025), 2018.
Jakob, M. and Hungr, O.: Debris-flow hazards and related phenomena, Springer Berlin, Heidelberg, Vol. 739, https://doi.org/10.1007/b138657, 2005.
Keller, F.: Automated mapping of permafrost using the program PERMAKART within the Geographical Information System ARC/INFO, Permafrost Periglac., 3, 133–138, 1992.
Kenner, R., Noetzli, J., Hoelzle, M., Raetzo, H., and Phillips, M.: Distinguishing ice-rich and ice-poor permafrost to map ground temperatures and ground ice occurrence in the Swiss Alps, The Cryosphere, 13, 1925–1941, https://doi.org/10.5194/tc-13-1925-2019, 2019.
Kinzl, H., Schneider, E., and Awerzger, A.: Cordillera Huayhuash, Perú – Ein Bildwerk über ein Tropisches Hochgebirge, Verlag Tiroler Graphik, Innsbruck, Austria, 42 pp., 1954.
Knight, J. and Harrison, S.: The impacts of climate change on terrestrial Earth surface systems, Nat. Clim. Change, 3, 24–29, 2013.
Korup, O. and Tweed, F.: Ice, moraine, and landslide dams in mountainous terrain, Quaternary Sci. Rev., 26, 3406–3422, 2007.
Krautblatter, M., Funk, D., and Günzel, F. K.: Why permafrost rocks become unstable: A rock-ice mechanical model in time and space, Earth Surf. Proc. Land., 38, 876–887, https://doi.org/10.1002/esp.3374, 2013.
LandsatLook: USGS Landsat Collection 2 data, https://landsatlook.usgs.gov (last access: 8 January 2025), 2024.
Lorang, M. S.: A wave-competence approach to distinguish between boulder and megaclast deposits due to storm waves versus tsunamis, Mar. Geol., 283, 90–97, 2011.
Lützow, N., Veh, G., and Korup, O.: A global database of historic glacier lake outburst floods, Earth Syst. Sci. Data, 15, 2983–3000, https://doi.org/10.5194/essd-15-2983-2023, 2023.
Mamot, P., Weber, S., Eppinger, S., and Krautblatter, M.: A temperature-dependent mechanical model to assess the stability of degrading permafrost rock slopes, Earth Surf. Dynam., 9, 1125–1151, https://doi.org/10.5194/esurf-9-1125-2021, 2021.
Margreth, S., Funk, M., Tobler, D., Dalban, P., Meier, L., and Lauper, J.: Analysis of the hazard caused by ice avalanches from the hanging glacier on the Eiger west face, Cold Reg. Sci. Technol., 144, 63–72, https://doi.org/10.1016/j.coldregions.2017.05.012, 2017.
McColl, S. T. and Cook, S. J.: A universal size classification system for landslides, Landslides, 21, 111–120, https://doi.org/10.1007/s10346-023-02131-6, 2024.
McFadden, E. M., Ramage, J., and Rodbell, D. T.: Landsat TM and ETM+ derived snowline altitudes in the Cordillera Huayhuash and Cordillera Raura, Peru, 1986–2005, The Cryosphere, 5, 419–430, https://doi.org/10.5194/tc-5-419-2011, 2011.
Muñoz, R., Huggel, C., Frey, H., Cochachin, A., and Haeberli, W.: Glacial lake depth and volume estimation based on a large bathymetric dataset from the Cordillera Blanca, Peru, Earth Surf. Proc. Land., 45, 1510–1527, https://doi.org/10.1002/esp.4826, 2020.
Nandasena, N. A. K. and Tanaka, N.: Boulder transport by high energy: Numerical model-fitting experimental observations, Ocean Eng., 57, 163–179, 2013.
Noetzli, J. and Gruber, S.: Transient thermal effects in Alpine permafrost, The Cryosphere, 3, 85–99, https://doi.org/10.5194/tc-3-85-2009, 2009.
Noetzli, J., Gruber, S., Kohl, Th., Salzmann, N., and Haeberli, W.: Three-dimensional distribution and evolution of permafrost temperatures in idealized high-mountain topography, J. Geophys. Res., 112, F02S13, https://doi.org/10.1029/2006JF000545, 2007.
Nott, J.: Waves, coastal boulder deposits, and the importance of the pre-transport setting, Earth Planet. Sc. Lett., 210, 269–276, 2003.
Obu, J.: How much of the earth's surface is underlain by permafrost?, J. Geophys. Res.-Earth, 126, e2021JF006123, https://doi.org/10.1029/2021JF006123, 2021.
O'Connor, J. E., Clague, J. J., Walder, J. S., Manville, V., and Beebee, R. A.: Outburst floods, in: Treatise on Geomorphology, Fluvial Geomorphology, vol. 9, edited by: Schroder, J. and Wohl, E., Academic Press, San Diego, 475–510, ISBN: 978-0-12-398353-4, 2013.
Olivieri, L. and Bettanini, C.: Preliminary observation of Marmolada glacier collapse of July 2022 with space-based cameras, Remote Sens. Lett., 14, 21–29, 2023.
Philip, S., Kew, S., van Oldenborgh, G. J., Otto, F., Vautard, R., van der Wiel, K., King, A., Lott, F., Arrighi, J., Singh, R., and van Aalst, M.: A protocol for probabilistic extreme event attribution analyses, Adv. Stat. Clim. Meteorol. Oceanogr., 6, 177–203, https://doi.org/10.5194/ascmo-6-177-2020, 2020.
Planet Team: Planet Application Program Interface: In Space for Life on Earth, San Francisco, CA, Planet Labs PBC, https://www.planet.com/ (last access: 18 March 2025), 2024.
Rabatel, A., Francou, B., Soruco, A., Gomez, J., Cáceres, B., Ceballos, J. L., Basantes, R., Vuille, M., Sicart, J.-E., Huggel, C., Scheel, M., Lejeune, Y., Arnaud, Y., Collet, M., Condom, T., Consoli, G., Favier, V., Jomelli, V., Galarraga, R., Ginot, P., Maisincho, L., Mendoza, J., Ménégoz, M., Ramirez, E., Ribstein, P., Suarez, W., Villacis, M., and Wagnon, P.: Current state of glaciers in the tropical Andes: a multi-century perspective on glacier evolution and climate change, The Cryosphere, 7, 81–102, https://doi.org/10.5194/tc-7-81-2013, 2013.
Ravanel, L., Guillet, G., Kaushik, S., Preunkert, S., Malet, E., Magnin, F., Trouvé, E., Montagnat, M., Yan, Y., and Deline, P.: Ice aprons in high-Alpine steep faces – Insights from the Mont Blanc massif (Western Alps), J. Glaciol., 69, 1275–1291, https://doi.org/10.1017/jog.2023.15, 2023.
RGI Consortium: NSIDC: National Snow and Ice Data Center, Colorado, USA: Randolph Glacier Inventory – A Dataset of Global Glacier Outlines, https://doi.org/10.7265/4m1f-gd79, 2017.
Salazar, C. and Valverde, M.: Evaluación técnica de las lagunas: Jahuacocha, Solteracocha, Gochacotán, Autoridad Nacional del Agua, Huaráz, Peru, 19 pp., 2022.
SANDRP: Glacial Lake Flood Destroys Teesta-3 Dam in Sikkim, Brings Wide-Spread Destruction, https://sandrp.in/2023/10/04/glacial-lake-flood-destroys-teesta-3-dam-in-sikkim-brings-wide-spread-destruction/ (last access: 8 January 2025), 2023.
Schauwecker, S., Rohrer, M., Huggel, C., Endries, J., Montoya, N., Neukom, R., Perry, B., Salzmann, N., Schwarb, M., and Suarez, W.: The freezing level in the tropical Andes, Peru: An indicator for present and future glacier extents, J. Geophys. Res.-Atmos., 122, 5172–5189, https://doi.org/10.1002/2016JD025943, 2017.
Shugar, D. H., Burr, A., Haritashya, U. K., Kargel, J. S., Watson, C. S., Kennedy, M. C., Bevington, A. R., Betts, R. A., Harrison, S., and Strattman, K.: Rapid worldwide growth of glacial lakes since 1990, Nat. Clim. Change, 10, 939–945, 2020.
Shugar, D. H., Jacquemart, M., Shean, D., Bhushan, S., Upadhyay, K., Sattar, A., Schwanghart, W., McBride, S., Van Wyk de Vries, M., Mergili, M., Emmer, A., Deschamps-Berger, C., McDonnell, M., Bhambri, R., Allen, S., Berthier, E., Carrivick, J. L., Clague, J. J., Dokukin, M., Dunning, S. A., Frey, H., Gascoin, S., Haritashya, U. K., Huggel, C., Kääb, A., Kargel, J. S., Kavanaugh, J. L., Lacroix, P., Petley, D., Rupper, S., and Azam, M. F.: A massive rock and ice avalanche caused the 2021 disaster at Chamoli, Indian Himalaya, Science, 373, 300–306, 2021.
Stewart-Jones, E. and Gruber, S.: Transferring cryosphere knowledge between mountains globally: A case study of western Canadian mountains, the European Alps and the Scandes, Journal of Alpine Research, 111-2, 12203, https://doi.org/10.4000/rga.12203, 2023.
Stoffel, M. and Huggel, C.: Effects of climate change on mass movements in mountain environments, Progress in Physical Geography – Earth and Environment, 36, 421–439, 2012.
Thompson, L. G., Mosley-Thompson, E., Davis, M. E., Lin, P.-N., Henderson, K. A., Cole-Dai, J., Bolzan, J. F., and Liu, K.-B.: Late glacial stage and Holocene tropical ice core records from Huascarán, Peru, Science, 269, 46–50, 1995.
USGS: Earthquake catalogue, USGS Earthquake Hazards Program, https://earthquake.usgs.gov/earthquakes/search/ (last access: 8 January 2025), 2024.
Valderrama, P. and Vilca, O.: Dinámica del aluvión de la Laguna 513, Cordillera Blanca, Ancash, Perú, Primeros alcances, in: XV Congreso Peruano de Geología, Resúmenes Extendidos, Perú, 27 September–1 October 2010, Sociedad Geológica del Perú, Cusco, Vol. Pub. Esp., No. 9, 336–341, 2010.
van Oldenborgh, G. J., van der Wiel, K., Kew, S., Philip, S., Otto, F., Vautard, R., King, A., Lott, F., Arrighi, J., Singh, R., and van Aalst, M.: Pathways and pitfalls in extreme event attribution, Climatic Change, 166, 13, https://doi.org/10.1007/s10584-021-03071-7, 2021.
Van Rijn, L. C.: Critical movement of large rocks in currents and waves, Int. J. Sediment Res., 34, 387–398, 2019.
Veh, G., Lützow, N., Kharlamova, V., Petrakov, D., Hugonnet, R., and Korup, O.: Trends, breaks, and biases in the frequency of reported glacier lake outburst floods, Earths Future, 10, e2021EF002426, https://doi.org/10.1029/2021EF002426, 2022.
Vilca, O., Mergili, M., Emmer, A., Frey, H., and Huggel, C.: The 2020 glacial lake outburst flood process chain at Lake Salkantaycocha (Cordillera Vilcabamba, Peru), Landslides, 18, 2211–2223, 2021.
Vilca, O., Vila, R., and Bustinza, V.: Reporte de inspección 01-2022: Laguna Upiscocha, INAIGEM, 16 pp., 2022.
Vilímek, V., Klimeš, J., Emmer, A., and Benešová, M.: Geomorphologic impacts of the glacial lake outburst flood from lake no. 513 (Peru), Environ. Earth Sci., 73, 5233–5244, https://doi.org/10.1007/s12665-014-3768-6, 2015.
Walter, F., Amann, F., Kos, A., Kenner, R., Phillips, M., de Peux, A., Huss, M., Tognacca, C., Clinton, J., Diehl, T., and Bonanomi, Y.: Direct observations of a three million cubic meter rock-slope collapse with almost immediate initiation of ensuing debris flows, Geomorphology, 351, 106933, https://doi.org/10.1016/j.geomorph.2019.106933, 2019.
Wegner, S. A.: Human Interaction with Glacier-Related Hazards in the Cordillera Blanca, in: Geoenvironmental Changes in the Cordillera Blanca, Peru, edited by: Vilímek, V., Mark, B., and Emmer, A., Geoenvironmental Disaster Reduction, Springer, Cham, 205–219, https://doi.org/10.1007/978-3-031-58245-5_12, 2024.
Wood, J. L., Harrison, S., Wilson, R., Emmer, A., Yarleque, C., Glasser, N. F., Torres, J. C., Caballero, A., Araujo, J., Bennett, G. L., Diaz, A., Garay, D., Jara, H., Poma, C., Reynolds, J. M., Riveros, C. A., Romero, E., Shannon, S., Tinoco, T., Turpo, E., and Villafane, H.: Contemporary glacial lakes in the Peruvian Andes, Global Planet. Change, 204, 103574, https://doi.org/10.1016/j.gloplacha.2021.103574, 2021.
Zapata, M.L.: La dinamica glaciar en lagunas de la Cordillera Blanca, Acta Mont. Ser. A Geodyn., 19, 37–60, 2002.
Zhang, G., Carrivick, J. L., Emmer, A., Shugar, D. H., Veh, G., Wang, X., Labedz, C., Mergili, M., Mölg, N., Huss, M., Allen, S., Sugiyama, S., and Lützow, N.: Characteristics and changes of glacial lakes and outburst floods, Nature Reviews Earth and Environment, 5, 447–462, 2024.
Zheng, G., Mergili, M., Emmer, A., Allen, S., Bao, A., Guo, H., and Stoffel, M.: The 2020 glacial lake outburst flood at Jinwuco, Tibet: causes, impacts, and implications for hazard and risk assessment, The Cryosphere, 15, 3159–3180, https://doi.org/10.5194/tc-15-3159-2021, 2021.
- Abstract
- Introduction
- Study area and previous lake and GLOF research
- Data and methods
- Results: description and interpretation of the 2023 event
- Discussion
- Conclusions
- Code and data availability
- Author contributions
- Competing interests
- Disclaimer
- Acknowledgement
- Financial support
- Review statement
- References
- Supplement