the Creative Commons Attribution 4.0 License.
the Creative Commons Attribution 4.0 License.
 | 09 Feb 2024
Improving the fire weather index system for peatlands using peat-specific hydrological input data
Jonas Mortelmans
Anne Felsberg
Gabriëlle J. M. De Lannoy
Sander Veraverbeke
Robert D. Field
Niels Andela
Michel Bechtold
The Canadian Fire Weather Index (FWI) system, even though originally developed and calibrated for an upland Jack pine forest, is used globally to estimate fire danger for any fire environment. However, for some environments, such as peatlands, the applicability of the FWI in its current form, is often questioned. In this study, we replaced the original moisture codes of the FWI with hydrological estimates resulting from the assimilation of satellite-based L-band passive microwave observations into a peatland-specific land surface model. In a conservative approach that maintains the integrity of the original FWI structure, the distributions of the hydrological estimates were first matched to those of the corresponding original moisture codes before replacement. The resulting adapted FWI, hereafter called FWIpeat, was evaluated using satellite-based information on fire presence over boreal peatlands from 2010 through 2018. Adapting the FWI with model- and satellite-based hydrological information was found to be beneficial in estimating fire danger, especially when replacing the deeper moisture codes of the FWI. For late-season fires, further adaptations of the fine fuel moisture code show even more improvement due to the fact that late-season fires are more hydrologically driven. The proposed FWIpeat should enable improved monitoring of fire risk in boreal peatlands.
- Article
(8523 KB) - Full-text XML
- BibTeX
- EndNote


Even though boreal peatlands cover only ∼ 2 %–3 % (4 ×10⁶ km2) of the world's land cover (Xu et al., 2018), it is estimated that they store 600 Gt of carbon (Yu et al., 2010), 25 % of the global soil carbon stock, or twice what is stored in the world's forests (Pan et al., 2011). Under wet conditions, peatlands act as a sink for atmospheric carbon (Gallego-Sala et al., 2018), but due to natural (e.g., drought or lightning-ignited wildfires) and anthropogenic (e.g., drainage for agriculture and forestry) disturbances, this sink can turn into a source (Davies et al., 2013; Granath et al., 2016; Loisel et al., 2021; Turetsky et al., 2002, 2004, 2010; Wieder et al., 2009; Wilkinson et al., 2018). Since peatlands are often considered to be saturated most of the year, they are excluded from many wildfire models (Thompson et al., 2019). On the other hand, the effect of wildfires on peatland carbon stocks has been extensively studied (Gray et al., 2021; Kettridge et al., 2019; Morison et al., 2021; Nelson et al., 2021; Turetsky et al., 2015; Wieder et al., 2009). Furthermore, the link of peat moisture to peat fire probability has received considerable attention (Lukenbach et al., 2015; Thompson et al., 2019; Wilkinson et al., 2018, 2020). With climate change, boreal peatland fires are expected to become more frequent (Turetsky et al., 2015; Wotton et al., 2010) because the boreal region is expected to experience more severe fire weather (hot and dry conditions) by the end of this century (Flannigan et al., 2016; Wang et al., 2014) and the main source of boreal ignitions and burned area, i.e., lightning, is expected to increase (Chen et al., 2021; Flannigan et al., 2013; Krawchuk et al., 2009; Veraverbeke et al., 2017).
Whereas many studies primarily focus on the impact of peat fires (Enayetullah et al., 2022; Gray et al., 2021; Kettridge et al., 2019; Morison et al., 2021; Nelson et al., 2021; Turetsky et al., 2015; Wieder et al., 2009), relatively little attention has been given to improving available approaches of monitoring fire risk originating from drought. The Canadian Forest Fire Weather Index (FWI) system (Van Wagner, 1987) is one of the most well-known systems to rate fire danger based on potential fire spread, fuel consumption, and fire intensity. It relies solely on weather observations such as temperature, relative humidity, precipitation, and wind speed. While originally developed for boreal upland forests, it is now used in almost all other fire environments around the world (de Groot et al., 2015; Di Giuseppe et al., 2020; Taylor and Alexander, 2006). The FWI system is relatively easy to use in various environments because it estimates relative fire danger as a unitless value that is interpreted differently depending on the environment (Field, 2020a). It is for example used operationally by the European Centre for Medium-Range Weather Forecasts (ECMWF) to provide daily forecasts of fire danger (Di Giuseppe et al., 2020).
The FWI empirically combines three moisture codes, each related to the moisture content of a different fuel, based on meteorological information. The fine fuel moisture code (FFMC) represents the moisture content of litter and fine fuels on the surface of a forest stand, where fires usually ignite. The duff moisture code (DMC) and drought code (DC) of the FWI system were originally designed to represent the moisture in loosely compacted decomposing and deep compact organic matter in a mineral soil (Van Wagner, 1987). For organic soils like peatlands, DC and DMC provide limited context on fire danger as they do not strictly represent moisture content in peat layers (Waddington et al., 2012). However, the existence of these moisture codes indicates that the developers recognized the importance of soil moisture in estimating fire danger, but large-scale physically based hydrological models and satellite estimates were not yet widely available at the time (Krueger et al., 2022). With recent advances in these fields, it is worth rethinking the original definition of these moisture codes, considering the high volumetric moisture content and different water table dynamics of organic soils compared to mineral soils (Waddington et al., 2012). Waddington et al. (2012) already proposed a simple adjustment to the DC based on water table model estimates and remote sensing of soil moisture to develop a new peat moisture code.
Several studies have suggested the potential use of satellite-based soil and fuel moisture products to aid in wildfire prediction (Ambadan et al., 2020; Chaparro et al., 2016; Di Giuseppe et al., 2021; Field, 2020b; Forkel et al., 2012; Holgate et al., 2017; Leblon et al., 2016; Pettinari and Chuvieco, 2020). While some of these studies focus on using remote sensing to estimate the load and moisture content in aboveground fuel (i.e., vegetation), others suggest the use of remote sensing to estimate soil moisture. Ambadan et al. (2020) found that low-soil-moisture anomalies detected by the European Space Agency's (ESA) Soil Moisture and Ocean Salinity (SMOS) mission (Kerr et al., 2010) were observed prior to the occurrence of wildfires in the majority of Canadian ecozones. However, the coarse spatial resolution (e.g., 43 km for SMOS; Kerr et al., 2010), the low temporal resolution (e.g., 2.5 to 3 d; Kerr et al., 2010), and the latency of the current L-band satellite-based products limit their direct use for daily forecasts at local or regional scales, where data at a higher spatiotemporal resolution are required (Chaparro et al., 2016). However, via the assimilation of L-band satellite observations into a land surface model (LSM), optimal soil moisture estimates at finer spatial and temporal resolutions can be obtained. For example, the downscaling of brightness temperature (Tb) data from the SMOS (De Lannoy and Reichle, 2016) and the Soil Moisture Active Passive (SMAP) missions is now well established (Reichle et al., 2019). Only recently have these data assimilation frameworks started to also explicitly account for peatlands (Bechtold et al., 2020a; Reichle et al., 2023). The Canadian Forest Service Fire Danger Group recently published a plan to update the Canadian Forest Fire Danger Rating System and, as part of that, the FWI system. These updates are planned to be published in 2025 and will add new data sources and a more process-based approach. One of the key aspects that will be incorporated is a new peatland moisture code (PMC; CFSFDG, 2021).
In this study, soil moisture estimates of a data assimilation product based on SMOS L-band brightness temperatures and a peatland-specific LSM are used to systematically replace the current FWI moisture codes. The goal is to develop a peatland-specific version of the FWI system (FWIpeat), which could then be used operationally in a similar fashion as the current system. We differentiate between early- and late-season fires in this study because we hypothesize that the effect of soil moisture differs between the two.
De Groot et al. (2013) and Parisien et al. (2023) reported that anthropogenic ignitions peak during spring (early season) and are primarily influenced by dead surface fuels, such as leaf litter, and living vegetation that may still be dry from the cold winter season, e.g., due to a ground that only recently thawed. These dead or dry surface fuels have a weak connection to soil moisture (De Groot et al., 2013; Parisien et al., 2023). Furthermore, Parisien et al. (2023) noted that late-season fires are predominantly ignited by lightning, typically igniting the organic soil layers, further emphasizing the critical role of soil moisture (Parisien et al., 2023).
For late-season fires, the majority of the fuel in peatland fires is expected to be peat organic material and to a smaller extent living vegetation (Davies et al., 2016). The moisture content of the peat organic material is directly linked to the simulated groundwater level and soil moisture content derived from PEATCLSM simulations. Additionally, peat moisture conditions are known to influence the moisture status of living vegetation, as, e.g., shown by Harris (2008). Due to the shift towards more living vegetation from early- to late-season fires and the related higher importance of peat moisture status both for below and aboveground fuel properties, we hypothesize that the replacement of the various FWI moisture codes will have different effects on estimating early- and late-season fire danger.
The paper is structured as follows: Sect. 2 describes the original FWI system, as well as the data assimilation product used and the adaptations to the FWI system. In Sects. 3 and 4 the results of the evaluation of the new FWI system against fire observations are shown and discussed. Lastly, in Sect. 5, the main conclusions of this study are summarized and the outlook for new research is discussed.
2.1 The fire weather index
2.1.1 Original FWI
The FWI system is used to estimate the danger of wildfires, i.e., both the chance of ignition to occur and the possible spread of an ignited fire. Figure 1 illustrates the composition of the FWI. It empirically combines four meteorological variables, 2 m relative humidity (RH2 m), 2 m temperature (T2 m), 10 m wind speed (V10 m), and daily precipitation (P) into three daily moisture codes, each representing the moisture content of a different fuel type (Van Wagner, 1987). The first moisture code is the fine fuel moisture code (FFMC). It represents the moisture content of litter and fine fuels on the surface of a forest stand, where fires usually ignite. It depends on the RH2 m, T2 m, P, V10 m, and the FFMC of the day before. The FFMC is a unitless number that ranges from 0 to 99, with values >90 being considered extremes. The FFMC represents a fast-drying layer. Being the top layer of the FWI structure, the FFMC is most reactive to rainfall, relative humidity, wind, temperature, drying, and smaller rainfall events as compared to the other moisture components. Van Wagner (1987) represented this sensitivity to drying by a time lag, i.e., the time necessary to lose approximately two-thirds of the free moisture above equilibrium. For the FFMC, this time lag is two-thirds of a day, showing a fast rewetting and drying after a rainfall event, resulting in large day-to-day variations. The second moisture code is the duff moisture code (DMC), which depends on RH2 m, T2 m, P, and the DMC of the previous day. It describes the moisture content of loosely compacted organic material on the forest floor. It is unitless and while it has no real upper limit, values over 60 are considered to be extreme. The time lag of the DMC is 12 d, resulting in a much slower response to rainfall events as compared to the FFMC and less day-to-day variation. The last moisture code is the drought code (DC), representing the moisture content of deep, compact organic soil layers. It is calculated using T2 m, P, and the DC of the previous day and is, just like the DMC, unitless and open-ended, but values >400 are considered to be extreme. The time lag for the DC is 52 d, showing even less day-to-day variation than the DMC.
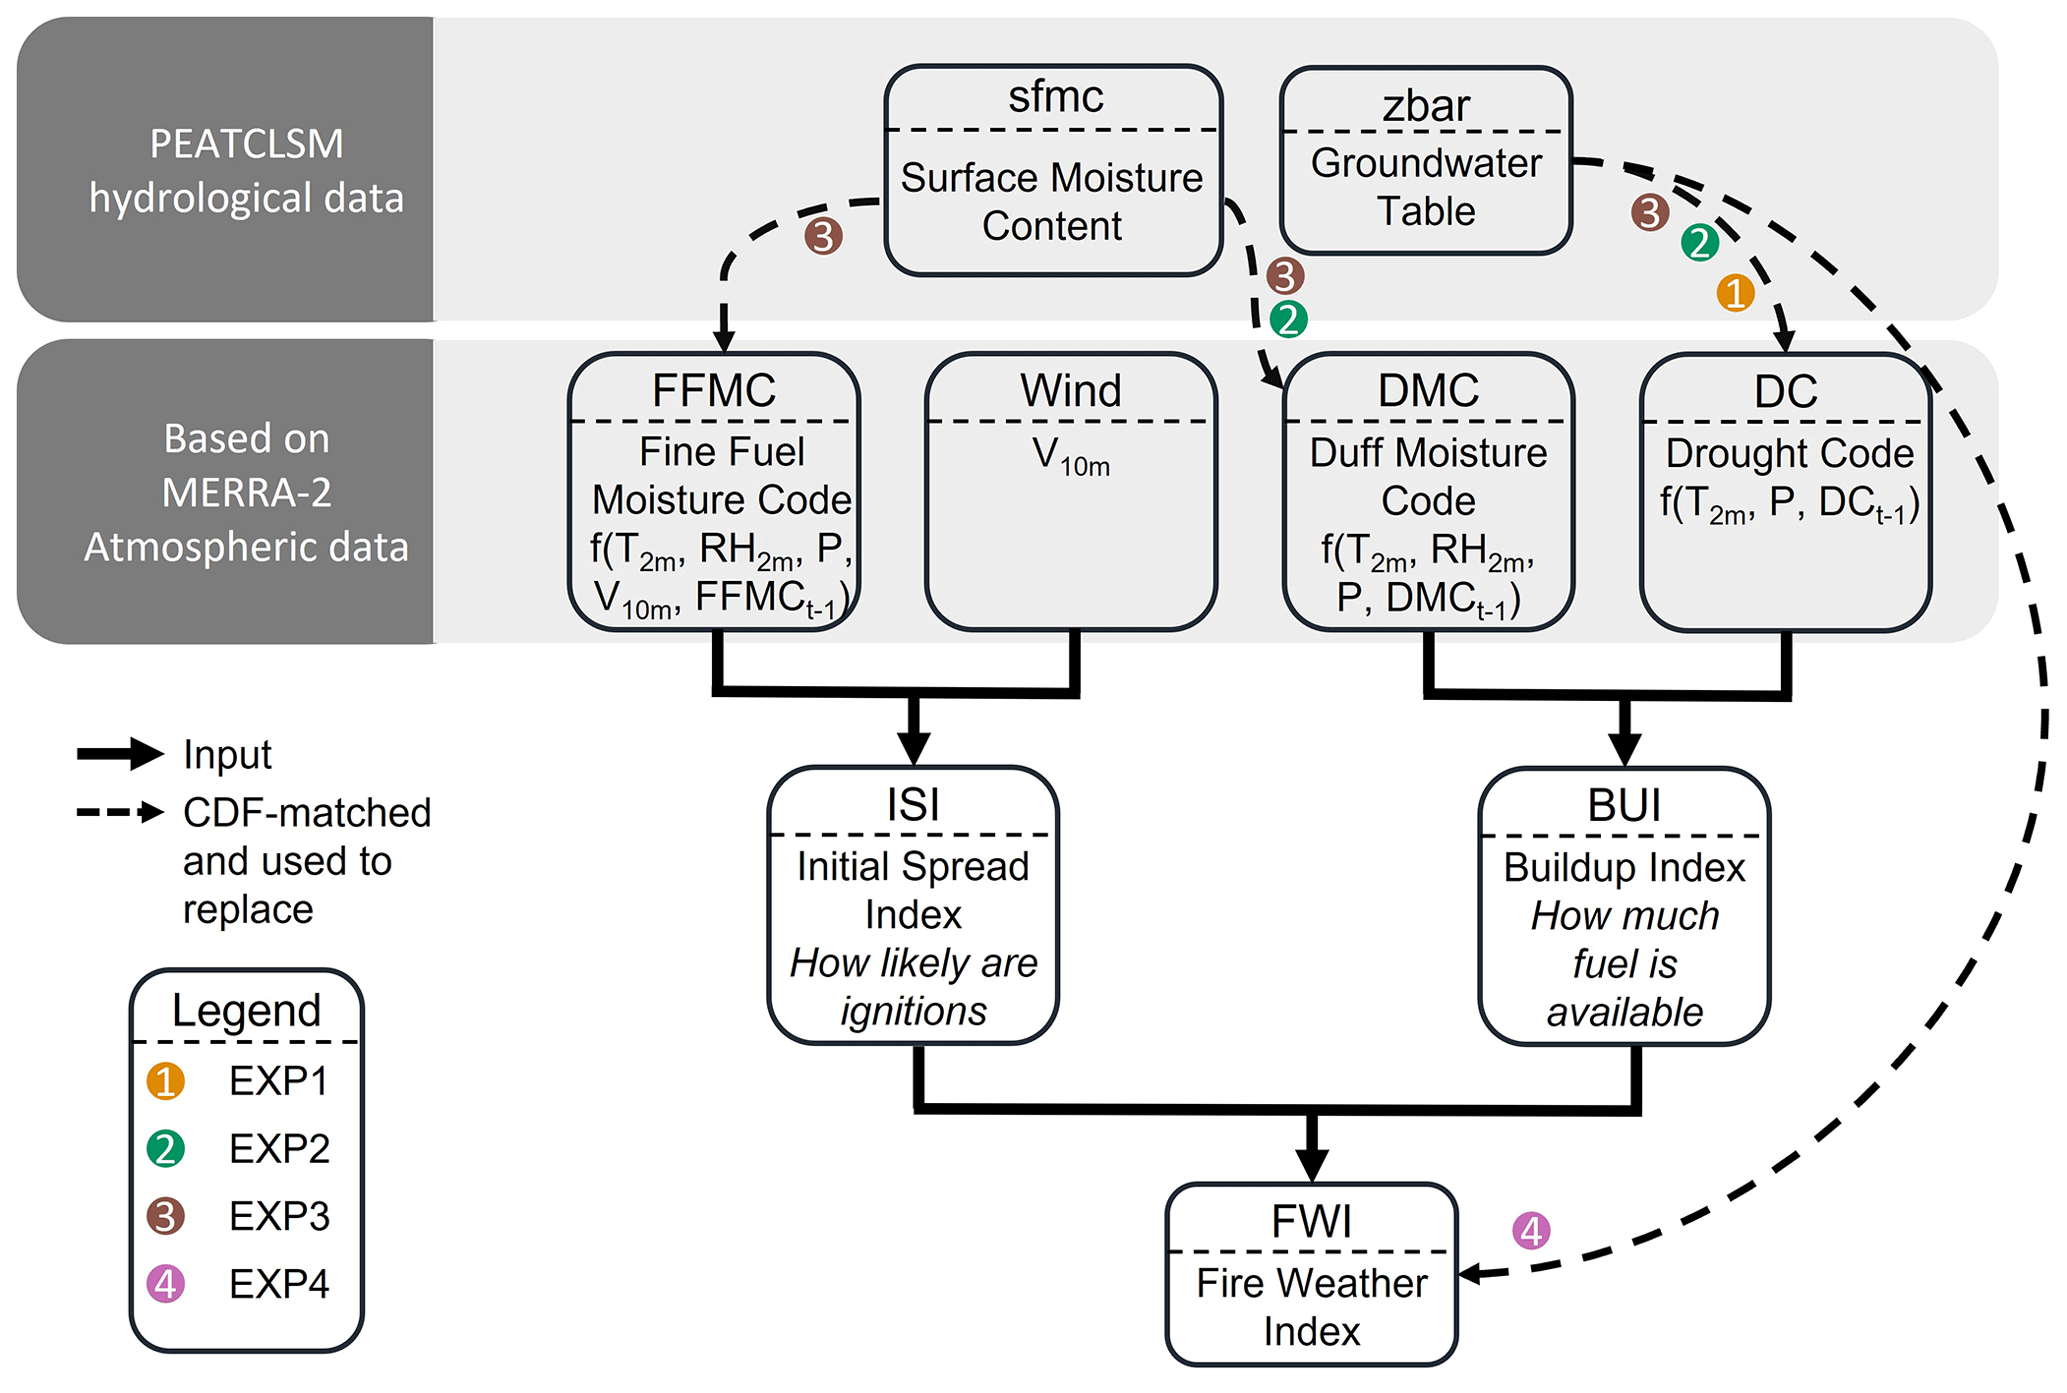
Figure 1Structure of the Canadian FWI and adaptations for FWIpeat (dashed arrows; EXP1, EXP2, EXP3, and EXP4), with T2 m the 2 m air temperature, RH2 m the 2 m relative humidity, P the daily precipitation, V10 m the 10 m wind speed, t the time step, and f() representing nonlinear, empirical functions.
The three moisture codes were then used, together with V10 m, in nonlinear empirical functions to compute three behavior indices (Van Wagner, 1987). The first behavior index is the initial spread index (ISI), which is derived from the FFMC and V10 m. It represents the ability of a fire to be ignited and spread, without taking further drying in depth, i.e., the drying of deeper soil layers due to the fire on the surface, into account. The second behavior index is the buildup index (BUI), which is driven by the DMC and DC. The BUI gives an estimate of the amount of dry fuel that is available for a fire. Lastly, the third behavior index, the FWI, is calculated based on the ISI and BUI. The FWI is a measure of the potential fire danger, i.e., if a fire were to be ignited or is already ignited, with a higher value representing a higher danger. For simplicity, hereafter, we only refer to “fire danger” in the context of FWI values. However, the FWI system does not provide specific thresholds for different levels of fire danger. Instead, users have to define such thresholds themselves, based on expert knowledge of the local environment combined with historical data and context (Van Wagner, 1987).
In this study, the meteorological data needed to calculate the original FWI calculations were taken from the NASA Modern-Era Retrospective Analysis for Research Applications version 2 (MERRA-2; Gelaro et al., 2017). MERRA-2 offers atmospheric data with a spatial resolution of 0.5∘ × 0.625∘, spanning 72 vertical levels, and a temporal resolution of 1 h. It has been applied without any downscaling. The input meteorological variables for FWI, i.e., RH2 m, T2 m, and V10 m, were based on the instantaneous values at noon of each day. For P, the in situ gauge-corrected accumulated total precipitation of the last 24 h was used. The actual FWI calculations were conducted using the source code of the Global Fire WEather Database (GFWED; Field et al., 2015), which relies on MERRA-2 as input weather data in the retrospective mode. However, it is worth noting that our study did not entail specific validation of the MERRA-2-based calculations against in situ weather station observations. A comprehensive validation of the GFWED code can be found in Field et al. (2015), which highlights potential biases, particularly for the lower latitudes. For the boreal region, the MERRA-based FWI calculations showed some overestimation of DC, but this depends on the specific region. We are aware that the performance of the FWI depends on the quality of the meteorological input data and in the case of the FWIpeat also on the hydrological input data which in our case are generated using the same source of meteorological input data for the sake of comparability between FWI and FWIpeat.
Aside from the four above-mentioned meteorological variables, snow depth (SD) and mean daily air temperature (Tavg) were also derived from MERRA-2. These two variables set two thresholds to determine whether the FWI is calculated for a given day and location. If SD ≥ 1 cm or Tavg≤6 ∘C for a certain location on a specific day, the FWI is not calculated, as the occurrence of a fire is highly unlikely. Additionally, to start the FWI calculations, 3 consecutive snow-free days is required. In locations where no snow occurs, 3 consecutive days with a Tavg>6 ∘C is needed. A more detailed description of the use of these thresholds and the start-up of the FWI calculations is given in Field et al. (2015).
2.1.2 FWIpeat
To adapt the FWI system over peatlands, we propose a new FWIpeat system. The key input for the FWIpeat comes from a peatland-specific LSM into which L-band passive microwave observations from SMOS (Kerr et al., 2010) were assimilated from 2010 onwards, as described in Bechtold et al. (2020a). The peatland-specific LSM is based on NASA's catchment land surface model (CLSM; Koster et al., 2000) and its peatland modules (PEATCLSM; Bechtold et al., 2019). The PEATCLSM model was forced with hourly 0.625∘ × 0.5∘ MERRA-2 data and was run at a horizontal resolution of 9 km on the cylindrical Equal-Area Scalable Earth grid version 2.0 (EASEv2; Brodzik et al., 2012) and a temporal resolution of 1 d. The domain of the data assimilation (DA) system is the same as described in Bechtold et al. (2020a), ranging from 45∘ N, 170∘ W to 70∘ N, 95∘ E, and the peatland distribution in this area for the DA system was taken from De Lannoy et al. (2014). Due to the highly uncertain information on peatland distribution in eastern Siberia (Xu et al., 2018), this area was excluded from our study domain. If not mentioned otherwise, the term “boreal peatlands” refers to all peatlands in this domain.
For the FWIpeat, four experiments were set up, each replacing another part of the original FWI system, using a daily peatland groundwater table and surface moisture content from the peatland-specific data assimilation output. An overview of the four experiments is given in Table 1 and Fig. 1. For the first experiment (EXP1 from here on), DC was replaced by the PEATCLSM groundwater table (zbar). For the second experiment (EXP2), DC was replaced by zbar, just like for EXP1, but additionally, DMC was also replaced by PEATCLSM surface moisture content (sfmc), which represents the moisture content in the top 5 cm of the soil. The third experiment (EXP3) is similar to EXP2 but also has the FFMC replaced by sfmc. Lastly, the fourth experiment (EXP4) replaces the final FWI directly with PEATCLSM zbar.
Since the range of the zbar (typically −1 to 0 m) and sfmc (0–0.8) is much smaller than the ranges of the different moisture codes of the FWI (e.g., 0–99 for FFMC), a direct replacement of the moisture codes was not possible without massively changing the relative weights of the different moisture codes on the following ISI, BUI, and FWI calculations. Instead, to maintain the integrity of the original FWI, we matched the temporal cumulative density functions (CDFs) of the PEATCLSM output variables to those of the corresponding moisture codes for each grid cell using the Python package pytesmo (Paulik et al., 2023). While this ensures that the CDFs of the PEATCLSM output variables and those of the corresponding FWI moisture codes match, the approach preserves the dynamical features (short-term and long-term anomalies as well as seasonal dynamics) of the PEATCLSM output. By performing this CDF matching on a per-grid-cell basis, any spatial biases present in the PEATCLSM output, such as a possible dry bias over the Boreal Plains in Canada (Bechtold et al., 2019), were removed. It is worth noting that any spatial bias in (the moisture codes of) the FWI will thus be maintained in the new FWIpeat with this per-grid-cell approach. However, our primary objective is to underscore the value of temporal peatland hydrological data within an established fire danger rating system.
Table 1Setup of the different experiments showing the moisture code of the FWI that is changed by PEATCLSM output.
2.2 Evaluation
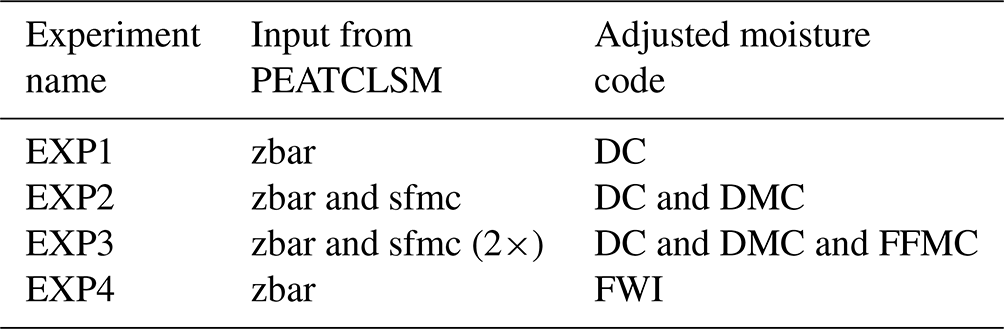
The different experiments described in Sect. 2.1.2 were compared against the original FWI (FWIref) in their capability to estimate fire danger. As a reference for fire danger, daily peat fire observations were used (Andela et al., 2019a). We acknowledge that a high FWI value does not necessarily indicate the presence of a fire, but we assume in the other direction that fire presence indicates high fire danger. Due to the seasonality of boreal wildfires and to test our hypothesis that late fires are more hydrologically driven, the fires were separated into early- and late-season fires, based on the date of the minimum peat fire frequency between the early- and late-season fire peak of the multi-year climatology. Figure 2 shows the bimodal climatological histogram of the number of all fires in the boreal zone for each day of year (DOY). The minimum value occurred on DOY 130, or the 10 May, which is a bit later than the general start of the fire season (April; De Groot et al., 2013).
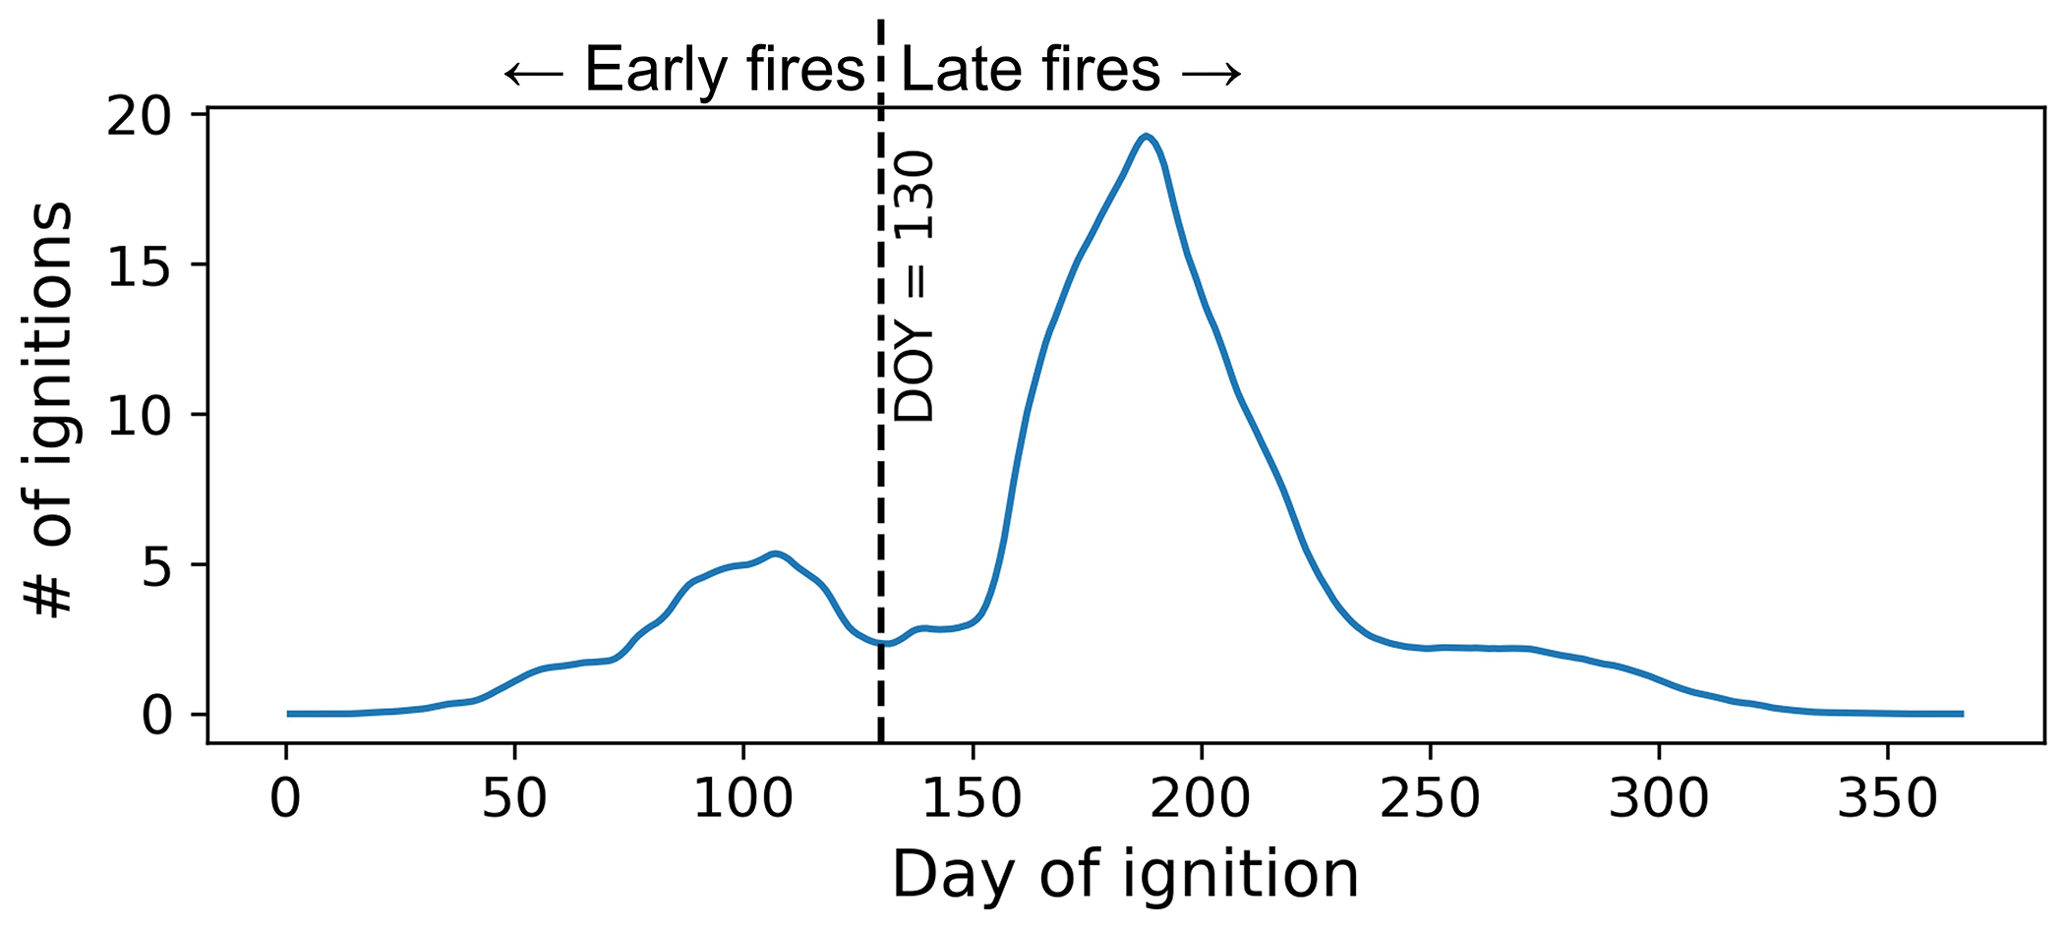
Figure 2Climatology of boreal peat fire ignitions per year based on data from the Global Fire Atlas (Andela et al., 2019a) from 2010 through 2018 and the 30 arcsec peatland map. The dashed black line indicates day of year (DOY) 130, which is used to separate the dataset into early and late fires.
2.2.1 Peatland map
The peatland distribution in this study was based on the one used in the most recent SMAP Level-4 Soil Moisture product (SMAP L4_SM v7; Reichle et al., 2023). This map is a blend of the Harmonized World Soil Database version 1.21 (HWSD1.21; FAO/IIASA/ISRIC/ISSCAS/JRC, 2012), the State Soil Geographic (STATSGO2) dataset (NCRS Soil Survey Staff, 2012) over the United States (including Alaska, Hawaii, and Puerto Rico; De Lannoy et al., 2014), and the PEATMAP (Xu et al., 2018). Due to the relatively low quality of this map over Canada, where PEATMAP only indicates large polygons with an average peatland fraction, we additionally used a new machine-learning-based 10 m resolution peatland distribution over Canada, i.e., the Canadian Wetland Inventory Map generation 3 (CWIM3; Mahdianpari et al., 2021), to only select strictly peat locations. The resulting peatland distribution was aggregated to a 30 arcsec resolution and used in the fire data processing described in Sect. 2.2.2. The map is shown at a coarser resolution (36 km) for the Northern Hemisphere in Fig. 3a.
Figure 3Map of the study domain showing (a) the peatland distribution, (b) the annual number of ignitions in peatlands, (c) the annual burned peat area (as a percentage of peat area in the grid cell), and (d) the average duration of peatland fires from 2010 through 2018 aggregated to a 36 km EASEv2 grid.
Since the CWIM3 data are not included in the peatland distribution used for the PEATCLSM simulations, the simulation output was cross-masked with this updated peatland distribution prior to the CDF matching done in the next steps of this study. The FWIref and the FWIpeat were thus only calculated for grid cells that are indicated as peatland in both the PEATCLSM simulations and the CWIM3 data.
2.2.2 Peat fire dataset
To assess the performance of original FWI and FWIpeat, we generated a peat-specific fire dataset from global data on peat fires for the years 2010 through 2018. Peat fire data were derived by combining information from the 30 arcsec peatland map (see Sect. 2.2.1) with the Global Fire Atlas (GFA; Andela et al., 2019a).
For the GFA, Andela et al. (2019a) grouped burned area pixels based on the Moderate Resolution Imaging Spectroradiometer (MODIS) Collection 6 (Giglio et al., 2018) into individual fire occurrences. From this, they derived the timing and location of ignitions as well as the fire extent. Due to the 500 m spatial resolution of MODIS, very small fires with burned areas ≪0.25 km2 are not contained in the GFA (Giglio et al., 2018).
We then based the differentiation into peat and non-peat fires on the map of peatland fraction at the 30 arcsec resolution (∼ 500 m). The most intuitive threshold for the minimum peat fraction that indicates the likely presence of a peat fire is 0.5. However, we noted that for the aggregation of the fine spatial resolution of CWIM3 (10 m) to the 30 arcsec binary peat/non-peat grid, the actual peat coverage over Canada would be strongly underestimated using a peat/non-peat threshold of 0.5. This is due to many grid cells having a peat coverage just a little smaller than 0.5. To correct this bias in peatland coverage and eventually to prevent an underestimation in peat fire presence, we adjusted this threshold. First, we derived the percentage of the total Canadian land area that is considered to be peat at the 10 m resolution. Next, different thresholds of peat fraction at the coarse resolution (30 arcsec) were used to determine the fraction that results in the same percentage of the Canadian land area being peat. This threshold was determined to be 0.4, or a 30 arcsec grid cell with at least 40 % of the land surface classified as peat is considered a peatland pixel. This threshold is then used for the whole study area but had very little to no effect outside of Canada, as the resolution of the peatland distribution was already coarser originally.
All fires that extended into peatland are defined as “peat fires” independent of their ignition location (outside or inside peatland). Peat fire size is subsequently defined as the peatland area burned within one peat fire and hence typically smaller than the total fire size, and general statistics about all peat fires based on the 30 arcsec peatland map described in Sect. 2.2.1 are presented in the results.
Next, we focus on the evaluation of the FWI as an indicator of the danger of fire presence, i.e., the presence of an active fire (Sect. 2.2.3 and 2.2.4). For this, we only used the subset of peat fires that were ignited on peatland and for which peat-specific output from PEATCLSM existed (see cross-masking in Sect. 2.2.1). This means that FWIref and FWIpeat were extracted for each day and location an active fire was present (see Sect. 4.3). To clarify, if a particular fire lasted for 10 d, its influence is considered 10 times. It is crucial to emphasize that this “fire presence” approach ensures that longer-lasting fires carry more weight in our analysis. If not mentioned otherwise, the term “fire” hereafter refers to peat fire.
2.2.3 Hits and misses
The first evaluation method, the so-called “hits and misses” approach, compares the hits and misses of FWIref and FWIpeat. For this, the continuous FWI scale was converted into a binary fire/no-fire scale. The prediction of a fire event is based on a chosen threshold. This threshold was chosen as the 90th percentile of the historical (2010–2018) FWI values for the late season, similar to Di Giuseppe et al. (2020), and as the 70th percentile of the historical FWI values for the early season. This threshold is lower for the early fires, as these fires may occur with a lower FWI due to factors like the presence of dead vegetation of the previous year or the early-season dryness of the living vegetation when soil is still partly frozen (De Groot et al., 2013). Furthermore, humans may ignite surface fires on peatlands for management practices when peatlands are still wet, i.e., the FWI values are still lower. These specific conditions for human ignitions create a different setting for the interpretation of the FWI compared to lightning fires, which dominate late-season fires. If a fire is in the GFA, but the value of the FWI is not above the threshold, this is classified as a miss.
With this method, the change between the original FWI (FWIref) and the FWIpeat of the different experiments can be readily investigated as follows. When FWIref results in a hit, and the new FWIpeat does not, this is noted as a “hit to miss”. If it is the other way around, i.e., a miss for FWIref and a hit for FWIpeat, it is called a “miss to hit”. To additionally quantify the magnitude of the change from a hit to a miss or vice versa, ΔFWI is calculated:
with ThresholdX the historic 70th percentile of the FWIref or the FWIpeat for the early-season fires, as well as the historic 90th percentile of the FWIref or the FWIpeat for the late-season fires. Note that and Thresholdref are not equal after CDF matching of the soil moisture codes because they are nonlinearly propagated into the FWI. Since these thresholds are somewhat arbitrarily chosen and the value of the thresholds influences the results presented in this study, the next section (Sect. 2.2.4) discusses another evaluation method that uses the full range of possible thresholds. Also the effect on false alarms is included in the next section.
2.2.4 Receiver operating characteristics
The receiver operating characteristic (ROC) curve and area under the curve (AUC) were calculated as a second evaluation method. The ROC curve plots the true positive rate (TPR) as a function of the false positive rate (FPR) for varying FWI thresholds. The TPR is the ratio of correctly predicted fire grid cells over all (in space and time) observed fire grid cells. Because the predicted fire presence depends on a set threshold for the FWI, varying this cut-off value results in a different TPR and FPR. This trade-off between both metrics for different cut-off values is shown by the ROC curve. To indicate the TPR and FPR of the corresponding threshold used for the hits and misses approach (the historical 70th (early fires) or 90th (late fires) percentile of the FWI), a star was plotted on the ROC curves.
The ROC curve can be used either to find the optimal cut-off value, i.e., the value for which the point of the ROC is the closest to the upper left corner, or to compare the predictive performance of different models. For the latter, the AUC, a measure of a model's discriminatory power, is used as illustrated in Fig. A1. The AUC has a maximum value of 1, indicating a perfect representation of the spatiotemporal fire presence by the FWI calculation. A value of 0.5 indicates no discriminative power; i.e., the model does not perform better than a uniform distribution. In other words, the top left corner of the ROC plot is the ideal point, with a TPR of 1 and an FPR of 0. By comparing the ROC curve and AUC of different experiments, their relative performance can be evaluated. Experiments with a higher AUC, i.e., a ROC curve that goes further to the upper left corner, have a higher predictive capability. Note that the computation of the ROC curve required binary fire presence (0: no fire; 1: fire) data, so even if multiple fires were ignited in the same 9 km grid cell on the same day, the fire presence in that grid cell is still set to 1. A graphical illustration of the ROC curves for different classifiers is shown in Fig. A1.
Lastly, to assess how the FWIref and the FWIpeat performs for the different regions of the boreal zone, the ROC curve of the late fires was calculated separately for Alaska, Canada, Europe, and Siberia. Due to an insufficient number of fire events, such a regional stratification was considered unreliable for the subset of early fires.
3.1 Peatland fires
Figures 3 and 4 give an overview of the peat fire dataset, described in Sect. 2.2.2, and the peatland distribution based on the used peatland map described in Sect. 2.2.1, regridded to a 36 km grid in Fig. 3 to aid the visualization. The peat fraction shown in Fig. 3a, shows vast areas of peatland in Alaska, central Canada, Hudson Bay, Scandinavia, and western Siberia. Figure 3b shows that for most grid cells, there is less than 1 fire per year, but in some of the hot spots, located in central Alaska, this number goes up to almost 30 fires in a 36 km grid cell. However, while central Alaska apparently has many more fires per year, the burned area in central Canada is much larger (see Fig. 3c). Note that the burned area here is represented as the percentage of peat area in the 36 km grid cell (or 1296 km2) that is burned. On average, 0.71 % of the peatlands in our study domain burn each year. This means that the average peatland fire return interval for our study domain is approximately 141 years. In total, over the full study area and period (2010–2018), there are 12 321 ignitions on peatlands, resulting in 9025 d of early and 47 684 d of late fire presence, i.e., days with an active fire at a specific location, so in total there are 56 709 d of active fire presence considered in this study.
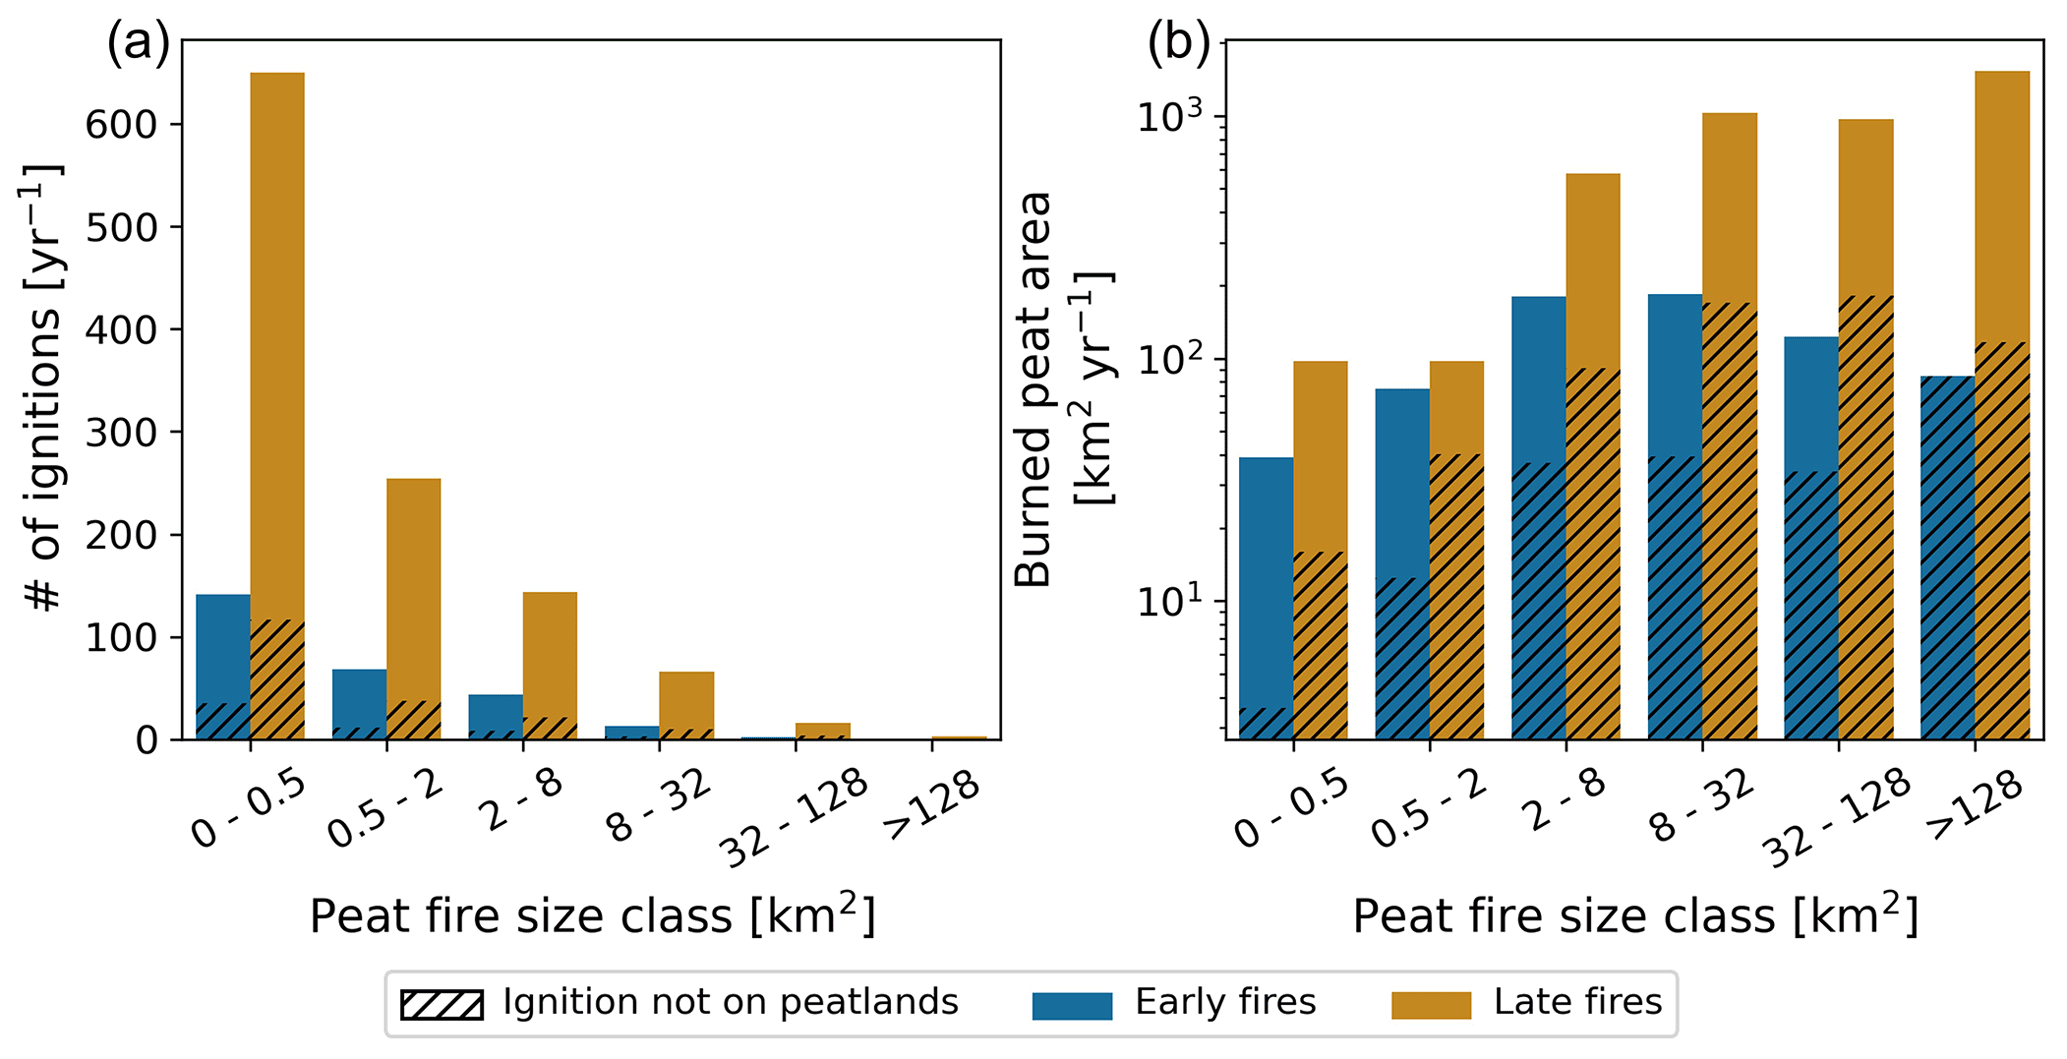
Figure 4Bar plots showing (a) the annual number of peat fires and (b) annual burned peat area for different peat fire sizes based on the 30 arcsec peatland map. Wildfires that did not spread into peatlands are not considered here. Striped black parts indicate fires that are ignited outside but moved into peatlands.
Figure 4a shows the number of fires per year for different peat fire sizes, differentiated between early (blue) and late (orange) fires. The fires that burned peatlands but were not ignited on a peatland are indicated with black hatches. In Fig. 4b, the same information is shown for the annual burned peat area instead of the number of peat fires.
Comparing the two panels of this figure and keeping in mind that the y axis for the right panel is set on a logarithmic scale, it shows that even though the vast majority of peat fires is rather small (<2 km2), most of the burned peat area is caused by relatively few large fires. In fact, ∼ 90 % of the burned peat area from 2010 through 2018 is caused by fires ≥2 km2, even if they only account for 20 % of ignitions.
3.2 FWIpeat
Figure 5 shows a time series of the different FWI components for FWIref (solid blue line) and the different FWIpeat experiments for a given fire season (June 2012 to September 2012) at a single location (62.68∘ N, 78.56∘ W) with multiple fires. By design (see Table 1), some components are the same for different experiments. Only the color of the experiment with the lowest index (e.g., EXP1 and not EXP2) is shown in Fig. 5, with an indication of which other experiments have the same time series. The vertical black lines indicate the ignition times of a fire, with the duration visualized by the gray shaded areas. The horizontal lines, indicated by T90,X with X, in the bottom panels indicate the 90th percentile threshold for the different experiments and FWIref. If the FWI value is above this line, a fire is predicted according to the corresponding FWIref or the FWIpeat.
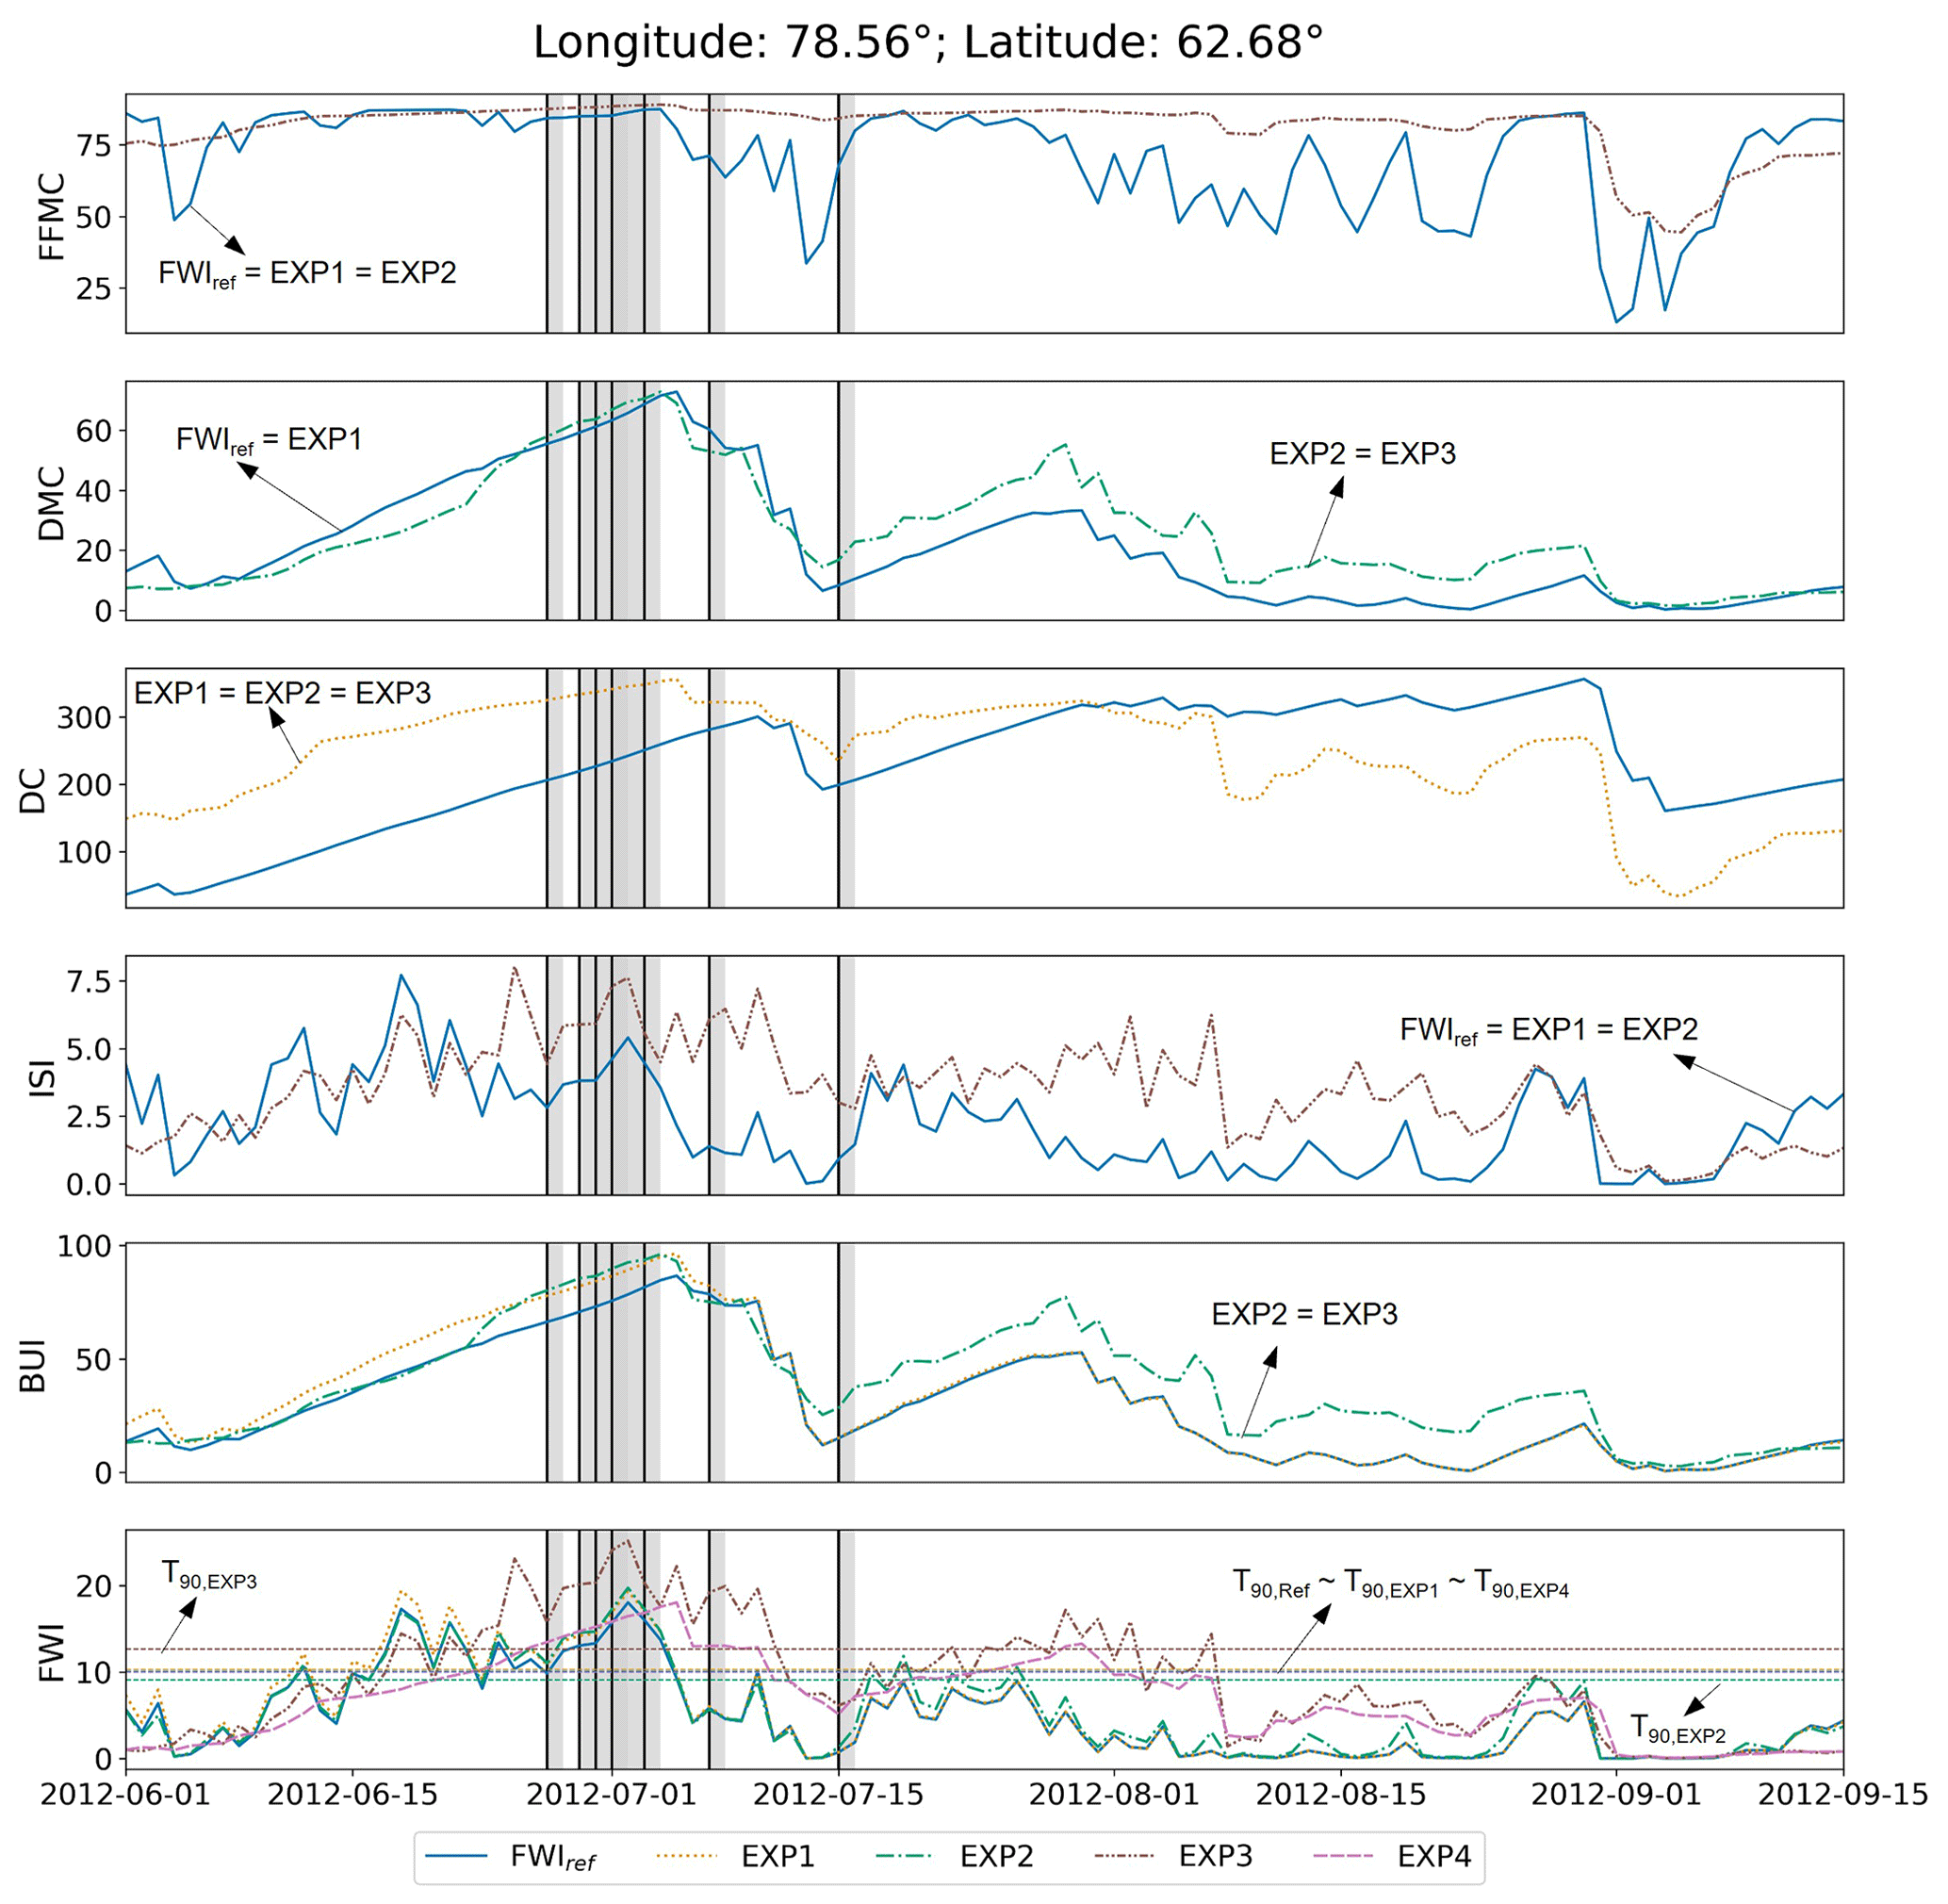
Figure 5Time series of the different FWI components for one location and fire season (June–September) for the different experiments. Note that when multiple experiments have the same modification of an FWI component, that of the lowest experiment index is shown here, with an annotation of the experiments that show the same time series. For EXP4, only the FWI time series is given, as zbar is directly used for FWI. Vertical black lines mark the start of a fire, and the gray shadings indicate its duration. The dashed horizontal lines in the bottom panel indicate the thresholds for the different experiments (e.g., T90,EXP1 is the 90th percentile threshold for EXP1).
For all moisture codes (DC, DMC, and FFMC), it can be noted that even though the range of the replaced codes is similar to that of the reference, there are substantial differences in the temporal dynamics. Whenever there is a clear, steep drop in the reference (solid blue line) time series, there is also (to some extent) a drop in the replaced moisture code. Since CDF matching does not alter the temporal context of the data but only adjusts the CDF of the PEATCLSM output to that of the FWIref components, all differences in dynamics (short- and long-term) between the two datasets are maintained.
In general, over the whole fire season, all the time series of the components of EXP1 and EXP2 show a very similar pattern to those of FWIref. This is not the case when looking at the replaced FFMC, and consequently ISI, of EXP3. While the FFMC of FWIref shows great day-to-day variation, this is not the case for the FFMC of EXP3. This effect is passed down further through the FWI structure, eventually also resulting in the FWI time series shown in the bottom panel. When comparing the ISI and FWI of EXP3, one can see that both lines follow a more or less similar pattern. Furthermore, when the FFMC of EXP3 is larger than that of FWIref, then the ISI and FWIpeat are also larger.
By comparing the raw CDF-matched PEATCLSM output (i.e., the DC for EXP1, DMC for EXP2, FFMC for EXP3, and FWI for EXP4), it is clear that they all still follow the same temporal dynamics. It is only when other meteorological parameters are introduced (e.g., wind in the ISI calculation for EXP3) that the time series start to deviate. By analyzing the FWI curves in the last panel of all FWIpeat and FWIref, it can be noted that there is only a minor influence of the DC and DMC on the calculated FWI. For EXP3, in which also the FFMC is replaced, a much larger difference with FWIref is seen.
3.3 Evaluation
3.3.1 Hits and misses
Figure 6 shows for each experiment the hits of FWIref that turned into misses in the different experiments (so-called hits to misses) in dark gray (negative ΔFWI values) and the misses of FWIref that turned into hits in the different experiments (so-called misses to hits) in light gray (positive ΔFWI values) as the percentage of all observed fires. The top row shows this for the early fires and the bottom row for the late fires. Note that this figure only shows the ΔFWI value if there was a change between FWIref and the experiments. If there was a hit or miss in both cases, the ΔFWI value is not shown here. For early fires, there is a clear difference between EXP1 and EXP2 on the one hand and EXP3 and EXP4 on the other. EXP1 and EXP2 mainly improve the predictive capability of the FWI compared to FWIref (positive ΔFWI values), while EXP3 and EXP4 show mainly a deterioration of the predictive capability (negative ΔFWI values), even though the absolute number of changed predictions (both positive and negative; n=67 and 174 for EXP1 and EXP2, respectively) is larger for EXP3 (n=697) and EXP4 (n=636). For the late fires, a similar trend in the number of changes can be seen, with n being much larger for EXP3 (n=15 624) and EXP4 (n=16 924) compared to EXP1 (n=546) and EXP2 (n=3512).
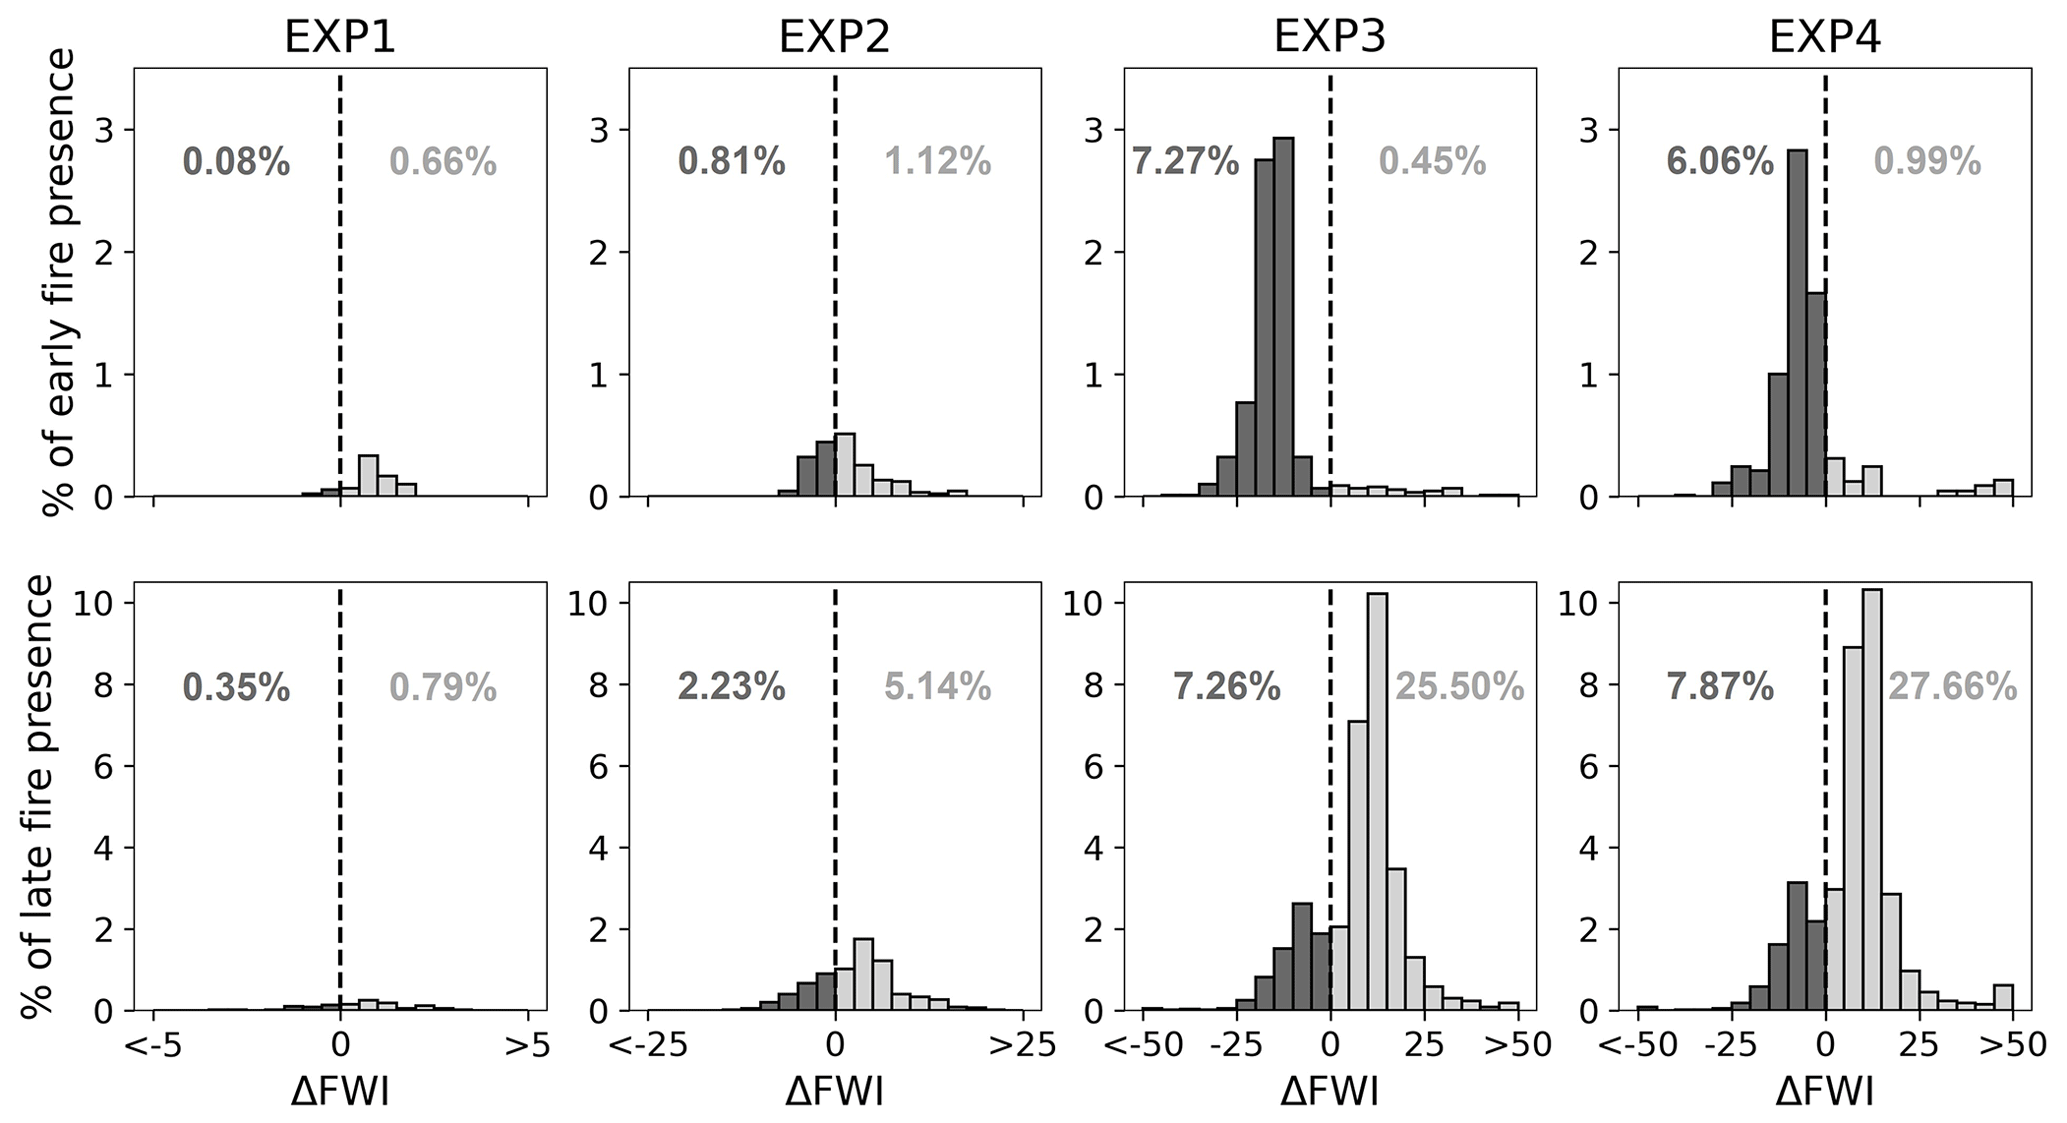
Figure 6Histograms showing the percentage of observed fires (for 2010–2018) that changed from a hit to a miss or vice versa per ΔFWI interval for the different experiments (columns) separated for early (top) and late (bottom) fires. The dark bars indicate a hit to miss and the light bars a miss to hit. The percentage indicates the relative number of changes compared to all days of early (n=9025) or late (n=47 684) fire presence. FWIref results in a hit for 8.69 % of early fires and 27.51 % of late fires.
When subtracting the deterioration from the improvement, one can evaluate the net effect of the FWIpeat for the different experiments. This shows that EXP1 has a small net improvement compared to the FWIref for both the early and late fires of 0.58 % and 0.44 %, respectively, i.e., 0.58 % of the fires in the early season are better predicted with EXP1 than with FWIref using the 70th percentile threshold. EXP2 also shows a net improvement for both seasons (0.31 % and 2.91 % for the early and late season, respectively). For the early season, EXP3 and EXP4 show a net deterioration of 6.82 % and 5.07 %, respectively. For the late season, both experiments show a large improvement of 18.24 % and 19.79 % for EXP3 and EXP4, respectively.
The large difference in n between the different experiments indicates that if more of the original FWI structure is changed, the eventual FWI is also changed more. As described in Sect. 2.1.2, EXP1, in which only DC was replaced, is still much more similar to the original FWIref than e.g., EXP3, where all moisture codes are replaced by PEATCLSM output. Consequently, the calculated FWI remains more similar to FWIref for EXP1 than for EXP3. That results in fewer changes in the prediction of fires and thus fewer hits to misses and misses to hits.
3.3.2 ROC
Figure 7 shows the ROC curves and corresponding AUC for the early (Fig. 7a) and late (Fig. 7b) fires for the different experiments. For the early fires, two general trends can be seen. The first trend, followed by FWIref and EXP1, shows a relatively low AUC (0.66 and 0.67 for FWIref and EXP1, respectively). EXP2, EXP3, and EXP4 follow the second trend, with slightly higher AUC values (0.71, 0.72, and 0.72 for EXP2, EXP3, and EXP4, respectively). The stars on the curves indicate the TPR and FPR of the 70th percentile threshold.
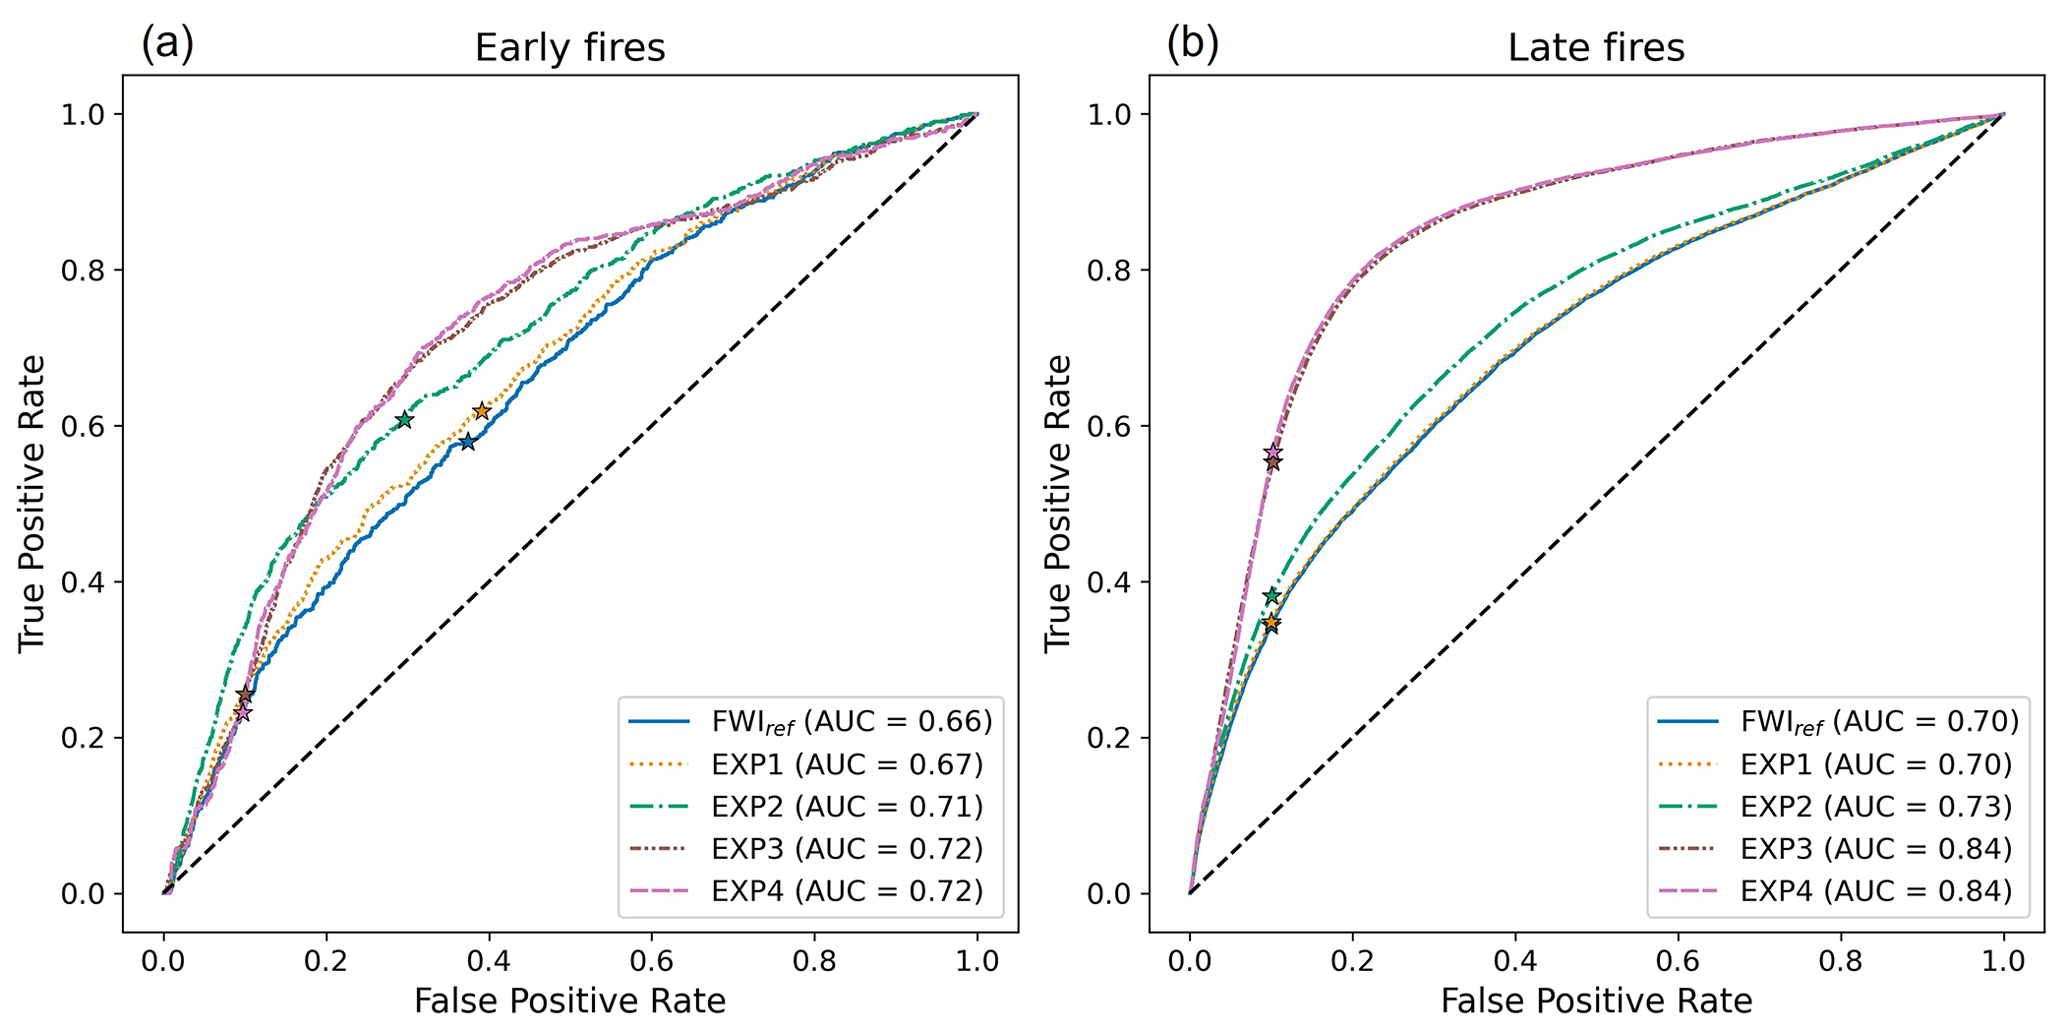
Figure 7ROC curves and corresponding AUC of the different experiments and FWIref for days of (a) early (n=9025) and (b) late (n=47 684) fire presence. Stars indicate the true and false positive rates of the 70th (for early fires) or 90th (for late fires) percentile, used as a threshold for the hits and misses analysis.
For the late fires (Fig. 7b), the differences between the experiments are much more pronounced. EXP1 still closely resembles FWIref, with both ROC curves having the same AUC (0.70). The AUC of EXP2 (0.73) already indicates a slight improvement, but the difference is still minor. The biggest improvements are seen for EXP3 and EXP4 (AUC = 0.84 for both EXP), with a net improvement compared to FWIref of 14 % for the late fires. This means that integrated over all thresholds, EXP3 and EXP4 have a 14 % higher accuracy than FWIref. The stars on this figure indicate the TPR and FPR of the 90th percentile threshold. Compared to the early fires, the stars here are much more aligned; i.e., they have a similar FPR but varying TPR for a set threshold.
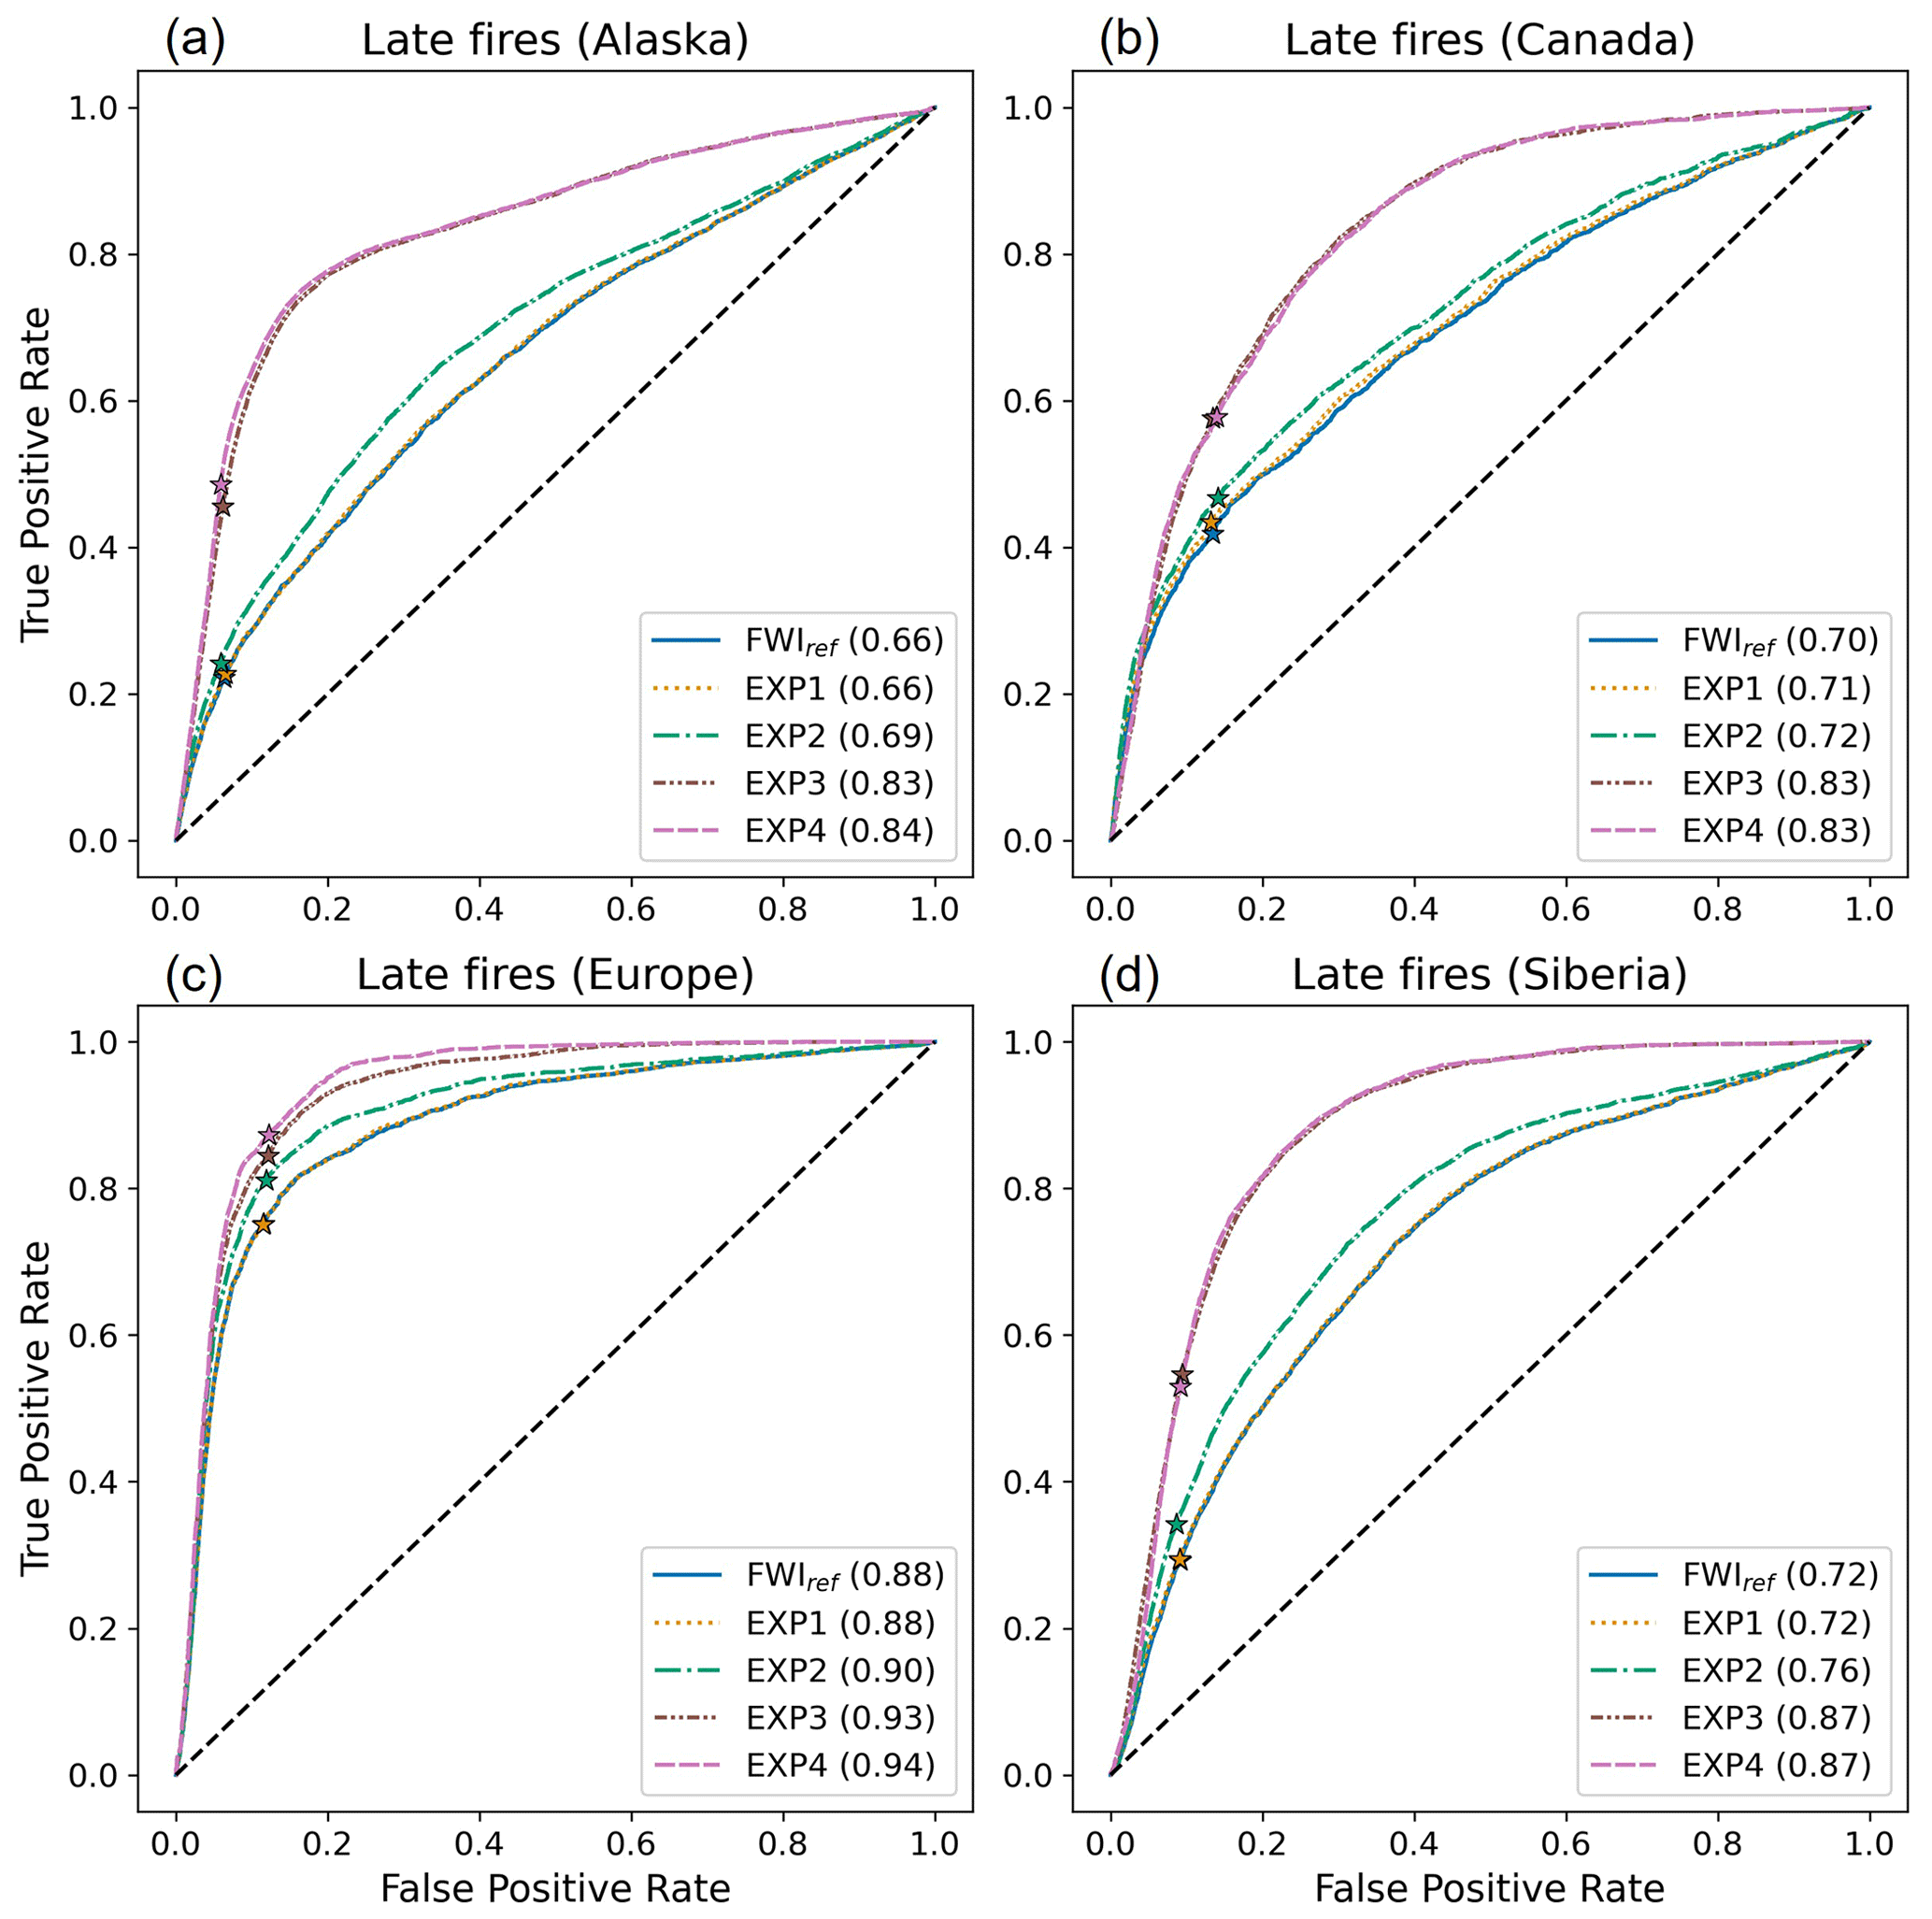
Figure 8ROC curves and corresponding area under the curve (AUC) of the different experiments and FWIref for late fires, separated for Alaska (n=16 749), Canada (n=4920), Europe (n=4996), and Siberia (n=10 851). Stars indicate the true and false positive rates of the 90th percentile, used as a threshold for the hits and misses analysis.
Figure 8 shows the ROC curve and corresponding AUC values for late fires in Alaska, Canada, Europe, and Siberia. Only the late fires are considered here, as this covers the main fire season and not all regions had sufficient early fires. All regions show similar results to Fig. 7, but the magnitude of the improvement differs between regions. The largest improvement can be seen for Alaska, with an AUC increase of 0.18 for EXP4 compared to FWIref. The smallest improvement can be seen for Europe (AUC increase of 0.06 for EXP4 compared to FWIref), but notice that all AUC values of Europe are already higher than any of the AUC values of the other regions. While Europe shows the best performance of all FWIpeat and FWIref, Alaska shows the worst performance, with AUC values ranging from 0.66 for FWIref to 0.84 for EXP4.
4.1 Impact of adjusted components on FWIpeat
From the time series of the FWIpeat values alongside the reference FWIref (Fig. 5) for an example location, it becomes apparent that as the original FWI structure is increasingly altered, the differences between the corresponding FWIpeat and FWIref also become more pronounced. For the DC and DMC of both FWIref and the different FWIpeat experiments, a generally linear increase is seen during the first month. As these two values reach their maximum, five fires are observed, indicating that they estimate fire danger relatively well at this specific location and for this specific fire season. Note that the FFMC is almost always high during this period, with some dips mainly at the end when there are no fires observed. While the DC and DMC of the different experiments generally follow a similar trend as the DC and DMC of FWIref, this is not really seen for the FFMC. This similar general pattern for DC and DMC is as expected because the PEATCLSM output variables are CDF-matched to the moisture codes, making them by definition very similar. The remaining differences can be explained by the differences in temporal patterns between PEATCLSM and the original moisture codes. While the temporal CDF matching ensures that the frequency distribution of the PEATCLSM output variables matches that of the original FWI moisture codes, both the short-term fluctuations and seasonal dynamics of the PEATCLSM variables are still maintained.
Contrary to the DC and DMC, the FFMC of FWIref shows significant day-to-day variability. This divergence can be attributed to the design of these moisture codes. As outlined by Van Wagner (1987), the FFMC is designed to represent moisture content in the litter layer, which is characterized as relatively fast-drying and highly sensitive to small rainfall events. The DMC and DC, on the other hand, represent the upper 5–10 and 10–20 cm layers of the soil (De Groot, 1987) and are far less responsive to short-term fluctuations in rainfall. This is due to their more extensive moisture storage capacity.
The swift response of the FFMC to rainfall can be attributed to the fact that it is the topmost layer of the system, intercepting precipitation before it penetrates into deeper layers. Moreover, the FFMC's top layer position renders it more sensitive to various environmental factors, such as relative humidity, wind, temperature, and drying conditions. To quantify this difference in sensitivity to drying, Van Wagner (1987) introduced the concept of time lag, signifying the duration required to lose approximately two-thirds of the free moisture above equilibrium. They defined the time lag for FFMC as two-thirds of a day, for the DMC it is 12 d, and for the DC it extends to 52 d (Van Wagner, 1987). This distinction underscores that FFMC dries out much more rapidly and subsequently experiences faster increases after rainfall events. These dynamics contribute to the pronounced day-to-day fluctuations evident in Fig. 5. By replacing the FFMC with PEATCLSM sfmc, a strong vertical soil moisture coupling from the PEATCLSM hydrological model is introduced into the FWI system, resulting in a smoother FFMC. However, it is important to note that in extreme circumstances, such as a prolonged drought, a disconnection between the water table and the peat surface can occur which was, however, barely indicated by simulation results of PEATCLSM that are based on a parameter set representing natural (meaning undrained) peatlands.
The biggest difference in FWI compared to the FWIref is seen for EXP3 and EXP4. For EXP3, this is a consequence of the additional replacement of the FFMC, as compared to EXP2, indicating the importance of FFMC in the FWI calculations and in the estimation of fire danger. This importance of the FFMC corresponds to findings in other papers. Van Wagner (1987) already stated that the FFMC relates best to fire presence. Chaparro et al. (2016) showed that, as FFMC determines the fuels' flammability, it is one of the most important variables to predict fire presence in Spain. Also De Jong et al. (2016) showed that the FFMC, ISI, and FWI are the most important fire predictors in bogs in the UK. However, De Groot and Flannigan (2014) and Wotton (2009) specify that the FFMC is especially a good indicator of fire presence in the case of human-induced fires. For lightning-ignited fires, Wotton (2009) found that the DMC is the primary predictor. This is also supported by Parisien et al. (2023), who state that lightning typically ignites the organic layers of the soil, which would be dependent on the DMC and DC.
For EXP4, only the FWI is shown in Fig. 5 (long dashed line), as the other components are not used and thus are not calculated for this experiment. In general, the FWI of EXP4 shows a similar trend as the FWI of EXP3 but shows little short-term fluctuations. This shows the impact of wind on the daily FWI calculations. A windy day effectively increases the FWI value compared to a less windy day with the same RH2 m, T2 m, and P. However, it is important to keep in mind that this time series, and thus the conclusions one can draw from it, might not be generally applicable to the whole study area and period. A different location or a different fire season might result in different conclusions and a different performance of the FWIpeat compared to FWIref.
4.2 Different impacts for early and late fires
Figures 6 and 7 show, as expected, that changes in FWI increase with an increasing number of adapted moisture codes. Since the changes in the moisture codes do not propagate linearly through the FWI structure into the final FWI value, there are some clear differences in how the FWI changes when replacing different moisture codes. In EXP1, only the DC is replaced by the PEATCLSM zbar, resulting in a minor difference between this FWIpeat and FWIref for both the hits and misses and the ROC analysis. In EXP2, when not only DC is replaced but also the DMC with PEATCLSM sfmc, a slightly larger change can be seen, especially for the late fires. The amount of change between EXP1 and EXP2 is, however, not linear. This can be explained by the limited and variable weight the DC actually has in the BUI calculation when compared to the DMC. Van Wagner (1987) developed the BUI to mainly depend on the DMC, especially as it approaches zero. They explicitly stated that whenever the DMC is zero, the BUI is also zero, regardless of how high the DC is. Then, as the DMC rises, the weight of DC also rises until DMC and DC are equal (Van Wagner, 1987). This varying weight of DC results in a highly nonlinear change in FWI with a change in DC. The overall small weight of DC also explains why there is not much improvement or change in general when comparing the results of EXP1 with FWIref. The generally larger weight of the DMC is shown in the larger improvements of EXP2, especially for the late fires.
The much bigger changes (positive and negative) for EXP3 compared to EXP2 show the importance of the FFMC in the FWI structure, especially for the estimation of fire danger. This is in line with how Van Wagner (1987) designed the FWI structure. They state that the FFMC, being the indicator of fine surface fuel moisture content, is most related to fire presence. This can be explained by the fact that fine fuel will be the first fuel type to catch fire in the case of ignition. Of course, one still needs an ignition for a fire to start. The fact that EXP3 mainly shows hits to misses and even fewer misses to hits than EXP1 and EXP2 for the early fires indicates that these early fires are not so much driven by hydrology. For EXP4, in which the FWI is directly replaced by PEATCLSM zbar, the biggest change is seen for both the ROC and hits and misses analysis, especially for the late fires. This, together with the results of EXP3 for the late fires, strongly indicates that the late fires are indeed more hydrologically driven, supporting the hypothesis.
Based on the results of this evaluation with differentiation between early and late fires, one could argue for a variable FWIpeat based on the day of the year. For early fires, only replacing the DC and DMC (EXP2) seems to be most suited. While this FWIpeat does not show the most changes compared to the other FWIpeat, it does show the most improvements, which is generally preferred. On the other hand, additionally replacing FFMC (EXP3) or directly replacing the FWI with PEATCLSM zbar (EXP4) shows the most potential for late fires. Further research is needed to investigate in more detail what the optimal day of the year is to switch from one method to the other, which may vary by region. Another option might be to introduce a transition period between early and late fires over which one gradually changes from EXP2 to EXP3 (or EXP4) FWI estimates. However, additional research is needed to find an optimal transition between our recommended FWI adjustments for early- and late-season fires.
The regional stratification of the ROC analysis shows that, overall, the positive impact of including peat-specific hydrological variables in the FWI is consistent across all four regions considered in this study, as shown in Fig. 8. While the magnitude of improvement differs between the regions, the same conclusions can be drawn for each region individually as for all regions combined. EXP3 and EXP4 show for all regions the largest improvement for the late fires, while EXP1 shows minor to no improvements compared to FWIref. Overall, the FWIpeat performs worst over Alaska and Canada. One possible explanation could be a more aggressive fire management in North America compared to, e.g., Siberia (Flannigan et al., 2009; Kharuk et al., 2021), which influences the fire behavior overall. While the fire suppression system in Russia was largely successful in the early 1990s, with the fall of the Soviet Union, budgets got reduced and the Russian fire suppression system became less effective (Flannigan et al., 2009; Kharuk et al., 2021). While the Russian fire suppression system has been under redevelopment since the early 2000s, it has not yet reached its former efficiency levels (Kharuk et al., 2021). A more aggressive fire management can cause fires with a very high FWIpeat to be extinguished before being detected by satellite remote sensing, eventually lowering the performance of the FWIpeat.
All AUC values are generally higher for Europe and Siberia than for Alaska and Canada, which could be related to the difference in fire regimes between North America and Eurasia. De Groot et al. (2013) found that Canada had fewer but more intense fires, i.e., more severe fire weather, than Russia. They also found that the Canadian fire season peaks later than the Russian fire season (July for Canada versus May for Russia; De Groot et al., 2013). More recent studies showed that the Canadian fire season peaks more at the end of May, possibly indicating a shift in the fire season over the last years (Parisien et al., 2023). The GFA data showed that the main peak in fire occurrences in Canada occurred in July, aligning with the data of De Groot et al. (2013). For Siberia, the GFA showed two equal peaks in fire occurrence, one in April and one in July. These peaks do not align with the findings of De Groot et al. (2013). However, De Groot et al. (2013) noted that 10 247 fires in their Russian study area could not be dated. These fires could either strengthen or lengthen the peak they found in May or create a new peak later in summer.
The difference between the Canadian and Siberian fire seasons could explain part of the difference seen here between these regions. However, the differences seen here are most likely a result of a combination of various factors. To gain a comprehensive understanding, further research exploring the full range of factors contributing to these differences is needed.
The performance assessment of any purely fuel-based fire danger estimation is influenced by the dynamics in ignitions (i.e., lightning and anthropogenic ignitions) that are by design not taken into account, leading to possible missed events. Similarly, management measures are not taken into account, making the fire danger estimates vulnerable to false alarms (Di Giuseppe et al., 2020). Parisien et al. (2023) showed that in spring, before the greenup of vegetation, most ignitions are anthropogenic. On the other hand, in summer, lightning is the main ignition source. Since anthropogenic ignitions are much less dependent on fire weather, as they can be deliberate, one would expect a difference in the performance of the FWIref and the FWIpeat between these two seasons, with a lower performance in spring. However, this difference is not seen here for FWIref, as it performs approximately the same for both seasons, indicating that this effect might be negligible. The main difference in performance for FWIpeat can be due to a lower impact of the PEATCLSM input on the fire danger due to more anthropogenic ignitions and is thus less influenced by the soil hydrology, as discussed earlier in this section.
4.3 Challenges of the FWIpeat
For the evaluation of the predictive capabilities of the FWI, fire observations from 2010 through 2018 of the GFA are used, as discussed in Sect. 2.2.2. Figure 3 shows an overview of this dataset. The average fire return interval of approximately 141 years found in this study is hard to compare with other studies due to the study domain, time period, and the focus on peatlands alone. However, these results are similar to the results of Wilkinson et al. (2023), who found a spatially weighted average fire return interval of 290 years for boreal and temperate peatlands (Wilkinson et al., 2023). Other studies that quantify fires in (part of) the boreal region, usually do not differentiate between upland forest fires and peatland fires, making a comparison with our results difficult.
There are some shortcomings of the GFA dataset that are important to mention. The GFA dataset is based on MODIS (Giglio et al., 2018) observations to create an individual fire presence (Andela et al., 2019a). The first and most obvious shortcoming is the spatial resolution of MODIS of 500 m. Because of this, fires <0.25 km2 are not observed and thus not registered in the GFA, creating a bias towards the prediction of larger fires (Andela et al., 2019a). The second, and perhaps the biggest, shortcoming of the GFA over the boreal region is the fragmentation of fire events. Xu et al. (2022) state that due to omission errors in the remote sensing products of burned area, fragmented burned pixels originating from the same fire can be seen as separate ignitions, likely resulting in an overestimation of the number of ignitions in the GFA.
The third shortcoming is that the dating of ignitions could be erroneous with estimates of ignition dates being either too early or too late. Andela et al. (2019a) stated that the burn dates from the GFA mostly corresponded to those observed by active fire detections, but a significant fraction of fires was detected either 1 d earlier or later. In some cases, e.g., following persistent cloud cover, it is possible that burned area is detected days or weeks after the actual fire event occurred. Since the uncertainty of ignition dates in the GFA is not known, we could not take this into account in this study. However, this error can have a large impact on the performance of the FWIpeat and FWIref. To investigate the effect of this uncertainty, additional analyses are needed, e.g., using other fire observations, e.g., the Visible Infrared Imaging Radiometer Suite (VIIRS) active fire product (Schroeder et al., 2014), or by allowing a range of possible FWI sample dates. Besides satellite observations, operational fire data, such as the national burned area composite for Canada (Hall et al., 2020), could be used. Such a further investigation could help to confirm that the FWIpeat is superior over FWIref.
Apart from the GFA, also the peatland map that was used to separate peat from non-peat fires has some shortcomings. The map is a blend of different, partly country-specific, peatland maps. Definitions of what can be classified as a peatland as well as past mapping efforts can substantially vary across countries and datasets (Xu et al., 2018; Reichle et al., 2023; Mahdianpari et al., 2021). As a consequence, the resulting peatland fraction can be regionally biased or characterized by higher uncertainties and also show discontinuities in peatland fraction at country borders. One of the most pronounced discontinuities can be seen between Canada and Alaska which is likely indicative of either an overestimation of peatland fraction in Alaska or an underestimation in Canada or both. Those biases may have propagated into the number of ignitions and the burned area shown in Fig. 3.
Besides these possible shortcomings of the datasets used, the land surface model used, PEATCLSM, also has its limitations. At high latitudes, peatlands can be underlain by permafrost. Fires can cause permafrost to thaw by deepening the active layer (Gibson et al., 2018). PEATCLSM simulates freeze–thaw processes and regulates runoff processes to some degree (Bechtold et al., 2020a). However, the occurrence of discontinuous permafrost at the subgrid scale is not simulated by PEATCLSM, possibly reducing the accuracy of the model over those areas.
Lastly, it is important to note that with this study, we look at large-scale fire dynamics and controlling factors. At the individual peatland scale, other small-scale processes, such as peatland connectivity (Thompson et al., 2019), distance to the edge of peatlands, fuel type, and whether a peatland is treed or not (Nelson et al., 2021), might be more important than the large-scale hydrology.
4.4 Opportunities for operational FWI products and advancing fire danger models
We employed CDF matching to adjust select moisture codes within the FWI over peatlands. This conservative approach makes the inclusion of hydrological variables more accessible to operational centers and the user community accustomed to the existing FWI system. It provides a transparent and valuable means to demonstrate the impact of peatland hydrological data.
By contrast, using a totally different system would make it difficult to evaluate any performance gain specifically introduced by new peatland hydrological information. For example, Mezbahuddin et al. (2023) showed that a machine learning model with peat hydrological input performed better than one purely relying on weather data. However, this study did not offer a comparison with the original FWI system, leaving uncertainty about the true effectiveness of the peatland hydrological data. A study comparing our proposed FWIpeat against such a machine learning algorithm could offer new perspectives for future peatland-specific fire danger rating system frameworks.
In this study, we used hydrological variable estimates based on assimilating SMOS L-band observations into PEATCLSM simulations. An operational alternative is the soil moisture data assimilation product associated with the SMAP (Entekhabi et al., 2010) mission. The operational SMAP Level-4 Soil Moisture product (SMAP L4_SM; Reichle et al., 2019) was recently updated to incorporate the use of PEATCLSM over peatlands (SMAP L4_SM v7; Reichle et al., 2023). With a rather low latency time of 2.5 d, the peat moisture variables could be implemented in an operational FWI forecast product assuming PEATCLSM variables from SMAP L4_SM v7 are properly extrapolated in time by driving either a PEATCLSM type of modeling approach or an appropriately trained emulator of it with weather forecasts.
Even though the Canadian Fire Weather Index (FWI) was originally developed for an upland Jack pine forest (Van Wagner, 1987), it is used globally across a variety of fire environments (Di Giuseppe et al., 2020; Taylor and Alexander, 2006). However, the applicability of the current FWI is often questioned over certain environments, such as peatlands (Waddington et al., 2012). This study aimed at replacing the original moisture codes of the FWI (drought code (DC), duff moisture code (DMC), and fine fuel moisture code (FFMC)) over peatlands with soil moisture and water table estimates obtained by assimilating SMOS L-band brightness temperature observations into a land surface model with peatland-specific modules. The peat-specific hydrological estimates were first rescaled to the FWI moisture codes using cumulative density function (CDF) matching to preserve the integrity of the original FWI system. We systematically replaced different moisture codes to evaluate their impact on the performance of estimated fire danger and to find the optimal use of the hydrological variables for a FWIpeat.
We evaluated the capacity of the new FWIpeat to predict peat fire presence using a hits and misses analysis and receiver operating characteristic (ROC) curves and compared them against the original FWI (FWIref). For this evaluation, fire data from the Global Fire Atlas (GFA; Andela et al., 2019a) were used. Due to the strong bimodal seasonality of boreal peat fires, this dataset was split into early (before day of year (DOY) 130) and late (after DOY 130) fires. For the early-season fires, we hypothesized that the main fuel is dead plant matter from the previous growing season. For the late-season fires, on the other hand, the main fuel was thought to be peat organic material and living vegetation from the current growing season, which is still linked to soil hydrology. The main results are as follows:
-
For the early fires, our results indicate an improvement in FWI performance when adapting only the two deeper soil moisture codes of the original FWI with hydrological variables, while further adaptations of the fine fuel moisture code and the elimination of direct wind impacts on FWI clearly deteriorate results.
-
For the late fires, the greatest improvements were found when adapting all original moisture codes, including the fine fuel moisture code, with hydrological variables. Even the impact of wind could be removed without deterioration. This stands in contrast to the results of the early fires and indicates that late-season fires are more hydrologically driven than early-season fires.
-
A regional evaluation for the late fires shows that the improvements are consistent across different regions (Alaska, Canada, Europe, Siberia).
-
For operational applications, we suggest a varying adaptation of the FWI over peatlands, starting with replacing only DC and DMC at the beginning of the season and gradually increasing the weight of an adjusted FFMC from early- to late-season fires.
Based on our results, we conclude that adapting the FWI with hydrological information is beneficial in estimating peat fire presence. However, we emphasize that the FWI was originally not designed to predict fire presence but rather to estimate fire danger. A high FWI value does not necessarily indicate a fire presence, nor does a low value make a fire impossible. However, we assumed that the occurrence of a fire in the GFA indicates a high FWI value. We argue that this is a justified assumption as a fire needs to reach an area of 0.25 km2 to be detected by the MODIS instrument, which is the basis of the GFA. Note that this study focused on assessing the FWI performance by only looking at fire presence, but further studies looking at the FWI and burned area could provide valuable additional insights.
In this study, we used a conservative approach for the adaptation of the FWI in the sense that we did not change the original structure of the FWI but only replaced the different moisture codes after CDF matching the new information to the CDF of the original moisture codes. This ensures that our method could be used operationally without fundamental changes to the original system. With the aid of the SMAP_L4 v7 product (Reichle et al., 2023), similar data to those used in this study can be routinely downloaded and easily incorporated into an FWI framework.
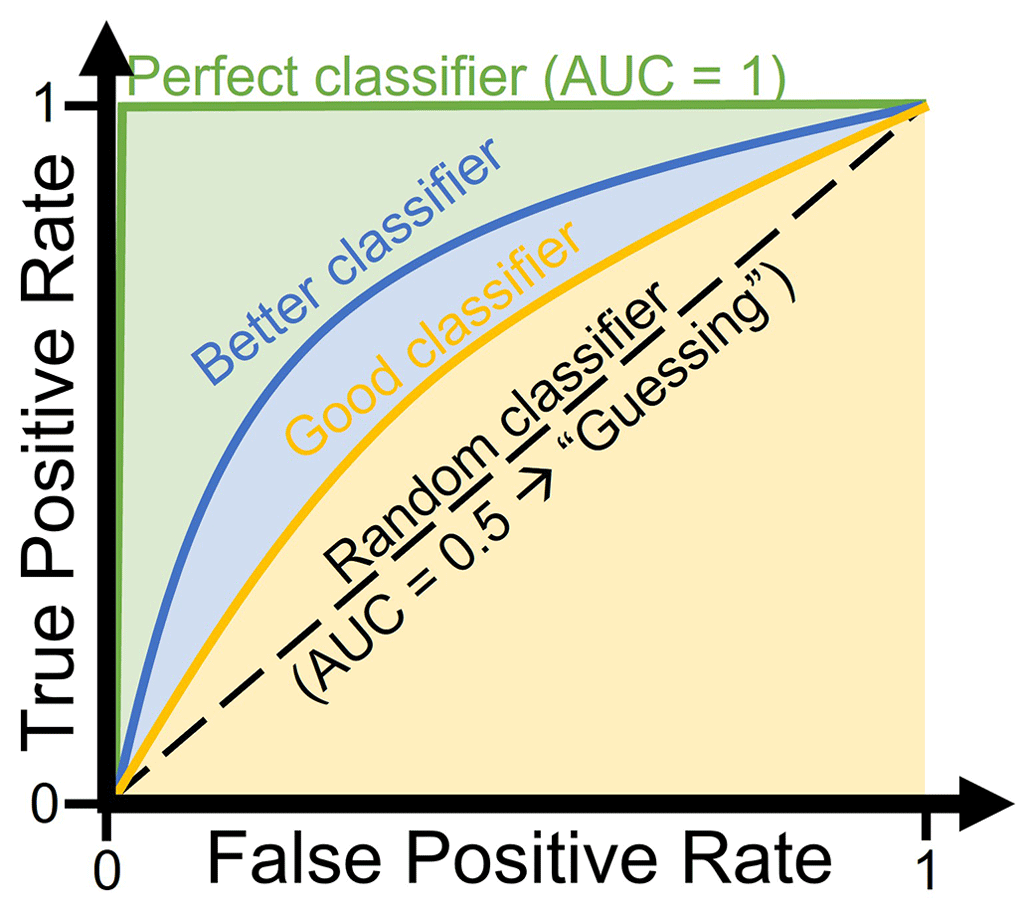
Figure A1Theoretical representation of several receiver operating characteristic (ROC) curves to show classifiers with different predictive capabilities. AUC: area under the curve.
The MERRA-2 data (Gelaro et al., 2017) were obtained from https://goldsmr4.gesdisc.eosdis.nasa.gov/data/MERRA2/. In order to access the data, an account at https://urs.earthdata.nasa.gov/home (last access: 22 December 2022) is needed. The PEATCLSM-SMOS dataset is downloaded from https://doi.org/10.5281/zenodo.3731652 (Bechtold et al., 2020b). The GFWED code used for the FWI calculations can be downloaded from https://portal.nccs.nasa.gov/datashare/GlobalFWI/v2.0/20201013.GFWEDCode.tar.gz (Field et al., 2015). The GFA data used for the evaluation are downloaded from https://doi.org/10.3334/ORNLDAAC/1642 (Andela et al., 2019b). The CWIM3 data can be obtained on request from the Canada Centre for Mapping and Earth Observation, Natural Resources Canada. The CDF matching is done using the Python package pytesmo available at https://doi.org/10.5281/zenodo.8338451 (Paulik et al., 2023).
JM developed the framework, performed the experiments, and analyzed the data, supervised by GJMDL and MB. NA provided the GFA and guided the processing of this dataset. AF processed the GFA into the peat fire dataset. RDF provided the code for and provided guidance to the FWI calculations. SV provided topical expertise for the interpretation of results. JM took the lead in writing the manuscript, and all authors helped to shape the research, analysis, and manuscript.
The contact author has declared that none of the authors has any competing interests.
Publisher’s note: Copernicus Publications remains neutral with regard to jurisdictional claims made in the text, published maps, institutional affiliations, or any other geographical representation in this paper. While Copernicus Publications makes every effort to include appropriate place names, the final responsibility lies with the authors.
We thank Brian Brisco†, Kevin Murnaghan, and Masoud Mahdianpari for providing the CWIM3 data and valuable insights into the data. The authors would like to thank Sophie Wilkinson and Francesca Di Giuseppe for their valuable reviews and contribution to the improvement of the paper.
This research has been supported by the Research Foundation – Flanders (FWO) (FWO.G095720N). The computer resources and services used in this work were provided by the High-Performance Computing system of the Vlaams Supercomputer Center, funded by the Research Foundation – Flanders (FWO) and the Flemish Government. It was further supported by the Dutch Research Council (Vidi grant 016.Vidi.189.070) and European Research Council through a Consolidator Grant under the European Union's Horizon 2020 research and innovation program (grant agreement no. 101000987).
This paper was edited by Pascal Haegeli and reviewed by Francesca Di Giuseppe and Sophie Wilkinson.
Ambadan, J. T., Oja, M., Gedalof, Z., and Berg, A. A.: satellite-observed soil moisture as an indicator of wildfire risk, Remote Sensing, 12, 1543, https://doi.org/10.3390/rs12101543, 2020. a, b
Andela, N., Morton, D. C., Giglio, L., Paugam, R., Chen, Y., Hantson, S., van der Werf, G. R., and Randerson, J. T.: The Global Fire Atlas of individual fire size, duration, speed and direction, Earth Syst. Sci. Data, 11, 529–552, https://doi.org/10.5194/essd-11-529-2019, 2019a. a, b, c, d, e, f, g, h
Andela, N., Morton, D. C., Giglio, L., and Randerson, J. T.: Global Fire Atlas with Characteristics of Individual Fires, 2003–2016, ORNL DAAC, Oak Ridge, Tennessee, USA [data set], https://doi.org/10.3334/ORNLDAAC/1642, 2019b. a
Bechtold, M., De Lannoy, G. J., Koster, R. D., Reichle, R. H., Mahanama, S. P., Bleuten, W., Bourgault, M. A., Brümmer, C., Burdun, I., Desai, A. R., Devito, K., Grünwald, T., Grygoruk, M., Humphreys, E. R., Klatt, J., Kurbatova, J., Lohila, A., Munir, T. M., Nilsson, M. B., Price, J. S., Röhl, M., Schneider, A., and Tiemeyer, B.: PEAT-CLSM: A Specific Treatment of Peatland Hydrology in the NASA Catchment Land Surface Model, J. Adv. Model. Earth Sy., 11, 2130–2162, https://doi.org/10.1029/2018MS001574, 2019. a, b
Bechtold, M., De Lannoy, G. J. M., Reichle, R. H., Roose, D., Balliston, N., Burdun, I., Devito, K., Kurbatova, J., Strack, M., and Zarov, E. A.: Improved groundwater table and L-band brightness temperature estimates for Northern Hemisphere peatlands using new model physics and SMOS observations in a global data assimilation framework, Remote Sens. Environ., 246, 111805, https://doi.org/10.1016/j.rse.2020.111805, 2020a. a, b, c, d
Bechtold, M., De Lannoy, G. J. M., and Reichle, R. H.: PEATCLSM(Tb): A land surface data assimilation product for peatlands using PEATCLSM and brightness temperature (Tb) satellite observations (Northern Hemisphere output) (1.0.0), Zenodo [data set], https://doi.org/10.5281/zenodo.3731652, 2020b. a
Brodzik, M. J., Billingsley, B., Haran, T., Raup, B., and Savoie, M. H.: EASE-Grid 2.0: Incremental but Significant Improvements for Earth-Gridded Data Sets, ISPRS Int. Geo-Inf., 1, 32–45, https://doi.org/10.3390/ijgi1010032, 2012. a
CFSFDG: An overview of the next generation of the Canadian Forest Fire Danger Rating System. Information Report GLC-X-26 Canadian Forest Service Fire Danger Group (CFSFDG), Natural Resources Canada, Canadian Forest Service, Great Lakes Forestry Centre: Sault Ste. Marie, Ontario, Canada, https://cfs.nrcan.gc.ca/publications?id=40474 (last access: 5 February 2023), 2021. a
Chaparro, D., Piles, M., and Vall-llossera, M.: Remotely Sensed Soil Moisture as a Key Variable in Wildfires Prevention Services: Towards New Prediction Tools Using SMOS and SMAP Data, in: Satellite Soil Moisture Retrieval: Techniques and Applications, Elsevier, https://doi.org/10.1016/B978-0-12-803388-3.00013-9, 2016. a, b, c
Chen, Y., Romps, D. M., Seeley, J. T., Veraverbeke, S., Riley, W. J., Mekonnen, Z. A., and Randerson, J. T.: Future increases in Arctic lightning and fire risk for permafrost carbon, Nat. Clim. Change, 11, 404–410, https://doi.org/10.1038/s41558-021-01011-y, 2021. a
Davies, G. M., Gray, A., Rein, G., and Legg, C. J.: Peat consumption and carbon loss due to smouldering wildfire in a temperate peatland, Forest Ecol. Manag., 308, 169–177, https://doi.org/10.1016/j.foreco.2013.07.051, 2013. a
Davies, G. M., Domènech, R., Gray, A., and Johnson, P. C. D.: Vegetation structure and fire weather influence variation in burn severity and fuel consumption during peatland wildfires, Biogeosciences, 13, 389–398, https://doi.org/10.5194/bg-13-389-2016, 2016. a
De Groot, W. J.: Interpreting the Canadian Forest Fire Weather Index (FWI) System, in: Fourth Central Regional Fire Weather Committee Scientific and Technical Seminar, 2 April 1987, Winnipeg, Manitoba, https://cfs.nrcan.gc.ca/publications?id=23688 (last access: 6 January 2023), 1987. a
De Groot, W. J. and Flannigan, M. D.: Reducing Disaster: Early Warning Systems for Climate Change, 1 edn., Springer Netherlands, ISBN 978-94-017-8598-3, https://doi.org/10.1007/978-94-017-8598-3_7, 2014. a
De Groot, W. J., Cantin, A. S., Flannigan, M. D., Soja, A. J., Gowman, L. M., and Newbery, A.: A comparison of Canadian and Russian boreal forest fire regimes, Forest Ecol. Manag., 294, 23–34, https://doi.org/10.1016/j.foreco.2012.07.033, 2013. a, b, c, d, e, f, g, h, i
de Groot, W. J., Wotton, B. M., and Flannigan, M. D.: Wildland Fire Danger Rating and Early Warning Systems, in: Hazards and disaster series: wildfire hazards, risks and disasters, Elsevier, https://doi.org/10.1016/B978-0-12-410434-1.00011-7, 2015. a
de Jong, M. C., Wooster, M. J., Kitchen, K., Manley, C., Gazzard, R., and McCall, F. F.: Calibration and evaluation of the Canadian Forest Fire Weather Index (FWI) System for improved wildland fire danger rating in the United Kingdom, Nat. Hazards Earth Syst. Sci., 16, 1217–1237, https://doi.org/10.5194/nhess-16-1217-2016, 2016. a
De Lannoy, G. J. and Reichle, R. H.: Global assimilation of multiangle and multipolarization SMOS brightness temperature observations into the GEOS-5 catchment land surface model for soil moisture estimation, J. Hydrometeorol., 17, 669–691, https://doi.org/10.1175/JHM-D-15-0037.1, 2016. a
De Lannoy, G. J. M., Koster, R. D., Reichle, R. H., Mahanama, S. P. P., and Liu, Q.: An updated treatment of soil texture and associated hydraulic properties in a global land modeling system, J. Adv. Model. Earth Sy., 6, 957–979, https://doi.org/10.1002/2014MS000330, 2014. a, b
Di Giuseppe, F., Vitolo, C., Krzeminski, B., Barnard, C., Maciel, P., and San-Miguel, J.: Fire Weather Index: the skill provided by the European Centre for Medium-Range Weather Forecasts ensemble prediction system, Nat. Hazards Earth Syst. Sci., 20, 2365–2378, https://doi.org/10.5194/nhess-20-2365-2020, 2020. a, b, c, d, e
Di Giuseppe, F., Benedetti, A., Coughlan, R., Vitolo, C., and Vuckovic, M.: A Global Bottom-Up Approach to Estimate Fuel Consumed by Fires Using Above Ground Biomass Observations, Geophys. Res. Lett., 48, e2021GL095452, https://doi.org/10.1029/2021GL095452, 2021. a
Enayetullah, H., Chasmer, L., Hopkinson, C., Thompson, D., and Cobbaert, D.: Identifying Conifer Tree vs. Deciduous Shrub and Tree Regeneration Trajectories in a Space-for-Time Boreal Peatland Fire Chronosequence Using Multispectral Lidar, Atmosphere, 13, 112, https://doi.org/10.3390/atmos13010112, 2022. a
Entekhabi, D., Njoku, E. G., O'Neill, P. E., Kellogg, K. H., Crow, W. T., Edelstein, W. N., Entin, J. K., Goodman, S. D., Jackson, T. J., Johnson, J., Kimball, J., Piepmeier, J. R., Koster, R. D., Martin, N., McDonald, K. C., Moghaddam, M., Moran, S., Reichle, R., Shi, J. C., Spencer, M. W., Thurman, S. W., Tsang, L., and Van Zyl, J.: The Soil Moisture Active Passive (SMAP) Mission, P. IEEE, 98, 704–716, https://doi.org/10.1109/JPROC.2010.2043918, 2010. a
FAO/IIASA/ISRIC/ISSCAS/JRC: Harmonized World Soil database (version 1.2), http://webarchive.iiasa.ac.at/Research/LUC/External-World-soil-database/HTML/ (last access: 20 September 2020), 2012. a
Field, R. D.: Evaluation of Global Fire Weather Database reanalysis and short-term forecast products, Nat. Hazards Earth Syst. Sci., 20, 1123–1147, https://doi.org/10.5194/nhess-20-1123-2020, 2020a. a
Field, R. D.: Using Satellite Estimates of Precipitation for Fire Danger Rating, Springer, https://doi.org/10.1007/978-3-030-35798-6_33, 2020b. a
Field, R. D., Spessa, A. C., Aziz, N. A., Camia, A., Cantin, A., Carr, R., de Groot, W. J., Dowdy, A. J., Flannigan, M. D., Manomaiphiboon, K., Pappenberger, F., Tanpipat, V., and Wang, X.: Development of a Global Fire Weather Database, Nat. Hazards Earth Syst. Sci., 15, 1407–1423, https://doi.org/10.5194/nhess-15-1407-2015, 2015 (code available at: https://portal.nccs.nasa.gov/datashare/GlobalFWI/v2.0/20201013.GFWEDCode.tar.gz, last access: 23 February 2022). a, b, c, d
Flannigan, M., Stocks, B., Turetsky, M., and Wotton, M.: Impacts of climate change on fire activity and fire management in the circumboreal forest, Glob. Change Biol., 15, 549–560, https://doi.org/10.1111/j.1365-2486.2008.01660.x, 2009. a, b
Flannigan, M., Cantin, A. S., Groot, W. J. D., Wotton, M., Newbery, A., and Gowman, L. M.: Global wildland fire season severity in the 21st century, Forest Ecol. Manag., 294, 54–61, https://doi.org/10.1016/j.foreco.2012.10.022, 2013. a
Flannigan, M. D., Wotton, B. M., Marshall, G. A., de Groot, W. J., Johnston, J., Jurko, N., and Cantin, A. S.: Fuel moisture sensitivity to temperature and precipitation: climate change implications, Climatic Change, 134, 59–71, https://doi.org/10.1007/s10584-015-1521-0, 2016. a
Forkel, M., Thonicke, K., Beer, C., Cramer, W., Bartalev, S., and Schmullius, C.: Extreme fire events are related to previous-year surface moisture conditions in permafrost-underlain larch forests of Siberia, Environ. Res. Lett., 7, 044021, https://doi.org/10.1088/1748-9326/7/4/044021, 2012. a
Gallego-Sala, A. V., Charman, D. J., Brewer, S., Page, S. E., Prentice, I. C., Friedlingstein, P., Moreton, S., Amesbury, M. J., Beilman, D. W., Björck, S., Blyakharchuk, T., Bochicchio, C., Booth, R. K., Bunbury, J., Camill, P., Carless, D., Chimner, R. A., Clifford, M., Cressey, E., Courtney-Mustaphi, C., Vleeschouwer, F. D., De Jong, R., Fialkiewicz-Koziel, B., Finkelstein, S. A., Garneau, M., Githumbi, E., Hribjlan, J., Holmquist, J., Hughes, P. D., Jones, C., Jones, M. C., Karofeld, E., Klein, E. S., Kokfelt, U., Korhola, A., Lacourse, T., Roux, G. L., Lamentowicz, M., Large, D., Lavoie, M., Loisel, J., Mackay, H., MacDonald, G. M., Makila, M., Magnan, G., Marchant, R., Marcisz, K., Cortizas, A. M., Massa, C., Mathijssen, P., Mauquoy, D., Mighall, T., Mitchell, F. J., Moss, P., Nichols, J., Oksanen, P. O., Orme, L., Packalen, M. S., Robinson, S., Roland, T. P., Sanderson, N. K., Sannel, A. B. K., Silva-Sánchez, N., Steinberg, N., Swindles, G. T., Turner, T. E., Uglow, J., Väliranta, M., van Bellen, S., van der Linden, M., van Geel, B., Wang, G., Yu, Z., Zaragoza-Castells, J., and Zhao, Y.: Latitudinal limits to the predicted increase of the peatland carbon sink with warming, Nat. Clim. Change, 8, 907–913, https://doi.org/10.1038/s41558-018-0271-1, 2018. a
Gelaro, R., McCarty, W., Suárez, M. J., Todling, R., Molod, A., Takacs, L., Randles, C. A., Darmenov, A., Bosilovich, M. G., Reichle, R., Wargan, K., Coy, L., Cullather, R., Draper, C., Akella, S., Buchard, V., Conaty, A., da Silva, A. M., Gu, W., Kim, G. K., Koster, R., Lucchesi, R., Merkova, D., Nielsen, J. E., Partyka, G., Pawson, S., Putman, W., Rienecker, M., Schubert, S. D., Sienkiewicz, M., and Zhao, B.: The modern-era retrospective analysis for research and applications, version 2 (MERRA-2), J. Climate, 30, 5419–5454, https://doi.org/10.1175/JCLI-D-16-0758.1, 2017 (data available at: https://goldsmr4.gesdisc.eosdis.nasa.gov/data/MERRA2/, last access: 22 December 2022). a, b
Gibson, C. M., Chasmer, L. E., Thompson, D. K., Quinton, W. L., Flannigan, M. D., and Olefeldt, D.: Wildfire as a major driver of recent permafrost thaw in boreal peatlands, Nat. Commun., 9, https://doi.org/10.1038/s41467-018-05457-1, 2018. a
Giglio, L., Boschetti, L., Roy, D. P., Humber, M. L., and Justice, C. O.: The Collection 6 MODIS burned area mapping algorithm and product, Remote Sens. Environ., 217, 72–85, https://doi.org/10.1016/j.rse.2018.08.005, 2018. a, b, c
Granath, G., Moore, P. A., Lukenbach, M. C., and Waddington, J. M.: Mitigating wildfire carbon loss in managed northern peatlands through restoration, Scientific Reports, 6, https://doi.org/10.1038/srep28498, 2016. a
Gray, A., Davies, G. M., Domènech, R., Taylor, E., and Levy, P. E.: Peatland Wildfire Severity and Post-fire Gaseous Carbon Fluxes, Ecosystems, 24, 713–725, https://doi.org/10.1007/s10021-020-00545-0, 2021. a, b
Hall, R. J., Skakun, R. S., Metsaranta, J. M., Landry, R., Fraser, R. H., Raymond, D., Gartrell, M., Decker, V., and Little, J.: Generating annual estimates of forest fire disturbance in Canada: The National Burned Area Composite, Int. J. Wildland Fire, 29, 878–891, https://doi.org/10.1071/WF19201, 2020. a
Harris, A.: Spectral reflectance and photosynthetic properties of Sphagnum mosses exposed to progressive drought, Ecohydrology, 1, 35–42, https://doi.org/10.1002/eco.5, 2008. a
Holgate, C. M., van Dijk, A. I. J. M., Cary, G. J., and Yebra, M.: Using alternative soil moisture estimates in the McArthur Forest Fire Danger Index, Int. J. Wildland Fire, 26, 806–819, https://doi.org/10.1071/WF16217, 2017. a
Kerr, Y. H., Waldteufel, P., Wigneron, J. P., Delwart, S., Cabot, F., Boutin, J., Escorihuela, M. J., Font, J., Reul, N., Gruhier, C., Juglea, S. E., Drinkwater, M. R., Hahne, A., Martin-Neira, M., and Mecklenburg, S.: The SMOS L: New tool for monitoring key elements ofthe global water cycle, P. IEEE, 98, 666–687, https://doi.org/10.1109/JPROC.2010.2043032, 2010. a, b, c, d
Kettridge, N., Lukenbach, M. C., Hokanson, K. J., Devito, K. J., Petrone, R. M., Mendoza, C. A., and Waddington, J. M.: Severe wildfire exposes remnant peat carbon stocks to increased post-fire drying, Scientific Reports, 9, 3727, https://doi.org/10.1038/s41598-019-40033-7, 2019. a, b
Kharuk, V. I., Ponomarev, E. I., Ivanova, G. A., Dvinskaya, M. L., Coogan, S. C. P., and Flannigan, M. D.: Wildfires in the Siberian taiga, Ambio, 50, 1953–1974, https://doi.org/10.1007/s13280-020-01490-x, 2021. a, b, c
Koster, R. D., Suarez, M. J., Ducharne, A., Stieglitz, M., and Kumar, P.: A catchment-based approach to modeling land surface processes in a general circulation model 1. Model structure, J. Geophys. Res.-Atmos., 105, 24809–24822, https://doi.org/10.1029/2000JD900327, 2000. a
Krawchuk, M. A., Cumming, S. G., and Flannigan, M. D.: Predicted changes in fire weather suggest increases in lightning fire initiation and future area burned in the mixedwood boreal forest, Climatic Change, 92, 83–97, https://doi.org/10.1007/s10584-008-9460-7, 2009. a
Krueger, E. S., Levi, M. R., Achieng, K. O., Bolten, J. D., Carlson, J. D., Coops, N. C., Holden, Z. A., Magi, B. I., Rigden, A. J., and Ochsner, T. E.: Using soil moisture information to better understand and predict wildfire danger: a review of recent developments and outstanding questions, Int. J. Wildland Fire, 32, 111–132, https://doi.org/10.1071/WF22056, 2022. a
Leblon, B., San-Miguel-Ayanz, J., Bourgeau-Chavez, L., and Kong, M.: Remote Sensing of Wildfires, Elsevier, 55–95, ISBN 9781785481055, https://doi.org/10.1016/B978-1-78548-105-5.50003-7, 2016. a
Loisel, J., Gallego-Sala, A. V., Amesbury, M. J., Magnan, G., Anshari, G., Beilman, D. W., Benavides, J. C., Blewett, J., Camill, P., Charman, D. J., Chawchai, S., Hedgpeth, A., Kleinen, T., Korhola, A., Large, D., Mansilla, C. A., Müller, J., van Bellen, S., West, J. B., Yu, Z., Bubier, J. L., Garneau, M., Moore, T., Sannel, A. B., Page, S., Väliranta, M., Bechtold, M., Brovkin, V., Cole, L. E., Chanton, J. P., Christensen, T. R., Davies, M. A., Vleeschouwer, F. D., Finkelstein, S. A., Frolking, S., Gałka, M., Gandois, L., Girkin, N., Harris, L. I., Heinemeyer, A., Hoyt, A. M., Jones, M. C., Joos, F., Juutinen, S., Kaiser, K., Lacourse, T., Lamentowicz, M., Larmola, T., Leifeld, J., Lohila, A., Milner, A. M., Minkkinen, K., Moss, P., Naafs, B. D., Nichols, J., O’Donnell, J., Payne, R., Philben, M., Piilo, S., Quillet, A., Ratnayake, A. S., Roland, T. P., Sjögersten, S., Sonnentag, O., Swindles, G. T., Swinnen, W., Talbot, J., Treat, C., Valach, A. C., and Wu, J.: Expert assessment of future vulnerability of the global peatland carbon sink, Nat. Clim. Change, 11, 70–77, https://doi.org/10.1038/s41558-020-00944-0, 2021. a
Lukenbach, M. C., Hokanson, K. J., Moore, P. A., Devito, K. J., Kettridge, N., Thompson, D. K., Wotton, B. M., Petrone, R. M., and Waddington, J. M.: Hydrological controls on deep burning in a northern forested peatland, Hydrol. Process., 29, 4114–4124, https://doi.org/10.1002/hyp.10440, 2015. a
Mahdianpari, M., Brisco, B., Granger, J., Mohammadimanesh, F., Salehi, B., Homayouni, S., and Bourgeau-Chavez, L.: The third generation of pan-canadian wetland map at 10 m resolution using multisource earth observation data on cloud computing platform, IEEE J. Sel. Top. Appl., 14, 8789–8803, https://doi.org/10.1109/JSTARS.2021.3105645, 2021. a, b
Mezbahuddin, S., Nikonovas, T., Spessa, A., Grant, R. F., Imron, M. A., Doerr, S. H., and Clay, G. D.: Accuracy of tropical peat and non-peat fire forecasts enhanced by simulating hydrology, Scientific Reports, 13, 619, https://doi.org/10.1038/s41598-022-27075-0, 2023. a
Morison, M., van Beest, C., Macrae, M., Nwaishi, F., and Petrone, R.: Deeper burning in a boreal fen peatland 1-year post-wildfire accelerates recovery trajectory of carbon dioxide uptake, Ecohydrology, 14, e2277, https://doi.org/10.1002/eco.2277, 2021. a, b
NCRS Soil Survey Staff: General Soil Map (STATSGO2) (United States), http://websoilsurvey.nrcs.usda.gov/ (last access: 20 September 2020), 2012. a
Nelson, K., Thompson, D., Hopkinson, C., Petrone, R., and Chasmer, L.: Peatland-fire interactions: A review of wildland fire feedbacks and interactions in Canadian boreal peatlands, Sci. Total Environ., 769, 145212, https://doi.org/10.1016/j.scitotenv.2021.145212, 2021. a, b, c
Pan, Y., Birdsey, R. A., Fang, J., Houghton, R., Kauppi, P. E., Kurz, W. A., Phillips, O. L., Shvidenko, A., Lewis, S. L., Canadell, J. G., Ciais, P., Jackson, R. B., Pacala, S. W., McGuire, A. D., Piao, S., Rautiainen, A., Sitch, S., and Hayes, D.: A large and persistent carbon sink in the world's forests, Science, 333, 988–993, https://doi.org/10.1126/science.1201609, 2011. a
Parisien, M.-A., Barber, Q. E., Flannigan, M. D., and Jain, P.: Broadleaf tree phenology and springtime wildfire occurrence in boreal Canada, Glob. Change Biol., 29, 6106–6119, https://doi.org/10.1111/gcb.16820, 2023. a, b, c, d, e, f, g
Paulik, C., Preimesberger, W., s scherrer, pstradio, Hahn, S., Baum, D., Plocon, A., Mistelbauer, T., tracyscanlon, Schmitzer, M., alegrub88, and teije01: TUW-GEO/pytesmo: v0.16.0, Zenodo [data set], https://doi.org/10.5281/zenodo.8338451, 2023. a, b
Pettinari, M. L. and Chuvieco, E.: Fire Danger Observed from Space, Surv. Geophys., 41, 1437–1459, https://doi.org/10.1007/s10712-020-09610-8, 2020. a
Reichle, R. H., Liu, Q., Koster, R. D., Crow, W. T., De Lannoy, G. J. M., Kimball, J. S., Ardizzone, J. V., Bosch, D., Colliander, A., Cosh, M., Kolassa, J., Mahanama, S. P., Prueger, J., Starks, P., and Walker, J. P.: Version 4 of the SMAP Level-4 Soil Moisture Algorithm and Data Product, J. Adv. Model. Earth Sy., 11, 3106–3130, https://doi.org/10.1029/2019MS001729, 2019. a, b
Reichle, R. H., Liu, Q., Ardizzone, J. V., Bechtold, M., Crow, W. T., Lannoy, G. J. M. D., Kimball, J. S., and Koster, R. D.: Soil Moisture Active Passive (SMAP) Project Assessment Report for Version 7 of the L4_SM Data Product, NASA Technical Report Series on Global Modeling and Data Assimilation, NASA/TM-2023-104606, Vol. 64, National Aeronautics and Space Administration, Goddard Space Flight Center, Greenbelt, Maryland, USA, 87 pp., https://gmao.gsfc.nasa.gov/pubs/docs/Reichle1465.pdf (last access: 25 May 2023), 2023. a, b, c, d, e
Schroeder, W., Oliva, P., Giglio, L., and Csiszar, I. A.: The New VIIRS 375 m active fire detection data product: Algorithm description and initial assessment, Remote Sens. Environ., 143, 85–96, https://doi.org/10.1016/j.rse.2013.12.008, 2014. a
Taylor, S. W. and Alexander, M. E.: Science, technology, and human factors in fire danger rating: The Canadian experience, Int. J. Wildland Fire, 15, 121–135, https://doi.org/10.1071/WF05021, 2006. a, b
Thompson, D. K., Simpson, B. N., Whitman, E., Barber, Q. E., and Parisien, M. A.: Peatland hydrological dynamics as a driver of landscape connectivity and fire activity in the Boreal plain of Canada, Forests, 10, 534, https://doi.org/10.3390/f10070534, 2019. a, b, c
Turetsky, M., Wieder, K., Halsey, L., and Vitt, D.: Current disturbance and the diminishing peatland carbon sink, Geophys. Res. Lett., 29, 21-1–21-4, https://doi.org/10.1029/2001GL014000, 2002. a
Turetsky, M. R., Amiro, B. D., Bosch, E., and Bhatti, J. S.: Historical burn area in western Canadian peatlands and its relationship to fire weather indices, Global Biogeochem. Cy., 18, GB4014, https://doi.org/10.1029/2004GB002222, 2004. a
Turetsky, M. R., Kane, E. S., Harden, J. W., Ottmar, R. D., Manies, K. L., Hoy, E., and Kasischke, E. S.: Recent acceleration of biomass burning and carbon losses in Alaskan forests and peatlands, Nat. Geosci., 4, 27–31, https://doi.org/10.1038/ngeo1027, 2010. a
Turetsky, M. R., Benscoter, B., Page, S., Rein, G., Van Der Werf, G. R., and Watts, A.: Global vulnerability of peatlands to fire and carbon loss, Nat. Geosci., 8, 11–14, https://doi.org/10.1038/ngeo2325, 2015. a, b, c
Van Wagner, C. E.: Development and structure of the Canadian forest fire weather index system, in: Canadian Forestry Service, Headquarters, Ottawa, ISBN 0-662-15198-4, 1987. a, b, c, d, e, f, g, h, i, j, k, l, m, n
Veraverbeke, S., Rogers, B. M., Goulden, M. L., Jandt, R. R., Miller, C. E., Wiggins, E. B., and Randerson, J. T.: Lightning as a major driver of recent large fire years in North American boreal forests, Nat. Clim. Change, 7, 529–534, https://doi.org/10.1038/nclimate3329, 2017. a
Waddington, J. M., Thompson, D. K., Wotton, M., Quinton, W. L., Flannigan, M. D., Benscoter, B. W., Baisley, S. A., and Turetsky, M. R.: Examining the utility of the Canadian forest fire weather index system in boreal peatlands, Can. J. Forest Res., 42, 47–58, https://doi.org/10.1139/x11-162, 2012. a, b, c, d
Wang, Y., Hogg, E. H., Price, D. T., Edwards, J., and Williamson, T.: Past and projected future changes in moisture conditions in the Canadian boreal forest, Forest. Chron., 90, 678–691, https://doi.org/10.5558/tfc2014-134, 2014. a
Wieder, R. K., Scott, K. D., Kamminga, K., Vile, M. A., Vitt, D. H., Bone, T., Xu, B., Benscoter, B. W., and Bhatti, J. S.: Postfire carbon balance in boreal bogs of Alberta, Canada, Glob. Change Biol., 15, 63–81, https://doi.org/10.1111/j.1365-2486.2008.01756.x, 2009. a, b, c
Wilkinson, S. L., Moore, P. A., Flannigan, M. D., Wotton, B. M., and Waddington, J. M.: Did enhanced afforestation cause high severity peat burn in the Fort McMurray Horse River wildfire?, Environ. Res. Lett., 13, 014018, https://doi.org/10.1088/1748-9326/aaa136, 2018. a, b
Wilkinson, S. L., Tekatch, A. M., Markle, C. E., Moore, P. A., and Waddington, J. M.: Shallow peat is most vulnerable to high peat burn severity during wildfire, Environ. Res. Lett., 15, 104032, https://doi.org/10.1088/1748-9326/aba7e8, 2020. a
Wilkinson, S. L., Andersen, R., Moore, P. A., Davidson, S. J., Granath, G., and Waddington, J. M.: Wildfire and degradation accelerate northern peatland carbon release, Nat. Clim. Change, 13, 456–461, https://doi.org/10.1038/s41558-023-01657-w, 2023. a, b
Wotton, B. M.: Interpreting and using outputs from the Canadian Forest Fire Danger Rating System in research applications, vol. 16, 107–131, ISSN 13528505, https://doi.org/10.1007/s10651-007-0084-2, 2009. a, b
Wotton, B. M., Nock, C. A., and Flannigan, M. D.: Forest fire occurrence and climate change in Canada, Int. J. Wildland Fire, 19, 253–271, https://doi.org/10.1071/WF09002, 2010. a
Xu, J., Morris, P. J., Liu, J., and Holden, J.: PEATMAP: Refining estimates of global peatland distribution based on a meta-analysis, Catena, 160, 134–140, https://doi.org/10.1016/j.catena.2017.09.010, 2018. a, b, c, d
Xu, W., Scholten, R. C., Hessilt, T. D., Liu, Y., and Veraverbeke, S.: Overwintering fires rising in eastern Siberia, Environ. Res. Lett., 17, 045005, https://doi.org/10.1088/1748-9326/ac59aa, 2022. a
Yu, Z., Loisel, J., Brosseau, D. P., Beilman, D. W., and Hunt, S. J.: Global peatland dynamics since the Last Glacial Maximum, Geophys. Res. Lett., 37, L13402, https://doi.org/10.1029/2010GL043584, 2010. a