the Creative Commons Attribution 4.0 License.
the Creative Commons Attribution 4.0 License.
2021 Alaska earthquake: entropy approach to its precursors and aftershock regimes
Eugenio E. Vogel
Denisse Pastén
Gonzalo Saravia
Michel Aguilera
Antonio Posadas
We have conducted an entropy analysis in Alaska, a seismic-rich region in a subduction zone that exhibits a nontrivial behavior: the subduction arc alters the seismic activity from the eastern zone to the western zone, demonstrating a decrease in activity along the subduction. We analyze this zone through the Tsallis entropy and the mutability (or dynamic entropy) for the first time. Considering 13 870 seismic events after appropriate filtering, we analyzed a data set for the selected Alaska zone between 2000 and 2023. We have found agreement between the results for the two entropies. We have followed the value of the q parameter of the Tsallis entropy (Sq) finding values between 1.70 and 1.85, in concordance with values found in other seismic regions of the planet. The values of Sq decrease slightly over time but show a broad increase before the major earthquakes. Just opposite to Tsallis entropy, mutability shows a tendency to decrease prior to the major earthquakes. We used the simpler mutability method to further analyze this zone upon dividing the region into four subzones. The results show how mutability can identify the seismic activity in each zone. This study shows how an entropy approach can shed light on understanding the seismicity in subduction zones.
- Article
(3256 KB) - Full-text XML
- BibTeX
- EndNote
The seismic background in Alaska has been a source of questions and studies for the last decades. Particularly, the subduction of the Pacific Plate under the North American Plate produces the Aleutian trench zone, which runs almost parallel to the arc of islands running along the southern part of Alaska, pointing to Asia towards the west. The Aleutian arc has an extension of approximately 3000 km, from the Gulf of Alaska (east) to the Kamchatka Peninsula (west) (USGS, 2024a). Like other subduction zones on the planet, it is a geologically active area in both underground seismicity and surface volcanic eruptions.
So, the Alaska–Aleutian region has a rich history of large earthquakes which we briefly summarize next: the Shumagin Islands in 1938 (Mw 8.2); Aleutian Islands in 1946 (Mw 8.6); Queen Charlotte Islands in 1949 (Mw 8.1); Lituya Bay in 1958 (Mw 8.2); Prince William Sound in 1964 (Mw 9.2), which is the second largest earthquake worldwide since there have been reliable registers; and the Rat Islands and Near Islands segment in 1965 (Mw 8.7) (Qu et al., 2022). In recent years, at least four large earthquakes have occurred in this zone: the Simeonof earthquake in July 2020 (Mw 7.8); the Alaska Peninsula earthquake in October 2020 (Mw 7.6); and the south Alaska Peninsula in July 2021 (Mw 8.2), almost exactly 1 year after the previous one, and the late aftershock of 2023 (Mw 7.2). This high seismic activity on the Alaska Peninsula in the last 3 years deserves dedicated attention, which is one main purpose of this article. Researchers have studied the Alaska subduction zone from different points of view for several years (Biswas et al., 1986; Doser and Rodriguez, 2011; Smith and Tape, 2019; Daly et al., 2021; Qu et al., 2022). In this article, we will present an analytical and numeric approach based on the variations of two complementary forms of entropy, applied to catalogs of magnitudes.
The Pacific Plate is moving in a northwest direction at average rates of 60 mm yr−1 in the east and 76 mm yr−1 in the west. The rich activity of this zone lies in the different tectonic sources of its seismicity (Martin-Short et al., 2018). On one hand, the seismicity of both the central and the eastern portions of the arc is greater than the one of the western portion. In the latter, the seismic activity is shallow, and the volcanic activity decreases, in comparison with the central and eastern zones of the Aleutians. At least 12 large earthquakes have occurred in the eastern and central areas of the arc in the last century, with magnitudes greater than Mw 7.5.
As has been shown, the analysis of seismicity through information theory has deepened our understanding of this system out of equilibrium. Studies based on entropy have been able to follow the time evolution of seismicity, and they are especially useful in subduction tectonic zones (Sigalotti et al., 2023; Skordas et al., 2020; Varotsos et al., 2018; Vallianatos et al., 2015; Telesca, 2010, 2011; Vogel et al., 2017; Posadas et al., 2022, 2023; Pasten et al., 2023). There are different ways to define and use entropy. In this study, we will use two specific approaches: Tsallis entropy and mutability (a form of dynamical entropy). To study the time evolution of the seismic data, we will use an enumeration of the events; this method can be compared to the well-known concept of natural time (Varotsos et al., 2011, 2019).
The primary aim of the present analysis is to find patterns in the data sequence that could lead to understanding the following aspects of the process: (a) entropic activity of the zone or subzone that can be an indicator of seismic hazard, (b) parameters serving as indicators of seismic hazard, (c) behavior of the data sequence during the earthquake and immediate aftershocks, and (d) recovery to the “normal” or previous seismic activity following the aftershock period.
The next section devotes itself to methods, starting with the extraction of data from the USGS catalog and filtering mechanisms. Then, the researchers quickly review Tsallis entropy and mutability, primarily referring to previous publications to avoid repetition. Section 3 is where the authors focus on results and discussions, while they dedicate Sect. 4 to conclusions.
2.1 Data
We make use of the catalog of the United States Geological Survey (USGS) on the website https://earthquake.usgs.gov/earthquakes/search/. The process starts by defining the geographical area of interest, which, in our case, is determined by the geographic coordinates 53.5° N ≤ latitude ≤ 57.5° N and 161.0° W ≤ longitude ≤ 155.0° W. In this way, we include the most important recent earthquakes in Alaska.
Next, we need to specify the period of observation. Since we want to study signs of previous activity, we will extend it from 1 January 2000 to 31 December 2023. The original extraction of data yielded 19 549 seisms, which is the set that was used to do the Gutenberg–Richter analysis (details below). From this last analysis, we set a minimum seismic magnitude of 2.1; to concentrate on seismicity near the planet’s surface (mainly subduction) we set a limit at a depth of 70 km, which also coincides with a previous study in a different region (Posadas et al., 2023). After applying this filtering, we got a catalog of 13 870 seisms that we will use for the analysis and to draw Figs. 3 to 7. The analysis by subzones has its own subsets of seisms defined in Sect. 3.4.
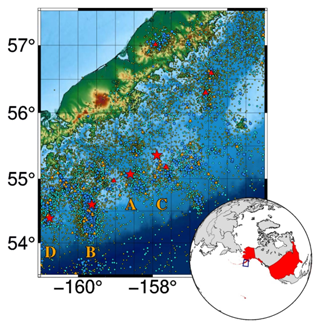
Figure 1Illustration of the seisms with epicenters within the volume between 53.5 and 57.5° N, 155 and 161° W and up to 70 km deep. The largest stars correspond to the four earthquakes listed in Table 1, and they are labeled A, B, C, and D, following the order of occurrence. Other symbols correspond to seisms of increasing magnitude according to the following color code: yellow; cyan; blue; orange; red.
Figure 1 shows the geographical area defined by this search, representing the magnitude of the seisms with the following color codes: yellow; cyan; blue; orange; red. Large red stars denote the four largest seisms tabulated in Table 1, identified by the letters A, B, C, and D, following the order of occurrence.
Figure 2 reports the Gutenberg–Richter analysis for the original extraction of 19 549 records. Following the principle of maximum curvature, we can pick a magnitude of Mw 2.1 as the minimum magnitude compatible with a distribution characterized by a linear decrease in this diagram. The linear regression is represented by a straight line with a=5.70 (interception with the ordinate axis) and b= 0.73 (slope with a negative sign in the expression). Following Eq. (4) we get q=1.73. In addition, we set at 70 km the maximum depth to concentrate on the seisms nearer to the surface; then we are left with 13 870 seisms for the global analysis.
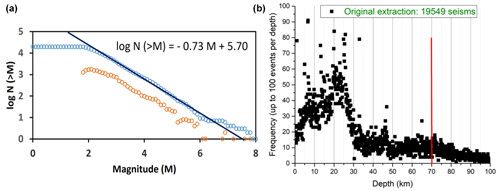
Figure 2(a) Gutenberg–Richter plot for the 19 549 seisms initially considered in this paper; threshold magnitude from the maximum curvature method is M=2.1. Blue circles represent the number of events in each magnitude bin, and orange circles are cumulative frequency–magnitude distributions for all seismic events. A linear fit over the linear part of the blue circle distribution provides the correlation coefficients a and b, which are given in the equation as an inset. An overall estimate of the b value is 0.73. (b) Depth frequency for the 19 549 original seisms, with a vertical red line at 70 km to show the maximum depth to be considered in the rest of this paper.
We present the time distribution of the 13 870 seisms in Fig. 3. To the left, we appreciate how the energy of this region has continuously increased irregularly since the beginning of the century. To the right, the lack of activity prior to the largest seisms is more evident upon zooming in on the last 4 years, which is one of the precursors we will bring out of the analysis. At first glance, we notice the irregularity of the sequence, as we can expect from this phenomenon which is largely stochastic. In addition, the decrease in activity preceding the large earthquakes reflects the accumulation of energy to be released with the incoming seisms of larger magnitudes.
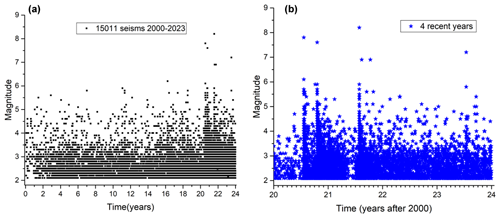
Figure 3(a) Magnitude of the sequence of 13 870 seisms throughout the years 2000–2023. (b) Detail of the years 2020–2023 where the seisms A, B, C, and D are clearly appreciated by there magnitudes over 7.0. Noteworthy is the decrease in seismic activity just before these large earthquakes.
We calculated the Tsallis entropy and mutability in a mobile window of size W, shifting by one event through the entire catalog, and associate the calculated values to the time of the last event in the time window W.
2.2 Tsallis entropy
Within each window of W registers, we find a distribution of data where fi corresponds to the frequency of magnitude Mi. Then, we can easily calculate the probability pi of obtaining the value Mi as
It immediately follows that
adding over all the Ω accessible microstates within the observation period.
From here on we make use of the fragment–asperity model developed by Oscar Sotolongo-Costa and Antonio Posadas in 2004 (Sotolongo-Costa and Posadas, 2004) and continued to recent extensions of the model (Posadas et al., 2023; Pasten et al., 2023). We take the following from Eq. (1) of this last reference, namely
where the left-hand side is given as the upper function in the Gutenberg–Richter law; N is the abscissa there; q is the Tsallis entropic index to be determined; and a is the proportionality between the seismic energy and the size of the fragments, which can be left as an adjusting parameter. Following Sarlis et al. (2010) and Telesca (2010), a relationship between the b value and q parameter can be found. Following Posadas et al. (2023) and Pasten et al. (2023), we can write
which can be compared to the linear descent of the Gutenberg–Richter law. From here, we can obtain the b value and then q.
Different approaches have been followed to get the nonextensive parameters, and the interested reader can find details in the recent literature (Posadas et al., 2023; Flores-Márquez et al., 2024). In addition, combining these techniques with natural time analysis has provided a deep insight into the changes in entropy prior to a large earthquake. The early work of Nicholas V. Sarlis, Efthimios S. Skordas, and Panayiotis A. Varotsos (Sarlis et al., 2010) concentrated on the seismicity of California and Japan. This work continued to report precursors 1 d before the Tohoku undersea megathrust earthquake of 11 March 2011 (Mw 9.0) lasting 6 min, which also caused a large tsunami (Varotsos et al., 2023a). This method was extended to the seismology of Japan, Mexico, and California (Varotsos et al., 2023b). Moreover, the work by Telesca (2010) has also inspired the present work. This brief review shows that nonextensive entropy analysis can be very important in determining seismic hazards all over the world.
Once q is determined, the Tsallis entropy calculation is straightforward:
Boltzmann–Gibbs entropy is recovered in the limit q→1 but for most seismic zones q>1.0 (interested readers are referred to Appendix A in Flores-Márquez et al., 2024).
2.3 Mutability
Let us consider a segment of W=24 consecutive magnitudes corresponding to the beginning of the year 2023 within the rectangle already defined for Alaska. They are listed in the second column of Table 1, while the first column i labels the sequence.
Table 1Example of the way wlzip constructs the map storing the compressed file for the first 24 seisms of the year 2023. Sequential numbers are listed in column one; the corresponding measured magnitudes for these seisms are given in column two, whose vector file has a weight W in bytes. Column three stores the map created by wlzip as explained in the text, weighting W* bytes. The frequency of these magnitudes is listed in column four, leading to the normalized probability of finding this magnitude in this sample given in column five.
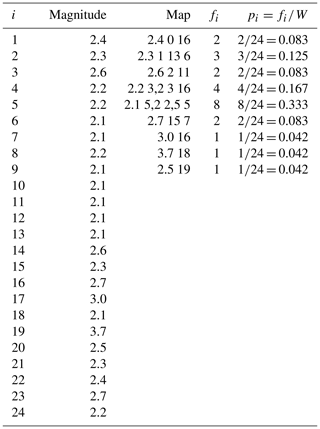
To form the third column (i), go to the original vector file (second column); retrieve the first record (2.4 in this case); and write it down in the first slot of the third column, followed by the distance to the origin of this file (0 in this case). (ii) Go then to the next (second) record (2.3) and verify if this already has an assigned slot: if not, the program writes this magnitude value in the third column followed by its distance to the origin; if yes, it increases the corresponding slot to the right as explained below. (iii) Continue with the next record in the second column (2.6 in this example); if it is new, it writes it down in the next slot in the third column: if not (as in this example), it goes to the next slot in the third column followed by 2, which is its distance to the origin. (iv) It repeats the process for the next register (2.2), followed by its distance to the origin (3), but there is a novelty: since this value repeats itself forming a string of two consecutive values, then it adds a comma and the number of consecutive repetitions: two in this case. (v) Then, the program attempts to find the record 2.4, which is already stored in the first slot of the third column. It goes there and writes 5 as the distance to the previous equivalent record. (vi) Then it is 2.1, the next record, which is new, six positions away from the origin. (vii) The next record is 2.2, which is already known, with a distance 3 to the previous last appearance. (viii) Then the already-known 2.1 register comes again, two positions after the last show, and repeats itself five consecutive times (2,5 to the right). It continues in this way, as the reader can verify with the rest of the file.
An appropriate algorithm can readily count the frequency fi for the ith value in the fourth column of Table 2. Following Eq. (1), we can calculate the probability pi of each accessible value by dividing fi by W. With this information, we could calculate Shannon entropy . However, we will not go in that direction in the present article to concentrate on the seismological activity described by Tsallis entropy and mutability.
The third column is the recognized or compressed file, whose weight is w*. Then the mutability ζ is given by
where w is the weight of the original file in the second column.
The more repetitive and the sooner these repetitions occur, the lower the value of ζ. A succession of quite different registers occupies distinct lines producing an extensive file, increasing w* and hence increasing also the value of ζ.
We recently provided all technical details concerning this process in Pasten et al. (2023), so we will not repeat additional details here. Let us just remember that mutability reaches its minimum value for the repetition of information (magnitude of the seisms in the present case). Before a major earthquake occurs, the subduction mechanism nearly halts, allowing only small advancements between the plates. These small advancements result in medium to low magnitudes that are very similar to each other, enabling better compression and a lower value of mutability. When the rocks finally collapse, they produce a large quake with a high magnitude, followed by a dispersion of magnitudes that differ significantly from each other. This sudden change in magnitudes causes the mutability to rise abruptly, resembling upward needles in the mutability diagrams below.
3.1 Results for Tsallis entropy
From Eq. (5), we realize that Tsallis entropy is determined by the value of q taken from the data distribution. Figure 4 presents the variations in q with time for the region under study for W=512 throughout the 24 years. Values span a range between 1.70 and 1.85. The texture of the curves varies according to the window size, and the ranges decrease slightly with larger windows. Fluctuations around 1.75 (most of the values in Fig. 5) agree well with previously calculated q values for other earthquakes in other regions of the world (Sotolongo-Costa and Posadas, 2004; Silva et al., 2006; Telesca and Chen, 2010; Telesca, 2011; Darooneh and Mehri, 2010; Valverde-Esparza et al., 2012; Varotsos et al., 2023a, b).
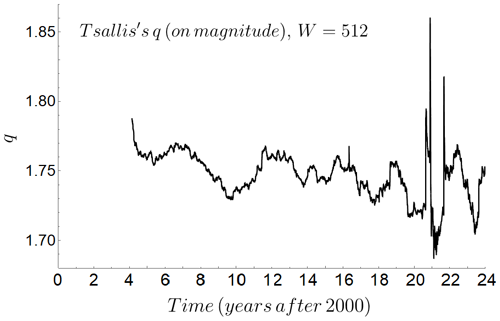
Figure 4Variations in the Tsallis q value throughout the period of study for mobile overlapping windows of W= 512 consecutive events.
Sotolongo-Costa introduced a method (which we essentially follow here) and reported q values in the range 1.60 to 1.64 for southern Spain and 1.65 for California (Sotolongo-Costa and Posadas, 2004). From there, this method and its variations have been applied to various regions of the world. Thus, we find the work of Silva et al. (2006) reporting q values of 1.60, 1.63, and 1.71 for data from Brazil, the USA, and Türkiye, respectively. Then, Darooneh and Mehri (2010) reported values of 1.78 and 1.81 for seismic areas in Iran and California, respectively. Luciano Telesca studied the L’Aquila seismic region by nonextensive entropy and reported q values of 1.48 in the early period increasing to 1.74 and 1.70 later on (Telesca, 2010). A similar analysis was then done for the seismicity of Taiwan reporting q=1.685 (Telesca and Chen, 2010). Also, the value of q=1.66 was found for Japan in Sarlis et al. (2010). For the seismicity of California, a variation in these methods yielded q=1.54 (Telesca, 2011). The seismicity of Mexico was also explored by nonextensive methods, and q values of 1.7, 1.69, 1.63, and 1.64 were reported for different areas (Valverde-Esparza et al., 2012).
The differences among the q values in the brief review of the previous paragraph can be because of both variations in the method and the different geological characteristics of the different zones picked for this sampling. These facts clearly establish that (1) q is much larger than 1.0, requiring nonextensive treatments, and (2) the ranges reported in Fig. 4 are of the same order of magnitude as other active seismic zones.
Upon reaching the period of stronger seismic activity (after 2020 in Fig. 4) large variations in the q value occur. Prior to this period, q values oscillate with periods of 2 to 4 years over a baseline (not drawn) which is slightly descending. This can be a precursor behavior, showing that the zone is increasing the chance of a large earthquake in the future.
Figure 5 reports the average Tsallis entropy calculated for windows of W=512 and W=1024, along with the 13 870 seisms covered by this report. The left-hand side presents the variations throughout the 24 years of this study, while the right-hand side zooms in on the last 6 years, when most of the important activity shows up.
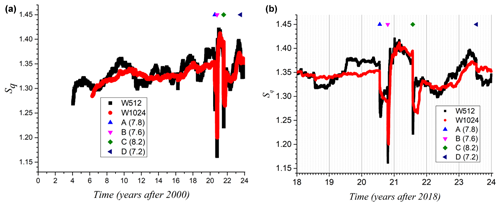
Figure 5(a) Tsallis entropy for the seismic sequence from 2000 to 2023 using mobile windows of W=512 events (black) and 1024 events (red). On the top line, the largest seisms A, B, C, and D of Table 1 are clearly indicated. Noteworthy is the slight long-run increase in entropy during the years prior to the large earthquakes. (b) Zoom on the recent years of the same data.
The relevant seisms A, B, C, and D given in Table 2 are also marked in Fig. 5 by the symbols given in the upper part of the plot. Regardless of the time windows, a decrease in Tsallis entropy is observed with the occurrence of an enormous shock. The larger window (W=1024) keeps most of the characteristics of the function, but it has two disadvantages: (i) it shows less texture than the one with W=512 and (ii) it shows results after 5 years of gathering data to reach the 1024 seisms; such a delay is not desirable when detecting hazards in advance. So we will prefer W=512 when possible, accepting W=256 when the number of records is small.
3.2 Results for mutability
Figure 6 reports the variations in mutability for the same windows of 512 and 1024 consecutive events used with Tsallis entropy plotted in the previous figure. The left-hand side reports the mutability for the entire time range from 2000 to 2023, while the right-hand side zooms in on the last 4 years, which is when the large earthquakes are concentrated. Mutability decreases prior to a large earthquake because small seisms of restricted magnitude dominate the sequence. The general slope of decreasing the mutability value is also clear for the W= 1024 window, with the disadvantage of the delay in time between cause and effect. The absolute minimum mutability after the Mw 7.6 earthquake, whose aftershock regime was suppressed, is notorious. This is almost an announcement of the 8.2 earthquake, which shows here as an isolated “needle” pointing upwards on the right-hand side of the mutability function. So the decrease in the mutability value can also be a precursor of large earthquakes.
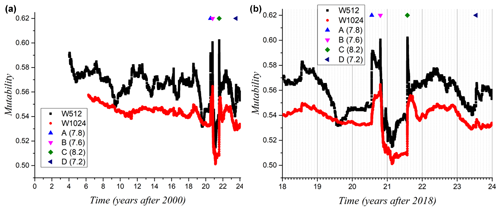
Figure 6(a) Mutability on magnitude for the seismic sequence from 2000 to 2023 using mobile windows of W=512 events (black) and 1024 events (red). On the top line, the largest seisms A, B, C, and D of Table 1 are clearly indicated. Noteworthy is the long-run decrease in mutability during the years preceding the large earthquakes. (b) Zoom on the recent years of the same data.
3.3 Tsallis entropy and mutability
The agreement between Tsallis entropy and mutability is clearly reflected in Fig. 7. This brief window of W=256 events is noisier than previous ones, which underlines the coincidences between these two functions. Despite being calculated by completely different algebraic procedures, the information content embedded in the distribution of magnitude values leads to simultaneous increases in Tsallis entropy and decreases in mutability as the large earthquake approaches. Downward needles from Tsallis entropy coincide completely with upward needles from mutability. The response of both functions to the Mw 7.2 is weak, which is noteworthy.
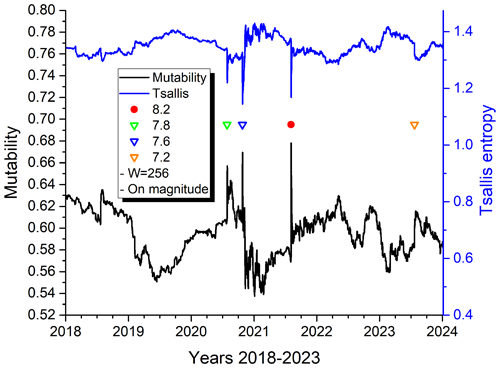
Figure 7Tsallis entropy and mutability on magnitude throughout the years 2018–2023 for overlapping mobile windows of 256 events.
This agreement was even more significant with the seismic activity a few days prior to the Mw 8.1 earthquake near Iquique (Chile) in the year 2014 (see Fig. 7 of Pasten et al., 2023). Both mutability and Tsallis entropy revealed incoming seismic activity, increasing from days to minutes before the large quake. In the present case, we did not observe this effect for the recent Alaska earthquakes. For each of the four events reported in Table 1, we found a sudden increase (decrease) in mutability (Tsallis entropy) with no previous announcement. Obviously, the underground for these two zones can be completely different, and no generalizations are possible. But even for these four seisms reported in Table 2 each earthquake can reflect different underground dynamics. This is an excellent opportunity to investigate this point for four seisms close in geography and time. A careful look at Fig. 7 reveals that mutability shows more texture than Tsallis entropy for the same data. For this reason, we carry on with calculations of mutability only since these results have all the information that the time series can yield.
3.4 Subzones
We begin by defining four non-overlapping subzones on the map given in Fig. 1. Each subzone experienced an earthquake with a magnitude of over 7.0 near its center. It included a large cluster of smaller seismic events around it from 1 January 2020 to 31 December 2023 and up to a depth of 70 km. Table 3 summarizes the geographic definitions of the four subzones.
Table 3Definition of the subzones studied separately by means of mutability. The first column gives the label of the main seism; the second and third columns give its magnitude and its date, respectively. The fourth column gives the range in latitudes, while the fifth column gives the range in longitudes. The sixth column gives the number of seisms for each subzone.

The first important difference among the subzones is the total number of seisms collected over the 24 years for each one of them. They go from 629 for subzone C (containing the largest Mw 8.2 earthquake) to 4021 for subzone B. Analyses based on W=1024 are not possible, while those based on W=516 are nearly meaningless. So, we will use W=256 for the subzone analysis.
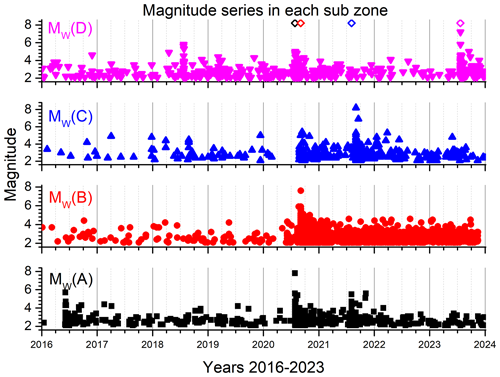
Figure 8Magnitude of seismic activity in subzones A, B, C, and D for the last 8 years. Open diamonds mark the four important seisms characterizing each of the subzones at the top of the diagram.
The time distribution of the earthquakes shows apparent differences in their dynamics. Figure 8 shows the evolution of the magnitudes for the years 2016–2023. All subzones are quiet before the triggering event of 22 July 2020, except for subzone D (to some extent). Each subzone will now be characterized separately.
Subzone A shows nearly no seisms prior to the Mw 7.8 earthquake of 22 July 2020, and the magnitudes of the few previous events are less than 4.0. Around mid-year 2020, the Mw 7.8 earthquake occurred with no precursor, followed by a usual aftershock regime of seisms at short intervals and decreasing magnitude. However, subzones B and D do not reflect any of this activity. But just a few days after this triggering event (e.g., 22 July), a swarm of quakes with magnitudes around 5.0 occurred in the northeast sector of subzone D (blue circles and orange triangles in Fig. 1). The upper part of Fig. 8 reflects this activity. It is not clear if the swarm in subzone D is a consequence of the major earthquake in subzone A, but it is a possibility.
Subzone B had weak previous activity, but the Mw 7.6 earthquake of 19 October 2020 unleashed a continuous aftershock regime lasting until the last days of our data. Figure 1 shows a “vertical” cluster of blue circles and orange triangles near latitude −159.5 showing this. The north–south activity spans all magnitudes from 2.1 to approximately 5.0. A recent example of the latter is the 9 October 2023 Mw 5.0 earthquake, very close to the epicenter of earthquake B.
Subzone C had very weak activity before previous seisms; it did not show any response to neighboring seism A, but it follows the general aftershock regime generated by the 7.6 seism of 19 October 2020 in subzone B. Then, the subzone lost activity to almost none just prior to the Mw 8.2 earthquake that generated a modest aftershock activity here and in the neighboring subzone A to some extent. Currently, the activity of subzone C is like that of subzone A.
Subzone D had recovered by 2021 its quiet behavior with almost no seismic activity until the Mw 7.2 seism came in 2023, generating aftershock activity only here. These seisms are shown by blue circles and orange triangles to the east of the meridian at 160.5° W in Fig. 1. A comparison to other subzones in Fig. 8 shows only a possible connection to neighboring subzone B, near the corner 55° N and 160.5° W, where a swarm of activity can be seen as blue circles and orange triangles in Fig. 8.
The magnitude sequences of the four subzones (Fig. 8) share the following common features: irregular time distribution of the seismic events, sparse time distribution of the seisms before the main earthquake of the subzone, seismic sequence nearly halting a few weeks before the main earthquake, abundance of seisms of different magnitudes after the main quakes (aftershock regime), and little or no influence of large earthquakes in the sequence of other subzones.
They present large differences also: different number of total seisms; different distribution of the seisms with time; subzone C presents almost no activity previous to the large earthquakes, while subzone D presents varieties of intensity activity previous to the largest earthquake in the subzone; and subzone B exhibits an intense aftershock regime with seisms of magnitude over 4.0, while subzone A shows much lower activity with few quakes reaching magnitude 3.0.
Some of the previous features can be useful to define precursors of a future earthquake in a determined area. However, the main message is that premonitory activity tends to be associated with a lack of important seisms immediately before the main quake, a signature that can be lost if the zone or subzone is too large and other activity foci cover up this lack of seisms.
All the previously described diversity in the seismic behavior is an indication of large differences in the subduction processes. Subzones only 100 km away (or even less) show a completely different evolution, although they are wrapped under the common process of plate subduction. We will now examine this process from the optics of the entropy encoded in the sequence of data.
3.5 Mutability analysis for the subzones
In the plots of Figs. 9, 10, 11, and 12, we mark with a red-filled circle the time of the Mw 8.2 earthquake, regardless of the zone. This is to realize that even the largest seism of this catalog does not have a direct influence on subzones nearby.
Figure 9 shows an approximately constant initial mutability near a value of 0.62 evidencing a calm period. Then a descent of mutability begins during 2018, reaching a minimum value of 0.60 and suddenly jumping to higher levels on the day of the 7.8 seism of 2020. The empty green triangle shows the position of this subzone A earthquake coinciding with the upward needle shown by the mutability function. The aftershock regime produces a chain of seisms with a variety of magnitudes that cannot be easily compressed by wlzip, keeping the value of mutability high until it finally decreases at the beginning of 2021. However, during 2021, a second, lower, tiny needle in the mutability is noted: this is because of the Mw 8.2 earthquake in the neighboring region C. From there, it goes through a true minimum from which it recovers, remaining at lower levels than before the years 2016 and 2017. This tendency towards low values could be a precursor for future activity in this subzone.
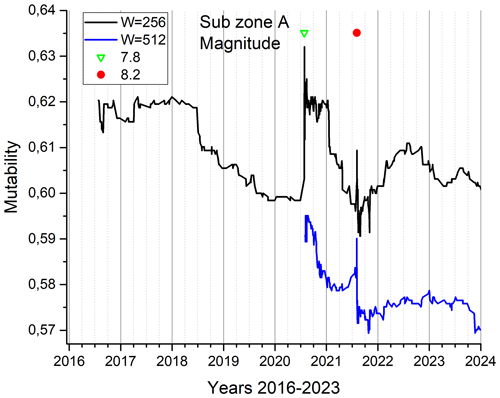
Figure 9Mutability on magnitude for the 929 seisms of subzone A. An empty green triangle identifies the time for the largest seism of this subzone, while a solid red circle marks the time of the largest seism of the whole zone under study.
The details in the discussion of the previous figure will not be explicitly repeated for the other three figures, since the cases are similar. Mutability levels cannot be strictly compared among subzones because they reflect the dynamics of the underground subduction in each place.
Highly surprising is subzone B: despite having the largest number of seisms among the four subzones, it has almost no activity prior to the Mw 7.6 earthquake marked with an empty green triangle during the second half of the year 2020 in Fig. 10. The initial calculation, making no modifications, yields a mutability of 0.61, which subsequently shows a strong maximum corresponding to seism B, only to decrease later because of the aftershock regime. The mutability function clearly marks the needle coinciding with the 7.6 earthquake B, and then it gradually decreases to 0.53 in the typical oscillatory pattern of aftershock regimes. Its recovery is far from being complete, remaining at levels near 0.58, which is even lower than present values for subzone A. No significant activity can be associated here with earthquake B despite its large magnitude.
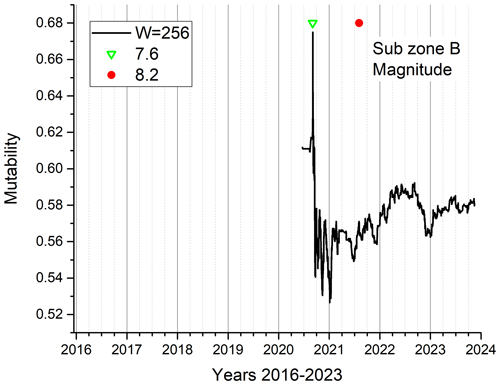
Figure 10Mutability on magnitude for the 4021 seisms of subzone B. An empty green triangle identifies the time for the largest seism of this subzone, while a solid red circle marks the time of the largest seism of the whole zone under study.
Subzone C has so few seismic events that the curve begins approximately 4 months before the largest Mw 8.2 earthquake. The needle of the mutability function coincides with the red circle marking the time of seism C. The mutability function goes down, remaining low at values near 0.615. It is hard to say anything else here because of the small amount of data.
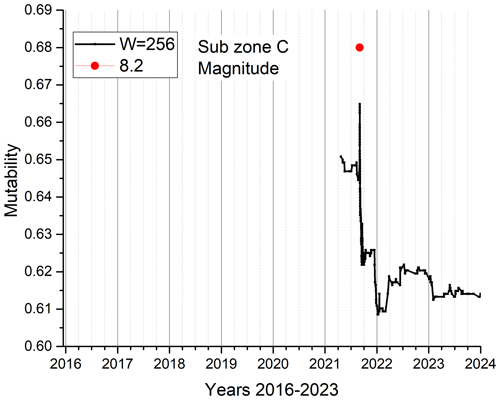
Figure 11Mutability on magnitude for the 629 seisms of subzone C. A solid red circle marks the time for the largest seism of this subzone, which is also the largest seism of the whole zone.
Subzone D shows the expected needle at the position of the Mw 7.2 earthquake marked with an empty green triangle towards the far right of this plot. However, we find an unexpected broad maximum during the second half of the year 2020. We had to go back to the time series to discover that this activity corresponds to a swarm of seisms with magnitudes between Mw 5.5 and Mw 5.8 beginning in this subzone in July 2020 and continuing for a few months. The present level of the mutability function is 0.62, similar to subzones A and C. There is no activity associated with the largest Mw 8.2 earthquake marked with a solid red circle.
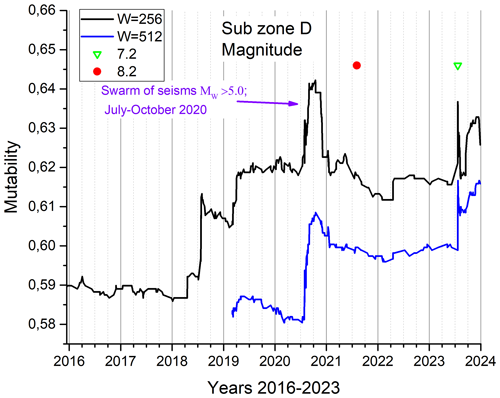
Figure 12Mutability on magnitude for the 908 seisms of subzone D. An empty green triangle identifies the time of the largest seisms of this subzone, while a solid red circle marks the time of the largest seisms of the whole zone under study.
Despite the differences among subzones, we can notice the sensitivity of mutability to detect the seismic activity in the time sequence. Although a premonitory protocol is still far away, we can recognize the decrease in the mutability value as one element to investigate further as a precursor.
We have analyzed the seismicity in the Alaska subduction zone measured during the last 24 years through nonextensive thermodynamics using two entropies: Tsallis entropy and mutability (or dynamical entropy). We have followed the time evolution of the seismic activity in the eastern and central zones of the Aleutian arc between the years 2000 and 2023, mainly focusing on four large earthquakes that occurred in that zone during the last years of the period under study.
We have used an entropic approach to deal with data produced by the seismic activity grouped in a sequential series of W consecutive events. Such non-overlapping time windows are analyzed to produce results on Tsallis entropy Sq(t), which can be summarized as follows. The dynamical values for q(t) in the definition of the Tsallis entropy vary between 1.70 and 1.85, which agrees with ranges of values reported in the literature in other subduction areas (Telesca, 2010, 2011; Silva et al., 2006; Telesca and Chen, 2010; Darooneh and Mehri, 2010; Valverde-Esparza et al., 2012).
Tsallis entropy increases before seismic activity and collapses to minimal values at the instant of the megathrust. This is a manifestation of the set of magnitude values brought in by the aftershock regime.
Mutability on magnitude values has precisely the opposite behavior to the one shown by Tsallis entropy as presented in Fig. 7. Thus, mutability minimizes before an incoming large earthquake since the magnitudes of nearby seisms remain small because of the clogging in the plate subduction. This accumulates stresses until a rupture occurs, producing chains of interrelated events (like a domino effect), which are described by non-additive entropies like the Tsallis entropy.
The definition of small sectors within the area of study leads to four subzones with similarities and differences. Thus, in all subzones, the frequency of inter-events halted before a large earthquake (Mw>7.0), but the level of activity is large (like in region D) or low (like in region B). So, even within a geographically restricted zone, the subduction process is different for processes separated by just a few dozen kilometers.
The production of a large earthquake, like the Mw 8.2 in subzone C, can occur in a quiet zone without previous activity and with no previous sign. This requires permanent monitoring of the seismic activity of Alaska to find indicators of premonitory activity.
Several possible precursors were emphasized in previous discussions. The low density of seisms prior to important earthquakes was stated in relation to Fig. 3. The evolution of q, the nonextensive parameter, is also a possible precursor as its value oscillates with a general tendency to lower values prior to a large earthquake. Tsallis entropy Sq oscillates, tending slightly towards larger values. Simultaneously, the values of mutability decrease prior to a large earthquake. This last observation was confirmed during the subzone analysis. These variations occur over decades. It is highly probable that these observations are not independent, but there is only a minor extra effort to calculate them all. Eventually, after applying them to different geographical areas and along different times of observation, a couple of them can serve as long-term parameters warning of a possible earthquake in the coming years.
Finer precursors could be possible for relatively small subzones. However, in advance one does not know where to draw this small zone. Then the only possibility is to monitor several or many subzones, eventually overlapping among them, to find a couple of them that show an evolution similar to those presented in Fig. 8 just before a large quake. This can be further confirmed by the measurement of the mutability of the seismic sequence in that area.
The behavior of this subduction zone is not comparable to the previous analysis of the subduction zone between the Nazca Plate and the South American Plate, where premonitory behaviors were detected. In the present case, we did not find a behavior that warns about an earthquake coming. However, both Tsallis entropy and mutability show the state in which the study areas have been left, warning that the central area of the Aleutian arc is still very active.
The data sets used in the present article were accessed via https://earthquake.usgs.gov/earthquakes/search/ (USGS, 2024b), which are open to the public without restrictions.
EEV proposed the problem, calculated results, and wrote portions of the text; DP got the initial data, documented the introduction and bibliography, and wrote portions of the text; GS calculated results and plotted figures; MA calculated results and plotted figures; AP calculated results, documented the bibliography, and plotted figures. All the authors participated in the discussion of results and the expression of the conclusions.
The contact author has declared that none of the authors has any competing interests.
Publisher’s note: Copernicus Publications remains neutral with regard to jurisdictional claims made in the text, published maps, institutional affiliations, or any other geographical representation in this paper. While Copernicus Publications makes every effort to include appropriate place names, the final responsibility lies with the authors.
Partial support from the following two Chilean sources is acknowledged: Fondecyt under contract 1230055 and Financiamiento Basal para Centros Científicos y Tecnológicos de Excelencia (Chile) through the Center for the Development of Nanoscience and Nanotechnology (CEDENNA) under contract AFB220001. This research has been partially supported by the Agencia Estatal de Investigación (grant no. PID2021-124701NBC21 y C22); the Universidad de Almería (FEDER/UAL Project UAL2020-RNM-B1980); the Consejería de Universidad, Investigación e Innovación, Junta de Andalucía (grant no. RNM104); and PPITUAL, Junta de Andalucía-FEDER 2021–2027 (programa: 54.A). Antonio Posadas, Denisse Pastén, and Eugenio E. Vogel have been partially funded by the Spanish Project LEARNING PID2022-143083NB-I00 by the Agencia Estatal de Investigación.
This research has been supported by the Fondo Nacional de Desarrollo Científico y Tecnológico (grant no. 1230055), the Agencia Nacional de Investigación y Desarrollo (grant no. AFB220001), and the Agencia Estatal de Investigación (grant nos. LEARNING PID2022-143083NB-I00, PID2021-124701NBC21 and PID2021-124701NBC22).
This paper was edited by Filippos Vallianatos and reviewed by three anonymous referees.
Biswas, N. N., Pujol, J., Tytgat, G., and Dean, K.: Synthesis of seismicity studies for western Alaska, Tectonophysics, 131, 369–392, https://doi.org/10.1016/0040-1951(86)90183-6, 1986. a
Daly, K. A., Abers, G. A., Mann, M. E., Roecker, S., and Christensen, D. H.: Subduction of an oceanic plateau across southcentral Alaska: High-resolution seismicity, J. Geophys. Res.-Sol. Ea., 126, e2021JB022809, https://doi.org/10.1029/2021JB022809, 2021. a
Darooneh, A. H. and Mehri, A.: A nonextensive modification of the Gutenberg-Richter law: q-stretched exponential form, Physica A, 389, 509–514, https://doi.org/10.1016/j.physa.2009.10.006, 2010. a, b, c
Doser, D. I. and Rodriguez, H.: A seismotectonic study of the Southeastern Alaska Region, Tectonophysics, 497, 105–113, https://doi.org/10.1016/j.tecto.2010.10.019, 2011. a
Flores-Márquez, E., Ramírez-Rojas, A., and Sigalotti, L.: Non-Extensive Statistical Analysis of Seismicity on the West Coastline of Mexico, Fractal Fract., 8, 306, https://doi.org/10.3390/fractalfract8060306, 2024. a, b
Martin-Short, R., Allen, R., Bastow, I. D., Porritt, R. W., and Miller, M. S.: Seismic imaging of the Alaska subduction zone: Implications for slab geometry and volcanism., Geochem. Geophy. Geosy., 19, 4541–4560, https://doi.org/10.1029/2018GC007962, 2018. a
Pasten, D., Vogel, E. E., Saravia, G., Posadas, A., and Sotolongo, O.: Tsallis Entropy and Mutability to Characterize Seismic Sequences: The Case of 2007–2014 Northern Chile Earthquakes, Entropy, 25, 1417, https://doi.org/10.3390/e25101417, 2023. a, b, c, d, e
Posadas, A., Morales, J., Ibáñez, J., and Posadas, A.: Shaking earth: Non-linear seismic processes and the second law of thermodynamics: A case study from Canterbury (New Zealand) earthquakes, Chaos Solitons and Fract., 151, 111243, https://doi.org/10.1016/j.chaos.2021.111243, 2022. a
Posadas, A., Pasten, D., Vogel, E. E., and Saravia, G.: Earthquake hazard characterization by using entropy: application to northern Chilean earthquakes, Nat. Hazards Earth Syst. Sci., 23, 1911–1920, https://doi.org/10.5194/nhess-23-1911-2023, 2023. a, b, c, d, e
Qu, R., Ji, Y., Zhu, W., Zhao, Y., and Zhu, Y.: Fast and Slow Earthquakes in Alaska: Implications from a Three-Dimensional Thermal Regime and Slab Metamorphism, Appl. Sci., 12, 11139, https://doi.org/10.3390/app122111139, 2022. a, b
Sarlis, N., Skordas, E., and Varotsos, P.: Nonextensivity and natural time: The case of seismicity, Phys. Rev. E, 82, 021110, https://doi.org/10.1103/PhysRevE.82.021110, 2010. a, b, c
Sigalotti, L., Ramírez-Rojas, A., and Vargas, C.: Tsallis q-Statistics in Seismology., Entropy, 25, 408, https://doi.org/10.3390/e25030408, 2023. a
Silva, R., França, G. S., Vilar, C. S., and Alcaniz, J. S.: Nonextensive models for earthquakes, Phys. Rev. E, 73, 026102, https://doi.org/10.1103/PhysRevE.73.026102, 2006. a, b, c
Skordas, E., Sarlis, N., and Varotsos, P.: Precursory variations of Tsallis non-extensive statistical mechanics entropic index associated with the M9 Tohoku earthquake in 2011, Eur. Phys. J. Spec. Top., 229, 851–859, https://doi.org/10.1140/epjst/e2020-900218-x, 2020. a
Smith, K. and Tape, C.: Seismic noise in central Alaska and influences from rivers, wind, and sedimentary basins, J. Geophys. Res.-Sol. Ea., 124, 11,678–11,704, https://doi.org/10.1029/2019JB017695, 2019. a
Sotolongo-Costa, O. and Posadas, A.: Fragment-Asperity Interaction Model for Earthquakes, Phys. Rev. Lett., 92, 048501, https://doi.org/10.1103/PhysRevLett.92.048501, 2004. a, b, c
Telesca, L.: Analysis of Italian seismicity by using a nonextensive approach, Tectonophysics, 494, 155–162, https://doi.org/10.1016/j.tecto.2010.09.012, 2010. a, b, c, d, e
Telesca, L.: Tsallis-based nonextensive analysis of the southern California seismicity, Entropy, 13, 1267–80, https://doi.org/10.3390/e13071267, 2011. a, b, c, d
Telesca, L. and Chen, C.-C.: Nonextensive analysis of crustal seismicity in Taiwan, Nat. Hazards Earth Syst. Sci., 10, 1293–1297, https://doi.org/10.5194/nhess-10-1293-2010, 2010. a, b, c
USGS (United States Geological Survey): M 8.6 – 1946 Aleutian Islands (Unimak Island), Alaska Earthquake, https://earthquake.usgs.gov/earthquakes/eventpage/official19460401122901_30/region-info (last access: 30 October 2024), 2024a. a
USGS (United States Geological Survey): Search Earthquake Catalog, https://earthquake.usgs.gov/earthquakes/search/, last access: 30 October 2024b. a
Vallianatos, F., Michas, G., and Papadakis, G.: A description of seismicity based on non-extensive statistical physics: a review, in: Earthquakes and their impact on society, edited by: D'Amico, S., Cham, Springer Natural Hazards, 1–41, https://doi.org/10.1007/978-3-319-21753-6, 2015. a
Valverde-Esparza, S., Ramirez-Rojas, A., Flores-Márquez, E. L., and Telesca, L.: Non-extensivity analysis of seismicity within four subduction regions in Mexico, Acta Geophys., 60, 833–845, https://doi.org/10.2478/s11600-012-0012-1, 2012. a, b, c
Varotsos, P., Sarlis, N., and Skordas, E.: Tsallis Entropy Index q and the Complexity Measure of Seismicity in Natural Time under Time Reversal before the M9 Tohoku Earthquake in 2011, Entropy, 20, 757–73, https://doi.org/10.3390/e20100757, 2018. a
Varotsos, P., Sarlis, N., Skordas, E., Nagao, T., and Kamogawa, M.: Natural time analysis together with non-extensive statistical mechanics shorten the time window of the impending 2011 Tohoku M9 earthquake in Japan, Commun. Nonlinear Sci., 125, 107370, https://doi.org/10.1016/j.cnsns.2023.107370, 2023a. a, b
Varotsos, P., Sarlis, N., Skordas, E., Nagao, T., Kamogawa, M., Flores-Márquez, E., Ramírez-Rojas, A., and Perez-Oregon, J.: Improving the Estimation of the Occurrence Time of an Impending Major Earthquake Using the Entropy Change of Seismicity in Natural Time Analysis, Geosciences, 13, 222, https://doi.org/10.3390/geosciences13080222, 2023b. a, b
Varotsos, P. A., Sarlis, N., Skordas, E. S., Uyeda, S., and Kamogawa, M.: Natural time analysis of critical phenomena, P. Natl. Acad. Sci. USA, 108, 11361–11364, 2011. a
Varotsos, P. A., Sarlis, N. V., and Skordas, E. S.: Phenomena preceding major earthquakes interconnected through a physical model, Ann. Geophys., 37, 315–324, https://doi.org/10.5194/angeo-37-315-2019, 2019. a
Vogel, E., Saravia, G., and Ramirez-Pastor, A.: Phase transitions in a system of long rods on two-dimensional lattices by means of information theory, Phys. Rev. E, 96, 062133, https://doi.org/10.1103/PhysRevE.96.062133, 2017. a


