the Creative Commons Attribution 4.0 License.
the Creative Commons Attribution 4.0 License.
Critical infrastructure resilience: a guide for building indicator systems based on a multi-criteria framework with a focus on implementable actions
Bruno Barroca
Ahmed Mebarki
Katia Laffréchine
Hélène Dolidon
Lionel Lilas
Criteria and indicators are frequently used for assessing the resilience of critical infrastructure (CI). Moreover, to generate precise information on conditions, the assessment designed for CI resilience could rely on indicator systems. However, few practical tools exist for guiding CI managers to build specific indicator systems for considering real cases. Therefore, the main objective of this study is to develop a step-by-step guide that contains guidance on operational steps and required resources for criteria and indicator setting, reference definition, and data collection. This guide enables CI managers to build systems of indicators tailored to different real cases. This guide could assist CI managers in their decision-making process, as it is structured based on a multi-criteria framework that takes into account the cost–benefit analysis and side effects of implementable actions. This guide could furthermore advance the application of indicator-based CI resilience assessment in practical management. In addition, this study provides an example to demonstrate how to use this guide. This example is based on specific circumstances for the Nantes Ring Road (NRR) network: when the ring road is flooded and closed, the road network manager suggests alternative roads to the public. An indicator system consisting of 4 criteria, 7 sub-criteria, and 11 indicators was built for these circumstances using the guide developed in this paper. This example relates to criteria and indicators in the technical, social, and environmental dimensions and involves 62 676 data points.
- Article
(7461 KB) - Full-text XML
- BibTeX
- EndNote
The research for critical infrastructure (CI) goes across disciplines, sectors, and scales, as the disruption or destruction of CI would have a significant cross-border impact on human society. However, CI might be vulnerable to natural and technological hazards worldwide. The concept of resilience, presented as an inherent attribute of a system addressing external hazards, is developing rapidly in the field of CI management. In addition, resilience assessments have become an important issue for CI management. Thus, resilience assessments have to address the drop in capacities as well as the recovery, which depend not only on the availability of resources but also on adequate management (Resilience Alliance, 2010). Moreover, the assessment of CI resilience is frequently based on indicators (Hosseini et al., 2016; Mebarki, 2017; Cantelmi et al., 2021). Indicator-based resilience assessment can simply be considered a process in which resilience values are derived from indicators. Furthermore, the indicator values can be obtained by reliable data.
To generate increasingly precise information on conditions, the assessment designed for a complex system should rely on indicator systems because a single indicator can rarely provide useful information. An indicator system should contain numerous specific indicators that are associated with concrete conditions, requirements, or situations. These specific indicators cannot be set without consideration of the realities of each particular case studied. Thus, it necessitates practical tools that enable CI managers to set the specific indicator system tailored for their particular case study without directly providing pre-defined indicators. As argued by Shavelson et al. (1991) “no indicator system could accommodate all of the potential indicators identified by a comprehensive process and remain manageable.” A desirable hazard-related indicator tool should be simple and flexible, adapting itself to different case studies and different kinds of users (Barroca et al., 2006). Even though existing CI resilience assessments by indicators are diverse and multidisciplinary, few tools exist for guiding CI managers to build specific indicator systems tailored to real cases. For example, Yang et al. (2023a) review 68 scientific papers relating to indicator-based assessments for CI resilience. Several papers reviewed by Yang et al. (2023a) present assessments based on a large number of systemic indicators, i.e. Fisher et al. (2010), Martin and Ludek (2012), Petit et al. (2013), Bialas (2016), Upadhyaya et al. (2018), and De Vivo et al. (2022). However, all these papers directly list the set of indicators without describing the detailed steps needed to set them. Moreover, the review of Yang et al. (2023a) shows that many studies about the setting of CI resilience criteria have focused on the damage to CI or on CI capabilities related to resilience but have overlooked the fact that the benefits, costs, or impacts of implementable actions for every CI manager are critical. The lack of discussion and consensus about the effects of implementable actions causes difficulties in the application of CI resilience assessment in practical management. Therefore, as a contribution to fill the gap, the present study aims to provide a guide for CI managers to enable them to build specific indicator systems tailored to their specific case studies. The guide developed here considers not only damage to CI and CI capabilities but also different aspects of implementable actions.
To achieve the objectives of this study, an immediate question is the following: which achievements should the guide developed here assist the user in accomplishing? Another fundamental question necessitates deliberation: what should the guide contain to enable users to reach these goals? For the first question, according to many studies focusing on building indicator systems (Lammerts Van Bueren and Blom, 1997; Vogel, 1997; Prabhu et al., 1999; Mendoza and Prabhu, 2000), the setting of criteria and indicators (C & I) and the collection of data are considered basic (Cutter, 2016; CORDIS, 2018; Balaei et al., 2018). In particular, criteria and indicators adapted to real cases are key for CI managers to apply indicator systems to practical management (Yang et al., 2023b). For the second question, practical guides should include guidance on operational steps and required resources, as well as advice for finding required resources. Therefore, the guide developed in this paper should contain operational steps and resources for finding advice that helps CI managers set specific criteria and indicators and collect data. Furthermore, for the indicator system to be applied in practical management, the guide developed in this study should consider the benefits, costs, or impacts of implementable actions. This present study assumes that this guide can help CI managers build indicator systems and attempts to illustrate its use and usage through an example.
Based on the research objectives and questions presented, this research starts with a presentation of the three basic key factors (criterion, indicator and data). Then, the main research work involves designing the steps for C & I setting and data collection (Fig. 1). Moreover, for these steps to be operational in practice, the steps designed in this guide are clearly described, preferably with the support of schematic diagrams.
In the second part, this study applies the steps designed to French critical infrastructure to build an indicator system that can assess resilience during urban flooding (Fig. 1). The example focuses on the Nantes Ring Road (NRR) network, the investigation of which was assisted by a local management organisation, Direction interdépartementale des routes Ouest (DIRO), which is in charge of the road networks in Nantes, France. This example involves 62 676 traffic flow data points from DIRO and over 15 000 road infrastructure data points from the Institut national de l'information géographique et forestière (IGN).
The present paper is divided into several sections. Section 3 will (Fig. 1) develop a step-by-step guide that enables CI managers to build indicator systems for their particular cases. Section 4 (Fig. 1) will illustrate how to use this guide to build an indicator system through an example focusing on the Nantes Ring Road. Section 5 discusses the contributions and limitations of this guide and shows an assessment process that applies the indicator system built in Sect. 4.
3.1 Setting specific criteria
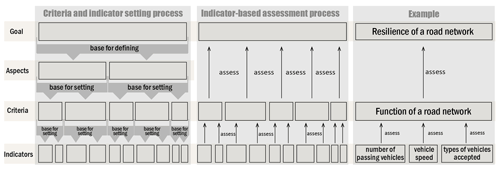
Suitable indicators should be set based on rational assessment criteria, which can be determined through studied goal phenomena, aspects, and observed factors (Maggino, 2017). Criteria are characters or signs that “make it possible to distinguish a thing or a concept in order to make a judgement of appreciation” (Yang et al., 2021). Each indicator is associated with a criterion, whereas a criterion is associated with one or more indicators. Criteria can be considered the points to which the information provided by indicators can be integrated and where an interpretable assessment crystallises. To make judgements, different levels of each criterion are generally designed to show what is achieved, how much is accomplished, and to what extent. In the field of CI, stakeholders or managers frequently define the function of studied infrastructure as a criterion. For instance, more than one indicator could assess the function level of road infrastructure: the number of passing vehicles, vehicle speed, or types of vehicles accepted (Fig. 2, example).
Assessments consisting of criteria and indicators (C & I) could provide a commonly agreed upon framework for articulating and defining expectations. There is a hierarchical structure for C & I-based assessments (Fig. 2) first developed for forest sustainability assessment (Prabhu et al., 1996; Lammerts Van Bueren and Blom, 1997; Mendoza and Prabhu, 2000) that today is also used in other disciplines (Montaño et al., 2006; Van Cauwenbergh et al., 2007; Koschke et al., 2012; Feiz and Ammenberg, 2017). This hierarchical structure is a common framework, in which a higher-level goal is divided into aspects or themes, which are in turn divided into criteria each with several indicators (Maggino, 2017). Criteria and indicators (Fig. 2, criteria and indicator setting process) are set from the goal to the indicator. This means that the criteria and indicators are set based on certain important aspects of the assessed goal. “Important aspects are identified in terms of the definition of and phenomena associated with the assessed goal” (Eurostat, 2014; Maggino, 2017). The aspects of the assessed goal may not be necessary for the assessment process, but they are important for setting criteria. In practical management, the criteria vary between different contexts. The criterion setting steps designed in the present paper should enable managers to set specific criteria to adapt to different real cases. In contrast to the process of setting criteria and indicators, the assessment process (Fig. 2, Indicator-based assessment process) based on an indicator system transforms indicators into criterion levels and from criterion levels derives the resilience value.
The integration of implementable action into assessment criteria is one of the keys to resilience assessment application in practical management (Yang et al., 2023b). One of the objectives of CI resilience studies is to help CI managers find more sustainable and efficient measures or actions to deal with increased hazards in practice. Resilient critical infrastructure (CI) should involve diverse implementable actions to improve its different capabilities (Barroca and Serre, 2013). Implementable actions refer to all possible operations that could be taken to optimise CI resilience, like programmes, strategies, projects, measures, or practices for both temporary (short-term) and permanent preventive (long-term) management. Meanwhile, implementable actions aimed at CI potentially bring unexpected negative effects to the CI or externally to its environment, like side effects or over-budget expenses. Therefore, an effective assessment should provide CI managers with information on the both positive and negative effects of implementable actions. Thinking about the spatial and temporal impacts of implementable actions across urban systems helps enhance beneficial strategies and suppress dangerous ones (Yang et al., 2023b).
To meet the requirements (specific criteria and consideration of implementable actions) mentioned above, the multi-criteria framework (MCF) developed by Yang et al. (2023b) is deployed to set criteria. The MCF aims to set criteria for CI resilience. Through an analysis of the definition and phenomena of the concept of CI resilience, the MCF defined two aspects and four associated general criteria:
-
the consequence aspect, i.e. damage to internal components, and
-
the action aspect, i.e. effectiveness of action, efforts for action, and damage from actions (also associated with the consequence aspect).
These criteria consider direct damage to CI and the cost–benefit analysis and side effects of implementable actions. In addition, the MCF contains a guide to set specific sub-criteria below the four general criteria for different real cases. The consideration of implementable actions and specific criteria emphasised by Yang et al. (2023b) corresponds to the objectives of the present study.
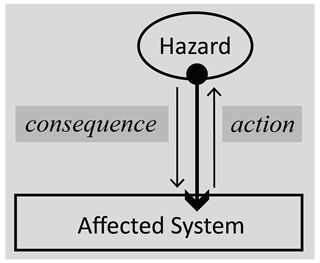
According to the MCF, the setting of specific criteria requires an investigation for every component of the CI under study. Consideration should also be given to the functions of the CI studied and its components, as well as the efforts required for implementable actions. The specific criteria that are set are particular; tailored to real cases; and meet the commands, requirements, or conditions of relevant stakeholders. The importance of criteria may vary between different contexts. Thus, the MCF requires first defining a study scenario in which a target CI is affected by a hazard. Four factors in the study scenario should be defined (Fig. 3).
-
The affected system is the target CI. The resilience of the CI relates to its expected function or to the services derived by the system from this CI.
-
The hazard is one hazard having negative effects on the target CI, in particular related to its function and services.
-
The consequence refers to the negative effects (damage) to the target CI due to the hazard.
-
The action is one or more implementable actions for improving the resilience of the target CI.
After the definition of the four factors in the scenario analysed, the criterion setting process involves two focuses: direct and indirect damage and the costs vs. benefits of actions.
3.1.1 Direct and indirect damage
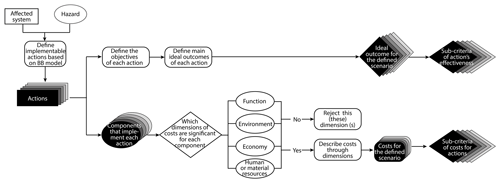
The determination of significant damage is related to two criteria: damage to internal components and damage from actions. Significant damage is determined based on Form 1 introduced by Yang et al. (2023b; Fig. 4). Form 1 can be considered the process of setting specific sub-criteria under these two damage-related criteria. According to Form 1, once the target CI (Fig. 4, affected system) has been defined, its functions and three categories of components should be identified: collective human components, individual human components, and physical non-human components. After that, the damage to the elements considered important should be set as a sub-criterion of resilience assessment.
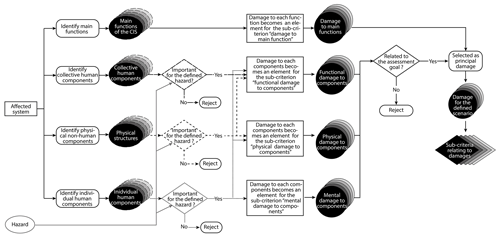
Figure 4Form 1 for setting the sub-criteria for the damage to internal components and damage from action criteria from Yang et al. (2023b).
It is worth noting that the damage from action criterion requires defining new scenarios in which the defined implementable action causes side effects. Side effects can be damage to the target CI or damage to the environment of the target CI. Thus, the process of Form 1 can be repeated when the side effects of implementable actions act on one piece of infrastructure (the target infrastructure or different infrastructure). In the new scenarios, hazard refers to the defined implementable action that causes side effects. The affected system in Form 1 refers to the target CI or to the environment that suffered side effects.
3.1.2 Effectiveness and efforts of actions
The second focus is on the sub-criteria related to the action aspect. Before setting relevant sub-criteria, an implementable action needs to be defined. The identification of implementable actions in the present study is based on the Behind the Barriers model (BB model) developed by Barroca and Serre (2013), which allows effective and comprehensive development of infrastructural system resilience by considering the interdependencies in various urban scales. Application of the Behind the Barriers model to action identification has been presented in several studies (Gonzva, 2017; Gonzva and Barroca, 2017; Yang et al., 2022; Barroca et al., 2023). The BB model shows that the actions for improving capabilities can be described in four dimensions:
-
cognitive capacity, which refers to the knowledge, awareness, and identification of resilience by stakeholders;
-
functional capacity, which is specific to the material objects and technical urban systems that make up the area;
-
correlative capacity, which recognises that service and utilisation form a whole whose different sections are interconnected together; and
-
organisational capacity (called also territorial capacity), which raises the question of stakeholders (public and private players, populations, etc.) and territorial strategies.
Next, the defined implementable actions allow for the description of the desired outcome, which is then treated as a sub-criterion of the effectiveness of action criterion. By investigating the components (function, collective human components, individual human components, and physical non-human components) related to the defined actions, it is possible to determine the costs of the defined actions in terms of four dimensions: functional, environmental, economic, and human or material resources. The costs of the defined actions are considered sub-criteria of the effectiveness of actions criterion. The process of setting sub-criteria is presented in Form 2 (Fig. 5), and the details can be found in the paper of Yang et al. (2023b).
3.2 Indicator setting and definition of references
According to Cambridge Dictionary, an indicator is “a sign or a signal that shows something exists or is true or that makes something clear”. Indicators are objective information. A single indicator can rarely provide useful information. According to Eurostat (2014), presenting the most important and relevant features of a given issue or topic requires a collection of indicators. Indicator setting consists of setting the expected evolution of indicators by references. The reference of an indicator can be used as a ruler for measuring a criterion by this indicator, with a scale marked on it. We take the example indicators just mentioned for road infrastructure, the number of passing vehicles and types of vehicles accepted. For the former, for instance, high function could refer to more than 10 000 vehicles passing per day, while low function refers to fewer than 500 passing vehicles. For the second indicator, high function means that all types of vehicles can enter the road network, whereas low function means the network is available for motorbikes only. It can be seen that the setting of the indicator reference also includes the choice of object, unit, and types of attributes (quantitative and qualitative). As argued by Acosta-Alba and van der Werf (2011), “the determination of reference values, norms, or veto thresholds constitutes a key stage in the procedure for developing an indicator.” Appropriate indicator reference values are required to assist in the interpretation of assessment results (Acosta-Alba and van der Werf, 2011). Indicator references are an indispensable element of comparative assessment (Franchini and Bergamaschi, 1994). Indicator references for CI resilience assessment could furthermore indicate the desirable state of CI resilience.
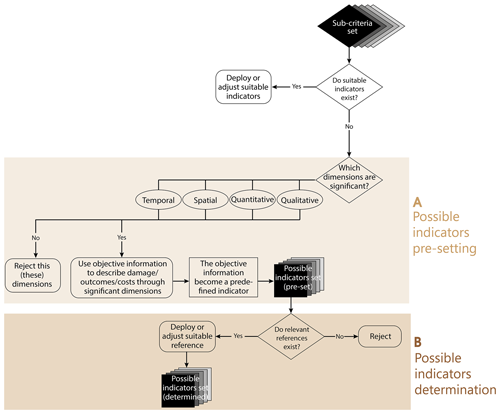
It is not simple to define indicator references that indicate the desirable state for resilient CI. References for the same indicator may vary according to local conditions, and they are highly relevant to the real context of the CI studied. An indicator reference could be suitable only for one territory, one scenario, or one particular piece of CI. During indicator setting, the existing indicators, which have rational references and are suitable to the sub-criteria defined, can be deployed directly or after adjustments. However, if no suitable or relevant indicators can be found through available resources, new indicators should be created. The indicators can be created by describing sub-criteria (damage, outcome, and costs) in four dimensions (Scerri and James, 2010; Serre and Heinzlef, 2018):
-
The temporal dimension focuses on the duration of sub-criteria.
-
The spatial dimension emphasises the spatial or geographical extent of sub-criteria, which can often be represented as a planar or elevation image.
-
The quantitative dimension relates to the quantifiable data associated with sub-criteria.
-
The qualitative dimension relates to non-quantifiable, qualitative data about sub-criteria and might be based on people's observation and analysis, like the nature of the issue (including type, property, characteristics, etc.), the importance level, and the degree that needs to be surveyed by experts or operators, such as the indicator types of vehicles accepted mentioned above.
The indicators created based on these four dimensions can be called pre-set indicators (Fig. 6, part A) because they are not usable without reference definitions. Therefore, once possible indicators have been pre-set, reference definitions for these indicators should be established (Fig. 6, part B). Since indicator references are pertinent to the object in particular studies, they should rely on the documents, laws, regulations, policies, guidelines, plans, and other information sources provided by relevant institutions or stakeholders. Finding references sometimes requires considering sources that are not publicly available. The indicators with reference definitions can be called determined indicators (Fig. 6, part B). However, they are only possibly used for CI resilience assessment, as their data resources have not been verified. The setting of possible indicators is shown in Fig. 6. To ensure the use of determined indicators, verification of the available data is required.
3.3 Verification of available data
As presented in the Introduction, indicator values are obtained from reliable data. Data could be considered as “discrete facts, raw elements, or the results of observations, acquisitions, or measurements carried out by a natural or artificial instrument” (Yang et al., 2023a). Data collection is one of the most important parts of constructing indicators. Even though data are objective and do not have to function to evaluate or assess an object, the difficulties of data collection, lack of unity on definitions, and deficiency of data impact indicator values (Balaei et al., 2018). Prabhu et al. (1999) believe that the difficulty and cost-effectiveness of data should be taken into account in the evaluation of the indicator's confidence.
In general, CI stakeholders should not immediately create a new database or a new type of information for one assessment. It is therefore particularly important to collect data for indicators from available resources. If the set of indicators is based on data types that are widely recognised by national institutions, more relevant resources can be collected. For example, submersion levels are frequently used in France for flood risk assessment. The submersion levels are measured by the Ministry of Ecological Transition of France to provide concrete, visual, and precise information on flooding risks. Many institutions engaged in data collection create or optimise the data about submersion height. In considering data availability, submersion height can be set as an indicator for assessing the physical damage to CI during flooding.
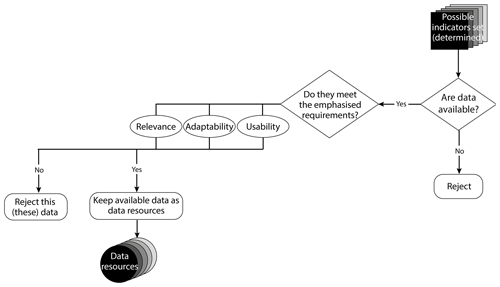
Indicators can be assessed using historical data or modelling data. Each country has national databases for different areas and various documents for diverse kinds of infrastructure and hazards, which are potential resources for indicator assessments. Traditional data types are numerical, text, graph, web, and image (Han et al., 2022). The current tendency is big data, which can be categorised by the collection technique, such as “satellite imagery, aerial imagery and videos, wireless sensor web network, lidar, simulation data, spatial data, crowdsourcing, social media, mobile GPS, and call records” (Sarker et al., 2020). The indicators without available data should be rejected (Fig. 7). For the indicators with available data, three points are emphasised for analysis of available data (Fig. 7):
-
Relevance. The data must be relevant to set indicators and criteria. For example, in studying flood hazards, flood-related institutions, websites, or documents should be the focus of data collection.
-
Adaptability. The studied scenarios are related to specific hazards and types of CI, and the information obtained should be adapted to them.
-
Usability. Managers should confirm their authority to use the acquired data before use. The duration of data availability should be also verified to ensure continuous assessment.
Although modern data are diverse, databases and information technology have systematically evolved from primitive file processing to complex and powerful database systems since the 1960s. Therefore, if the research involves databases with huge amounts of data, the data mining techniques proposed by Han et al. (2022) are suggested to collect valuable data.
3.4 Result of part 1: step-by-step guide
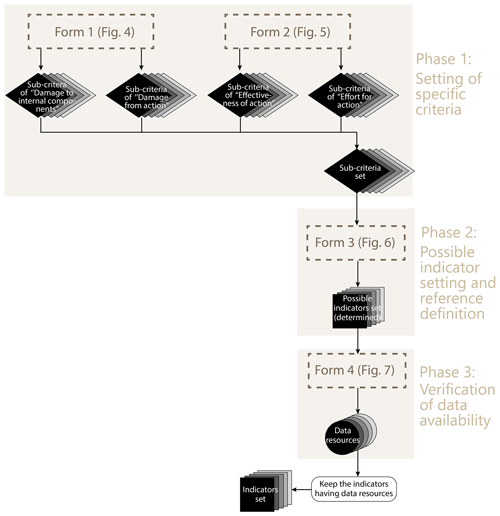
A step-by-step guide for building an indicator system for CI resilience assessment is developed in this section. This guide has three phases: (1) setting specific criteria, (2) setting possible indicators and definition of references, and (3) verification of available data. This guide combines all illustrated forms (1, 2, 3, and 4) and is summarised in Fig. 8. The process of indicator setting incorporating reference definitions (Fig. 8, phase 2) is based on setting sub-criteria (Fig. 8, phase 1). The final indicators set are determined after the verification of available data (Fig. 8, phase 3), as indicator assessment needs reliable data. All steps require the mutual collaboration of relevant stakeholders or decision-makers since collaborative approaches ensure the shared diagnosis and the efficiency of implementing measures (Hollnagel et al., 2011). C & I setting relies on managers' knowledge of the target CI and necessitates investigation of references and appropriate data. It can be argued that the construction of an indicator system depends on the local humans (managers) and material resources (documents, data, etc.) related to the infrastructure studied. Indicator systems should be understood as a framework for transforming local resources into practical assessments, which contribute to CI management. The next section will illustrate how to use the guide developed in this paper to build an indicator system for an example case.
To demonstrate how to build an indicator system through the guide developed here, this study targets a specific circumstance, in which the Nantes Ring Road (NRR) was affected by urban flooding. In the practical risk management process, considering different experts' opinions is necessary because of their professional knowledge (Merad, 2010). Therefore, during the whole case study process, the research team makes collective decisions based on the content of their meeting discussions. The research team includes university scientists and researchers from Cerema (Centre d'études et d'expertise sur les risques, l'environnement, la mobilité et l'aménagement) and the practicing managers from DIRO (Direction interdépartementale des routes Ouest).
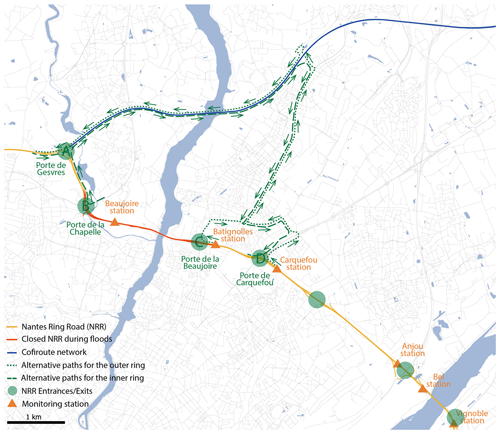
With a length of 42 km, the NRR has services extending beyond the local level and is attractive in the region and even in the nation. However, the section (Fig. 9, red lines) between Porte de la Chapelle (Fig. 9, point B) and Porte de la Beaujoire (Fig. 9, point C) is frequently closed due to flooding of the Gesvres River. This study takes the flood event in February 2020 as an example, during which this section of the NRR was closed on both sides for 56 h (Cerema, 2023). During the closure of this section, local road management agency DIRO suggested alternative roads (Fig. 9, green lines). These alternative roads contain a part of another highway: the Cofiroute network (Fig. 9, blue line). The data from six stations – Bonjoire, Bastignolles, Carquefou, Anjou, Bel, and Vignoble (Fig. 9, orange triangles) – provide important information on the traffic in the sections that connect the frequently flooded section (Fig. 9, red lines) of the Nantes Ring Road. These stations monitor the traffic flows every 6 min on the NRR.
4.1 Setting criteria
Studied scenarios should be defined before setting criteria. The first studied scenario refers to the NRR affected by flooding, for which DIRO suggests alternative roads when affected sections are closed (Fig. 10, initial scenario). The suggestion of alternative roads is thus the implementable action for the first scenario. Studying the side effects of the implemented action requires the identification of possible scenarios, in which the action implemented affects the NRR or its environment. In this example, since part of the Cofiroute network (Fig. 9, blue lines) is alternative roads, the Cofiroute network can be treated as an external system affected by the implementable action. The increase in traffic in the Cofiroute network due to the closure of the NRR could have negative impacts, such as congestion or noise pollution (Cerema, 2023). The Cofiroute network is an affected system in a continuous scenario (Fig. 10, first continuous scenario). Moreover, the alternative pathways, which are longer than the initial pathways, produce more air pollution. The air environment in Nantes can be treated as another external system affected by the implementable action. Then, the air environment in Nantes is also an affected system in another continuous scenario (Fig. 10, second continuous scenario).
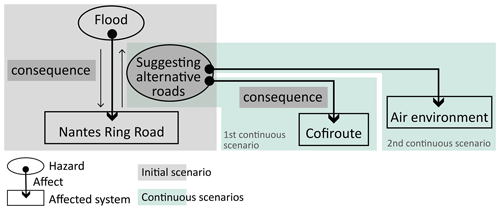
Figure 10Initial and continuous scenarios for the current example, adjusted from Yang et al. (2023b).
According to Form 1 (Sect. 3.1.1, Fig. 4) and Form 2 (Sect. 3.1.2, Fig. 5), identifying the main functions of target CI, as well as the function of all its components, is indispensable. This example, therefore, summarises all significant functions in Table 1 based on two existing studies (Yang et al., 2022, 2023b) that investigated the resilience of the NRR.
Table 1The main functions of the NRR and the function of all its components from Yang et al. (2022).
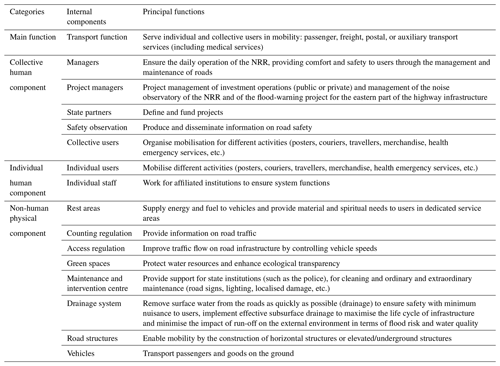
4.1.1 Initial scenario
Based on Form 1 (Fig. 4), three sub-criteria are set for the damage to internal components criterion: damage to transport functions (of the NRR network), physical damage to individual users, and physical damage to road structures. Then, for the criteria relating to the implementable action (Form 2, Fig. 5), the desirable outcome and costs of the selected implementable action need to be defined. The ideal outcome of the action implemented would the increased transport function on the alternative routes. Thus, one sub-criterion is set for the effectiveness of action criterion based on Form 2: increased transport function to alternative roads. The implementable action relies directly on two human components: the managers who plan it and the individual users who use it. The material, economic, human, or time resource costs refer therefore to the costs for managers and individual users. However, according to the research team, no significant costs are incurred for this implementable action. Thus, one sub-criterion could be set for the effort for action criterion based on Form 2: time costs for individual users.
4.1.2 Continuous scenarios
According to Form 1 (Fig. 4) for the first continuous scenario (Fig. 10, first continuous scenario), the damage to the transport function of the Cofiroute network can be considered significant damage from the implemented action because the increased traffic flow in the Cofiroute network brings congestion. Then, Form 1 (Fig. 4) cannot be used for setting damage-related criteria in the second continuous scenario (Fig. 10, second continuous scenario), as the air environment in Nantes is not considered infrastructure. Damage to the air environment in Nantes refers in particular to the additional air pollution caused by the increased travel distances via alternative roads. As a result, two sub-criteria are set for the damage from action criterion: functional damage to transport functions (of the Cofiroute network) and air pollution.
All sub-criteria for the three defined scenarios (Fig. 10) are listed in Table 2.
4.2 Possible indicator setting
In this example, a few indicators can be found in the available resources for the defined sub-criteria (Table 2). Thus, the steps given in Form 3 (Fig. 6) are applied to create indicators and define indicator references. Before reference definition, 17 possible indicators in 4 suggested dimensions (temporal, spatial, quantitative, and qualitative) were pre-set (Table 3).
Table 3Possible indicators pre-set through part A, possible indicator pre-setting, in Form 3 (Fig. 6), resulting from the consensus of stakeholders and managers.
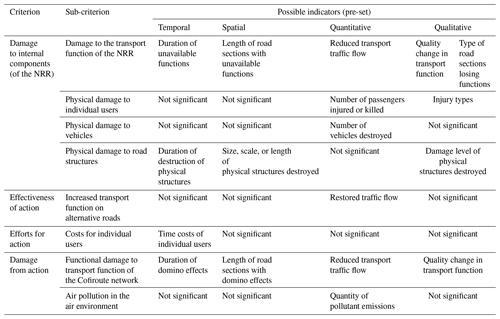
Then, after reviewing a large number of documents published by institutions related to flood management and road infrastructure (Appendix A), 5 of the 17 indicators mentioned in Table 3 are rejected because their references could not be defined. The descriptions, references, and resources of the remaining 12 indicators are listed in Tables 4–7.
Table 4Possible indicators determined through part B, possible indicator determination, in Form 3 (Fig. 6) for the damage to internal components criterion, resulting from the consensus of stakeholders and managers.
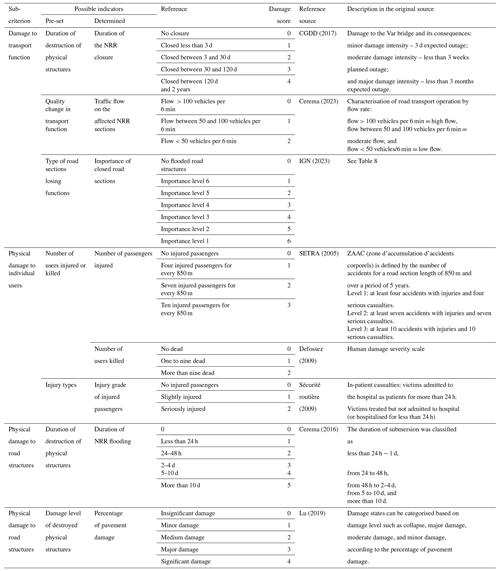
Table 5Possible indicators determined through part B, possible indicator determination, in Form 3 (Fig. 6) for the effectiveness of action criterion, resulting from the consensus of stakeholders and managers.

* This indicator is intended to show the traffic being restored by alternative routes versus the total affected traffic flow. Its reference is defined by the stakeholders and managers involved in the study because it strongly depends on local conditions.
Table 6Possible indicators determined through part B, possible indicator determination, in Form 3 (Fig. 6) for the effort for action criterion, resulting from the consensus of stakeholders and managers.

Table 7Possible indicators determined through part B, possible indicator determination, in Form 3 (Fig. 6) for the damage from action criterion, resulting from the consensus of stakeholders and managers.
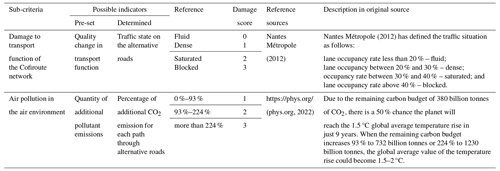
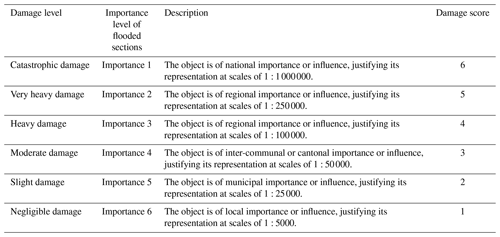
Reference definition should be based on available resources. However, some references need to be modified and adjusted before their deployment. For example, for the qualitative indicator importance of flooded section (in Table 4), its reference can be defined based on the importance levels of roads defined by the Institut national de l'information géographique et forestière (IGN). The level of damage caused by flooding increases with the importance of the road (Table 8).
Table 8Damage reference for the importance of closed road sections indicator, defined based on road importance level, adjusted by IGN (2023).
In this example, the difference between the two indicators, duration of the NRR closure because of submersion and traffic state on the alternative roads, needs to be further explained. They are both used to describe damage to transport functions. The duration of the NRR closure because of submersion indicator is for the NRR function, as it relates to closed road sections on the NRR. Meanwhile, the traffic state on the alternative roads indicator relates to alternative roads, which certainly have a change in traffic state due to increased traffic flow. This shows that the definition of indicators must be contextualised.
4.3 Available data analysis
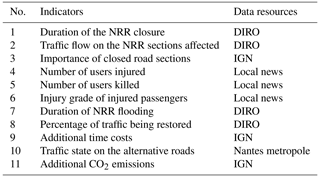
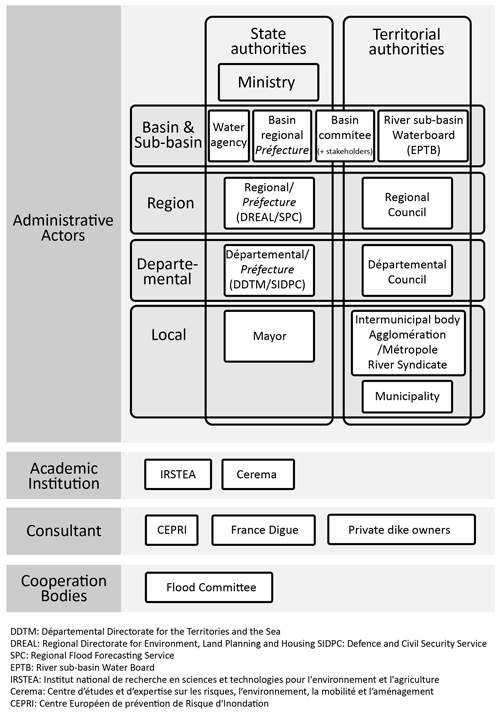
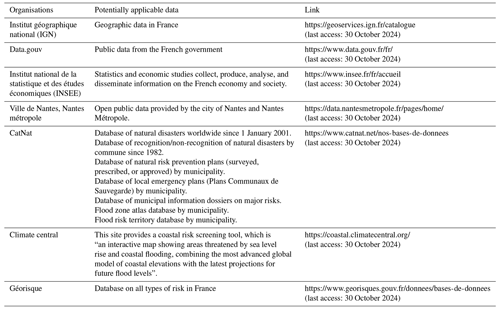
The example relates to flood hazards and road infrastructure. In France, relevant institutions are presented in Appendix A, while the potential data resources can be found on the open data websites shown in Appendix B. Moreover, the partner DIRO provides a large amount of data on traffic flow in the NRR network. The indicator percentage of pavement damage is rejected due to a lack of data. All usable indicators and their available data resources are verified through Form 4 (Fig. 7) and listed in Table 9. The main data sources refer to the following.
-
The traffic flow per 6 min is monitored by 18 vehicle detectors in 4 stations on the NRR, collected by DIRO: four vehicle detectors in four stations (Beaujoire, Batignolles, Carquefou, and Vignoble) for the inner and outer rings, whereas the Anjou station has only two vehicle detectors for the inner ring. Collected data are relevant to two periods: (1) the first is from 14 to 20 January 2019 and is considered a normal situation and (2) the second is from 31 January to 7 February 2020 and is considered a flooding situation. We collected 62 676 data points related to traffic flow.
-
2D and 3D modelling of the territory and its infrastructure throughout France (called BD TOPO) from IGN in the department of Loire-Atlantique. This modeling includes a 3D vector description of 15 kinds of road infrastructure.
-
Documents from relevant local institutions are included, such as DIRO, Cerema, and Nantes Métropole.
4.4 Result of part 2: an indicator system for the example case studied
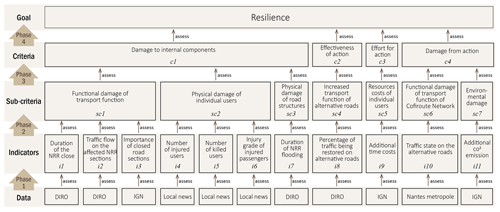
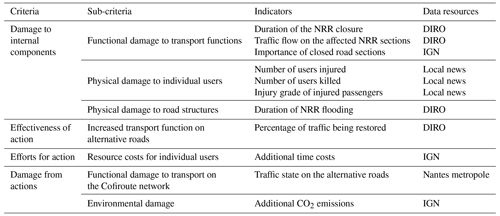
As shown in Fig. 2, an indicator system contains criteria, indicators, and data. After criteria and indicator setting and data selection, the indicator system for the studied CI, the Nantes Ring Road network, is built as shown in Table 10 and Fig. 11. The sub-criteria in this indicator system are set based on four general criteria. The indicators in this system are set in terms of sub-criteria and the availability of data resources.
Table 10Criteria, sub-criteria, indicators, and data resources for the example studied here, created by authors.
5.1 A practical guide for building indicator systems
The developed guide requires a multi-criteria analysis, setting numerous indicators, and an investigation of available data. The indicator systems built may be considered complex with many contents, and they may increase the application complexity of indicator systems to a certain extent. Nevertheless, there is no doubt that CI resilience is a complex object but not a complicated one. A complicated object, i.e. one with a certain amount of disorder, can be simplified, whereas a complex object should not be simplified. “Complexity varies according to a number of parameters, including the multiple uses to which it is put, the number of participants involved, its geographical dispersion, and the spatial and temporal scales considered” (Barroca and Bethelot, 2016). Since CI resilience is a complex object, complex indicator systems seem inevitable for CI resilience assessment. The more complex an indicator system, the more it requires detailed knowledge of real cases in diverse dimensions (geographical, socio-economic, environmental, technical, etc.). At the same time, the need to increase the autonomy of local managers rises, which the guide developed in this study provides.
Consideration of the conditions of real cases may be one key to advancing CI resilience applications. This consideration brings the uniqueness of each case that could be realised by the specificity of sub-criteria and indicators. Rather than predefining sub-criteria or indicators for all potential resilience scenarios of CI resilience, the guide for building indicator systems developed in this study enables CI stakeholders to set specific sub-criteria and indicators based on concrete situations. This guide is a flexible tool, adapting itself to different case studies and different kinds of CI. The guide developed here provides a wide margin of autonomy for CI managers or stakeholders who need support and guidance to build indicator systems. This autonomy also brings the possibility of continuously updating or optimising the building of indicator systems. Changes in the external environment may lead to changes in the setting and weighting of criteria and indicators. For example, the sub-criterion of environmental damage and the indicator of additional CO2 emission have become important in recent years because of the development of environmental concerns. In addition, the criteria and indicators related to implementable actions are another key for advancing the application of CI resilience assessment. Even though many existing theories or models for CI resilience assessment are valuable, the discussion about the effects of implementable actions is not sufficient in current studies. The authors of the present study insists that to advance CI resilience applications, it is necessary to consider the cost effectiveness and side effects of implementable actions.
Meanwhile, the autonomy of this guide can also be interpreted as a weakness. Managers' experience or knowledge may be so limited that they overlook invisible factors. From a holistic perspective, a collaborative exchange between different stakeholders can reduce this shortcoming. The examples in this study demonstrate exactly the kind of cooperation needed between local operators, university scientists, and local researchers. A significant investment in human resources at the same time may reduce the costs relative to the benefits of collaborative management. Research in the field of management is therefore needed for better use of indicator systems built.
In addition, a guide that promotes the practical use of resilience indicators can further contribute to the application of CI resilience. The current studies of CI resilience aim to develop more-effective and sustainable infrastructure management strategies for CI through the concept of resilience. In other words, one of the desired developments in resilience research is to put resilience-based theories, tools, and models into practice. Thus, CI resilience studies need to consider the application of the concept of resilience in practical risk management. According to Cambridge Dictionary, an application is “a way in which something can be used for a particular purpose”. A practical application of CI resilience is therefore a way in which CI resilience can be used for real risk management. Although CI resilience has gained considerable attention in the research literature during the last decade, relatively few resilience studies with application to real-life infrastructure have been conducted (Hosseini et al., 2016; Meerow et al., 2016; Hernantes et al., 2019; Heinzlef et al., 2022; Esmalian et al., 2022; de Magalhães et al., 2022; Rød, 2020; Rød et al., 2020). The obstacles to applying CI resilience concern two major limitations: (1) the absence of applied tools and (2) the lack of an organisational aspect (Heinzlef et al., 2022; Yang et al., 2023b). The guide developed in the present study is a practical tool that can be applied in concrete scenarios, as demonstrated by the example case presented here. The fact that the setting of criteria is based on organisational perspectives has also been emphasised. This guide can contribute to transforming the concept of resilience into an object of practical value, in the broader sense of use.
5.2 Assessment demonstration
Furthermore, this study aims to discuss the possibility of assessing CI resilience using the indicator system built in Sect. 4 (Fig. 11). As presented in the introduction, resilience can be assessed based on indicators, and indicators can be assessed based on reliable data. The resilience assessment process based on this indicator system for the scenarios (Fig. 10) focusing on the Nantes Ring Road includes four potential phases (Fig. 12):
-
indicator assessment based on collected data,
-
assessment at the level of sub-criteria based on indicators,
-
assessment at the level of criteria based on the level of sub-criteria, and
-
resilience assessment based on the level of criteria.
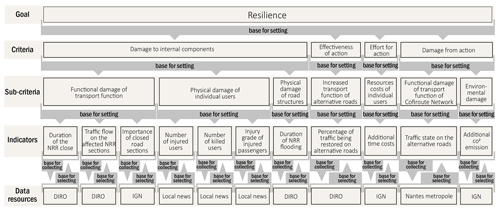
Figure 12Assessment process of Nantes Ring Road resilience based on the indicator systems developed in current study, created by the authors.
In addition, this necessitates the determination of assessment methods and weighting methods. As numerous methods are deployable, this example shows only some that are considered applicable and suitable for the indicator system built here.
5.2.1 Criterion and indicator weighting
This guide, which involves a multi-criteria framework (Yang et al., 2023b), can be associated with the multi-criteria decision making (MCDM) approach. According to Kumar et al. (2017), MCDM is “a branch of operational research dealing with finding optimal results in complex scenarios including various indicators, conflicting objectives and criteria”. Since MCDM requires the consideration of various perspectives, weighing methods are regarded as an important aspect of the MCDM methods step. The results of the multi-criteria decision-making method largely depend on such weights (Yusop et al., 2015). Weighting values accurately determines the relative importance of each factor that is significant to assessments (Singh and Pant, 2021). Even though most MCDM studies highlight the weighting of criteria, this study will apply the weighting to all criteria and indicators. The weighting process in the MCDM approach is the most difficult task (Tervonen et al., 2009), even though weighting methods have become popular in recent years. A significant scientific system has therefore been developed, and there are many available methods presented in a large number of studies. The relevant review articles are listed here, and this study will not go into detail: Roszkowska (2013), Johnsen and Løkke (2013), Iwaro et al. (2014), Yusop et al. (2015), and Singh and Pant (2021).
Weighting methods can be simply divided into two categories: subjective weighting methods and objective weighting methods. The former involves weights being derived from the decision maker's judgement, while the latter prioritises weights that are obtained from mathematical algorithms or models (Yusop et al., 2015). Subjective weighting methods are more suitable for the present example, which encourages CI managers to build indicator systems according to specific requirements and judgements based on particular situations. Moreover, the present study selects the weighting methods that do not require additional software and that do not require excessive simulation or mathematical skills, i.e. which are difficult for managers to apply in practice. The existing methods are numerous, and it is difficult to show all of them. This section will use different methods to assess levels of criteria and indicators for presenting some of the existing methods. All methods mentioned in the following are based on the study of Yusop et al. (2015).
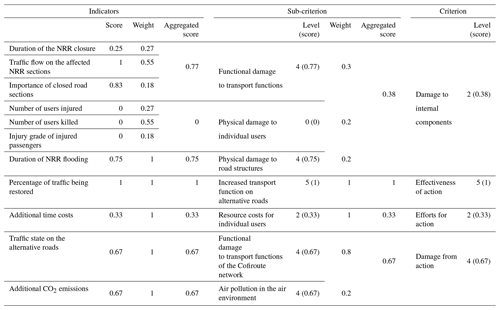
For the sub-criteria with only one indicator (indicators 7, 8, 9, 10, and 11), indicator weighting is not necessary. For the remaining sub-criteria, several weighting methods widely used for a small number of elements are suggested, as there are no more than three indicators for each sub-criterion in the example. Firstly, ranking methods such as rank sum and rank reciprocal are the simplest approaches for assigning weights. Generally, before calculating weights, the criteria are ranked in order from most important to least important. “In rank sum, the rank position rj is weighted and then normalised by the sum of all weights. Rank reciprocal weights are derived from the normalised reciprocals of a criterion rank. The rank exponent method requires the decision maker to specify the weight of the most important element on a 0–1 scale. The value is then used in a numerical formula” (Yusop et al., 2015). The results of indicator weighting are shown in Table 11.
Ranking methods are only ideal for weighting more than two elements. Therefore, for weighting of criteria and sub-criteria, another easy weighting method, called the point allocation method, is used.
In the point allocation weighting method, the decision maker allocates numbers to describe directly the weights of each criterion. The decision maker is asked, for example, to divide 100 points among the criteria. In many experiments, the analysts do not fix the total number of points to be divided but the subjects are asked to give any numbers they like to reflect the weights. The more points a criterion receives, the greater its relative importance. The total of all criterion weights must sum to 100 (Yusop et al., 2015).
Similarly, for the criteria with only one sub-criterion, weighting is not necessary. The results of sub-criterion weighting are shown in Table 12.
For criterion weighting, this study suggests the direct rating method. This method requires a score, like the numbers 1–5, 1–7, or 1–10 used by the decision maker to represent the importance of each indicator. Yusop et al. (2015) argued:
The rating method does not constrain the decision maker's responses as the fixed point scoring method does. It is possible to alter the importance of one criterion without adjusting the weight of another. This represents an important difference between the two approaches.
Thus, the results of criterion weighting are shown in Table 13.
5.2.2 Assessment methods and results
Resilience assessment, criterion level assessment, and indicator assessment could all be quantitative, qualitative, and semi-quantitative (Hosseini et al, 2016; Mebarki, 2017; Yang et al., 2023a). According to Yang et al. (2023a): “quantitative approaches offer domain agnostic measures to quantify value across applications and structural-based modelling approaches that model domain specific representations; semi-quantitative approaches provide a general numerical description of the classification, without detailed formulae or models; qualitative approaches refer to approaches without a numerical descriptor and based on people's judgements and analysis, like those of experts or operators surveyed”.
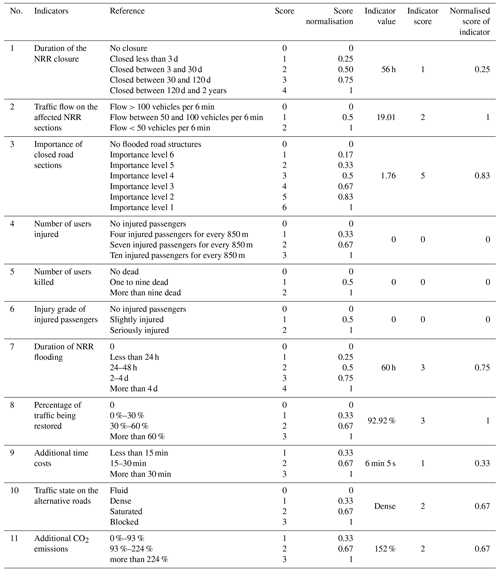
In this study, the hierarchical references of set indicators make indicator assessment a semi-quantitative approach (Fig. 12, phase 1). Based on the data collected, all indicators were assessed. The values and levels of all indicators for the defined scenario are assessed in Appendix C. The result of the indicator assessment is shown in Table 14.
Then, to make judgements, the levels of each criterion (and sub-criterion) were designed to show the extent of damage, cost, and recovery. Thus, for phases 3 (indicator to sub-criterion) and 2 (sub-criterion to criterion) in Fig. 12, the aggregated score of the indicators should correspond to one level of criteria or sub-criteria. For ease of understanding, this study simply divides the criteria into five levels: 1 (0–2), 2 (2–4), 3 (4–6), 4 (6–8), and 5 (8–10). Moreover, simple overlay operations with weights can be considered because the sub-criteria and indicators derived from one criterion are part of the field of this criterion (Table 15).
Next, the resilience of the CI studied (Nantes Ring Road) was assessed (Fig. 12, phase 4). Among existing methods, this study highlights a quantitative assessment or method probabilistic framework created by Mebarki et al. (2012) as an example. This method, originally created for assessing seismic vulnerability, builds mathematical models by analysing the probability of events occurring.
Furthermore, the unified theoretical approach for resilience developed by Mebarki (2017) allows an engineering analysis of the resilience of any system.
-
We consider the prior definition of the system, its components and sub-systems, and the expected utility functions or services that the system should deliver. These functions or services can be described as a vector (in the case of multiple expected functions) or a scalar value (in the case of a unique function or service or a weighted combination of the whole expected utility function). The utility function herein is denoted R(t) as it depends on time.
-
We consider the evaluation of the utility function loss, which is denoted DR, with values ranging within the interval [0 … 1], i.e. no damage up to full damage, respectively.
-
We consider the capacity of the system to recover during the post-damage phase, where the recovering function is denoted Φa, which depends on the dynamics of the system. Actually, the system can either recover, become worse, or remain at a residual level with no more variation. This recovery function should be modelled by the physical behaviour or response of the system after some actions are provided.
-
This recovery capacity (or worsening function) is also affected by the prior existence of available resources at the internal level (within the system) or at the external level (through interaction from outside the system). As it is a conditional aspect, it is described by a probabilistic parameter denoted χr that is described as the combination of external or internal resources, i.e. split up into two parts and .
-
We consider the capacity to manage the post-damage phase, which is described by a probabilistic parameter denoted χm,c.
In the present paper, the authors consider the post-damage phase and describe the effects of the adaptive options, which therefore influence the recovery function Φa.
These adaptive options are discussed in the present paper under various aspects:
-
the efficiency of these actions in terms of the recovery function;
-
the availability of the resources in order to set up these actions;
-
the secondary effects of these actions and their consequences for damage amplification, as well as the cost for their setup and the expected cost of their secondary and side effects; and
-
the satisfaction of the stakeholders that are concerned with the system and its expected utility functions.
The formula details are presented in Appendix D.
5.3 Limitations
The assessment framework applied to the method presented in this study aims precisely at assessing the resilience of the CI associated with defined scenarios (Fig. 10). This approach, based on a scenario and considering both consequences and implementable actions, allows the study of CI facing a hazard with a global perspective. The objects of the present example, both the hazards and infrastructure, remain unchanged. The values of resilience, criterion levels, and indicators change if alternative roads suggested change. Thus, the scenarios with different alternative roads can be compared to find the better one. However, under other implementable actions, for example creating dams, the sub-criteria and indicators relating to action should be modified. The problem then arises that the values of resilience and general criteria assessed by different indicators and sub-criteria cannot be compared. The values of resilience and the four criteria suggested in this study then become meaningless.
On the other hand, in practice, the value of resilience and general criteria, while important, is not the only significant part of the decision-making process because resilience and general criteria are too abstract and do not contain concrete information. Only with sub-criteria and indicators in place are CI managers able to understand the contents of each scenario in its entirety. We can imagine now that two implementable actions are available, creating dams (A) and suggesting alternative roads (B). Option A has much-higher resilience value than B since in the scenario where A is implemented, there is no significant damage to internal components. And the effectiveness of action is high even though the effort for actions and damage from action are both high. Based on this information, the choice of A is highly probable. However, a further analysis of the sub-criteria and indicator values shows that the resource costs of action A are much higher than the city of Nantes can sustain. Action B becomes therefore more implementable. The set of specific sub-criteria and indicators can play a key role in practice management.
Another limitation of this guide refers to the suggested method for data collection. As it is based on existing available resources, for instance in the present example, many pre-set indicators are rejected due to a lack of appreciable references or local data. Road infrastructure requires the management of a large quantity of varied data (topographical, geospatial, geometric, etc.), which is often available in heterogeneous formats. Intelligent digital systems can improve data collection and integration. However, the construction and maintenance of digital data for road infrastructure in Europe are not enough due to an insufficient level of cooperation; inadequate information management; and limited investment in research, technology, and development (UNECE, 2021). Without true data, professional and particular simulation models, for example by a digital twin that could create a virtual replica of critical infrastructure, would be acceptable. A specific model targeting given scenarios may enable the production of useful data resources for practice management. However, it is quite time consuming and requires high investment and is instead less effective and cost-efficient. Potential challenges relate to effective and convenient ways of data collection. On the other hand, for data managers, data resource building could take place from possible indicators. To serve the important indicators without available data, creating useful data resources presents a key task for local data institutions for continuous assessment.
Focusing on the indicator-based assessment of critical infrastructure resilience, this study develops a step-by-step guide for building indicator systems. This guide considers both the positive and negative effects of implementable actions. Three key phases (Fig. 8) have been presented in detail for building indicator systems: setting criteria, setting indicators with reference definition, and verification of data availability. In addition, this study provides an example to demonstrate how to use this guide. This example is based on a scenario for the Nantes Ring Road (NRR) network: when the ring road is flooded and closed, the road network manager suggests alternative roads to the public. The results show that this guide enables the building of specific indicator systems tailored to real cases. Indicator systems such as the one built in this paper can furthermore assist CI managers in their decision-making process as they involve the various interests of stakeholders.
C1 Indicator assessment
C1.1 Indicator 1 – duration of the NRR closure
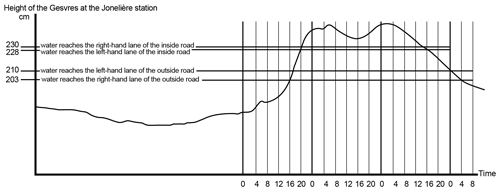
According to an internal document from Cerema (2023), in February 2020, the maximum height of the Gesvres at the Jonelière station reached 251 cm and traffic was closed with a disruption that lasted 56 h.
C1.2 Indicator 2 – traffic flow on the affected NRR sections
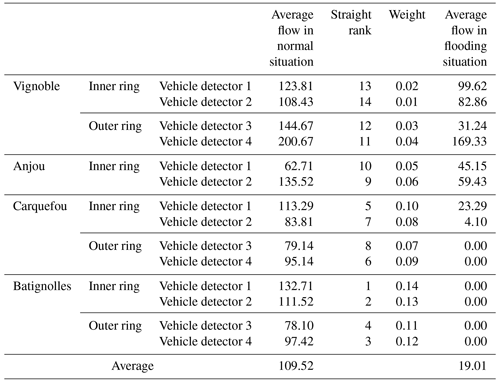
Four monitoring stations and 14 vehicle detectors are involved in the affected section: Batignolles, Carquefou, Anjou, and Vignoble. The weights of the data monitored by 14 vehicle detectors are calculated by the rank sum method and based on their distance ranking from the affected road and their average traffic flow: a vehicle detector closer to the affected section has a higher weight, and a vehicle detector related to more traffic flow has a higher weight. The selected data are related to the traffic flow between 07:00 and 09:00 local time (LT, Paris time) (2 h) on Monday 3 February 2020 (flooding situation) and Monday 14 January 2019 (normal situation). These data have been selected mainly due to the limitations of the data available and their significance. They allow us to make comparisons between flooding and normal conditions on the same day of the week. The average traffic flow of the relevant four monitoring stations is shown in Table C1.
C1.3 Indicator 3 – importance of closed road sections
According to the BDTOPO of the department of Loire-Atlantique, the closed section has 29 parts, of which 20 are categorised as importance level 1, 7 are categorised as importance level 3, and 2 are categorised as importance level 5. Consequently, the value of average importance is 1.76.
C1.4 Indicators 4, 5, and 6 – number of injured users, number of killed users, injury grade of injured passengers
According to the local document that describes the flooding event studied, no injuries, deaths, or destroyed vehicles were caused by this flood event.
C1.5 Indicator 7 – duration of NRR flooding
According to Cerema (2023), the NRR was inundated for 60 h (Fig. C1). The duration of the NRR being flooded differs from the duration of the NRR being closed. The NRR does not need to be closed if the flooding does not affect the traffic function. The duration of the NRR being flooded is about the physical damage to road infrastructure, while the duration of the NRR being closed is related to the functional damage to road infrastructure.
C1.6 Indicator 8 – percentage of traffic restored
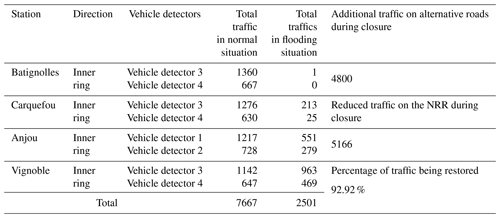
In the closed section shown in Fig. 9, according to Cerema (2023), there was an increase of 4800 passages on the alternative path that replaced the closed inner ring on Sunday 2 February 2020 between 18:00 and 19:00 LT (1 h). Therefore, the selected data relate the traffic on the NRR between 18:00 and 19:00 LT on Sunday 2 February 2020 (flooding situation) to that on Sunday 20 January 2019 (normal situation). Because of the road closure, traffic at all four monitoring stations was affected, and the traffic flow is shown in Table C2. It can be seen that the closer the road is to the affected section, the more it was affected. In total, there were 5166 fewer passengers during 1 h in the inner ring of the NRR, of which 4800 were received by the alternative path.
C1.7 Indicators 9 and 11 – additional time costs, additional CO2 emissions
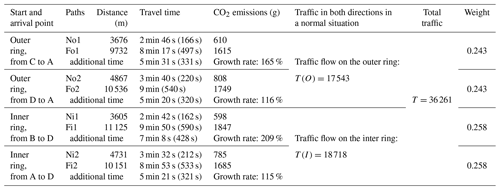
Based on the study of Yang et al. (2021), additional travel time and additional CO2 emissions for each vehicle that passes the four alternative roads are shown in Table C3. Moreover, this study adds the weight of each path based on the total traffic from the original routes on both sides in a normal situation. For example, a normal situation refers to 15 h 48 min (00:00 to 15:48 LT) on Monday 14 January 2019, which corresponds to a flooding situation, 15 h 48 min (00:00 to 15:48 LT), on Monday 2 February 2020. Thus, the weight of the outer ring (O) or inner ring (I) may be defined as Eq. (1):
T is the traffic flow in the outer or inner ring. TT is the total traffic in both directions. Consequently, the average additional travel time is 6 min 5 s, and the average growth rate of CO2 emission is 152 %.
C1.8 Indicator 10 – traffic state on the alternative roads
According to the private document from Cerema (2023), during the NRR closures, the alternative roads carried too much traffic and this caused congestion, especially during the morning and evening rush hours. Furthermore, level normalisation is necessary for the indicators with a variable number of reference levels but corresponding to the same criterion (Table 14).
D1 Resilience assessment formulae
D1.1 Stakeholders and global satisfaction
Since various adaptive options can be set up, it is important to investigate their global costs as well as their efficiency, besides measuring the satisfaction of the stakeholders. In fact, this satisfaction can be very subjective. However, there is also an objective way to quantify this satisfaction through statistics.
We propose, then, the following modelling equation (Eq. 2):
where is the event for which the stakeholders are satisfied, with probability of occurrence denoted ; Epa is the event of efficient action against the first hazard, with probability of occurrence denoted P(Epa); and Eda is the event of damaging side effects of the first action, with probability of occurrence denoted P(Eda). The complementary event is denoted , i.e. it is related to non-damaging side effects.
The probability of satisfaction can be written as Eq. (3):
with Eqs. (4) and (5) written as
Note that the limit cases for which the stakeholder has 0 or 1 as the satisfaction probability correspond to Eq. (6):
The advantage of such description thanks to probabilistic modelling is that all the parameters which are assigned metrics are objective. These metrics and the probabilities herein are obtained by either theoretical distribution modelling or inquiries.
D1.2 Global costs and decision-making
Targeting resilience supposes that, as described here above, several adaptive options at the post-disaster stage or risk reduction options and preparedness before any disaster occurs can be set up. These options suppose that resources are available, are well managed, and that their costs are acceptable.
It is then crucial to define the global costs on which the decision-making will rely. For such global costs, we propose the following equation (Eq. 7):
where C0 is the initial cost of the infrastructure from the design stage to the initial service and use; Nais the number of adaptive options in order to solve the disturbance of the service (traffic, etc.); is the cost of the adaptive option, i.e. design, staff, equipment, overheads, and daily service; is the socio-economic consequences of non-efficiency of the adaptive option (overcome the disturbance, consider the public perception, etc.); and is the indirect or direct socio-economic impact of the adaptive option secondary effects.
It is worth noting that the modelling described above concerns:
-
the effectiveness of the action as P(Epa),
-
the effort of the action as , and
-
the damage from the action as .
Therefore, the part concerning the damage to internal components is partly described through the loss of utility function. This damage, as well as the transformation of the weights and metrics presented in Tables 14 and 15, will be normalised and transformed into objective probabilities. This process is still under development and will be further detailed in an upcoming paper.
All raw data can be provided by the corresponding authors upon request.
Conceptualisation – ZY and BB. Methodology – ZY and KL. Investigation – ZY. Writing – original draft preparation – ZY and AM. Writing – review and editing – BB, AM, and KL. Visualisation – ZY. Data curation – HD and LL. Supervision – BB. All authors have collaborated, read, and agreed to the published version of the paper.
The contact author has declared that none of the authors has any competing interests.
Publisher's note: Copernicus Publications remains neutral with regard to jurisdictional claims made in the text, published maps, institutional affiliations, or any other geographical representation in this paper. While Copernicus Publications makes every effort to include appropriate place names, the final responsibility lies with the authors.
This article is part of the special issue “Natural hazards' impact on natural and built heritage and infrastructure in urban and rural zones”. It is not associated with a conference.
This paper was edited by Maria Bostenaru Dan and reviewed by two anonymous referees.
Acosta-Alba, I. and van der Werf, H. M. G.: The use of reference values in indicator-based methods for the environmental assessment of agricultural systems, Sustainability, 3, 424–442, https://doi.org/10.3390/su3020424, 2011.
Balaei, B., Wilkinson, S., Potangaroa, R., Hassani, N., and Alavi-Shoshtari, M.: Developing a Framework for Measuring Water Supply Resilience, Nat. Hazards Rev., 19, 4, https://doi.org/10.1061/(asce)nh.1527-6996.0000292, 2018.
Barroca, B. and Bethelot, S.: Génie urbain: la réinvention permanente, Diagonal, 198, 21–23, https://diagonal.hypotheses.org/files/2019/05/Diagonal_198_LowRes.pdf (last access: 30 October 2024), 2016.
Barroca, B. and Serre, D.: Behind the barriers: A resilience conceptual model, Sapiens, 6, 1–14, 2013.
Barroca, B., Bernardara, P., Mouchel, J. M., and Hubert, G.: Indicators for identification of urban flooding vulnerability, Nat. Hazards Earth Syst. Sci., 6, 553–561, https://doi.org/10.5194/nhess-6-553-2006, 2006.
Barroca, B., Clemente, M. F., and Yang, Z.: Application of “Behind the Barriers” Model at Neighbourhood Scale to Improve Water Management under Multi-Risks Scenarios: A Case Study in Lyon, France, MDPI, https://doi.org/10.3390/ijerph20032587, 2023.
BFM business: Sondage: dans les bouchons, 82 % des Français craquent au bout de 30 minutes, https://www.bfmtv.com/auto/sondage-dans-les-bouchons-82-des-francais-craquent-au-bout-de (last access: 17 January 2024), 2018.
Bialas, A.: Critical Infrastructure Protection – How to Assess the Protection Efficiency, in: Eleventh International Conference on Dependability and Complex Systems, 27 June–1 July 2016, Brunów, Poland, https://doi.org/10.1007/978-3-319-39639-2_3, 2016.
Cantelmi, R., Di Gravio, G., and Patriarca, R.: Reviewing qualitative research approaches in the context of critical infrastructure resilience, Springer US, 341–376, https://doi.org/10.1007/s10669-020-09795-8, 2021.
Cerema – Centre d'études et d'expertise sur les risques, l'environnement, la mobilité et l'aménagement: Resilience of Interconnected Infrastructures and Systems, Internal document, 2023.
Cerema – Centre d'études et d'expertise sur les risques, l'environnement, la mobilité et l'aménagement: Référentiel national de vulnérabilité aux inondations, https://www.ecologie.gouv.fr/sites/default/files/20160923_Guide_GT_Referentiel_vulnerabilite.pdf (last access: 17 January 2024), 2016.
CORDIS: Smart Resilience Indicators for Smart Critical Infrastructures Resilience indicators for SCIs based on big and open data, https://cordis.europa.eu/project/id/700621/results (last access: 17 January 2024), 2018.
Cutter, S. L.: The landscape of disaster resilience indicators in the USA, Nat. Hazards, 80, 741–758, https://doi.org/10.1007/s11069-015-1993-2, 2016.
Defossez, S. : Évaluation des mesures de gestion du risque inondation. Application au cas des basses plaines de l'Aude, PhD thesis, Université Paul Valéry-Montpellier III, 501 pp., https://theses.hal.science/tel-00542397/file/these_defossez_sans_secure.pdf (last access: 30 October 024), 2009.
de Magalhães, R. F., Danilevicz, Â. de M. F., de Souza, J. S., and Echeveste, M. E.: The risk management tools'role for urban infrastructure resilience building, Urban Clim., 46, 101296, https://doi.org/10.1016/j.uclim.2022.101296, 2022.
De Vivo, C., Ellena, M., Capozzi, V., Budillon, G., and Mercogliano, P.: Risk assessment framework for Mediterranean airports: a focus on extreme temperatures and precipitations and sea level rise, Nat. Hazards, 111, 547–566, https://doi.org/10.1007/s11069-021-05066-0, 2022.
Esmalian, A., Yuan, F., Rajput, A. A., Farahmand, H., Dong, S., Li, Q., Gao, X., Fan, C., Lee, C. C., Hsu, C. W., Patrascu, F. I., and Mostafavi, A.: Operationalizing resilience practices in transportation infrastructure planning and project development, Transp. Res. Pt. D, 104, 103214, https://doi.org/10.1016/j.trd.2022.103214, 2022.
Eurostat: Getting messages across using indicators – A handbook based on experiences from assessing Sustainable Development Indicators, https://ec.europa.eu/eurostat/web/products-manuals-and-guidelines/-/ks-gq-12-001 (last access: 17 January 2024), 2014.
Feiz, R. and Ammenberg, J.: Assessment of feedstocks for biogas production, part I – A multi-criteria approach, Resour. Conserv. Recycl., 122, 373–387, https://doi.org/10.1016/j.resconrec.2017.01.019, 2017.
Fisher, R. E., Bassett, G. W., Buehring, W. A., Collins, M. J., Dickinson, D. C., Eaton, L. K., Haffenden, R. A., Hussar, N. E., Klett, M. S., Lawlor, M. A., Millier, D. J., Petit, F. D., Peyton, S. M., Wallace, K. E., Whitfield, R. G., and Peerenboom, J. P.: Constructing a resilience index for the enhanced critical infrastructure protection program, Decision and Information Sciences, ANL – Argonne National Lab., Argonne, IL, USA, doi10.2172/991101, 2010.
Franchini, I. and Bergamaschi, E.: Biological indicators and reference values, Giornale Italiano di Medicina del Lavoro, https://europepmc.org/article/med/8682272 (last access: 30 October 2024), 1994.
Gonzva, M.: Résilience des systèmes de transport guidé en milieu urbain: approche quantitative des perturbations et stratégies de gestion, PhD thesis, https://theses.hal.science/tel-01619140 (last access: 30 October 2024), 2017.
Gonzva, M. and Barroca, B. : Improving urban infrastructures resilience using conceptual models: application of the “Behind the Barriers” model to the flooding of a rail transport system., in: 7th Resilience engineering association symposium, 26–29 June 2017, Liège, https://www.resilience-engineering-association.org/wp-content/uploads/2018/06/REA-Proceedings-Final-Version.pdf#page=69 (last access: 30 October 2024), 2017.
Han, J., Pei, J., and Tong, H.: Data mining: concepts and techniques, Morgan Kaufmann, ISBN 10.9780123814791, 2022.
Heinzlef, C., Barroca, B., Leone, M., and Serre, D.: Urban resilience operationalization issues in climate risk management: A review, Int. J. Disast. Risk Reduct., 75, 102974, https://doi.org/10.1016/j.ijdrr.2022.102974, 2022.
Hernantes, J., Maraña, P., Gimenez, R., Sarriegi, J. M., and Labaka, L.: Towards resilient cities: A maturity model for operationalizing resilience, Cities, 84, 96–103, https://doi.org/10.1016/j.cities.2018.07.010, 2019.
Hollnagel, E., Plus, R. S., and Rigaud, E.: Proceedings of the fourth Resilience Engineering Symposium, in: Proc. fourth Resil. Eng. Symp., 25–29 October 2004, Söderköping, Sweden, https://doi.org/10.4000/books.pressesmines.931, 2011.
Hosseini, S., Barker, K., and Ramirez-Marquez, J. E.: A review of definitions and measures of system resilience, Reliab. Eng. Syst. Safe., 145, 47–61, https://doi.org/10.1016/j.ress.2015.08.006, 2016.
IGN – Institut national de l'information géographique et forestière: BD TOPO, Version 3.3, descriptive de contenu, https://geoservices.ign.fr/sites/default/files/2023-10/DC_BDTOPO_3-3.pdf (last access: 21 November 2023), 2023.
Iwaro, J., Mwasha, A., Williams, R. G., and Zico, R.: An Integrated Criteria Weighting Framework for the sustainable performance assessment and design of building envelope, Renew. Sustain. Energ. Rev., 29, 417–434, https://doi.org/10.1016/j.rser.2013.08.096, 2014.
Johnsen, F. M. and Løkke, S.: Review of criteria for evaluating LCA weighting methods, Int. J. Life Cy. Assess., 18, 840–849, https://doi.org/10.1007/s11367-012-0491-y, 2013.
Koschke, L., Fürst, C., Frank, S., and Makeschin, F.: A multi-criteria approach for an integrated land-cover-based assessment of ecosystem services provision to support landscape planning, Ecol. Indic., 21, 54–66, https://doi.org/10.1016/j.ecolind.2011.12.010, 2012.
Kumar, A., Sah, B., Singh, A. R., Deng, Y., He, X., Kumar, P., and Bansal, R. C.: A review of multi criteria decision making (MCDM) towards sustainable renewable energy development, Renew. Sustain. Energ. Rev., 69, 596–609, https://doi.org/10.1016/j.rser.2016.11.191, 2017.
Lammerts Van Bueren, E. and Blom, E.: Hierarchical Framework for the Formulation of Sustainable Forest Management Standards, Pathfind., 2–94, ISBN 90-5113-031-7 1997.
Larrue, C., Bruzzone, S., Lévy, L., Gralepois, M., Schellenberger, T., Trémorin, J. B., Fournier, M., Manson, C., and Thuilier, T.: Analysing and evaluating flood risk governance in France. From state policy to local strategies, 180 pp., https://shs.hal.science/halshs-01981420/file/wp3-fr-final-webversion.pdf (last access: 30 October 2024), 2016.
Lu, D.: Pavement Flooding Risk Assessment and Management in the Changing Climate, PhD thesis, https://uwspace.uwaterloo.ca/items/45bc15bb-1514-4b28-a5a5-f51a117ea551 (last access: 30 October 2024), 2019.
Maggino, F.: Complexity in Society: From Indicators Construction to their Synthesis, 332 pp., https://content.e-bookshelf.de/media/reading/L-10132277-611ba03c14.pdf (last access: 30 October 2024), 2017.
Martin, H. and Ludek, L.: Conceptual design of the resilience evaluation system of critical infrastructure elements and networks in selected areas in Czech republic, in: 2012 IEEE Int. Conf. Technol. Homel. Secur. HST 2012, 13–15 November 2012, Waltham, MA, USA, 353–358, https://doi.org/10.1109/THS.2012.6459874, 2012.
Mebarki, A.: Resilience: Theory and metrics – A metal structure as demonstrator, Eng. Struct., 138, 425–433, https://doi.org/10.1016/j.engstruct.2017.02.026, 2017.
Mebarki, A., Valencia, N., Salagnac, J. L., and Barroca, B.: Flood hazards and masonry constructions: A probabilistic framework for damage, risk and resilience at urban scale, Nat. Hazards Earth Syst. Sci., 12, 1799–1809, https://doi.org/10.5194/nhess-12-1799-2012, 2012.
Meerow, S., Newell, J. P., and Stults, M.: Defining urban resilience: A review, Landsc. Urban Plan., 147, 38–49, https://doi.org/10.1016/j.landurbplan.2015.11.011, 2016.
Mendoza, G. A. and Prabhu, R.: Multiple criteria decision making approaches to assessing forest sustainability using criteria and indicators: A case study, Forest Ecol. Manage., 131, 107–126, https://doi.org/10.1016/S0378-1127(99)00204-2, 2000.
Merad, M. : Aide à la décision et expertise en gestion des risques, Lavoisier, 258 pp., https://www.researchgate.net/publication/230703456_Aide_a_la_decision_et_expertise_en_gestion_des_risques (last access: 30 October 2024), 2010.
Ministère de la Transition Écologique, Commissariat général au développement durable (CGDD): Indisponibilité d'une infrastructure de transport, Mesurer et réduire les coûts, p. 61, 2017.
Montaño, M. M., Arce, J. J. C., and Louman, B.: Uso de principios, criterios e indicadores para monitorear y Evaluar las acciones y efectos de políticas en el manejo de los recursos naturales, 73 pp., https://repositorio.catie.ac.cr/handle/11554/4255 (last access: 30 October 2024), 2006.
Nantes Métropole: Fluidité des axes routiers de Nantes Métropole, https://data.nantesmetropole.fr/explore/dataset/244400404_fluidite-axes-routiers-nantes-metropole/information/ (last access: 4 November 2024), 2012.
Petit, F. D. P., Bassett, G. W., Black, R., Buehring, W. A., Collins, M. J., Dickinson, D. C., Fisher, R. E., Haffenden, R. A., Huttenga, A. A., Klett, M. S., Phillips, J. A., Thomas, M., Veselka, S. N., Wallace, K. E., Whitfield, R. G., and Peerenboom, J. P.: Resilience Measurement Index: An Indicator of Critical Infrastructure Resilience, ANL – Argonne National Lab., Argonne, IL, USA, https://doi.org/10.2172/1087819, 2013.
phys.org: Global carbon emissions at record levels with no signs of shrinking, new data shows, https://phys.org/news/2022-11-global-carbon-emissions.html#google_vignette (last access: 17 January 2024), 2022.
Prabhu, R., Colfer, C. P., Venkateswarlu, P., Tan, L. C., Soekmadi, R., and Wollenberg, E.: Testing criteria and indicators for the sustainable management of forests, Final Report of Phase, https://www.cifor-icraf.org/publications/pdf_files/Books/SP-CI.pdf (last access: 30 October 2024), 1996.
Prabhu, R., Colfer, C. J. P., and Dudley, R. G.: Guidelines for developing, testing and selecting criteria and indicators for sustainable forest management: a C & I developer's reference, CIFOR, https://doi.org/10.17528/cifor/000762 1999.
Resilience Alliance: Assessing Resilience in Social – ecological Systems: Workbook for practitioners, Version 2.0, https://www.resalliance.org/files/ResilienceAssessmentV2_2.pdf (last access: 30 October 2024), 2010.
Rød, B.: Operationalising critical infrastructure resilience. From assessment to management, PhD thesis, https://munin.uit.no/bitstream/handle/10037/18964/thesis.pdf (last access: 30 October 2024), 2020.
Rød, B., Lange, D., Theocharidou, M., and Pursiainen, C.: From Risk Management to Resilience Management in Critical Infrastructure, J. Manage. Eng., 36, 1–13, https://doi.org/10.1061/(asce)me.1943-5479.0000795, 2020.
Roszkowska, E.: Rank Ordering Criteria Weighting Methods – a Comparative Overview, Optimum. Stud. Ekon., 5, 14–33, https://doi.org/10.15290/ose.2013.05.65.02, 2013.
Sarker, M. N. I., Peng, Y., Yiran, C., and Shouse, R. C.: Disaster resilience through big data: Way to environmental sustainability, Int. J. Disast. Risk Reduct., 51, 101769, https://doi.org/10.1016/j.ijdrr.2020.101769, 2020.
Scerri, A. and James, P.: Accounting for sustainability: Combining qualitative and quantitative research in developing “indicators” of sustainability, Int. J. Soc. Res. Methodol., 13, 41–53, https://doi.org/10.1080/13645570902864145, 2010.
Sécurité routière: Document général d'orientation 2008–2012, https://www.onisr.securite-routiere.gouv.fr/sites/default/files/2020-02/DGO_12_Aveyron_2008-2012.pdf (last access: 17 January 2024), 2009.
Serre, D. and Heinzlef, C.: Assessing and mapping urban resilience to floods with respect to cascading effects through critical infrastructure networks, Int. J. Disast. Risk Reduct., 30, 235–243, https://doi.org/10.1016/j.ijdrr.2018.02.018, 2018.
SETRA – Service d'Etudes Techniques des Routes et Autoroutes: Les études d'enjeux en sécurité routière – Milieu interurbain, https://dtrf.cerema.fr/pdf/pj/Dtrf/0003/Dtrf-0003808/DT3808.pdf (last access: 21 November 2023), 2005.
Shavelson, R. J., McDonnell, L. M., and Oakes, J.: What are educational indicators and indicator systems?, Pract. Assessment, Res. Eval., 2, 1990–1991, 1991.
Singh, M. and Pant, M.: A review of selected weighing methods in MCDM with a case study, Int. J. Syst. Assur. Eng. Manage., 12, 126–144, https://doi.org/10.1007/s13198-020-01033-3, 2021.
Tervonen, T., Figueira, J. R., Lahdelma, R., Dias, J. A., and Salminen, P.: A stochastic method for robustness analysis in sorting problems, Eur. J. Oper. Res., 192, 236–242, hhttps://doi.org/10.1016/j.ejor.2007.09.008, 2009.
UNECE: BUILDING Information Modelling (BIM) for road infrastructure: TEM requirements and recommendations: Trans-European North-South Motorway, https://unece.org/transport/publications/building-information-modelling-bim-road-infrastructure-tem (last access: 30 October 2024), 2021.
Upadhyaya, J. K., Biswas, N., and Tam, E. K. L.: Managing for Change: Integrating Functionality, Resiliency, and Sustainability for Stormwater Infrastructure Assessment, J. Infrastruct. Syst., 24, 3, https://doi.org/10.1061/(asce)is.1943-555x.0000420, 2018.
Van Cauwenbergh, N., Biala, K., Bielders, C., Brouckaert, V., Franchois, L., Garcia Cidad, V., Hermy, M., Mathijs, E., Muys, B., Reijnders, J., Sauvenier, X., Valckx, J., Vanclooster, M., Van der Veken, B., Wauters, E., and Peeters, A.: SAFE-A hierarchical framework for assessing the sustainability of agricultural systems, Agric. Ecosyst. Environ., 120, 229–242, https://doi.org/10.1016/j.agee.2006.09.006, 2007.
Vogel, J.: The Future Direction of Social Indicator Research Author(s): Joachim Vogel Published by: Springer Stable, 42, 103–116, https://www.jstor.org/stable/27522277 (last access: 30 October 2024), 1997.
Yang, Z., Laffréchine, K., Bony-Dandrieux, A., Dolidon, H., and Barroca, B.: Practical indicators for road infrastructure resilience to flood risks in France, case study of Nantes Ring Road network, Inin: FLOODrisk 2020 – 4th European Conference on Flood Risk Management, Budapest University of Technology and Economics, 22–24 June 2021, online, https://doi.org/10.3311/floodrisk2020.11.21, 2021.
Yang, Z., Clemente, M. F., Laffréchine, K., Heinzlef, C., Serre, D., and Barroca, B.: Resilience of Social-Infrastructural Systems: Functional Interdependencies Analysis, Sustainability, 14, 2, https://doi.org/10.3390/su14020606, 2022.
Yang, Z., Barroca, B., Weppe, A., Bony-Dandrieux, A., Laffréchine, K., Daclin, N., November, V., Omrane, K., Kamissoko, D., Benaben, Frederick, Dolidon, H., Tixier, J., and Chapurlat, V.: Indicator-based resilience assessment for critical infrastructures – A review, Safe. Sci., 160, 106049, https://doi.org/10.1016/j.ssci.2022.106049, 2023a.
Yang, Z., Barroca, B., Laffréchine, K., Weppe, A., Bony-Dandrieux, A., and Daclin, N.: A multi-criteria framework for critical infrastructure systems resilience, Int. J. Crit. Infrastruct. Prot., 42, 100616, https://doi.org/10.1016/j.ijcip.2023.100616, 2023b.
Yusop, Z. B., Ahmed, K., Shirazi, S. M., and Zardari, N. H. : Weighting methods and their effects on multi-criteria decision making model outcomes in water resources management, Springer, 173 pp., https://doi.org/10.1007/978-3-319-12586-2, 2015.
- Abstract
- Introduction
- Research method and structure
- Part 1: designing guide steps
- Part 2: example of guide usage
- Discussion
- Conclusion
- Appendix A
- Appendix B
- Appendix C
- Appendix D
- Data availability
- Author contributions
- Competing interests
- Disclaimer
- Special issue statement
- Review statement
- References


