the Creative Commons Attribution 4.0 License.
the Creative Commons Attribution 4.0 License.
 | 30 Sep 2024
Improving fire severity prediction in south-eastern Australia using vegetation-specific information
Kang He
Xinyi Shen
Cory Merow
Efthymios Nikolopoulos
Rachael V. Gallagher
Feifei Yang
Emmanouil N. Anagnostou
Wildfire is a critical ecological disturbance in terrestrial ecosystems. Australia, in particular, has experienced increasingly large and severe wildfires over the past 2 decades, while globally fire risk is expected to increase significantly due to projected increases in extreme weather and drought conditions. Therefore, understanding and predicting fire severity is critical for evaluating current and future impacts of wildfires on ecosystems. Here, we first introduce a vegetation-type-specific fire severity classification applied to satellite imagery, which is further used to predict fire severity during the fire season (November to March) using antecedent drought conditions, fire weather (i.e. wind speed, air temperature, and atmospheric humidity), and topography. Compared to fire severity maps from the fire extent and severity mapping (FESM) dataset, we find that fire severity prediction results using the vegetation-type-specific thresholds show good performance in extreme- and high-severity classification, with accuracies of 0.64 and 0.76, respectively. Based on a “leave-one-out” cross-validation experiment, we demonstrate high accuracy for both the fire severity classification and the regression using a suite of performance metrics: the determination coefficient (R2), mean absolute error (MAE), and root-mean-square error (RMSE), which are 0.89, 0.05, and 0.07, respectively. Our results also show that the fire severity prediction results using the vegetation-type-specific thresholds could better capture the spatial patterns of fire severity and have the potential to be applicable for seasonal fire severity forecasts due to the availability of seasonal forecasts of the predictor variables.
- Article
(6784 KB) - Full-text XML
- BibTeX
- EndNote


Fire is recognized as a critical disturbance in ecosystems, which shapes vegetation across several continents (Archibald et al., 2013; Gill, 1975; Giglio et al., 2010; Gómez et al., 2015). In recent decades, wildfires have affected extensive areas in forests and woodlands across the globe, including those in Australia where over 10×106 ha were burned in the 2019–2020 fire season (from November to March; Gallagher et al., 2021). These fires are considered unprecedented in contemporary Australian fire history (Nolan et al., 2020; Shine, 2020), and more severe fires are expected in the future due to the impacts of climate change on fire weather and dynamics (Hennessy et al., 2005). Changes in fire conditions are also anticipated globally (Abatzoglou et al., 2019). Therefore, predicting fire characteristics – such as severity – will be essential for evaluating the current and future impact of wildfires on ecosystems worldwide.
Fire severity, defined here as the magnitude of change in vegetation associated with fire, is routinely used to describe the impact of wildfires on vegetation, soil, and wildlife (Lentile et al., 2006; Keeley, 2009). Field-survey- and remote-sensing-based evaluations of burn severity are commonly used by fire scientists and managers. Field-survey-based evaluations involve assessing the amount of biomass consumed (Keeley, 2009) and measuring the changes in vegetation height (Wang and Glenn, 2009) or surface fuel consumption (Boby et al., 2010; Hudak et al., 2013). By contrast, remotely sensed evaluations of burn severity use satellite imagery to quantify the magnitude of vegetation changes between pre-fire and post-fire conditions in terms of the changes in surface reflectance (Holden et al., 2009; Miller et al., 2009; Soverel et al., 2010; e.g. the difference between the pre- and post-fire normalized burn ratio, dNBR, Keeley, 2009).
Statistical approaches, which incorporate factors such as topography, weather, and water availability, provide insight into possible drivers of fire severity (Morgan et al., 2014). For instance, Bradstock et al. (2010) investigated the effects of weather, fuel, and terrain on fire severity in south-eastern Australia. They found that weather was the predominant influence on fire severity, while the influence of terrain was stronger under moderate conditions. Similarly, a study by Collins et al. (2013) examined the relationships between environmental variables (i.e. fire weather, topography, and fuel age) and fire severity in south-eastern Australia and whether they can be modified by increasing mean annual precipitation. They concluded that the relationships between crown fire and weather, topography, and fuel age were largely unaltered across the precipitation gradient. Collins et al. (2019) also examined the relative effect of fire weather, drought severity, and landscape features (i.e. topography, fuel age, and vegetation type) on the occurrence of fire refugia in south-eastern Australia. They found that fire weather and drought severity were the primary drivers of the occurrence of fire refugia, moderating the effect of landscape attributes. Furthermore, Clarke et al. (2014) investigated fire severity control factors including landscape/vegetation or weather, providing evidence that even though strong weather controls, fire history, terrain, and vegetation shape the immediate effect. In addition, Bowman et al. (2021) demonstrated the overwhelming dominance of fire weather in driving complete scorch or consumption of forest canopies in natural and plantation forests in the 2019–2020 megafires.
Despite the emerging evidence that statistical modelling with multiple biophysical and environmental predictor variables can provide high-accuracy estimates of fire severity, this technique has not been widely adopted in major areas of known fire risk. One such region is the south-east coast of Australia, which is subject to annual fire seasons (from November to March; Collins et al., 2022) that vary in extent and severity, and has a high richness of endemic plant species adapted to particular fire regimes (Gallagher et al., 2021). Besides, an accurate representation of fire severity levels is important for managing and mitigating the effects of wildfires, in terms of both emergency response and long-term ecological recovery. Existing fire severity classification schemes rely on the in situ measurements of the composite burn index (CBI; Key and Benson, 2006; Lutes et al., 2006) and/or aerial photograph identification (Collins et al., 2018; Dixon et al., 2022), which are available for certain regions and for limited vegetation types under certain climate conditions (Eidenshink et al., 2007; Keeley et al., 2009; Tran et al., 2018). However, obtaining the CBI and interpreting aerial photographs are labour-intensive and time-consuming, especially over large areas, while inferring fire severity levels directly from satellite-derived dNBR can be more efficient for large-scale applications.
Understanding the current fire situation and predicting future fire severity in eastern Australia is critical for evaluating the potential for increased extinction risk due to recurrent high-severity fires (Enright et al., 2015) and is important for supporting ecologically informed fire management (Clarke et al., 2019). Therefore, the predictor variables involved in the fire severity model should be accessible for both historical events and projected future events (e.g. seasonal or climate events).
In this study, we propose a new vegetation-specific fire severity classification scheme for predicting fire severity and demonstrate its performance across the Australian state of New South Wales (NSW). Using drought conditions, vegetation type, and fire weather conditions during the fire season as input, our modelling approach applies the random forest (RF) classification method to predict the dNBR – an indicator of burn severity derived from Landsat imagery. We demonstrate model performance based on 20 years of wildfire data from NSW through a leave-1-year-out cross-validation experiment.
New South Wales (NSW) in south-eastern Australia (Fig. 1) occupies a subtropical–temperate climate region with relatively mild weather and distinctive seasons (e.g. hot summers and cold winters; Speer et al., 2009). Mean annual and extreme temperatures are highest in the north-west of the state, whereas average maximum temperatures in coastal areas range from 26 to 16 °C, while the average minimum temperature falls between 19 and 7 °C. There is a strong precipitation gradient from east to west across the state, with annual precipitation on the eastern coast ranging between 600 and 1200 mm yr−1, decreasing to generally less than 180 mm yr−1 in the north-west of the state. Vegetation across the study region is predominantly wet and dry sclerophyll forests, although this is interspersed with areas of rainforest, woodlands, and coastal heath (Keith, 2004).
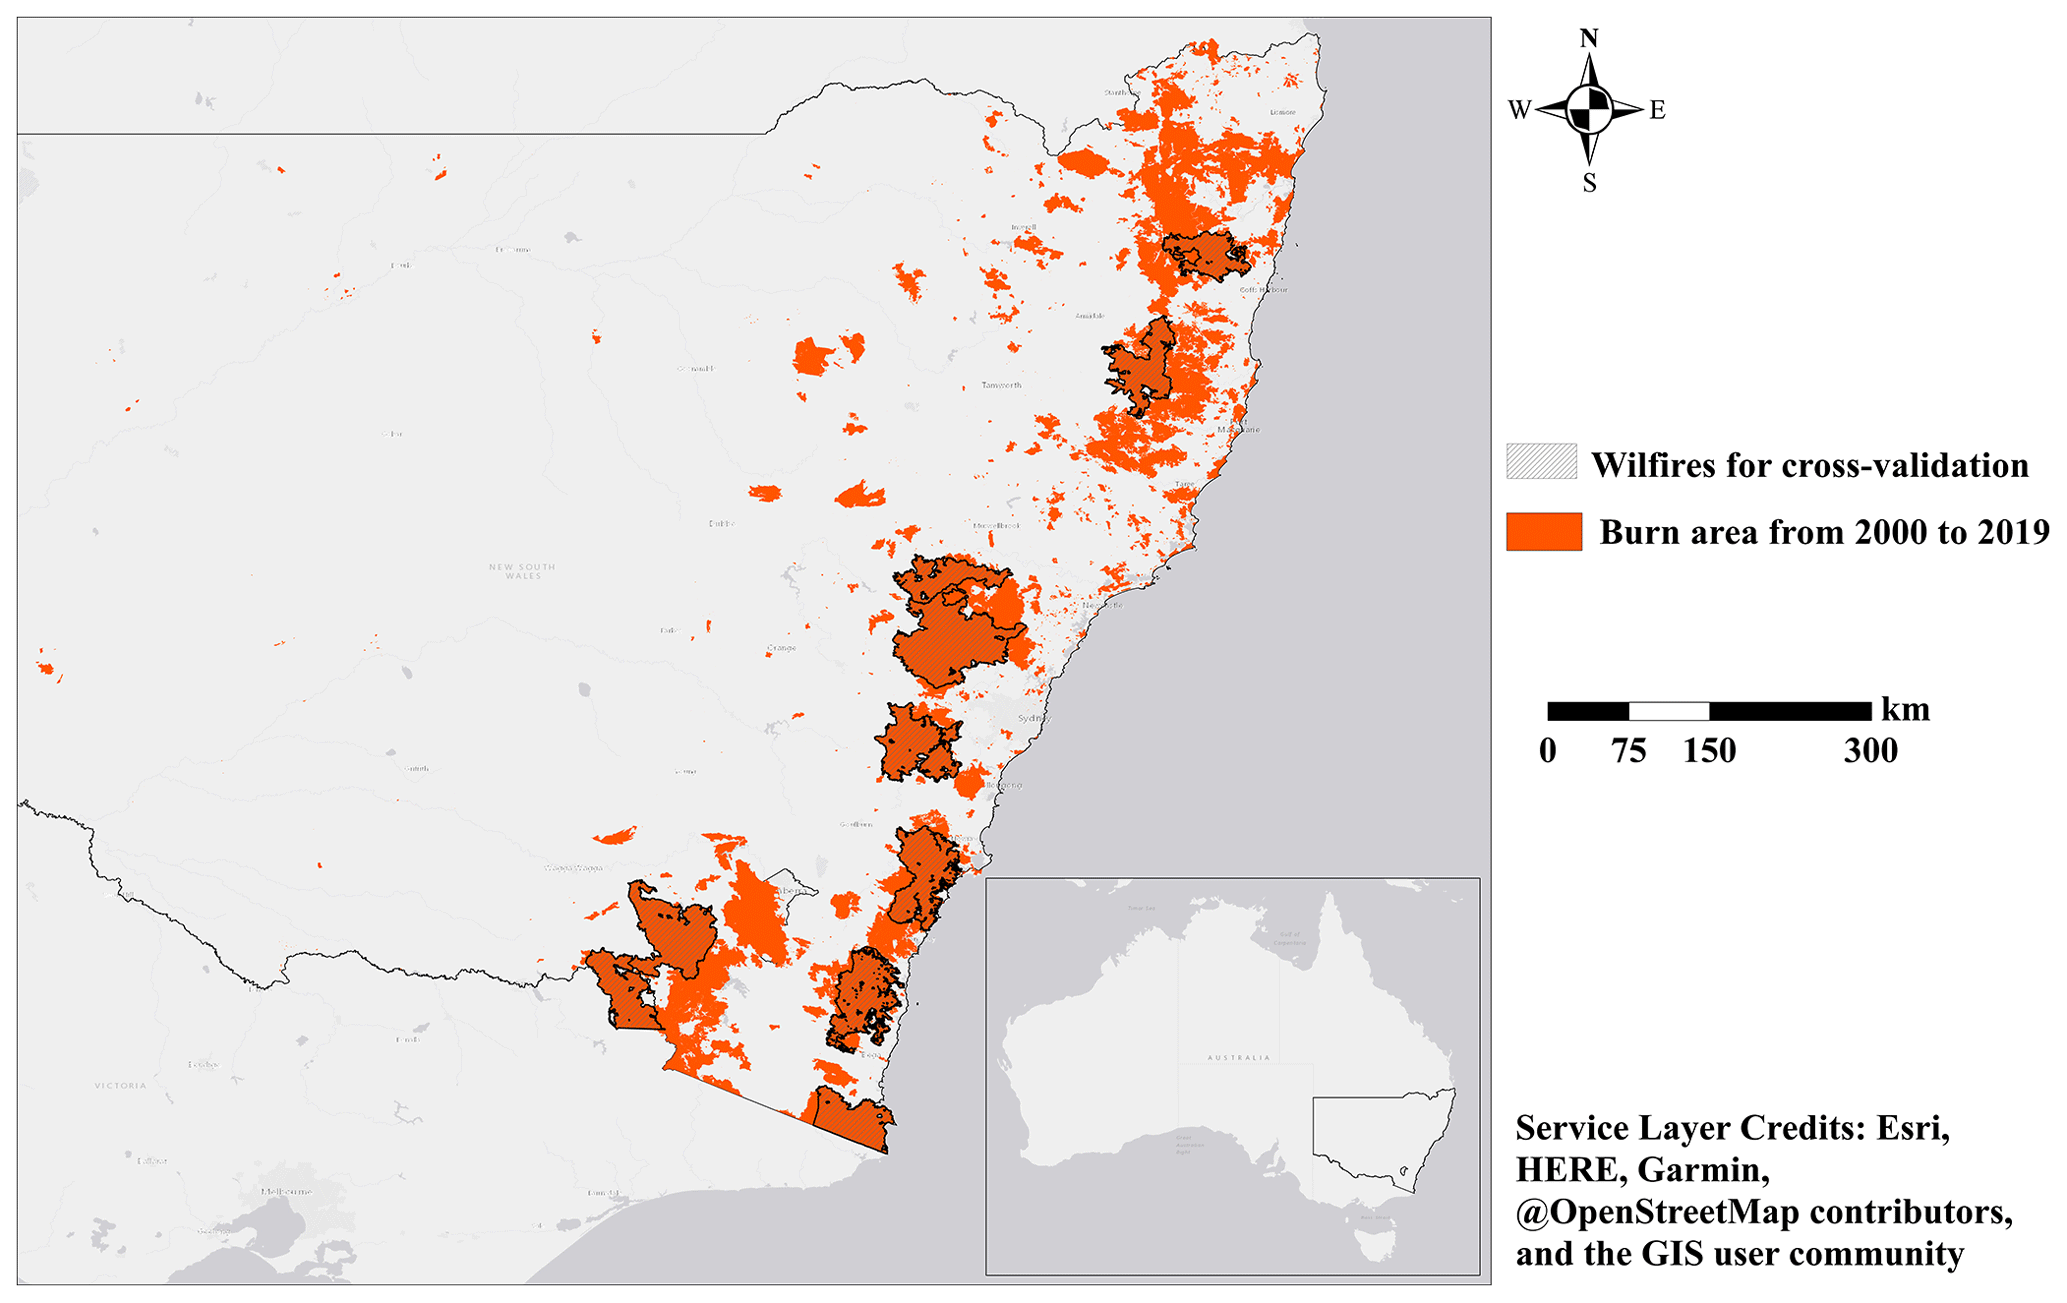
Figure 1Locations of study wildfires over New South Wales (NSW), Australia. The burnt area is from the NSW National Parks and Wildlife Service (NPWS) Fire History – Wildfires and Prescribed Burns dataset.
3.1 Model input and output
3.1.1 Fire extent
The spatial extent of annual fires between 2000 and 2019 is accessed from the NSW National Parks and Wildlife Service (NPWS) Fire History – Wildfires and Prescribed Burns dataset (https://datasets.seed.nsw.gov.au/dataset/1d05e145-80cb-4275-af9b-327a1536798d, last access: 8 June 2022), produced by the Department of Planning, Industry, and Environment. The NPWS Fire History is a spatial polygon layer, with each polygon recording the boundary, start date, end date, and burnt area. We use the NPWS polygons whose burnt areas are greater than 1 km2 as the mask to include only the fire-impacted areas. While this dataset is unlikely to be a complete record of all fire events, it represents the largest single repository of fire extent data in NSW.
3.1.2 Fire severity
As a widely used fire severity index, the dNBR is calculated by subtracting the post-fire normalized burn ratio (NBR) raster from the pre-fire NBR raster as in Eq. (1; Keeley, 2009):
The formula of NBR is similar to the normalized difference vegetation index (NDVI), except that it uses near-infrared (NIR) and shortwave infrared (SWIR) bands, as written in Eq. (2; García and Caselles, 1991; Key and Benson, 2006). NBR can be computed by the Thematic Mapper (TM) and Enhanced Thematic Mapper Plus (ETM+) sensors on using band 7 as the shortwave infrared (SWIR) and band 4 from Landsat 4-7 and band 5 from Landsat 8 as the near-infrared (NIR) reflectances. While in Sentinel-2 data, SWIR and NIR are represented by band 8 and band 12, respectively.
We calculate the dNBR within the fire boundaries from Landsat and Sentinel archive imagery, using the start date and end date to determine the pre-fire and post-fire dates. In this study, the pre-fire NBR (preNBR) is used as a proxy for the initial condition of vegetation. The calculation of a dNBR-image is described as follows: (1) determine an individual fire from the NPWS Fire History; (2) collect the most recent Landsat images based on the tags demarcating the start and end times of each individual fire; (3) apply a cloud- and snow-masking algorithm to remove snow, clouds, and their shadows from all imagery based on each sensor's pixel quality assessment band; (4) use the auxiliary satellite images (e.g. Sentinel-2) to fill in the blank pixels in the cloud-free images from step (3) to obtain the pre- and post-NBR composites; and (5) subtract pre- and post-NBR images to create a dNBR composite with the smallest-possible cloud and shadow extent. The dNBR typically ranges from −2 to +2, with high positive values indicating severe burn damage where the vegetation has been completely consumed. Values around zero suggest either unburnt areas or areas where the fire had a very low impact. Negative values can indicate an increase in vegetation, which might be due to vegetation recovery over time or errors in the analysis.
3.1.3 Vegetation
Vegetation composition and structure are expected to influence fire propagation and severity (Collins et al., 2007), and the vegetation type is also used as a proxy for vegetation structure (Hammill et al., 2006). The dominant vegetation over NSW is wet and dry sclerophyll forests (Keith, 2004). Wet sclerophyll forests can be divided into two subgroups (the shrubby sub-formation and the grassy sub-formation), which have tall canopies dominated by Eucalyptus and a monophyllous understorey (https://www.environment.nsw.gov.au/threatenedSpeciesApp/VegFormation.aspx?formationName=Wet+sclerophyll+forests+_(grassy+sub-formation), last access: 6 February 2023). Two sub-formations of dry sclerophyll forests also occur: shrub/grass and shrubby. This study focuses on burn severity for the dominant sclerophyll forests (Fig. 1). We intersect the vegetation map with NPWS polygons to identify the areas where sclerophyll forests have previously burned.
Hammill, K. A. and Bradstock, R. A.: Remote sensing of fire severity in the Blue Mountains: Influence of vegetation type and inferring fire intensity, Int. J. Wildland Fire, 15, 213–226, https://doi.org/10.1071/WF05051, 2006.
3.1.4 Topography
Prior studies report that topography strongly controls burn severity by influencing fire behaviour, fuel moisture, and water balances (Fang et al., 2018; Harris and Taylor, 2015; Holden et al., 2009). Therefore, we include three topographic measurements from the Shuttle Radar Topography Mission (SRTM, https://www.jpl.nasa.gov/missions/shuttle-radar-topography-mission-srtm, last access: 4 February 2022): digital elevation models (DEM), slope (slope), and topographic position index (TPI). TPI helps in identifying landform features such as ridges, valleys, slopes, and plateaus (Weiss, 2001). Positive TPI values indicate locations that are higher than the average of their surroundings (e.g. hilltops or ridges), while negative TPI values indicate locations that are lower than their surroundings (e.g. valleys or depressions). Values close to zero may represent flat areas or slopes.
3.1.5 Weather
In addition to fuel and terrain, weather is another important factor in wildfires. The McArthur Forest Fire Danger Index (FFDI; McArthur, 1967) is an empirical relationship comprising the short-term meteorological conditions and the long-term drought factor (Dowdy et al., 2009). The FFDI is currently used operationally by the Australian Bureau of Meteorology (BoM) to produce fire weather warnings for authorities and is defined as
where DF is the drought factor and RH, T, and V represent the relative humidity, surface air temperature, and wind velocity, respectively. In this study, we extract daily temperature, relative humidity, and wind speed data from the ERA5-Land global dataset over the burnt areas (https://cds.climate.copernicus.eu/cdsapp#!/dataset/reanalysis-era5-land?tab=form, last access: 24 February 2022).
The DF is estimated using the Keetch–Byram drought index (KBDI; Keetch and Byram, 1968). KBDI is a continuous reference scale describing the dryness of the soil and duff layers. The index increases for each day without rain and decreases when it rains. KBDI is used worldwide for drought monitoring for national weather forecasts and wildfire prevention. KBDI over burnt areas can be accessed in Takeuchi et al. (2015). The daily FFDI and KBDI values for the day prior to the start of the wildfires are used as the predictors of burn severity, owing to the strong correlation in time between extreme values of the FFDI and the start of the wildfires (Dowdy et al., 2009). Using the most potentially extreme FFDI that indicates extreme weather conditions in the period leading up to a wildfire could address the impact of weather on wildfire risk.
3.2 Method
We propose a new and alternative way to determine the optimal thresholds for fire severity classification for different vegetation types. The dNBR of all burnt pixels for each vegetation type are collected and a set of dNBR values are generated, with the quantile from 5 % to 35 % representing the threshold for low-severity classification; the quantile from 35 % to 65 % representing the threshold for moderate severity classification, and the quantile from 65 % to 95 % representing the threshold for high-severity classification. For example, a classified burn severity sample can be obtained using the thresholds for high, moderate, and low severity at the 85th quantile, 55th quantile and 25th quantile, respectively. Secondly, a fire severity prediction model is developed for each severity category based on the fire severity classification results, to provide the numeric prediction of dNBR.
3.2.1 Fire severity classification by RF
Random forest is developed as an extension of the classification and regression tree (CART) to improve the accuracy and stability of the CART model (Breiman, 2001). The steps of the RF algorithm are briefly summarized as (i) randomly generate ntree bootstrap samples from the original data. The elements not selected are referred to as out-of-bag (OOB) samples. (ii) For each split, randomly select m_try predictors from the original predictors and choose the best predictor among the m_try predictors to partition the data. (iii) Predict new data (OOB elements) by averaging predictions of the ntree trees and (iv) use the OOB samples to estimate the prediction error. The RF can also provide a measurement of variable importance. One of the approaches is to look at the increase in the OOB estimate error when the specific predictor variable is randomly permuted and other predictors are constant. The more the error increases, the more important the variable is. These variable importance values are used to rank the predictors in terms of their relative contribution to the model. The RF model was generated using the package randomforest in R (https://cran.r-project.org/web/packages/randomForest/, last access: 25 February 2022).
3.2.2 Fire severity prediction by XGBoost
For the regression model, we implement the extreme gradient boosting (XGBoost) algorithm, one of the most popular supervised machine learning algorithms proposed by Chen et al. (2015). XGBoost employs a gradient boosting framework that iteratively trains a sequence of weak prediction models and combines them into a strong model. In addition to gradient boosting, XGBoost implements several advanced features including regularization techniques to prevent overfitting, parallel processing to speed up training, and built-in support for missing data (Chen and Guestrin, 2016). In the XGBoost algorithm, complex interactions are modelled, and other complexities such as missing values in the predictors are managed almost without any loss of information. Selection of features is performed by a combination of parameters (e.g. number of iterations and learning rate) and the unique combinations of each attribute in the training dataset. The XGBoost model is generated using the package xgboost in R (https://cran.r-project.org/web/packages/xgboost/, last access: 27 February 2024).
3.2.3 Calibration and validation
The fire severity classification maps from the fire extent and severity mapping dataset (FESM, https://datasets.seed.nsw.gov.au/dataset/fire-extent-and-severity-mapping-fesm, last access: 27 February 2024) in the period from 2016 to 2019 are used as the independent source to validate the fire severity classification results based on the proposed method. To evaluate the model's performance, we also use leave-one-group-out for training and validation. The fire samples from 2000 to 2019 are first divided into 20 subsets depending on the year the fire occurred, and this holdout method is repeated 20 times. Each subset represents the samples from the wildfire with the largest burnt area in the corresponding year. Second, at each time one of the 20 subsets is used as the testing set, and the remaining 19 subsets are put together to form the training set. Third, the average error across all 20 trials is computed. The advantage of this cross-validation method is that it gives us an indication of how well the model would do when making new predictions for data it has not already seen.
For performance evaluation of multiclass event classification, accuracy is expressed as the proportion of correctly predicted events over all predicted events, which is calculated as Eq. (4):
Precision is expressed as the proportion of events correctly predicted as label X (low, moderate, or high) over all events predicted as label X (Eq. 5).
in which true positive represents the situation where both the observation and prediction are labelled X, and false positive represents the situation where the observation is not labelled X, but the prediction is labelled X.
Recall is calculated as
in which false negative represents the situation where the observation is labelled X but the prediction is not labelled X.
Combining the metrics of precision and recall, the F1 score is the harmonic mean of precision and recall. The F1 score gives equal weight to precision and recall. A maximized F1 score can create a balanced classification model and is calculated as follows
The coefficient of determination (R2) is used to measure how well the prediction agrees with the actual values. The formula of R2 is described as
where oi and pi represent the actual and predicted values for sample i and n is the total number of samples. A higher R2 indicates a better fit of the model predictions to the actual values, with the best value being 1.
The mean absolute error (MAE) is used to measure the average magnitude of the errors in a model's predictions. A lower MAE indicates better model accuracy.
The root-mean-square error (RMSE) is used to quantify the random component of the error. Lower RMSE indicates better model performance.
4.1 Fire severity of burnt vegetation
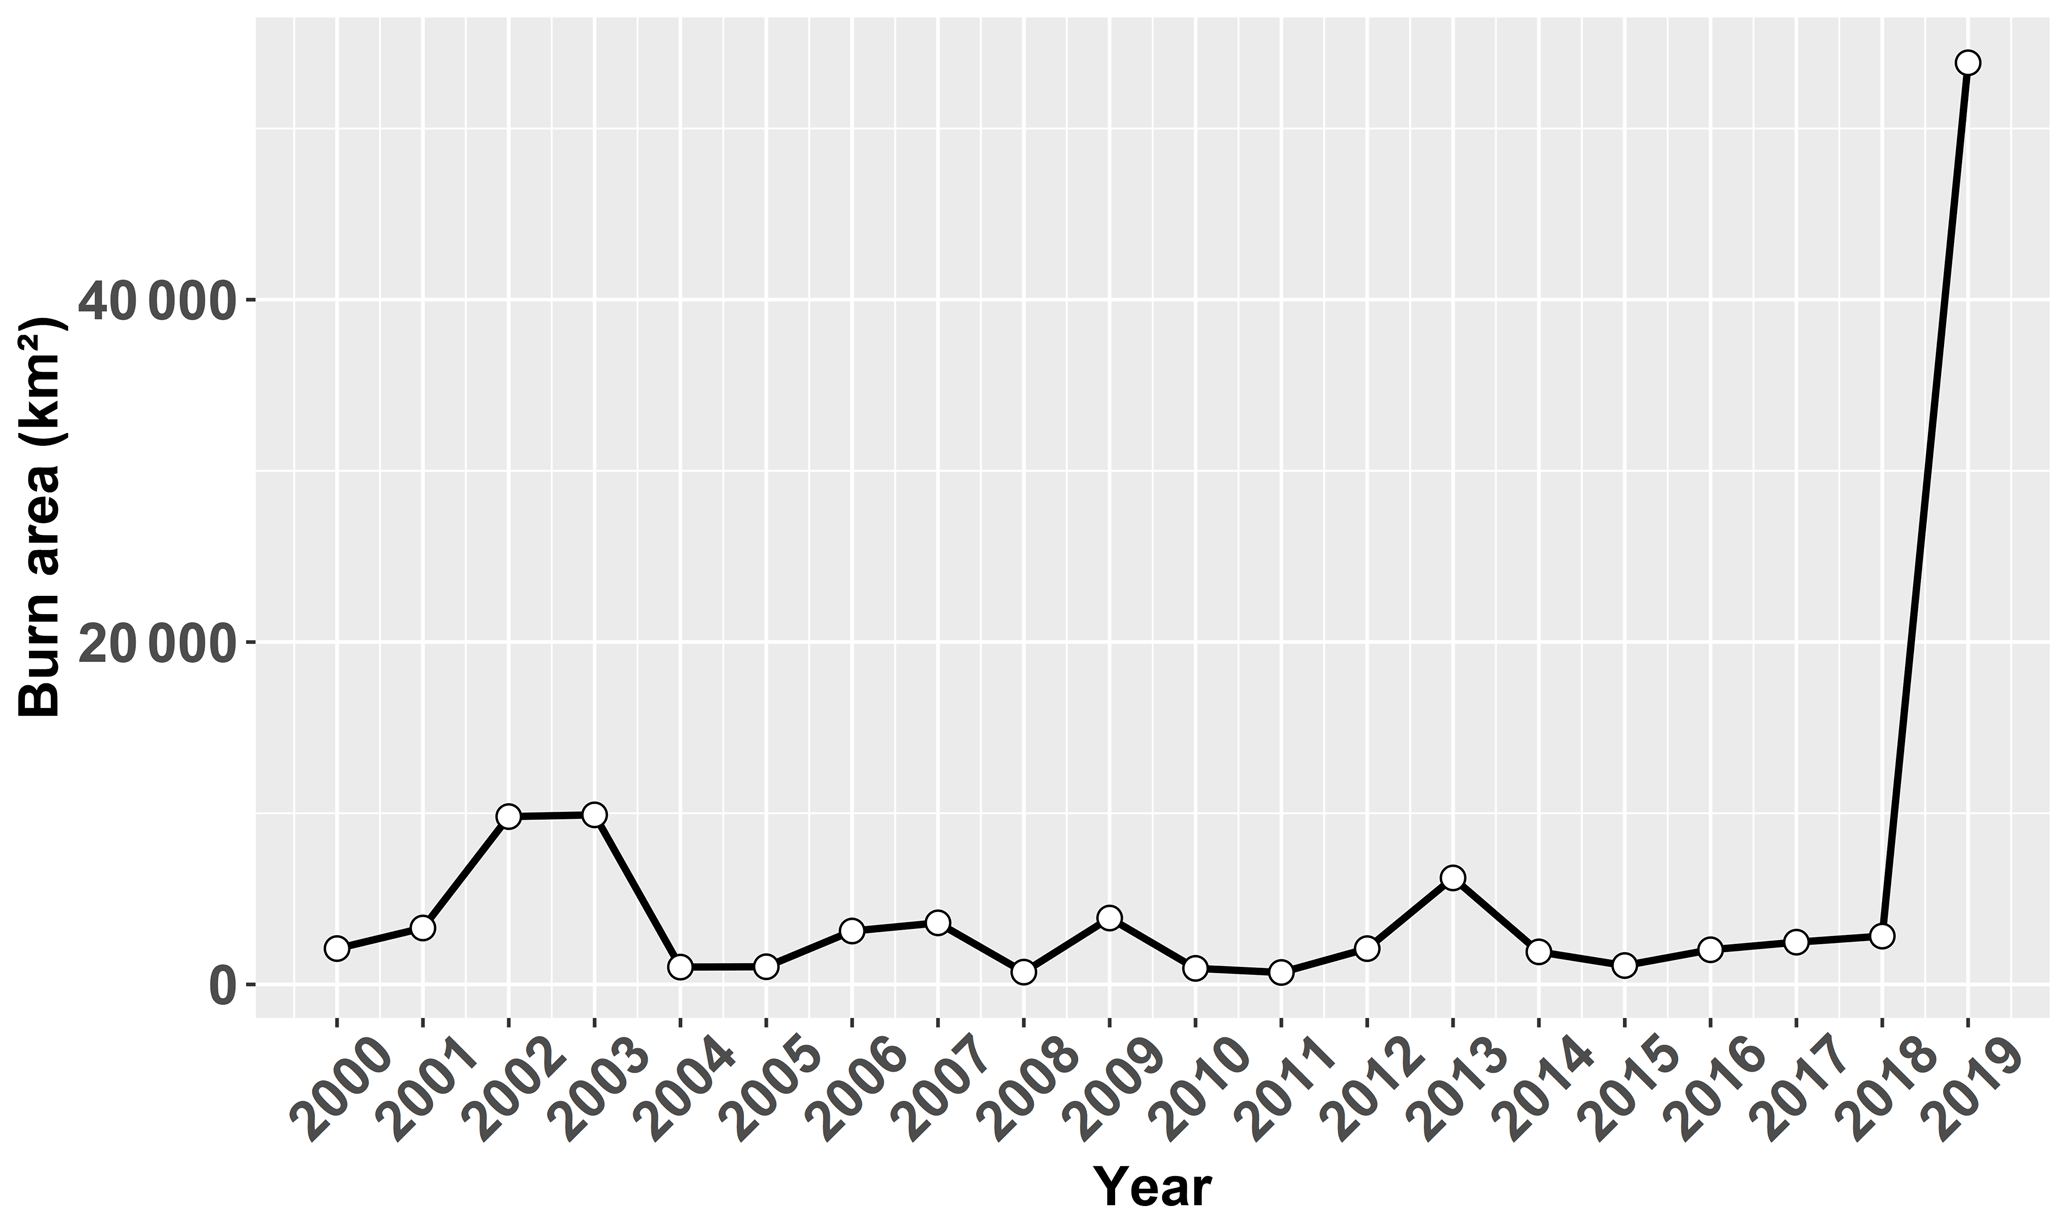
Over the past 20 years, wildfire history databases managed by government agencies indicate that approximately 112 590 km2 of land has been recorded as affected by fires in NSW, of which almost 53 830 km2 burned during the 2019–2020 megafires (Fig. 2). This dataset indicates that the annual burnt area is typically below 5000 km2, but in exceptional years such as 2002 and 2003, the area affected can reach more than 10 000 km2. The area affected in the 2019–2020 fires is approximately 10 times larger than that in other years from 2004 to 2018.
The fractions of vegetation types in the burnt area are shown in Fig. 3a. Dry sclerophyll forests (shrubby sub-formation) accounted for the largest proportion of the burnt area (32.1 %), followed by dry sclerophyll forests (shrub/grass sub-formation) that accounted for 16 %. Wet sclerophyll forests (grassy sub-formation) occupy 14.2 % of the burnt area, while for wet sclerophyll forests (shrubby sub-formation), the proportion is 11 %. Specifically, the cleared area accounted for 11.3 % of the burnt area, approximately equal to that of the wet sclerophyll forests (shrubby sub-formation). Other vegetation types largely affected by the wildfires are grassy woodlands, rainforest and heathlands, the burned proportions of which are 6.7 %, 2.5 %, and 2 %, respectively. The distribution of fire severity indicated by dNBR for each vegetation type is displayed as Fig. 3b. These boxplots in Fig. 3b show that the fire severity varies significantly with vegetation type, demonstrating that vegetation-specific thresholds should be applied in fire severity classification. For example, the fire severity of cleared areas is overall the smallest while the fire severity of heathland is the largest overall. The fire severity varies even for the major vegetation types with different subgroups; for instance, the fire severity of dry sclerophyll forests with the shrubby sub-formation is larger than the fire severity of dry sclerophyll forests with the shrub/grass sub-formation.
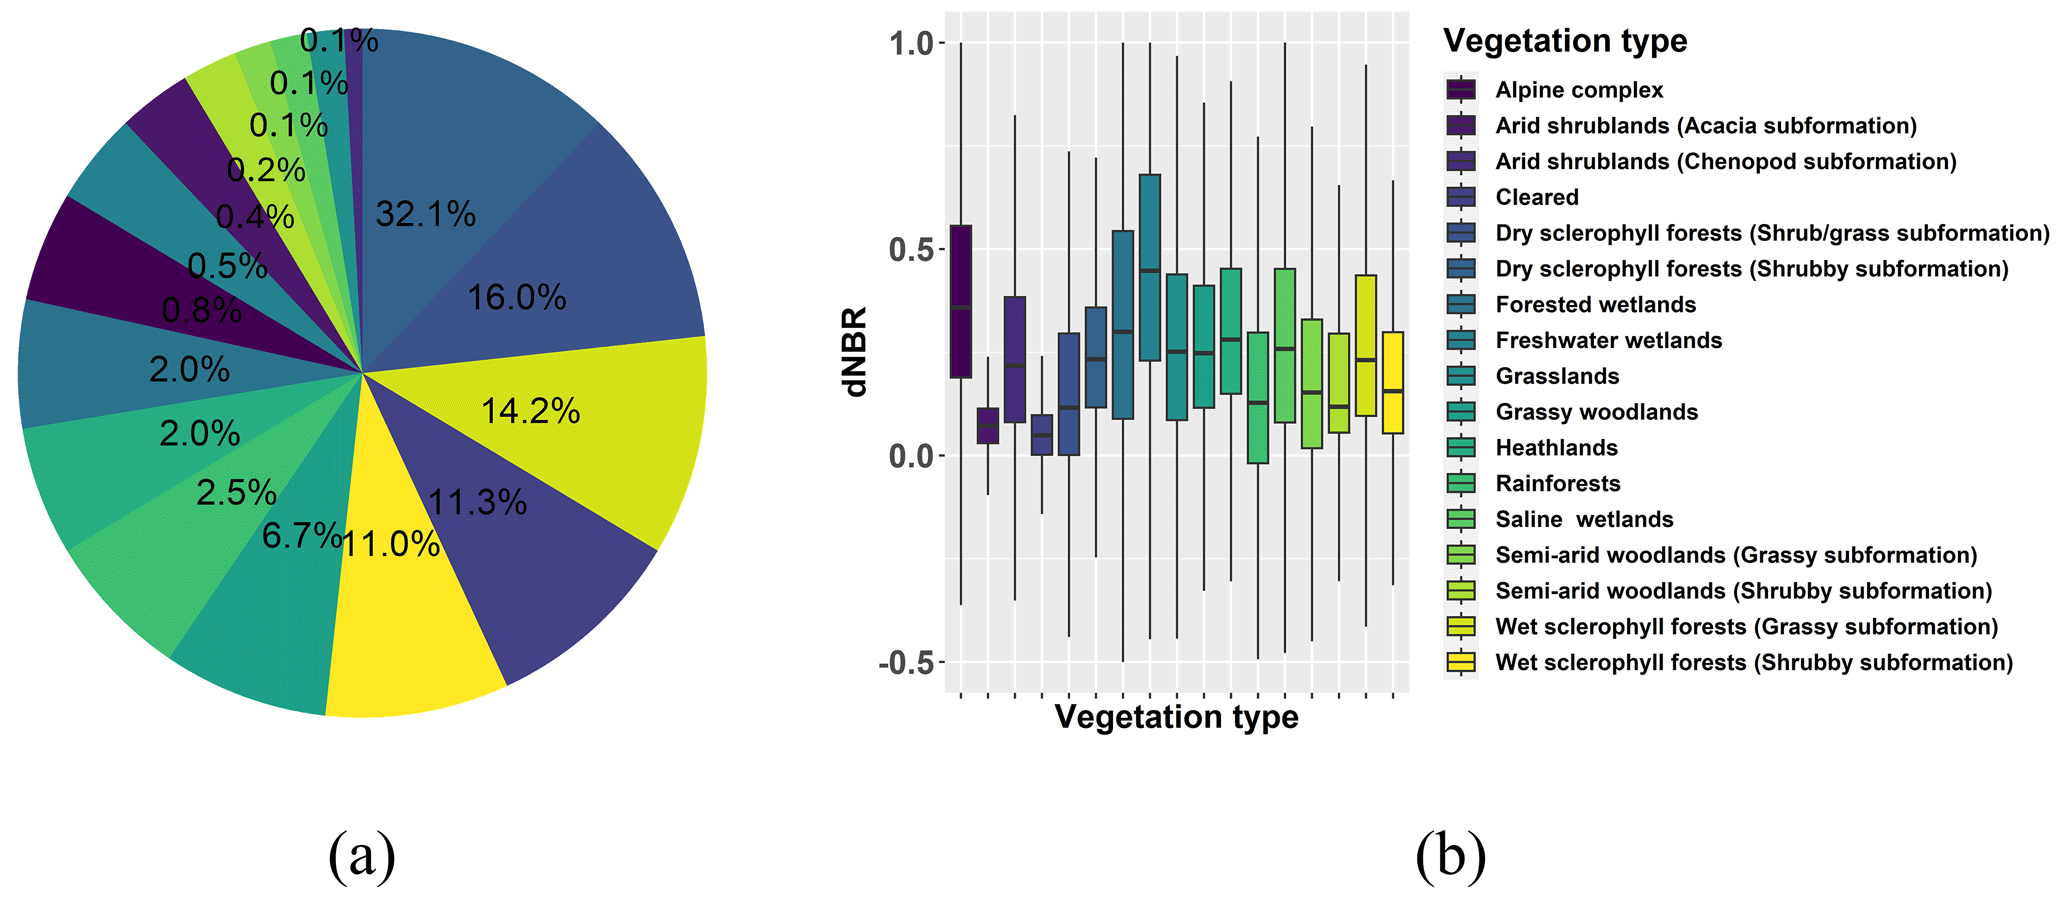
Figure 3(a) The proportion of the burnt area and (b) the distribution of fire severity grouped by vegetation type over NSW from 2000 to 2019.
4.2 Threshold determination for fire severity classification
Given the variability shown in Fig. 3b, we propose an alternative way to determine the optimal thresholds in fire severity classification for different vegetation types. To determine these thresholds, the dNBR of all burnt pixels for the vegetation type were collected and a set of dNBR values at the quantiles from 0.05 to 0.95 are used as the candidates for thresholds for the fire severity classification. The classified samples using the threshold of dNBR at the quantiles are imported as the training set in RF models, and the OOB estimate of error rate is recorded for the training samples. Figure 4a–d shows that variations in the OOB estimate of the error rate changes with thresholds of dNBR at the quantiles varying from 5 % to 35 % (low-severity threshold) or from 35 % to 65 % (moderate severity threshold) when the high-severity threshold is set to the dNBR values at the 65th, 75th, 85th, and 95th quantiles. The optimal thresholds are determined when the lowest OOB estimate of error rate is found. For example, for dry sclerophyll forests (shrubby sub-formation), the thresholds for high-, moderate-, and low-severity classification are 0.55 (85th quantile), 0.38 (55th), and 0.20 (25th), respectively. It is important to be aware that the classification step is merely used to improve the consecutive regression accuracy rather than improve the final severity categorization result. The choice of threshold in this step therefore will not affect severity categorization. The categorization will be solely based on predicted severity value, using user-defined thresholds.
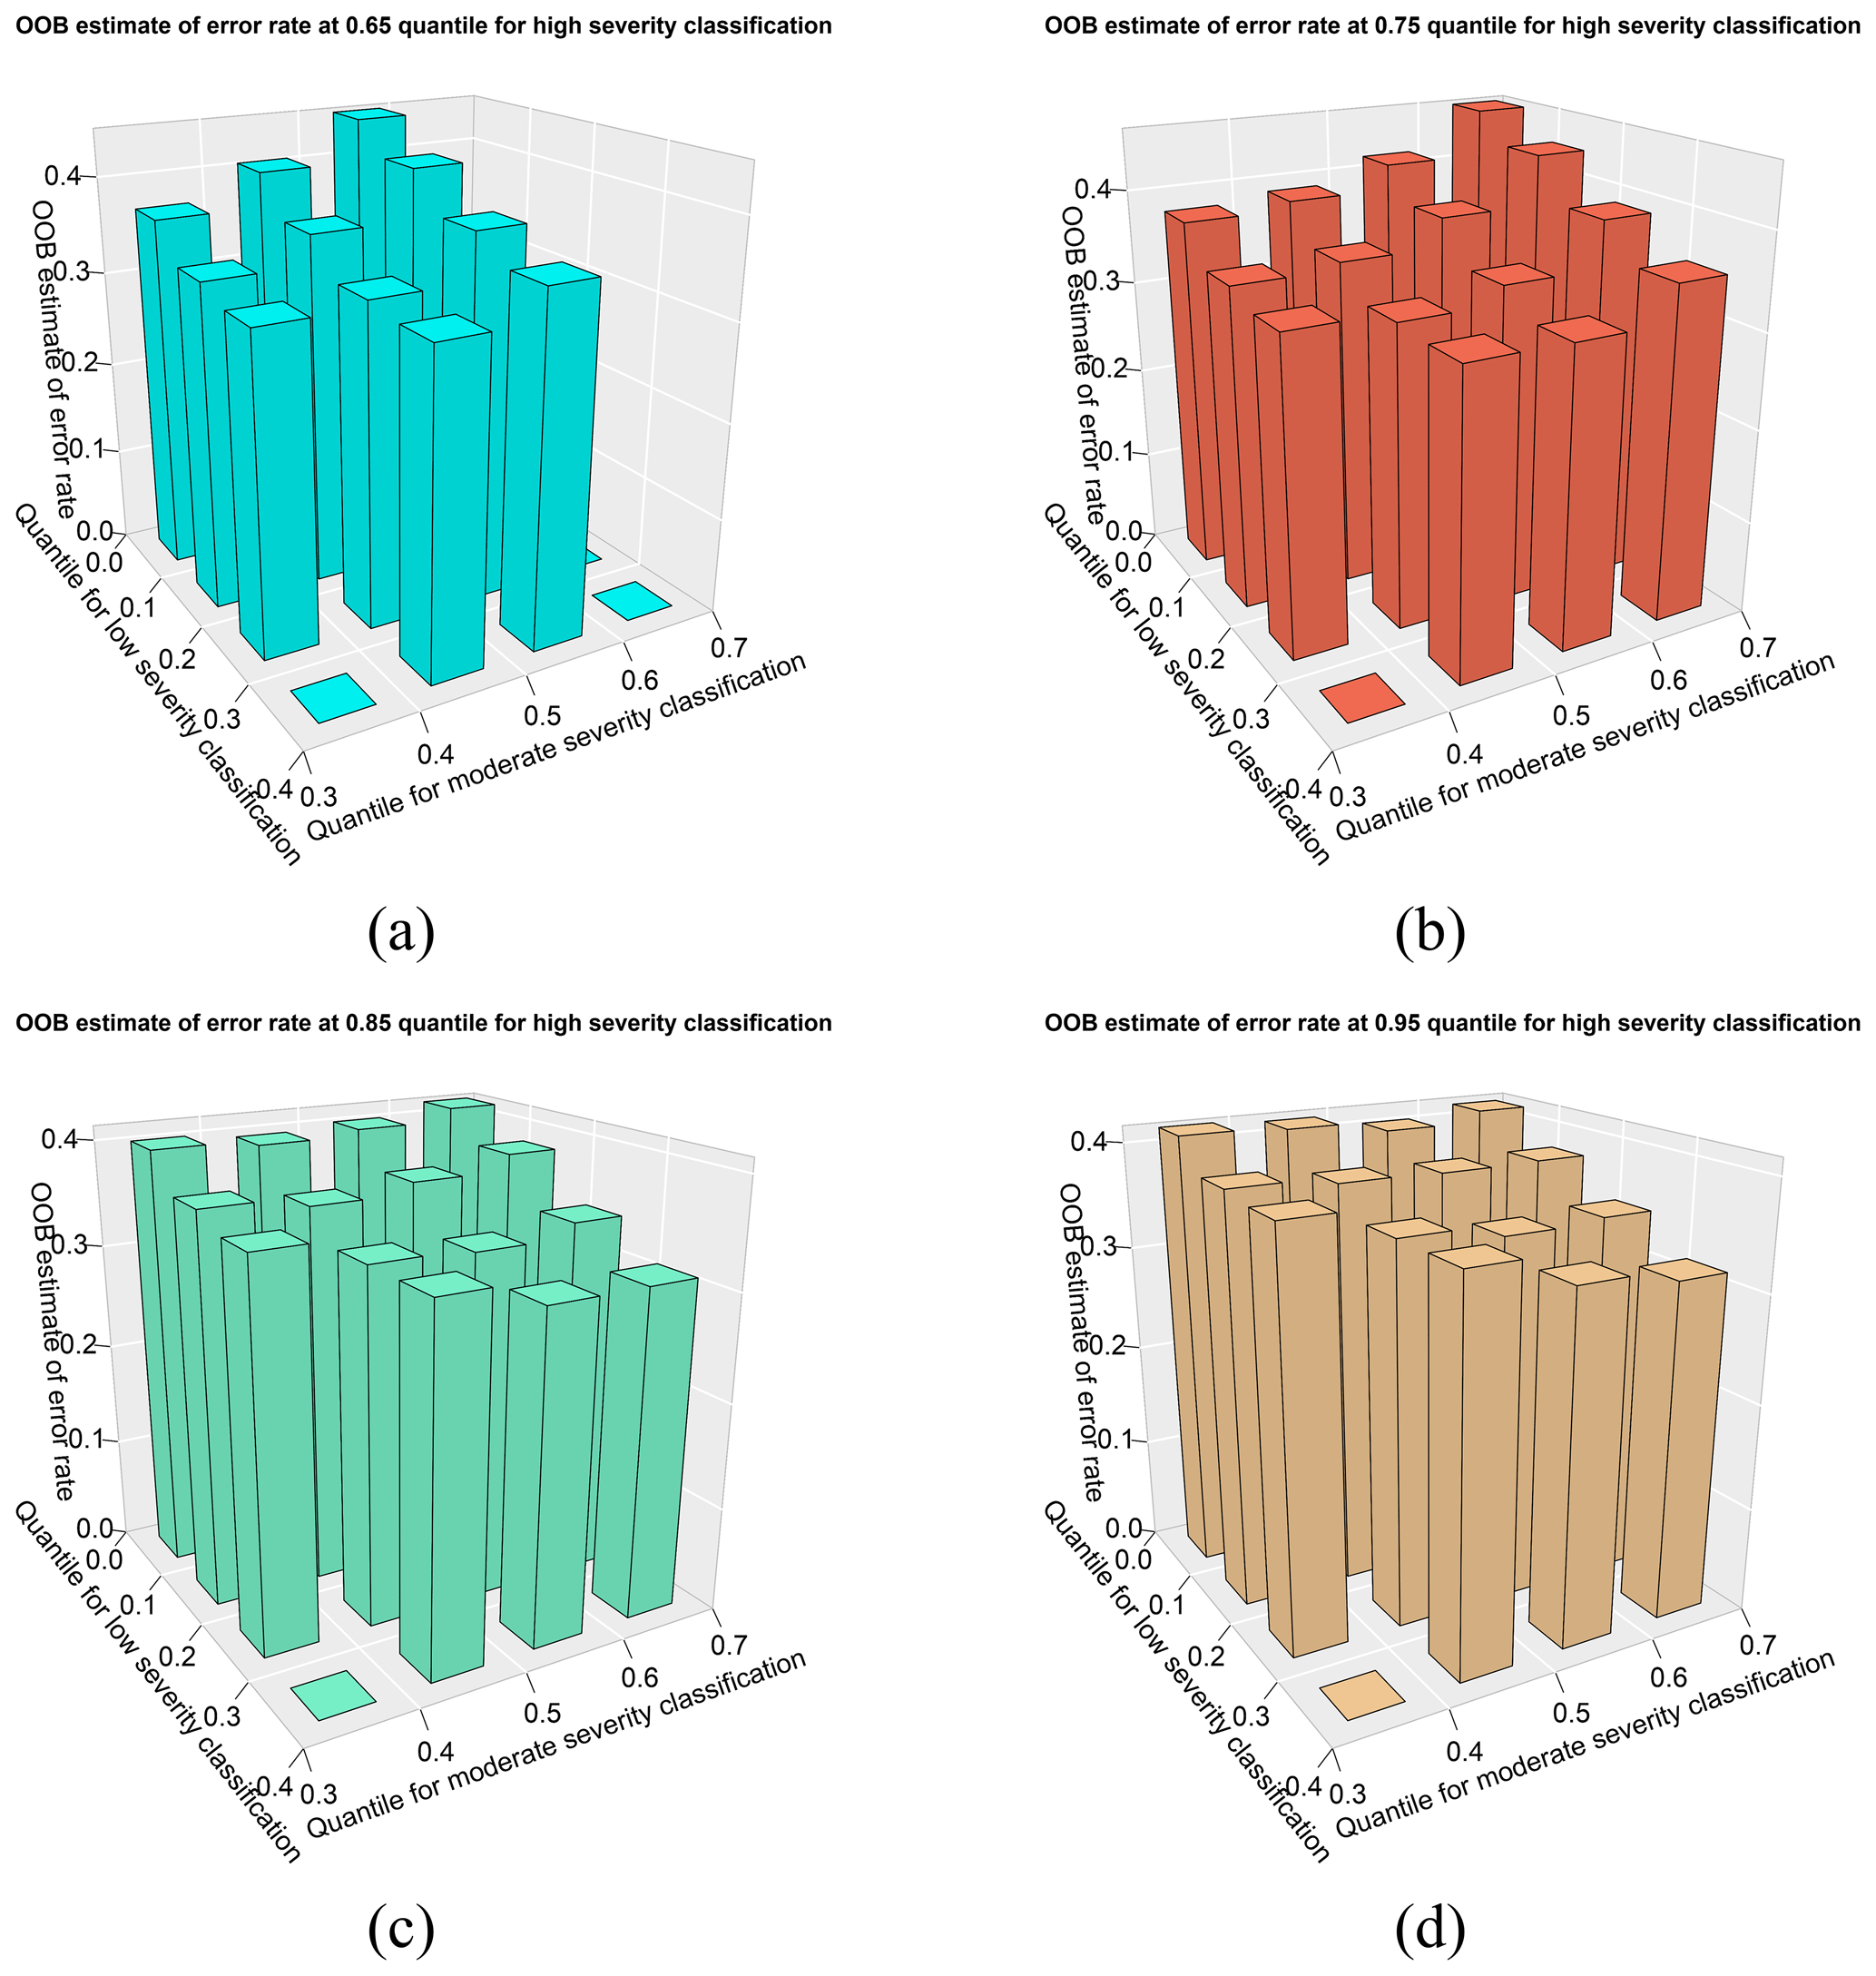
Figure 4Variations in OOB estimates of error rate changes with thresholds of dNBR at the quantiles varying from 5 % to 35 % (low-severity threshold) and 35 % to 65 % (moderate-severity threshold) when the high-severity threshold is set to the dNBR values at the (a) 65th, (b) 75th, (c) 85th, and (d) 95th quantiles.
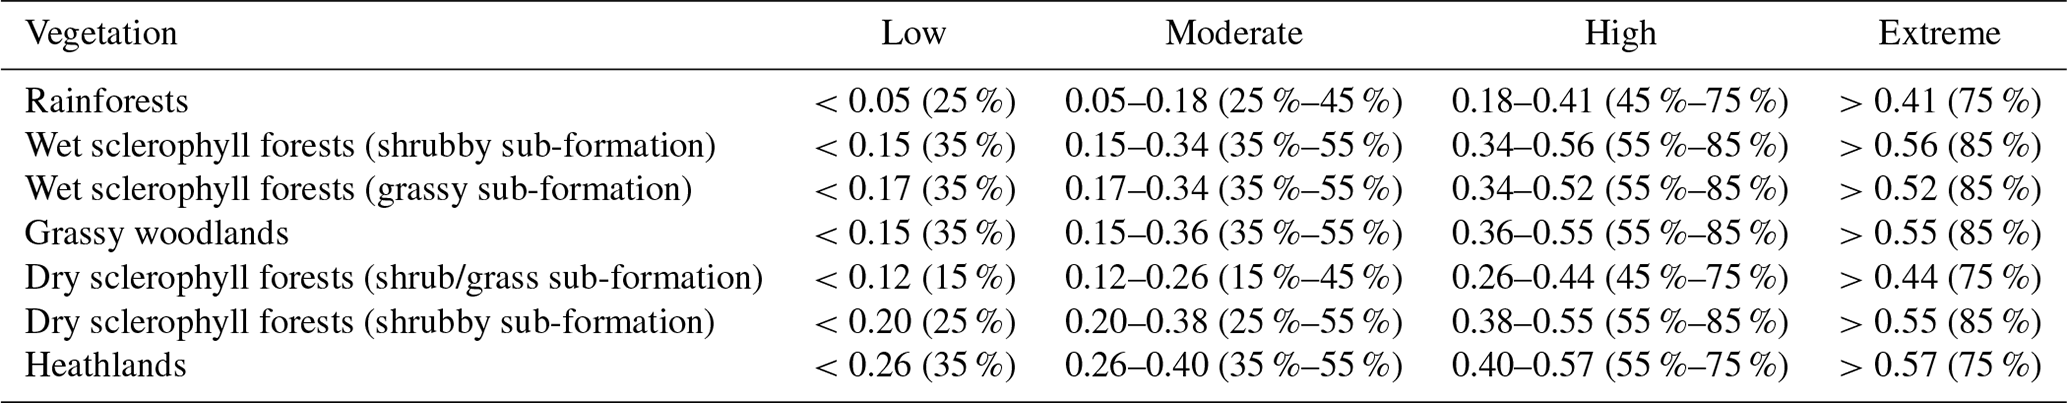
The thresholds of dNBR for fire severity classification for different vegetation types are determined by the proposed method, and the results are presented in Table 1. It is shown that the thresholds vary significantly with vegetation type. For example, for rainforests when dNBR of the burnt area is around 0.20, this area should be classified as high severity. However, the burnt area with the same dNBR (0.20) would be classified as moderate severity when wildfire burns over other vegetation types. This difference is also found in the major vegetation types within different subgroups. A burnt area with a dNBR around 0.53 is classified as extremely high severity when fire burns over wet sclerophyll forests (grassy sub-formation), while this burnt area is classified as high severity when fire burns over wet sclerophyll forests (shrubby sub-formation). The differences in classification thresholds are more significant between dry sclerophyll forests with the shrub/grass sub-formation and with the shrubby sub-formation. The thresholds for high-severity classification are 0.44 and 0.55 for burnt area over dry sclerophyll forests (shrub/grass sub-formation) and over dry sclerophyll forests (shrubby sub-formation), respectively. These results indicate that using the vegetation-specific thresholds results in more reasonable fire severity classification results, while a lot of misclassifications are found when applying fixed thresholds in fire severity classification without considering the variations in vegetation cover.
Table 1Thresholds of dNBR for fire severity classification by vegetation type.
4.3 Fire severity prediction results
The performance of vegetation-specific thresholds and the importance of vegetation type are validated by cross-validation in the RF model. Figure 5a and b shows the relative importance of variables in the RF based on samples classified by vegetation-specific thresholds and fixed thresholds, respectively. The error bar represents the standard deviation (SD) of relative importance in RF models in the cross-validation experiments. PreNBR is the most influential variable, with relative importance around 28 % and SD around 7 %. FFDI also plays an important role in the model, with relative importance and SD of 21 % and 6 %. KBDI shows close relative importance to that of FFDI, the values of mean relative importance and SD are 19 % and 5 %. For vegetation type, the relative importance (13 %) is higher than that of the topographic variables when the vegetation-specific thresholds are applied. The SD of vegetation type is the largest (9 %), owing to the differences in vegetation diversity in the training samples.
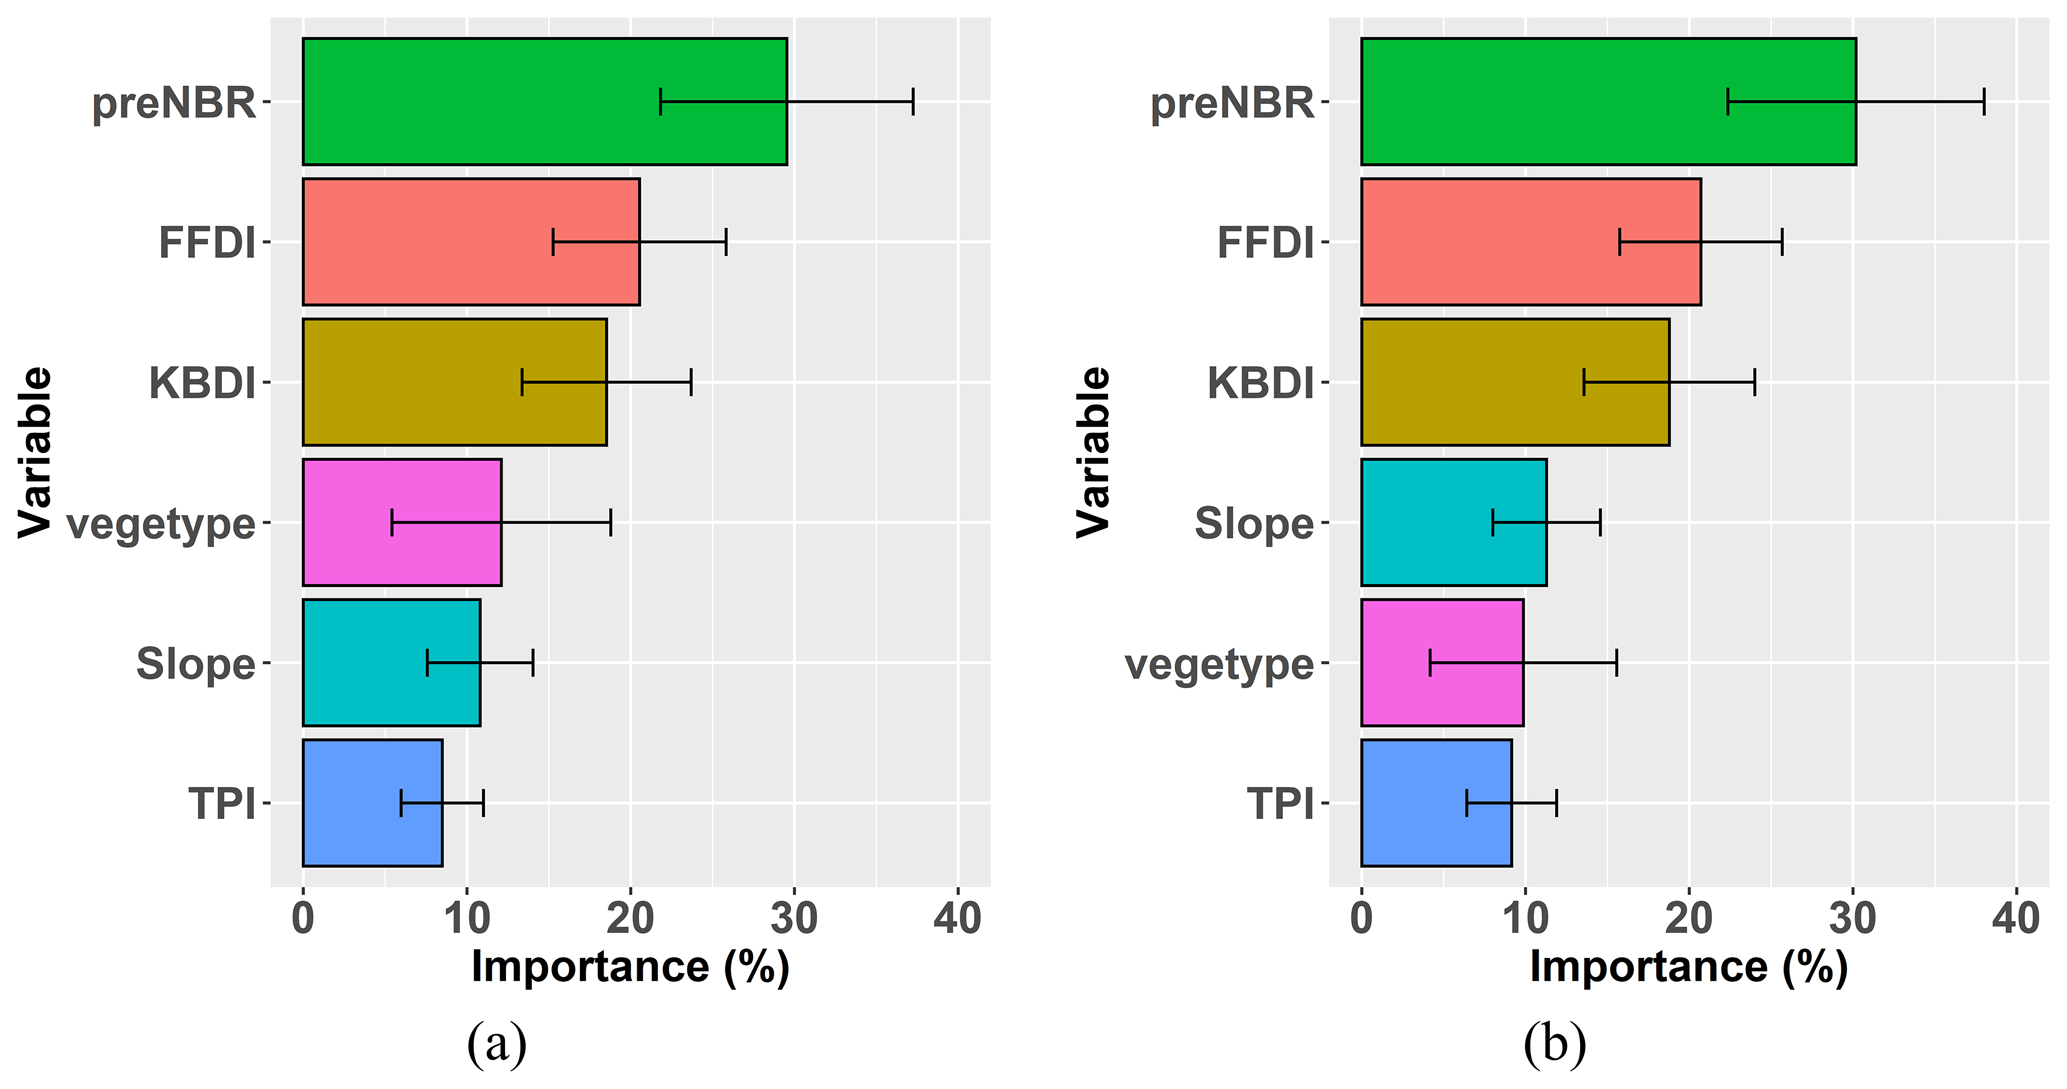
Figure 5Relative importance of variables in RF models based on samples classified by (a) vegetation-specific thresholds and (b) fixed thresholds.
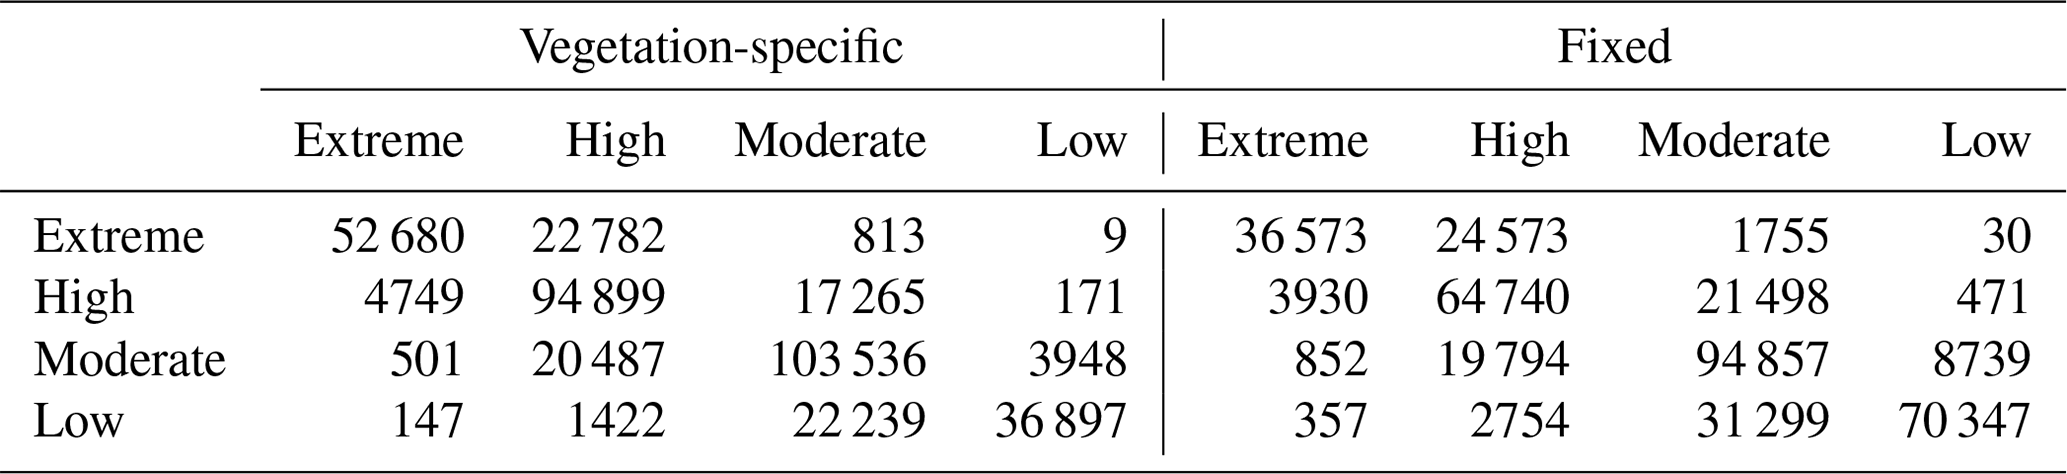
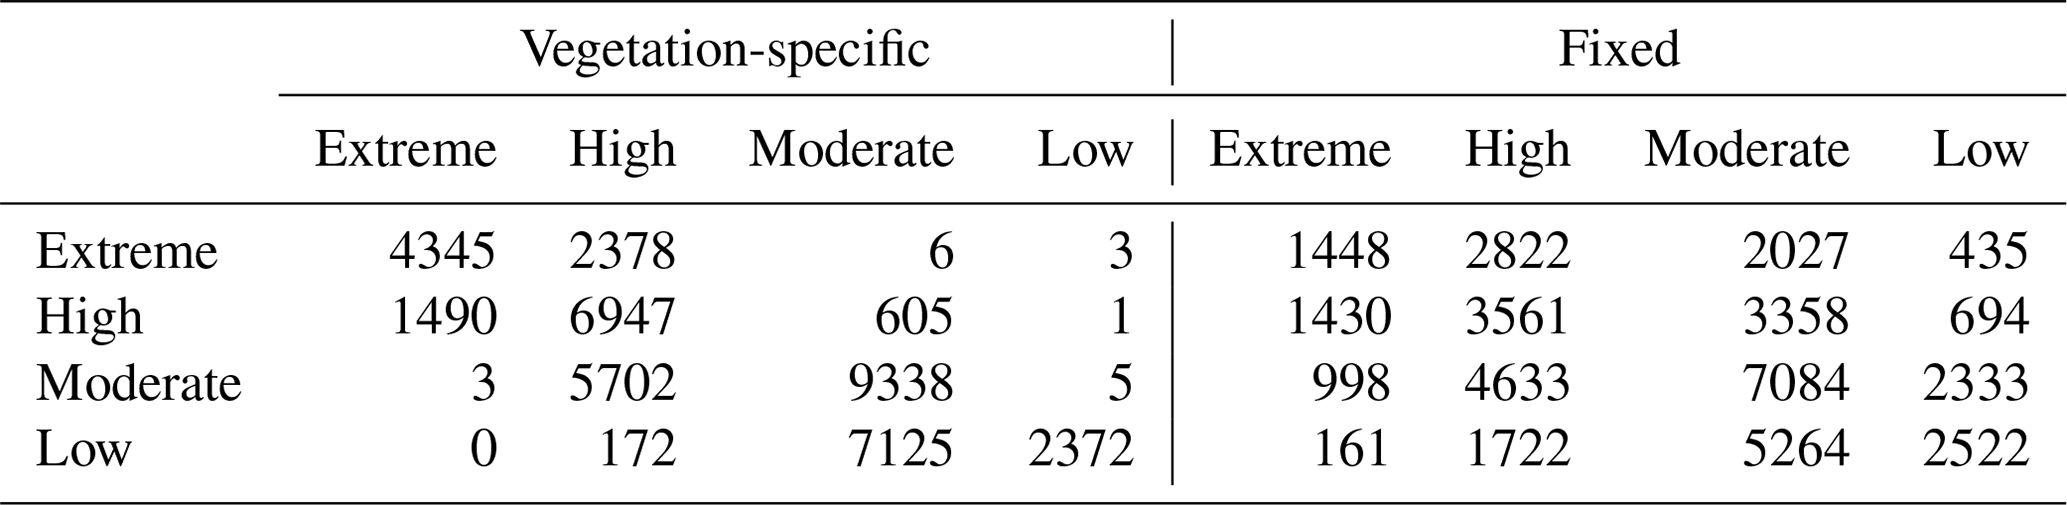
The confusion matrix of the fire severity classification results is shown in Table 2. More samples are classified as extremely high severity when applying vegetation-specific thresholds than when using fixed thresholds. Similarly, more samples are classified as low severity while implementing fixed thresholds than when using vegetation-specific thresholds. This indicates that using fixed thresholds without considering the vegetation type tends to underestimate the fire severity levels. For the performance of fire severity prediction, most events of extremely high severity are correctly identified by the RF model trained on samples classified by vegetation-specific thresholds, while more misclassified extremely high severity and high-severity events are predicted by the RF model trained on samples classified by fixed thresholds.
Table 2Confusion matrix of prediction results based on the RF model trained by samples classified by vegetation-specific and fixed thresholds.
The overall classification accuracies calculated by Eq. (4) are 0.75 and 0.69 for RF models trained on samples classified by vegetation-specific and on fixed thresholds, respectively. Figure 6a–c shows the precision, recall, and F1 score of event severity classification results for each class label calculated by Eqs. (5)–(7). Accuracy, precision, and recall results and an F1 score close to 1 indicate accurate classification results. For the classification metrics of each class label, the high-severity event class exhibits the best precision (0.85) relative to the moderate- (0.76) and extremely high severity event classes (0.68), while the recall and F1 score for the high-severity event class are 0.64 and 0.73. The extremely high severity event class exhibits the best recall (0.89) relative to the other two classes, and the precision and F1 score are 0.68 and 0.77. The performance of fire severity classification is worse for the RF model trained on samples classified by the fixed thresholds, with lower precision, recall, and F1 score.
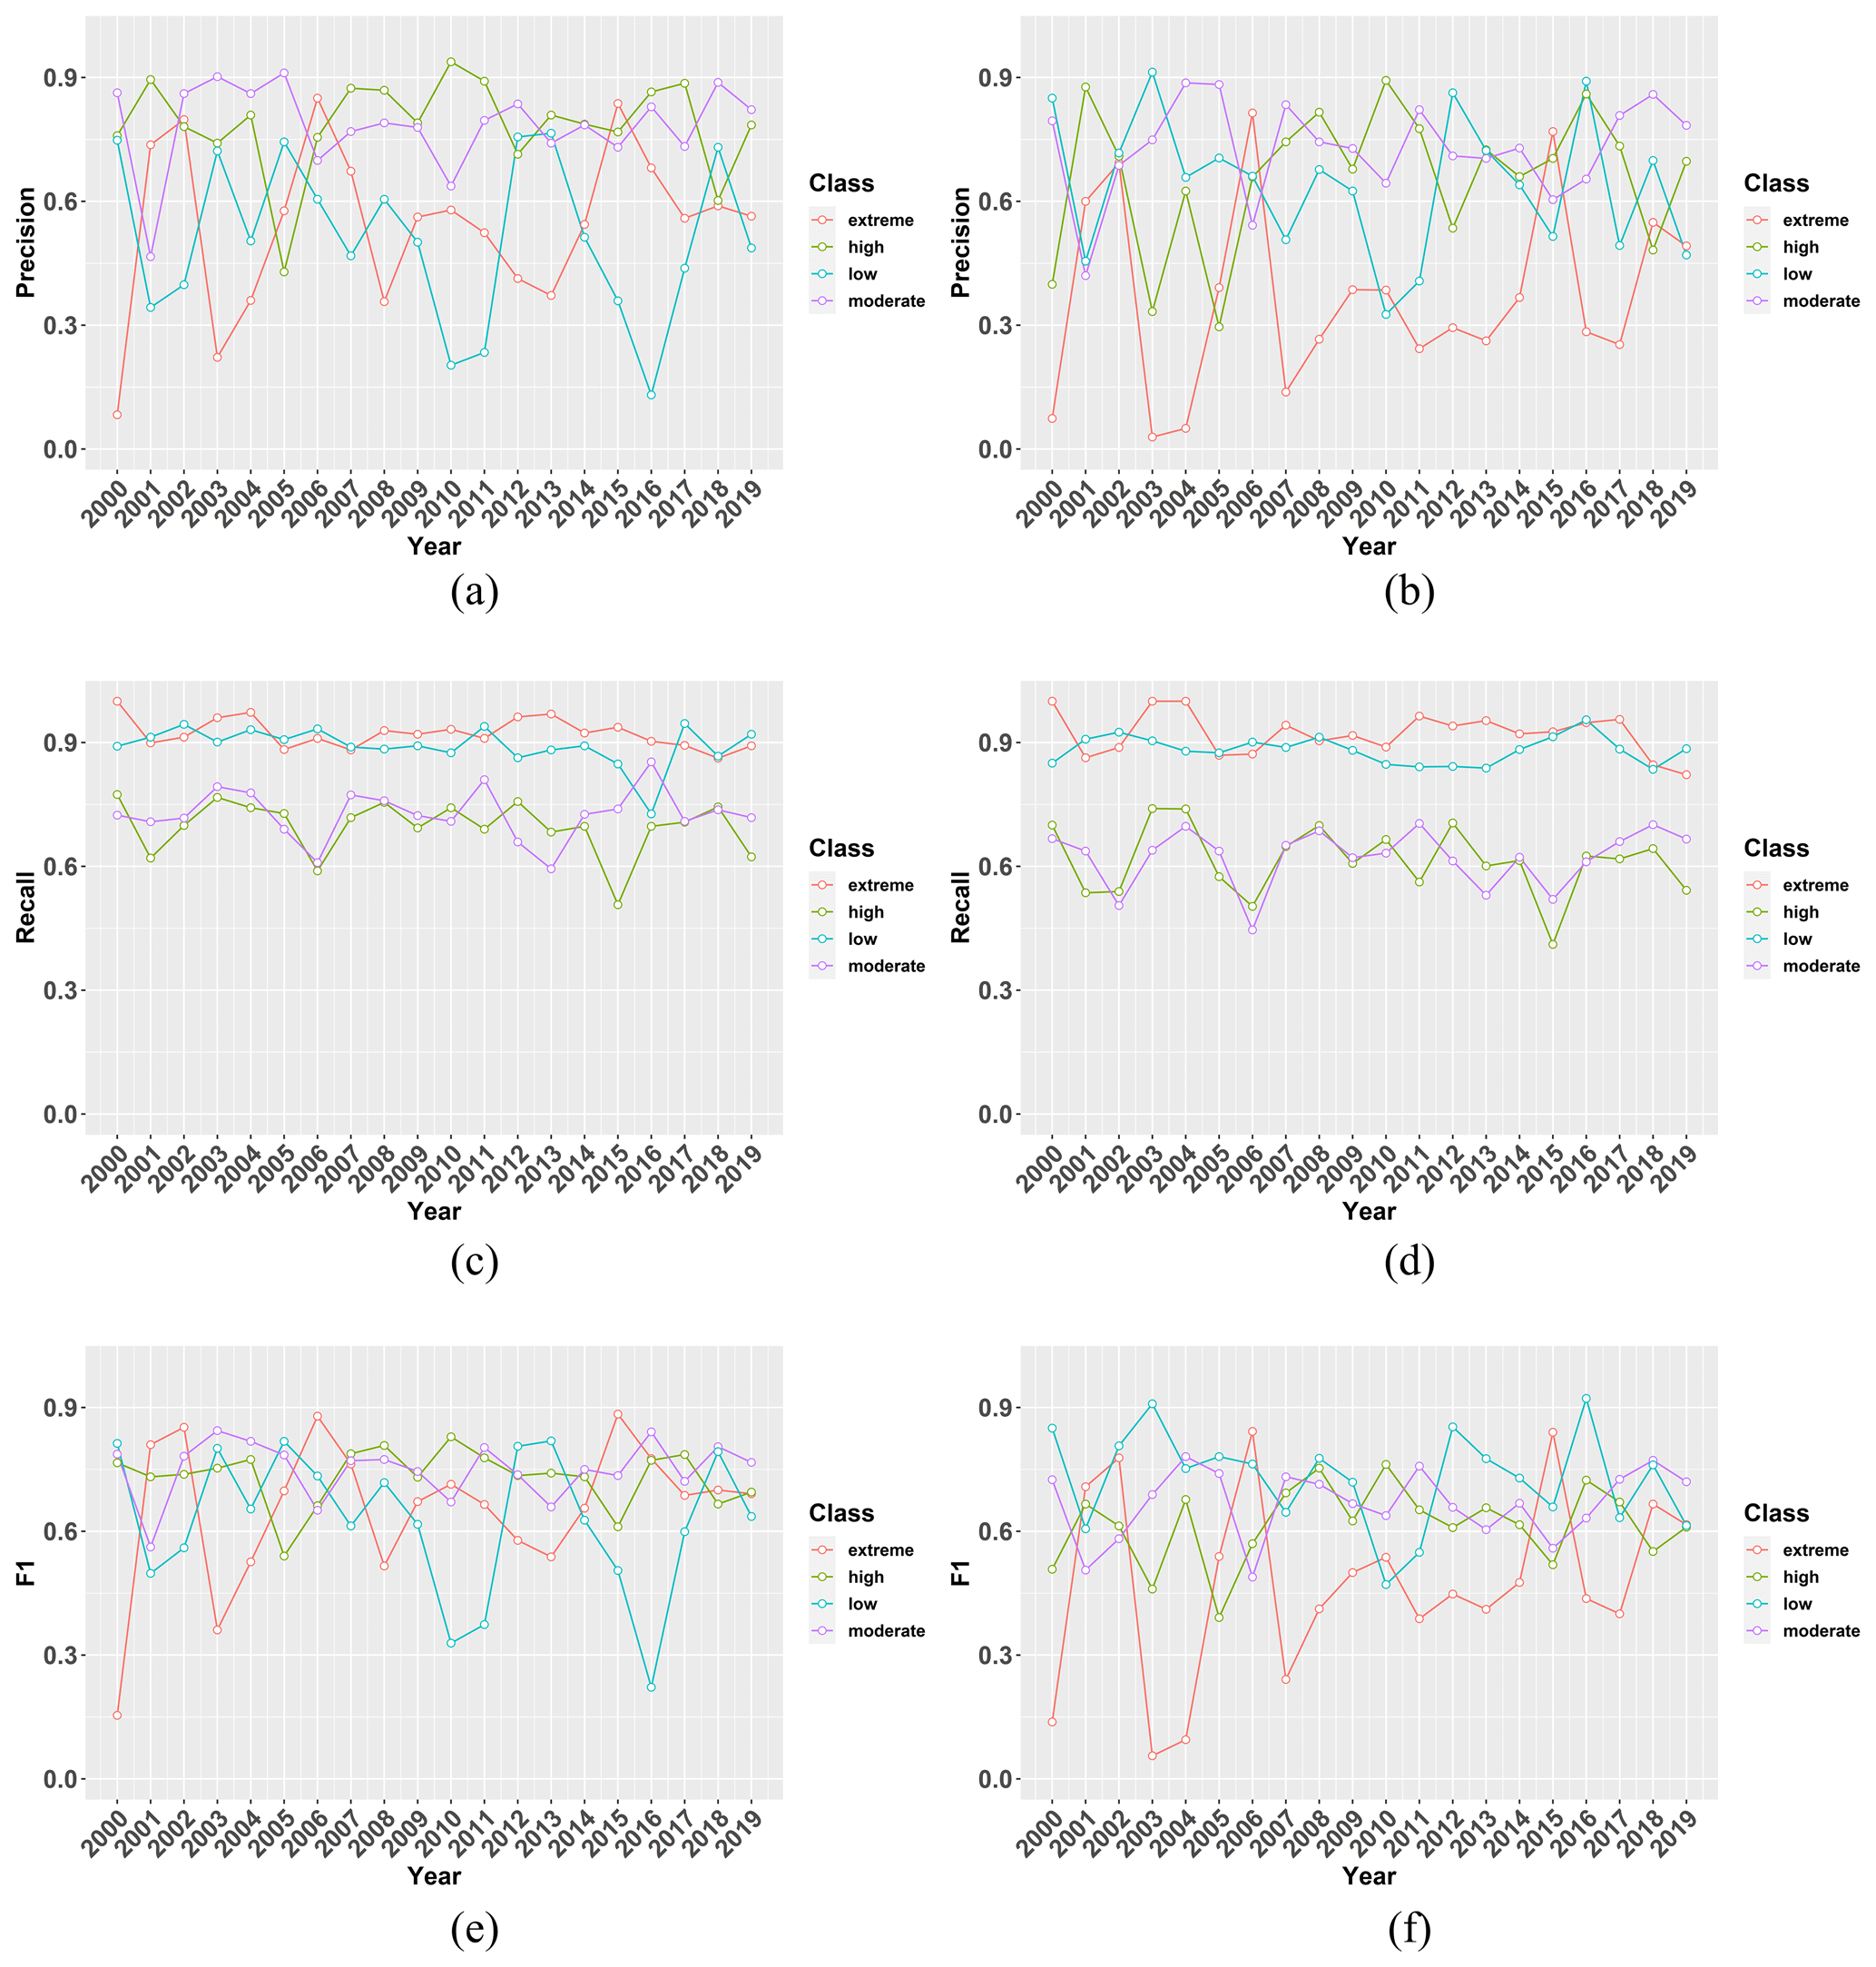
Figure 6Results of precision for predictions based on (a) vegetation-specific thresholds and (b) fixed thresholds. The results of recall for predictions based on (c) vegetation-specific thresholds and (d) fixed thresholds. The results of the F1 score for predictions based on (e) vegetation-specific thresholds and (f) fixed thresholds.
Figure 7 displays the fire severity maps for the 2016, 2017, 2018, and 2019 wildfires in NSW from FESM, along with fire severity predictions based on vegetation-specific and fixed thresholds. For the wildfire in 2016, predictions based on vegetation-specific thresholds show similar spatial patterns of fire severity to those from FESM, while predictions based on fixed thresholds significantly underestimate the fire severity in the high and extreme fire severity areas of the FESM. Similarly for the wildfire in 2018, predictions based on fixed thresholds significantly underestimate high and extreme severity compared to the FESM map, while predictions based on vegetation-specific thresholds slightly underestimate extreme severity. For the wildfire in 2017, both the FESM and predictions display similar spatial distributions of the fire severity level, with predictions based on fixed thresholds presenting lower severity compared to the FESM map. For the wildfire in 2019, however, predictions based on fixed thresholds tend to overestimate the fire severity, categorizing it as extreme in regions that were found to be high severity on the FESM map, while predictions based on vegetation-specific thresholds agreed better with the FESM map.
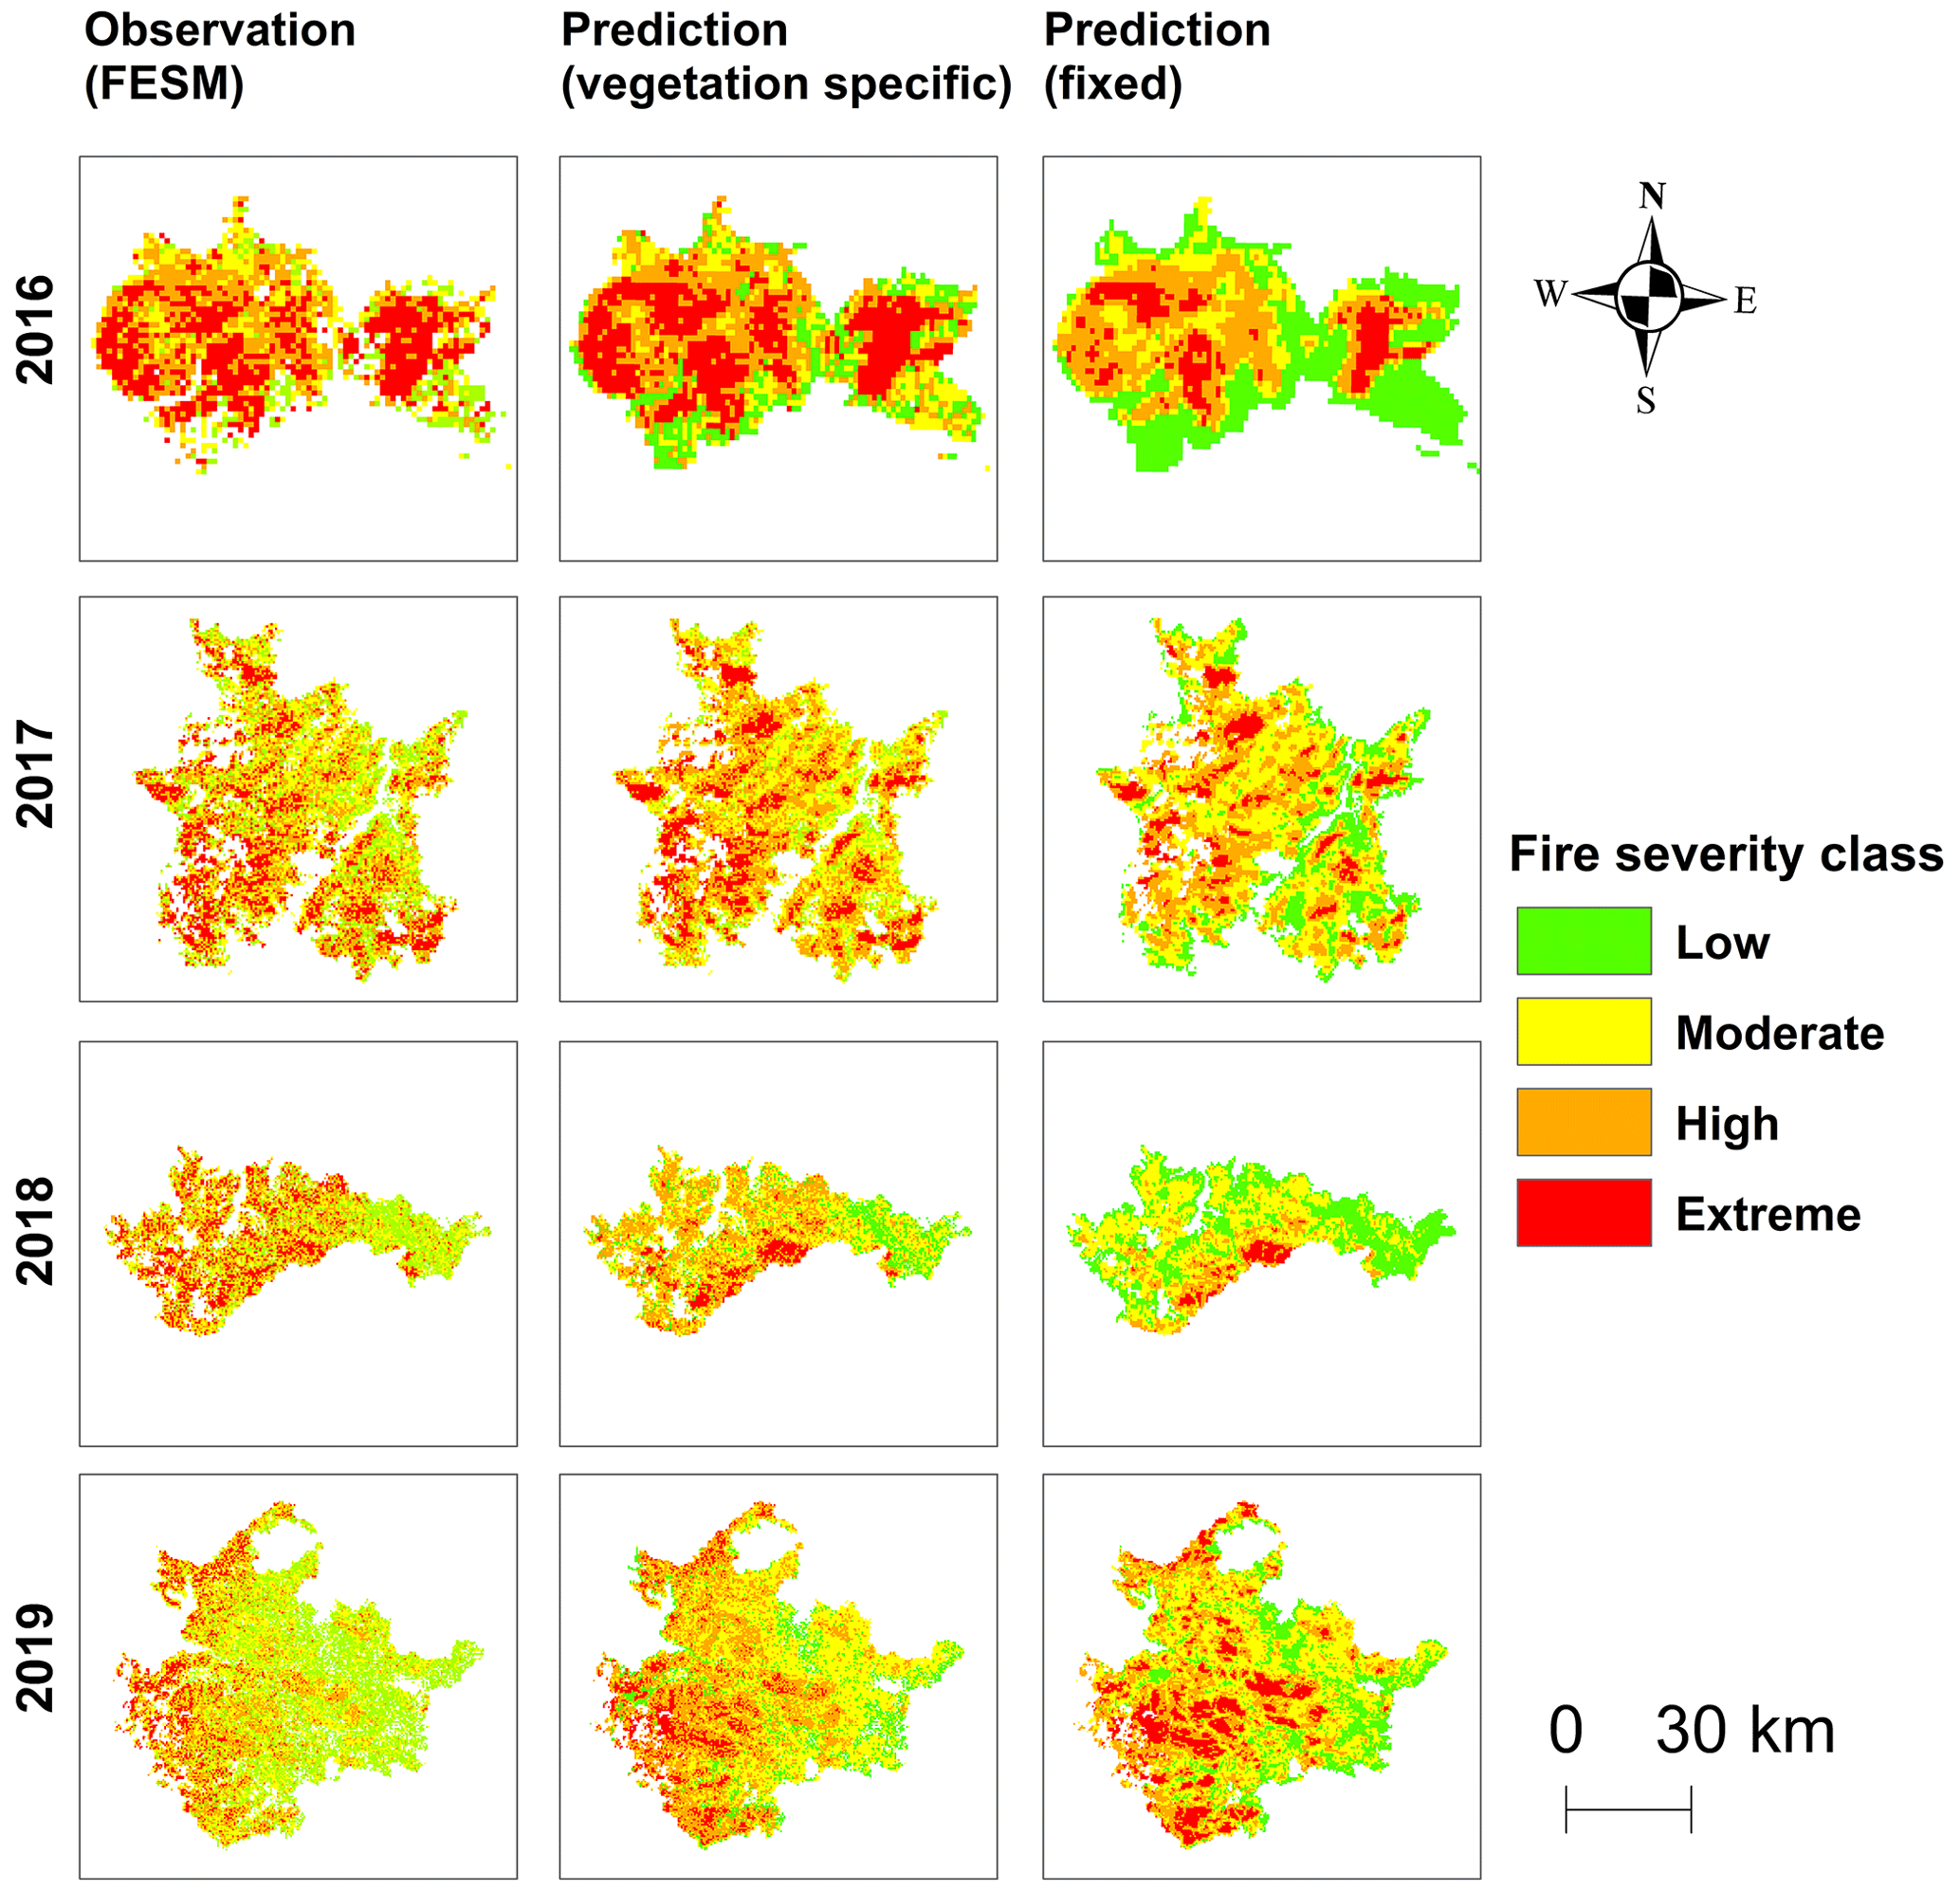
Figure 7Fire severity classification maps from FESM and predictions based on vegetation-specific and fixed thresholds for wildfires from 2016 to 2019 in NSW.
Table 3 shows the confusion matrix for fire severity classification between FESM and predictions based on vegetation-specific and fixed thresholds. It is noted that predictions based on vegetation-specific thresholds are able to better classify extreme and high severity, with accuracies of 0.64 and 0.76, while the classification accuracies for extreme and high severity based on fixed thresholds are 0.21 and 0.39. Predictions based on vegetation-specific thresholds are also able to better classify moderate severity, with a value of 0.62 compared to those based on fixed thresholds that had a value of 0.47. Predictions based on both vegetation-specific and fixed thresholds show poor performance in classifying low severity, with accuracies of 0.24 and 0.26, respectively. The overall classification accuracy for predictions based on vegetation-specific thresholds is 0.57, which is better than predictions based on fixed specific thresholds (with accuracy of 0.36).
Table 3Confusion matrix for fire severity classification between FESM and predictions based on vegetation-specific and fixed thresholds.
To evaluate the model's performance in fire severity prediction, we apply the leave-1-year-out cross-validation method. We validate the fire severity predictions against the observed burn severity derived from Landsat images and compare the predictions based on the RF model with (and without) the severity classification method. Figure 8a–c displays the scatterplots of fire severity prediction versus fire severity observations based on the RF model without severity classification, with severity classification using the fixed threshold, and with classification using the vegetation-specific threshold. Arguably, the predictions without severity classifications show a strong underestimation of high-fire-severity events and overestimation of low-burn-severity events, with an R2 value of 0.62, RMSE of 0.14 and MAE of 0.11. The distributions of predictions with severity classifications using the fixed threshold do not agree well with observations, although they show higher R2 (0.79) and lower RMSE (0.11) and MAE (0.08) values. Predictions with severity classifications using the vegetation-specific threshold exhibit better fire severity prediction results for high-, moderate-, and low-severity events, with improved R2, RMSE, and MAE, which are 0.89, 0.07, and 0.05, respectively.
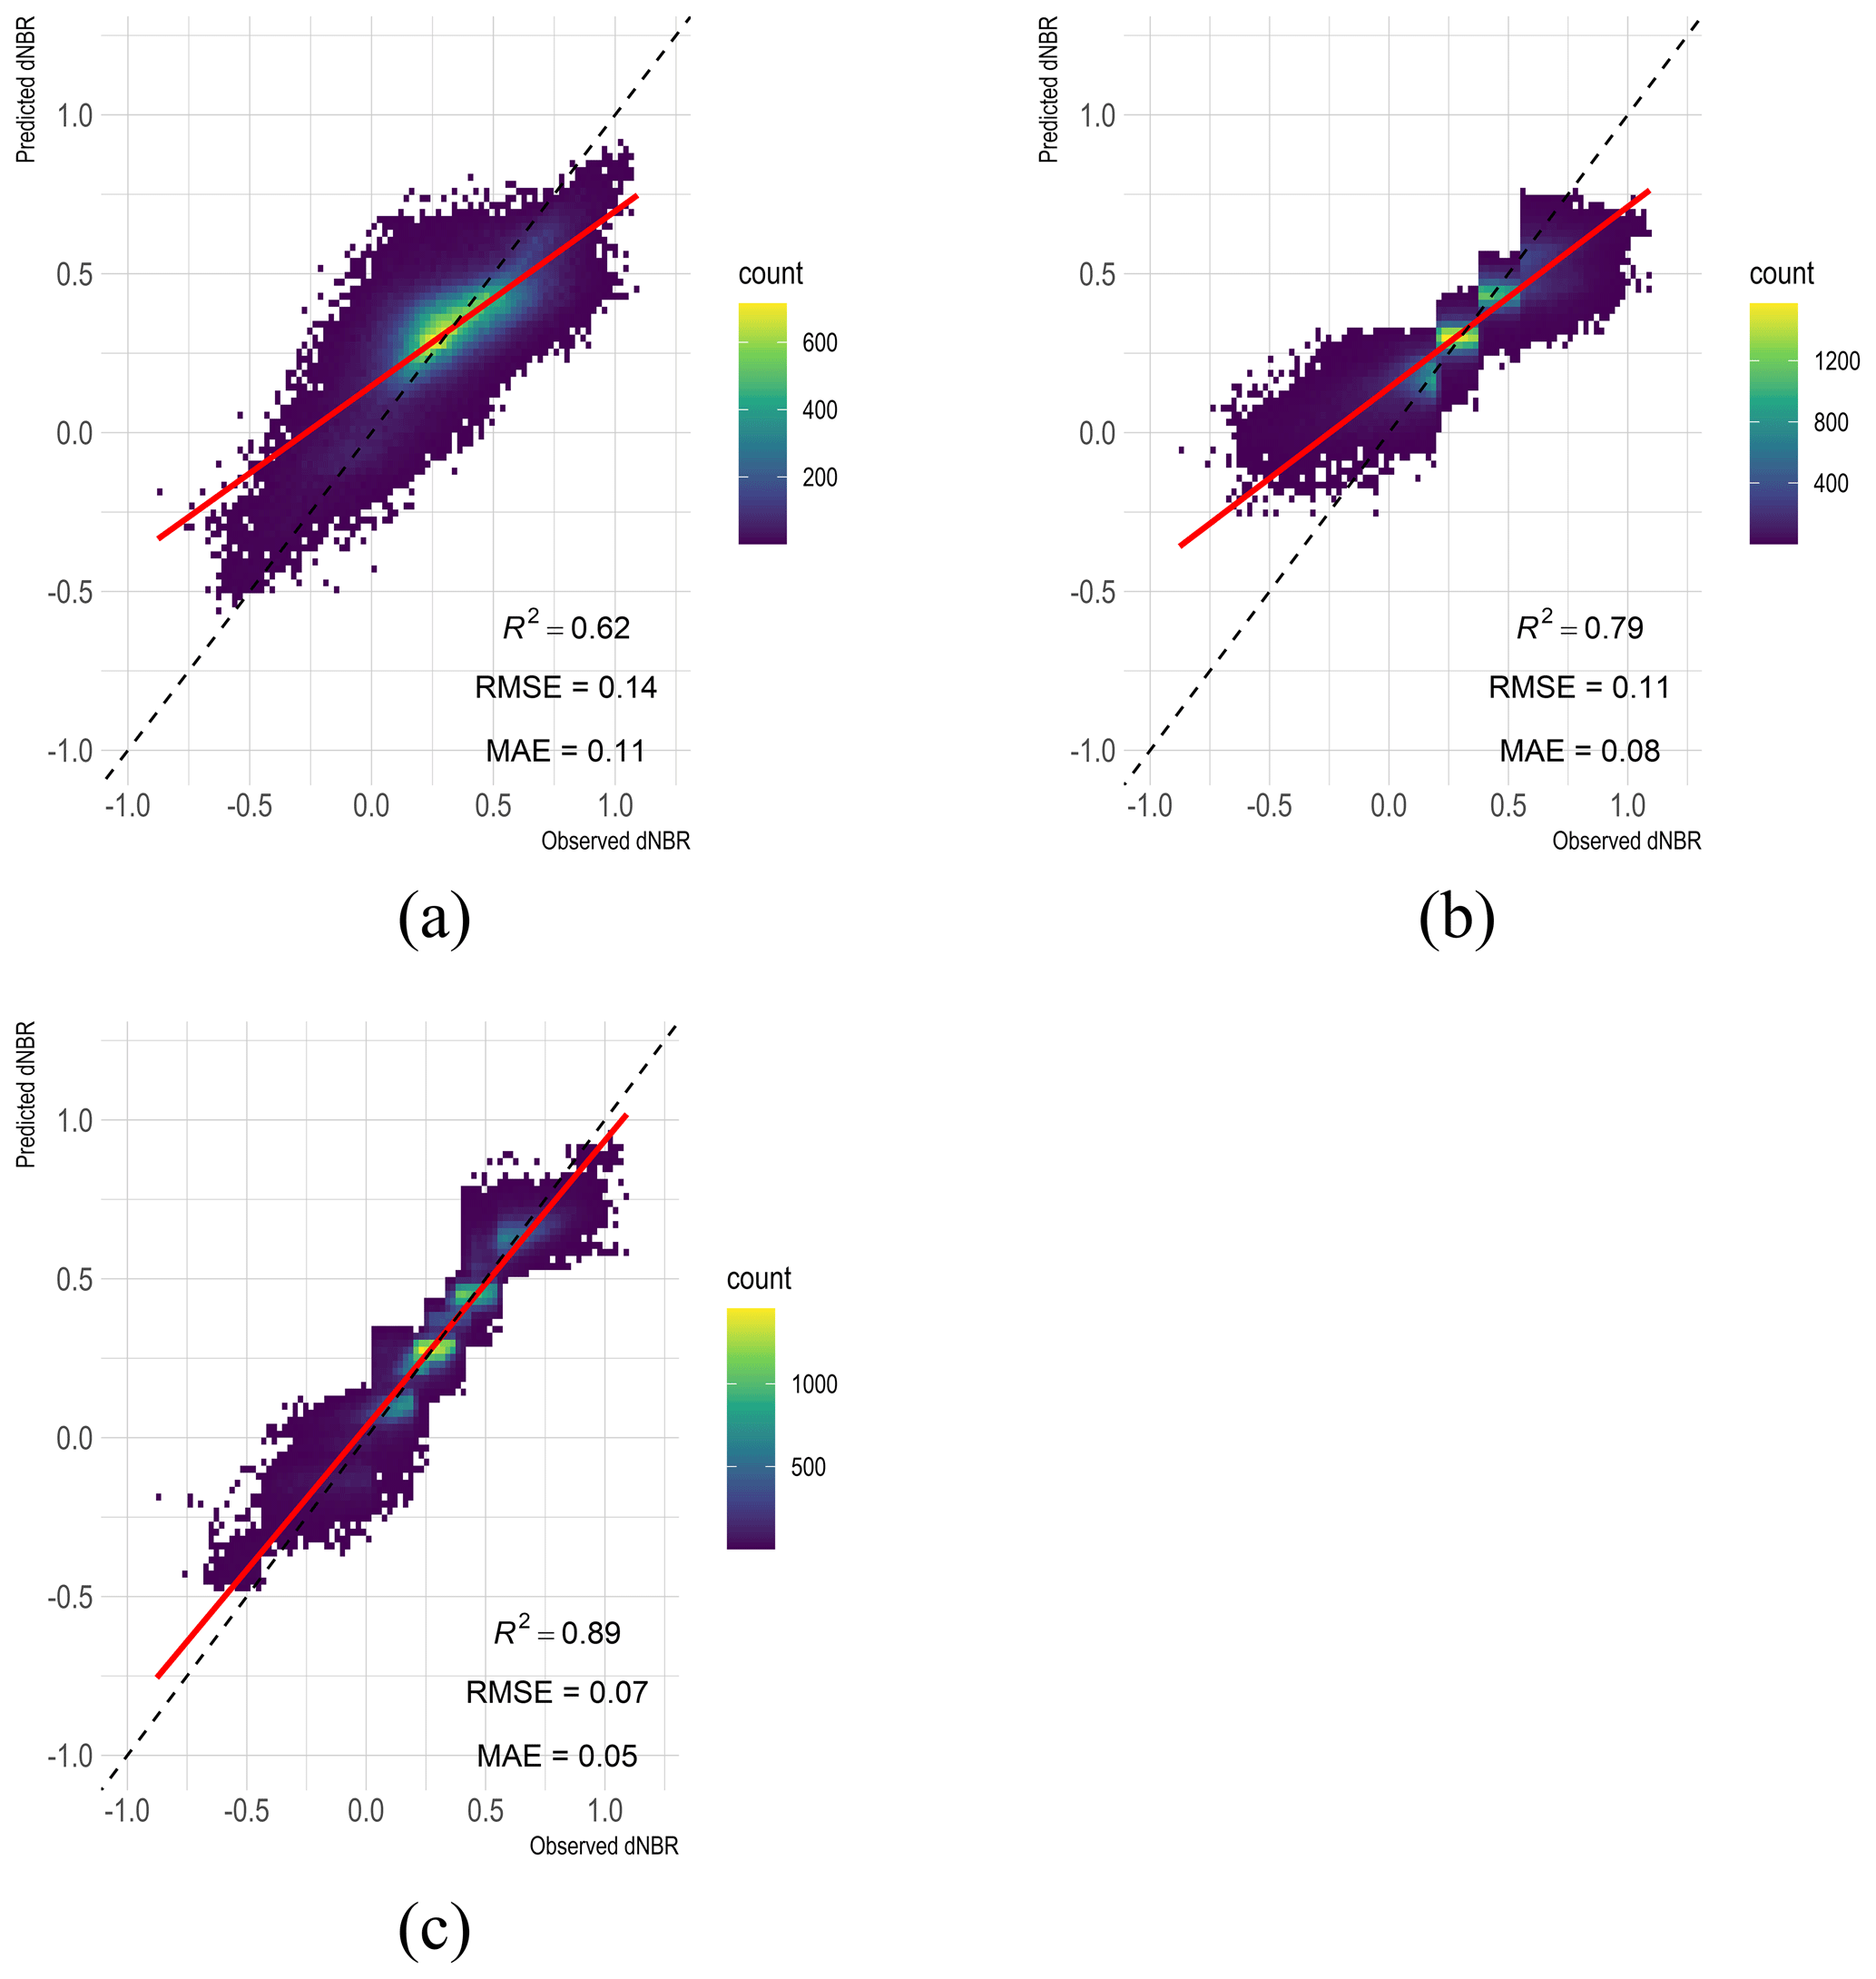
Figure 8Scatterplots of fire severity prediction versus observations based on the XGBoost model (a) without severity classification, (b) with severity classification using the fixed threshold, and (c) with severity classification using the vegetation-specific threshold.
We also evaluate the model's ability to capture the fire severity dynamics and magnitude in terms of mean fire severity for the selected wildfires. Figure 9a displays the dynamics of predicted fire severity based on the RF model with and without severity classification, while Fig. 9b–d shows the dynamics of associated performance of R2, RMSE, and MAE. The predictions without severity classifications are unable to capture the dynamics of mean fire severity, having the lowest R2 and highest RMSE and MAE values. The dynamics of the predicted fire severity with severity classification have a better correlation with the observed ones compared to those without severity classification, especially the results with severity classifications using the vegetation-specific threshold, which exhibit the best performance in predicting fire severity magnitude, with the largest R2 and lowest RMSE and MAE values. These results indicate that severity classification is an important process to improve the performance of fire severity prediction models.
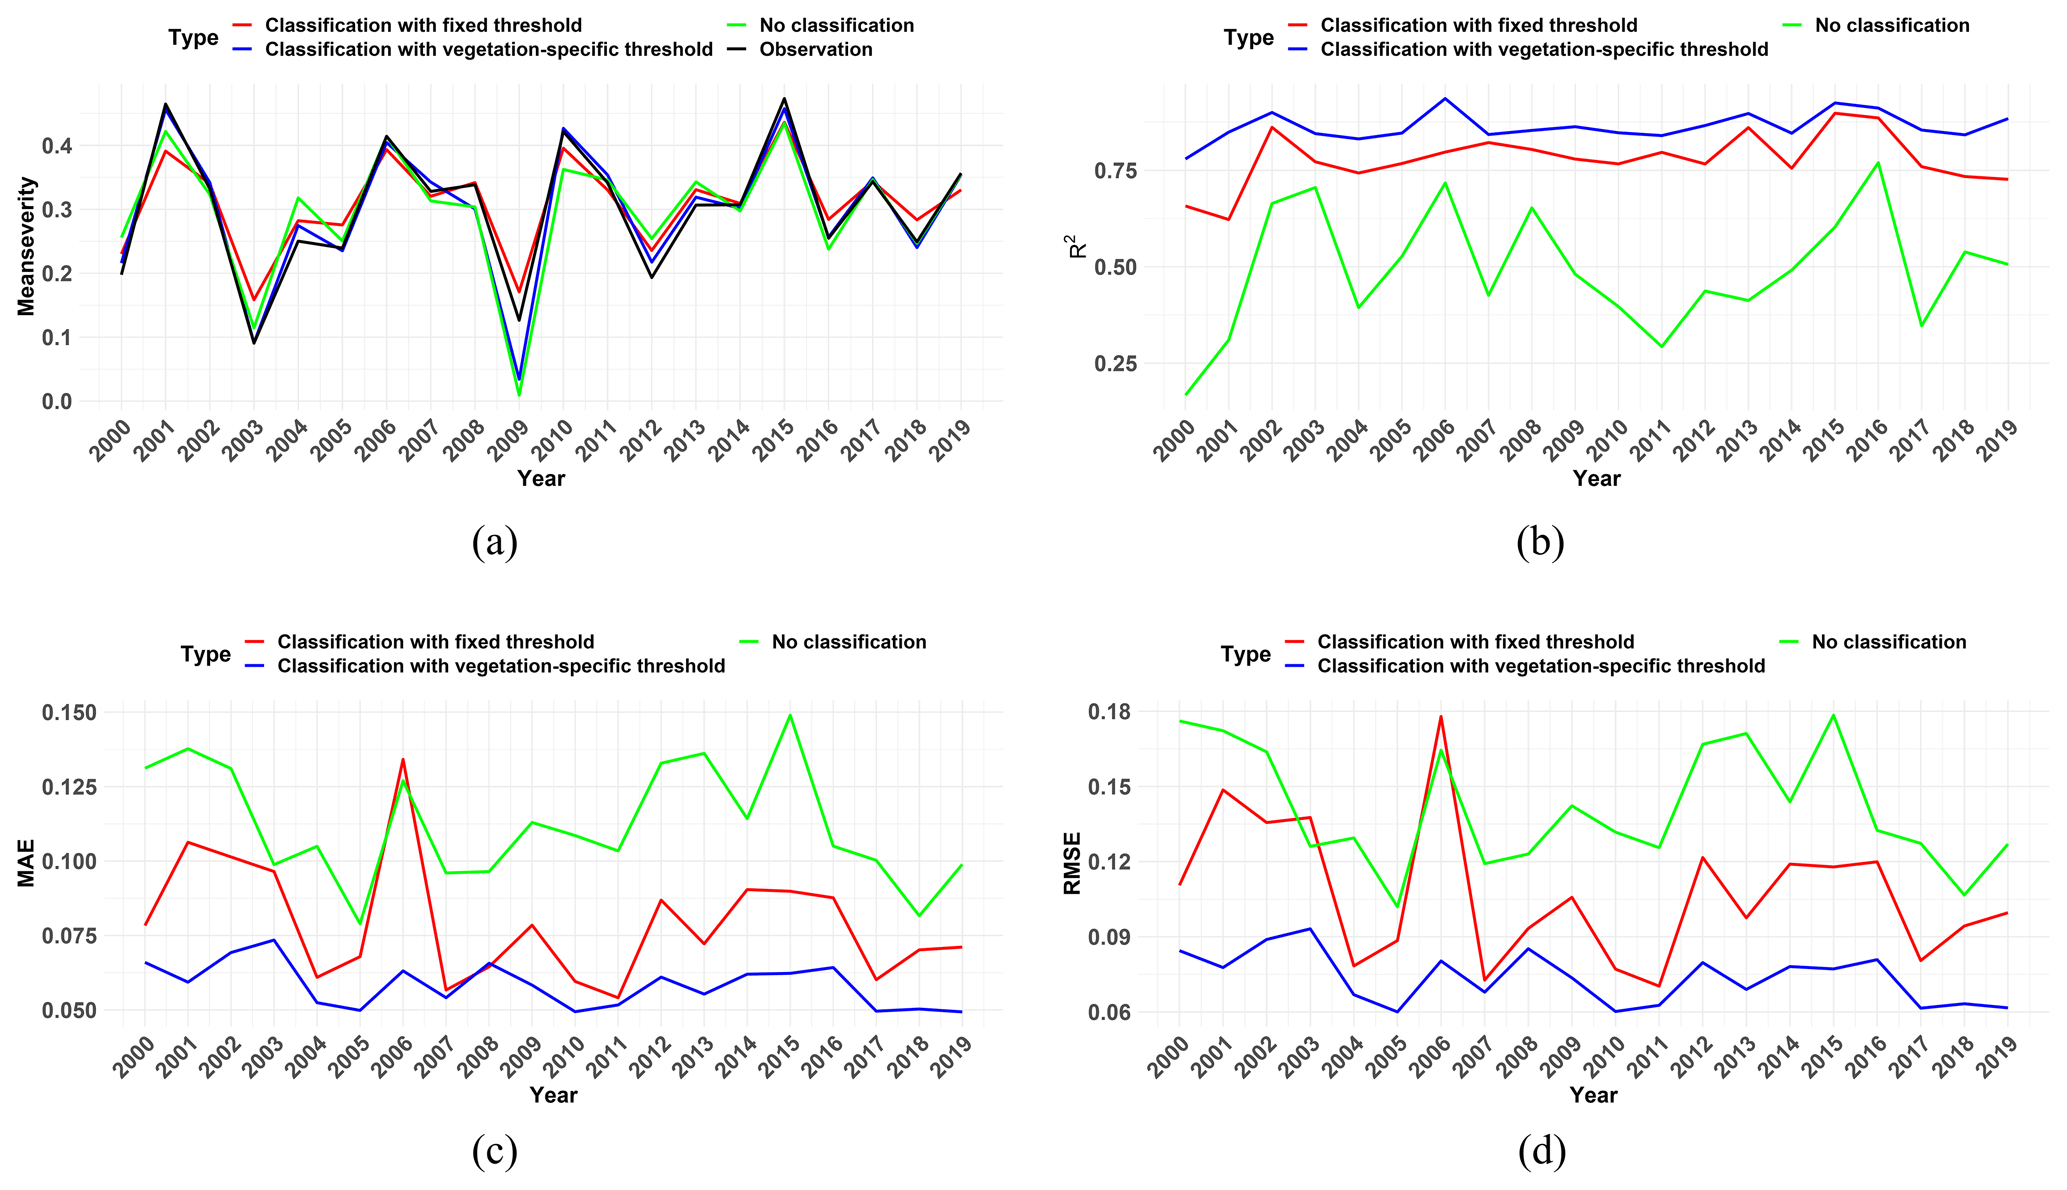
Figure 9Time series of (a) mean fire severity, (b) R2, (c) MAE, and (d) RMSE from 2000 to 2019 based on XGBoost models without severity classification and with severity classification using the fixed and vegetation-specific thresholds.
Figure 10 depicts a summary plot of estimated Shapley additive explanation (SHAP) values coloured according to the feature values, ranked from top to bottom by their importance. It is shown that preNBR is the most important feature in the model, followed by FFDI. KBDI is also crucial in the model. The topographic factors also contribute to the model. We found that having a high preNBR is associated with high and positive model output values, indicating that the larger preNBR is the prerequisite for more severe wildfire. Similar to the effect of preNBR on the model output, a high FFDI is always associated with high and positive SHAP values, which means that more-severe fire weather could lead to more destructive wildfires. Although some high KBDIs are found to be associated with negative SHAP values, the KBDI still shows a strong positive effect on the model output, reflecting the fact that the dry conditions could favour fire behaviour. Regarding the topography, large slopes and TPIs tend to have positive SHAP values, meaning the more severe fires tend to occur in steeper and higher positions.
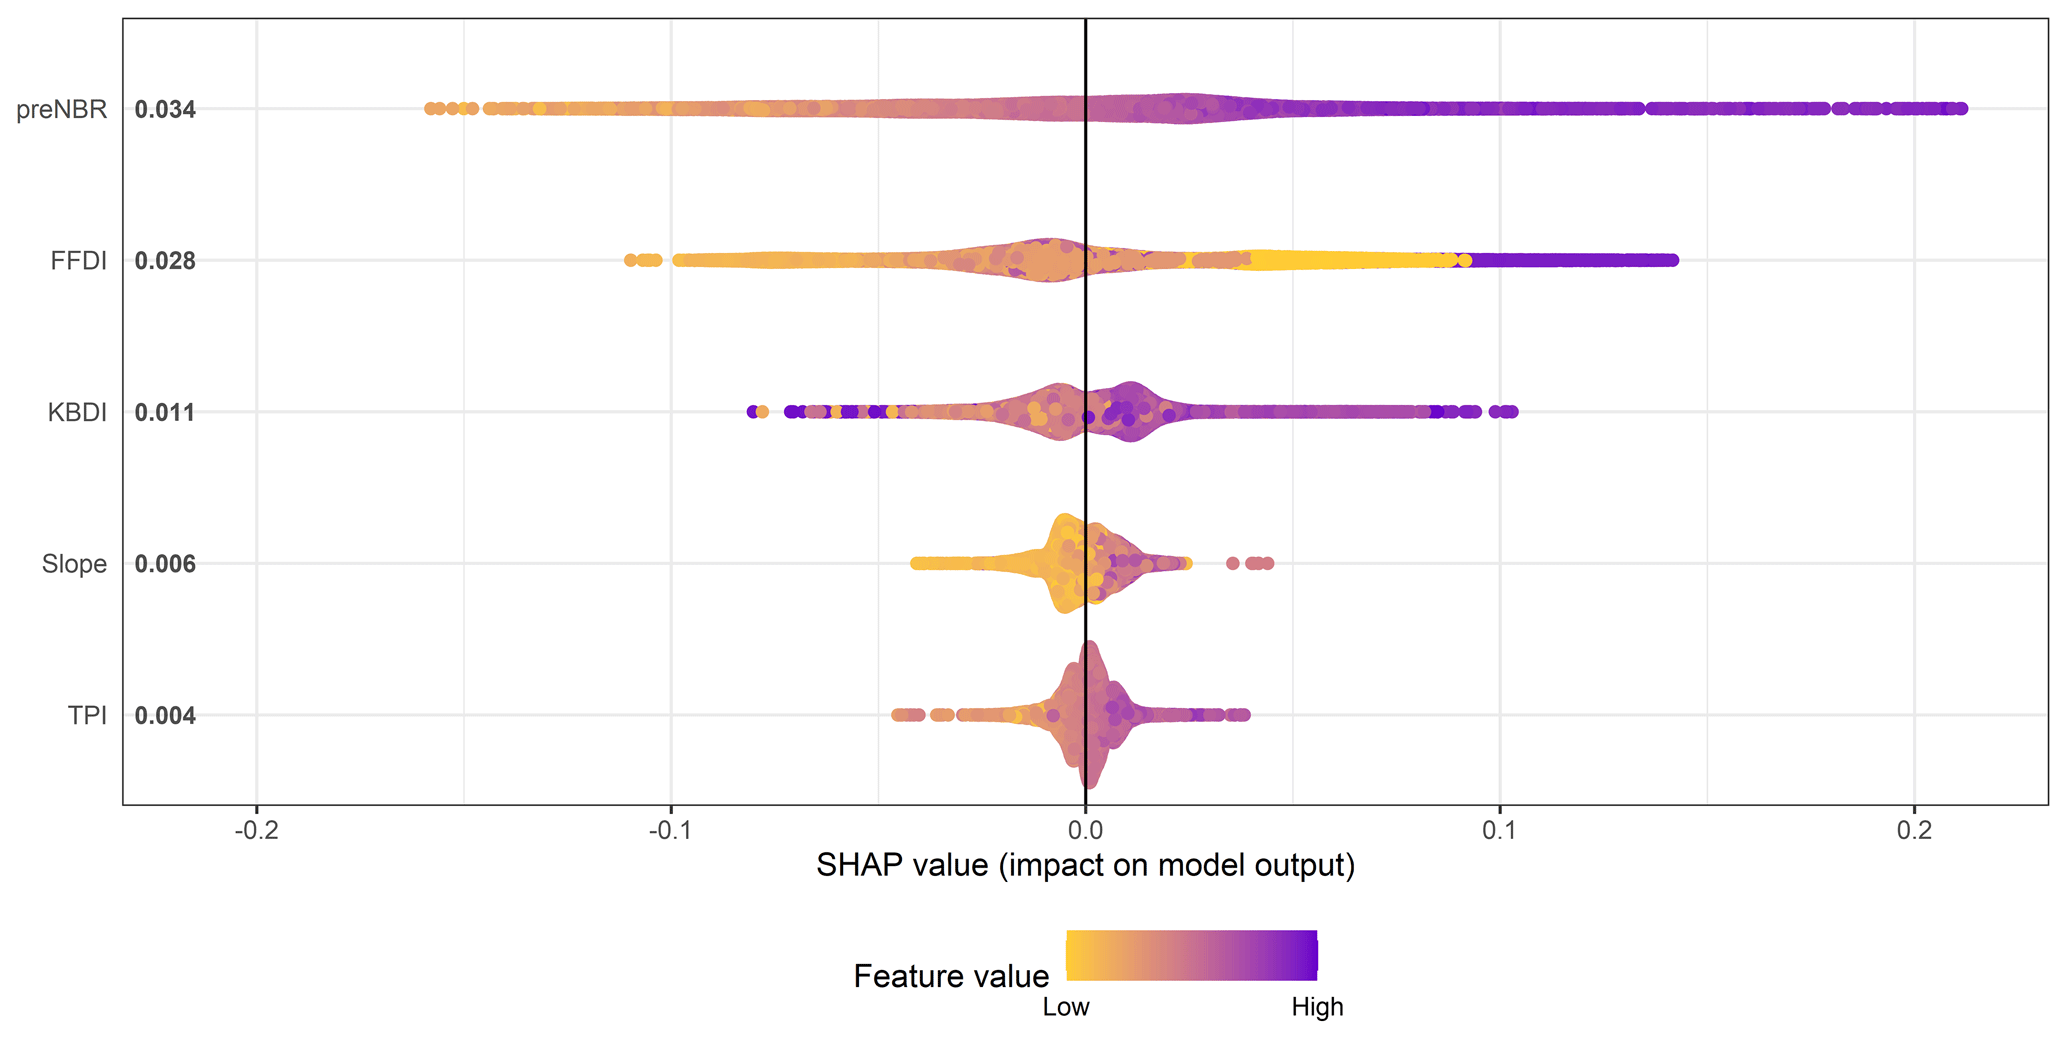
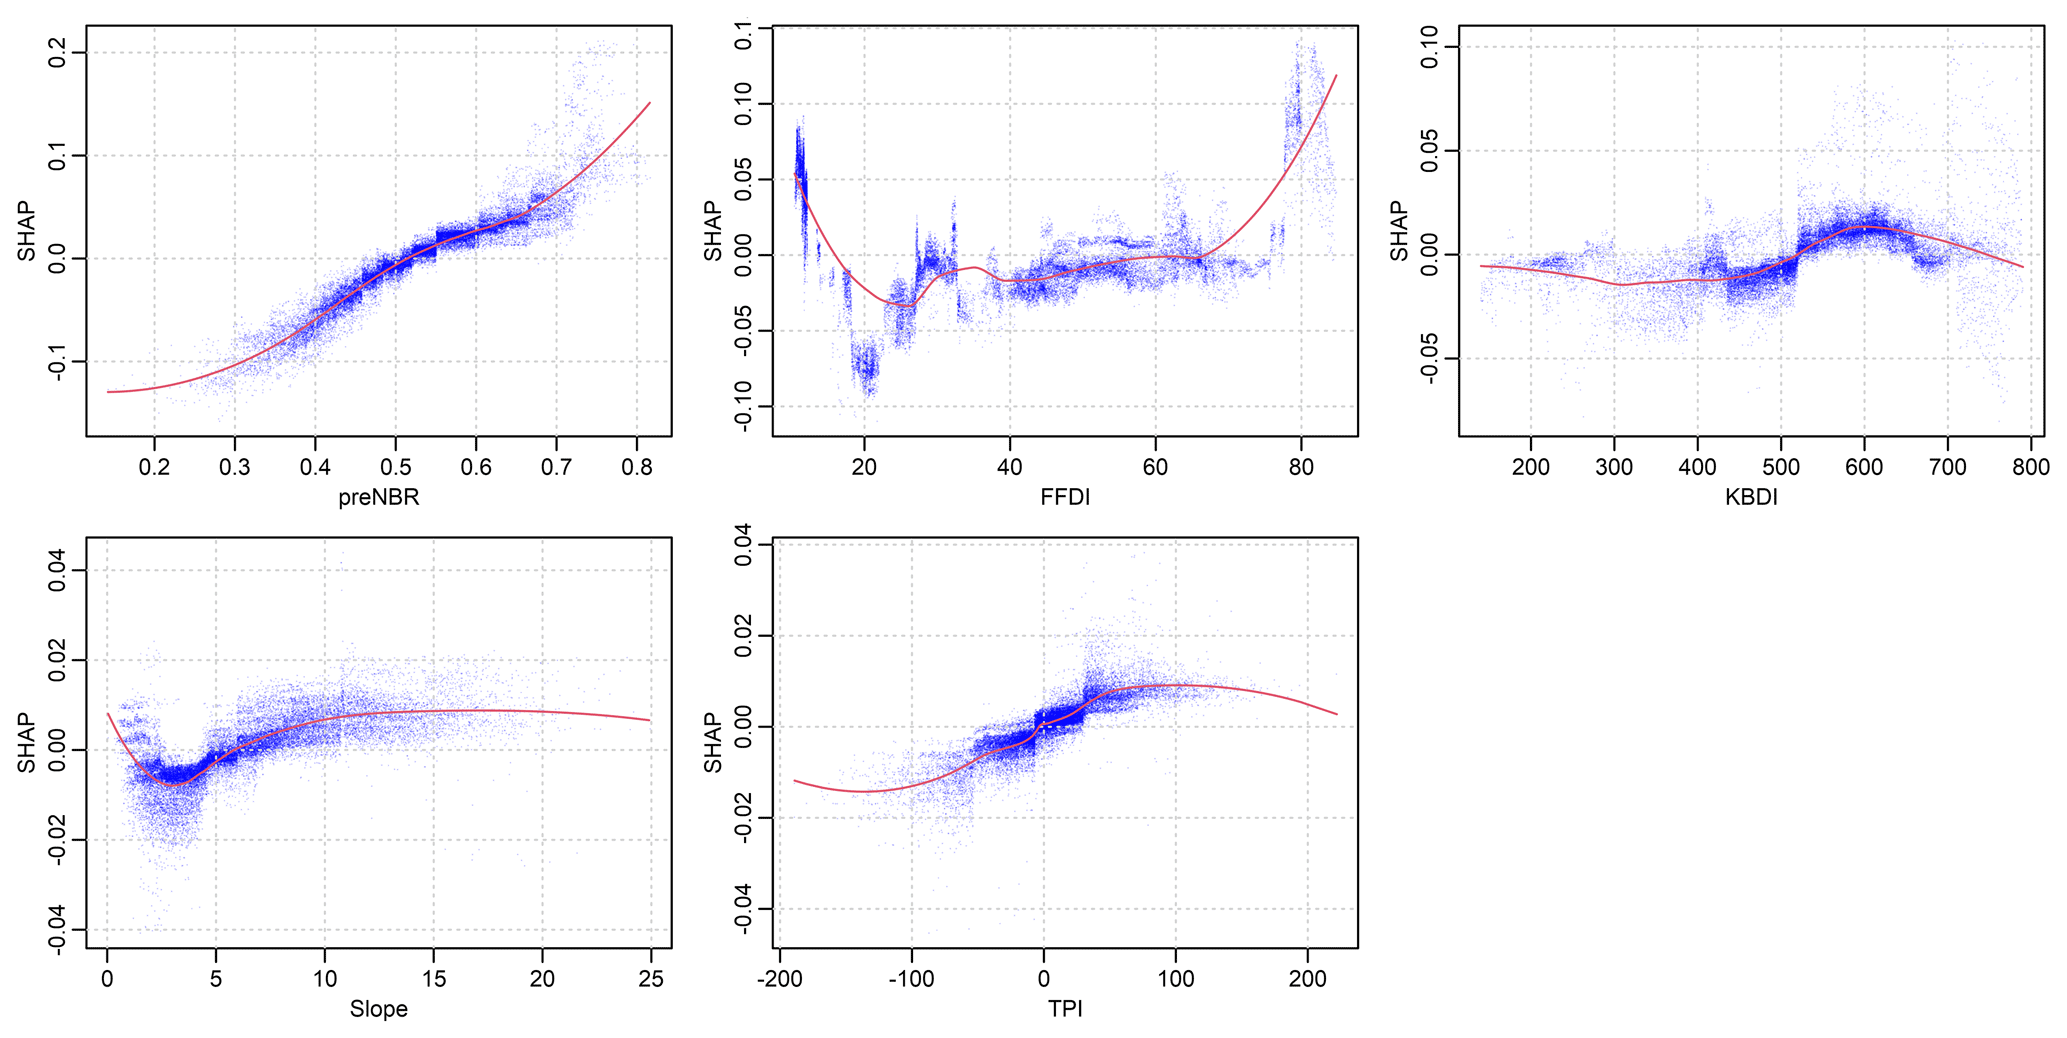
Figure 11 displays the partial-dependence plot (PDP) for each feature in the model. From Fig. 11, it can be seen that preNBR has a strong positive association with dNBR, implying that dNBR increases rapidly with preNBR. FFDI shows a non-monotonic relationship with dNBR, with a decreasing trend observed when it is less than 30, a steadily increasing trend between 30 to 65, and a significant increasing trend after it exceeds 65, suggesting that the fire weather dependence is more complex. The weak correlation between KBDI and dNBR within the range of KBDI lower than 400 indicates that KBDI has nearly no influence when it is below 400. The positive correlation between KBDI and dNBR within the range of 400 to 600 suggests that dry conditions would intensify the fire severity. However, a declining trend in KBDI is found when it exceeds 600, meaning that the impact of KBDI on dNBR becomes weaker. Regarding the slope, a negative association with dNBR is observed when it is below 3, while a positive relationship is found when it exceeds 3. TPI shows an overall positive association with dNBR. These findings demonstrate that fire severity tends to be higher on steeper slopes and on hilltops.
This study shows that the proposed predictive technique is capable of providing robust fire severity prediction information, which can be used for forecasting seasonal fire severity and, subsequently, the impacts on biodiversity and ecosystems under projected future climate conditions.
We find that the RF is effective in classifying fire events into different levels of fire severity, and XGBoost is a useful method to characterize the relationships between fire severity and explanatory variables (e.g. preNBR, FFDI, KBDI, slope, and TPI). Fire severity is a complex function of explanatory variable gradients, and these relationships may vary in different vegetation type and severity levels. PreNBR, an approximation of the pre-fire vegetation conditions, plays an important role in classification and prediction, as the change in NBR pre- and post-fire, i.e. dNBR, will be dependent on both the condition of the vegetation before the fire and the degree of change to vegetation after the fire. PreNBR, indicating the pre-fire vegetation condition, might be related to the pre-fire drought. For example, drought reduces the water content of foliage (Choat et al., 2018), thus reducing preNBR, so the maximum absolute change in NBR (dNBR) possible might be smaller during a drought year than a non-drought year. FFDI was found to be important in fire severity classification and prediction. Meteorological conditions were proven to be the most influential predictors in determining the magnitude of fire severity (Clarke et al., 2014; Bowman et al., 2021). FFDI is the index of fire weather severity during the fire season, thus it is workable in determining the potential burn severity level. KBDI is another important variable in fire severity classification. It is known that drought can create conditions that favour severe fires (Abram et al., 2021) and that the combined effects of fire and drought can contribute to plant population decline (Gallagher et al., 2022; Nolan et al., 2021) and ecosystem transformation (Keith et al., 2022). Severe drought conditions also directly contribute to forest flammability (Nolan et al., 2020). More importantly, the frequency, intensity, and duration of drought conditions are projected to shift under future climate changes (Ukkola et al., 2020). These changes in drought regimes will likely be associated with increases in the size, frequency, and severity of fires (Abram et al., 2021). TPI and slope, as important topographic factors, also have considerable influence on low fire severity. For example, Bradstock et al. (2010) found that burn severity is lower in valleys, probably due to the effects of wind protection and higher fuel moisture in moderating fire behaviour. Barker et al. (2018) found that the probability of low severity increased with slope. In this study, we find that fire severity tends to be higher on steeper slopes and with higher positions; this might be because steep slopes can intensify fire behaviour by creating a chimney effect that draws in air and accelerates the fire (Jolly et al., 2015). Besides, higher elevations generally have lower air pressure and reduced humidity, which help fire burn more intensely (Abatzoglou and Kolden, 2011; Holden et al., 2018). Additionally, vegetation on steep slopes can be thicker and more continuous, providing more fuel for the fire (Collins et al., 2009; Pausas and Fernández-Muñoz, 2012).
One limitation of this study is that it does not consider the vegetation vertical-structure parameters in the fire severity model, which have been shown to influence fire behaviour. Agee (1996) showed that manipulating forest structure can help to reduce the severity of fire events, e.g. by reducing crown bulk density, the high-severity fire would be effectively limited. Fang et al. (2015) evaluated the influences and relative importance of fire weather, topography, and vegetation structure on fire size and fire severity, which showed that fire weather was the dominant driving factor of fire size, while vegetation structure exerted a stronger influence on fire severity. The study by Fernández-Guisuraga et al. (2021) indicated that severe ecosystem damage was mainly driven by vegetation structure rather than topography; for example, high canopy density was the main driver of high burn severity. Detailed and accurate vegetation structure data require extensive field inventories and thus are mostly regionally restricted. With the development of Global Ecosystem Dynamics Investigation (GEDI) project, it is possible to derive reliable forest vertical-structure parameters from satellite images with relatively high spatial resolution and global coverage (Dubayah et al., 2020). An extension of this study should incorporate data from GEDI into the fire severity model, which would represent an advancement in understanding and predicting the impact of wildfires. Besides, topographic data derived from SRTM present its limits, especially in vegetated areas and terrain with pronounced slopes or certain aspects (Gorokhovich and Voustianiouk, 2006; Shortridge and Messina, 2011). The advances in DEM technology, as evidenced by the improvements in the SRTM data such as SRTM-derived 1 s and 3 s digital elevation models version 1.0 for Australia, and the introduction of global COPDEM30 and TanDEM-X data (Hawker et al., 2022) offer opportunities for refining fire–topography relationship analyses and potentially providing more precise fire severity prediction results. The introduction of vegetation-specific thresholds has proven to be beneficial for fire severity classification. The range of dNBR varies significantly with vegetation types, and thus applying a fixed threshold in dNBR would lead to a large number of misclassifications in fire severity levels. This kind of misclassification error is mitigated by the use of vegetation-specific thresholds in dNBR. The vegetation type also plays an important role in the RF model. The relative influence of vegetation type is larger than that of the topographic factors, while the standard deviation in vegetation type is the largest in the meantime. The relative influence of vegetation type and the deviation change with the number of vegetation types and its fractions in the fire event. For example, five vegetation types were affected in the 2002 wildfire, and the fractions of vegetation types are dry sclerophyll forests (shrubby sub-formation, 30 %), grassy woodlands (31 %), wet sclerophyll forests (grassy sub-formation, 23 %), dry sclerophyll forests (shrub/grass sub-formation, 14 %) and grasslands (2 %). In the 2019 wildfire, seven vegetation types were affected, but dry sclerophyll forests (shrubby sub-formation) account for 92 % of the burnt area. The relative influence of vegetation type in the 2002 wildfire is around 10 %, while it is only 5 % in the 2019 wildfire. This could also explain why no significant differences are found between fire severity maps using vegetation-specific thresholds and fixed thresholds in the 2019 wildfire. Since more than 90 % of the burnt area in the 2019 wildfire is covered by dry sclerophyll forests (shrubby sub-formation) and the fixed thresholds are adopted from the thresholds of dry sclerophyll forests (shrubby sub-formation), the fire severity classification for the 2019 wildfire is almost equal to the fire severity classification for dry sclerophyll forests (shrubby sub-formation).
This study develops a predictive technique that is capable of providing robust fire severity classification and prediction information for historical events, which also has the potential to forecast seasonal fire severity. The input variables for the model could be obtained from other forecast models: fire-weather-related variables can be extracted from the Weather Research and Forecasting (WRF) model. The NBR images are derived from Landsat 5, 7, and 8 in this study, while it is also applicable to other image sources based on the reflectance information from NIR and SWIR, such as the newly launched Landsat 9 and Sentinel-2 (Mallinis et al., 2018; Howe et al., 2022). Owing to the seasonality characteristics of preNBR, we can infer the preNBR in the fire season based on the historical preNBR time series derived from the image sources. The vegetation type and topographic factors are static variables, while the variables for calculating FFDI and KBDI, e.g. wind speed, relative humidity, precipitation, and air temperature, are available from WRF outputs. A quick assessment of fire severity of wildfires is accessible based on the proposed predictive technique, once the burnt area has been derived from the burnt area prediction models (Alkhatib, 2014; Castelli et al., 2015) or monitoring products (e.g. the MODIS MCD64A1 Burned Area data product).
With the rapid development of new technologies such as lidar and uncrewed aerial vehicles (UAVs), integration of data from these platforms can represent a promising avenue to enhance our understanding and management of wildfires. Lidar technology, with its ability to produce high-resolution vegetation structural and topography information could facilitate the accurate modelling of fire severity (Hudak et al., 2012). On the other hand, the agility and precision of UAVs in data collection enable real-time monitoring of fire spreading, which significantly enhances our ability to map burnt areas in real time (Zheng et al., 2019).
This study introduces the vegetation-specific thresholds in fire severity classification for wildfires over NSW, Australia. We use the pre-fire-season drought conditions and topography and the fire season meteorological conditions as inputs to build the predictive model, and the performance is validated by extreme gradient boosting (XGBoost) to predict the fire severity, proxied by dNBR.
Using the vegetation-specific thresholds, we were able to improve the classification accuracy in fire severity levels. Specifically, compared to the fire severity classifications from FESM over NSW, we found that fire severity classification results using vegetation-specific thresholds show good agreement with those from FESM, with accuracies of 0.64 and 0.76 in extreme- and high-severity classifications. Using a leave-one-out cross-validation, the severity classification results showed an improved classification accuracy of 0.75 based on the proposed vegetation-specific thresholds compared to those based on fixed thresholds (0.69). The predictive performance of the XGBoost model is improved as well based on the classification results, with the determination coefficient (R2) and mean absolute error (MAE) and root mean square error (RMSE) values of 0.89, 0.05, and 0.07, respectively. We show that preNBR is the most important variable in fire severity classification and prediction, followed by FFDI and KBDI. The PDP of FFDI and KBDI indicates that the likelihood of high severity increases when weather and drought conditions become more severe. From the responses of dNBR to topographic factors, the probability of high severity increases with slope and elevation. The role of vegetation type in fire severity prediction becomes more important for large fires where more diverse vegetation is affected.
The results demonstrate that the prediction technique performs well, predicting fire severity of historic fires (2000–2019) in the Australian state of NSW, while it also shows the potential to be applicable for seasonal fire severity forecasts, owing to the availability of the predictor variables in seasonal forecasting outputs. With the expected increase in wind speed, temperature, and drought conditions exhibited in future climate projections, this prediction technique can also be used to evaluate the variation in fire severity under climate change. Future challenges of this study include incorporating different variables, such as refined topography as well as weather and vegetation structure, from various data sources to improve the accuracy of fire severity prediction and to scale up the application of the developed model globally. In addition, the sensitivity analysis of the selected time window to define the fire event and obtain the associated weather conditions is promoted to improve our understanding of the relationship between weather conditions and fire occurrence. By adjusting the time window and possibly integrating more precise burn date data, we can work towards a more accurate and physically meaningful analysis of fire events and their contributing factors.
The R software library is available at https://doi.org/10.1007/978-0-387-75936-4 (Chambers, 2008).
The RandomForest package is available at https://doi.org/10.1023/A:1010933404324 (Breiman, 2001).
The XGBoost package is available at https://doi.org/10.1145/2939672.29397 (Chen et al., 2016).
The codes for modeling and analyzing are available from the corresponding author upon reasonable request.
The NSW National Parks and Wildlife Service (NPWS) Fire History – Wildfires and Prescribed Burns dataset is available at https://datasets.seed.nsw.gov.au/dataset/1d05e145-80cb-4275-af9b-327a1536798d (NSW Department of Climate Change, Energy, the Environment and Water, 2010).
The detailed vegetation distribution map over New South Wales, Australia is available from the corresponding author upon reasonable request.
The Topography data is available at https://doi.org/10.1029/2005RG000183 (Farr et al., 2007).
The weather data is available at https://doi.org/10.24381/cds.e2161bac (Muñoz Sabater, 2019).
KH: data curation, visualization, and writing – original draft preparation. XS: supervision, methodology, and writing – reviewing and editing. ENA: supervision, methodology, and writing – reviewing and editing. CM: methodology and writing – reviewing and editing. EN: data curation and writing – reviewing and editing. RVG: data curation and writing – reviewing and editing. FY: methodology and writing – reviewing and editing.
The contact author has declared that none of the authors has any competing interests.
Publisher's note: Copernicus Publications remains neutral with regard to jurisdictional claims made in the text, published maps, institutional affiliations, or any other geographical representation in this paper. While Copernicus Publications makes every effort to include appropriate place names, the final responsibility lies with the authors.
This research was supported by a National Science Foundation HDR award entitled “Collaborative Research: Near-term Forecast of Global Plant Distribution Community Structure and Ecosystem Function”. Kang He received the support of the China Scholarship Council for 4 years of PhD study at the University of Connecticut (under grant agreement no. 201906320068).
This research has been supported by the National Science Foundation (grant no. 1934712).
This paper was edited by Paolo Tarolli and reviewed by two anonymous referees.
Abatzoglou, J. T. and Kolden, C. A.: Climate change in western US deserts: potential for increased wildfire and invasive annual grasses, Rangeland Ecol. Manag., 64, 471–478, https://doi.org/10.2111/REM-D-09-00151.1, 2011.
Abatzoglou, J. T., Williams, A. P., and Barbero, R.: Global emergence of anthropogenic climate change in fire weather indices, Geophys. Res. Lett., 46, 326–336, https://doi.org/10.1029/2018GL080959, 2019.
Abram, N. J., Henley, B. J., Sen Gupta, A., Lippmann, T. J., Clarke, H., Dowdy, A. J., Sharples, J. J., Nolan, R. H., Zhang, T., Wooster, M. J., Wurtzel, J. B., Meissner, K. J., Pitman, A. J., Ukkola, A. M., Murphy, B. P., Tapper, N. J., and Boer, M. M.: Connections of climate change and variability to large and extreme forest fires in southeast Australia, Commun. Earth Environ., 2, 1–17, https://doi.org/10.1038/s43247-020-00065-8, 2021.
Agee, J. K.: The influence of forest structure on fire behavior, in: Proceedings of the 17th annual forest vegetation management conference, Redding, California, 16–18 January 1996, 52–68, https://ecoshare.info/wp-content/uploads/2021/02/Agee-1996-Conf-Proceedings.pdf (last access: 18 September 2022), 1996.
Alkhatib, A. A.: A review on forest fire detection techniques, Int. J. Distrib. Sens. N., 10, 597368, https://doi.org/10.1155/2014/597368, 2014.
Archibald, S., Lehmann, C. E., Gómez-Dans, J. L., and Bradstock, R. A.: Defining pyromes and global syndromes of fire regimes, P. Natl. Acad. Sci. USA, 110, 6442–6447, https://doi.org/10.1073/pnas.1211466110, 2013.
Barker, R., Price, O. F., Gill, A. M., and Bradstock, R. A.: Fire severity in a large wildfire is influenced by vegetation, terrain and weather, Landscape Ecol., 33, 1231–1247, https://doi.org/10.1007/s10980-018-0670-3, 2018.
Boby, L. A., Schuur, E. A., Mack, M. C., Verbyla, D., and Johnstone, J. F.: Quantifying fire severity, carbon, and nitrogen emissions in Alaska's boreal forest, Ecol. Appl., 20, 1633–1647, https://doi.org/10.1890/08-2295.1, 2010.
Bowman, D. M., Williamson, G. J., Gibson, R. K., Bradstock, R. A., and Keenan, R. J.: The severity and extent of the Australia 2019–20 Eucalyptus forest fires are not the legacy of forest management, Nat. Ecol. Evol., 5, 1003–1010, https://doi.org/10.1038/s41559-021-01464-6, 2021.
Bradstock, R. A., Hammill, K. A., Collins, L., and Price, O.: Effects of weather, fuel and terrain on fire severity in topographically diverse landscapes of south-eastern Australia, Landscape Ecol., 25, 607–619, https://doi.org/10.1007/s10980-009-9443-8, 2010.
Breiman, L.: Random forests, Mach. Learn., 45, 5–32, https://doi.org/10.1023/A:1010933404324, 2001.
Castelli, M., Vanneschi, L., and Popovič, A.: Predicting burned areas of forest fires: an artificial intelligence approach, Fire Ecol., 11, 106–118, https://doi.org/10.4996/fireecology.1101106, 2015.
Chambers, J. M.: Software for data analysis: Programming with R, Springer, New York, Vol. 2, https://doi.org/10.1007/978-0-387-75936-4, 2008.
Chen, T. and Guestrin, C.: Xgboost: A scalable tree boosting system, in: Proceedings of the 22nd ACM SIGKDD International Conference on Knowledge Discovery and Data Mining, 13–17 August 2016, San Francisco, California, USA, Association for Computing Machinery, 785–794, https://doi.org/10.1145/2939672.2939785, 2016.
Chen, T., He, T., Benesty, M., Khotilovich, V., Tang, Y., Cho, H., Chen, K., Mitchell, R., Cano, I., and Zhou, T.: Xgboost: Extreme gradient boosting, R package version 0.4-2, https://cran.ms.unimelb.edu.au/web/packages/xgboost/vignettes/xgboost.pdf (last access: 27 February 2022), 2015.
Choat, B., Brodribb, T. J., Brodersen, C. R., Duursma, R. A., López, R., and Medlyn, B. E.: Triggers of tree mortality under drought, Nature, 558, 531–539, https://doi.org/10.1038/s41586-018-0240-x, 2018.
Clarke, H., Tran, B., Boer, M. M., Price, O., Kenny, B., and Bradstock, R.: Climate change effects on the frequency, seasonality and interannual variability of suitable prescribed burning weather conditions in south-eastern Australia, Agr. Forest Meteorol., 271, 148–157, https://doi.org/10.1016/j.agrformet.2019.03.005, 2019.
Clarke, P. J., Knox, K. J., Bradstock, R. A., Munoz-Robles, C., and Kumar, L.: Vegetation, terrain and fire history shape the impact of extreme weather on fire severity and ecosystem response, J. Veg. Sci., 25, 1033–1044, https://doi.org/10.1111/jvs.12166, 2014.
Collins, B. M., Kelly, M., Van Wagtendonk, J. W., and Stephens, S. L.: Spatial patterns of large natural fires in Sierra Nevada wilderness areas, Landscape Ecol., 22, 545–557, https://doi.org/10.1007/s10980-006-9047-5, 2007.
Collins, B. M., Miller, J. D., Thode, A. E., Kelly, M., and van Wagtendonk, J. W.: Interactions among wildland fires in a long-established Sierra Nevada natural fire area, Ecosystems, 12, 114–128, https://doi.org/10.1007/s10021-008-9211-7, 2009.
Collins, L., Bradstock, R. A., and Penman, T. D.: Can precipitation influence landscape controls on wildfire severity? A case study within temperate eucalypt forests of south-eastern Australia, Int. J. Wildland Fire, 23, 9–20, https://doi.org/10.1071/WF12184, 2013.
Collins, L., Griffioen, P., Newell, G., and Mellor, A.: The utility of Random Forests for wildfire severity mapping, Remote Sens. Environ., 216, 374–384, https://doi.org/10.1016/j.rse.2018.07.005, 2018.
Collins, L., Bennett, A. F., Leonard, S. W., and Penman, T. D.: Wildfire refugia in forests: Severe fire weather and drought mute the influence of topography and fuel age, Glob. Change Biol., 25, 3829–3843, https://doi.org/10.1111/gcb.14735, 2019.
Collins, L., Clarke, H., Clarke, M. F., McColl Gausden, S. C., Nolan, R. H., Penman, T., and Bradstock, R.: Warmer and drier conditions have increased the potential for large and severe fire seasons across south-eastern Australia, Global Ecol. Biogeogr., 31, 1933–1948, https://doi.org/10.1111/geb.13514, 2022.
Dixon, D. J., Callow, J. N., Duncan, J. M. A., Setterfield, S. A., and Pauli, N.: Regional-scale fire severity mapping of Eucalyptus forests with the Landsat archive, Remote Sens. Environ., 270, 112863, https://doi.org/10.1016/j.rse.2021.112863, 2022.
Dowdy, A. J., Mills, G. A., Finkele, K., and De Groot, W.: Australian fire weather as represented by the McArthur forest fire danger index and the Canadian forest fire weather index, Centre for Australian Weather and Climate Research, Melbourne, 91 pp., https://cawcr.gov.au/technical-reports/CTR_010.pdf (last access: 3 May 2022), 2009.
Dubayah, R., Blair, J. B., Goetz, S., Fatoyinbo, L., Hansen, M., Healey, S., Hofton, M., Hurtt, G., Kellner, J., Luthcke, S., and Armston, J.: The Global Ecosystem Dynamics Investigation: High-resolution laser ranging of the Earth's forests and topography, Sci. Remote Sens., 1, 100002, https://doi.org/10.1016/j.srs.2020.100002, 2020.
Eidenshink, J., Schwind, B., Brewer, K., Zhu, Z. L., Quayle, B., and Howard, S.: A project for monitoring trends in burn severity, Fire Ecol., 3, 3–21, https://doi.org/10.4996/fireecology.0301003, 2007.
Enright, N. J., Fontaine, J. B., Bowman, D. M., Bradstock, R. A., and Williams, R. J.: Interval squeeze: Altered fire regimes and demographic responses interact to threaten woody species persistence as climate changes, Front. Ecol. Environ., 13, 265–272, https://doi.org/10.1890/140231, 2015.
Fang, L., Yang, J., Zu, J., Li, G., and Zhang, J.: Quantifying influences and relative importance of fire weather, topography, and vegetation on fire size and fire severity in a Chinese boreal forest landscape, Forest Ecol. Manag., 356, 2–12, https://doi.org/10.1016/j.foreco.2015.01.011, 2015.
Fang, L., Yang, J., White, M., and Liu, Z.: Predicting potential fire severity using vegetation, topography and surface moisture availability in a Eurasian boreal forest landscape, Forests, 9, 130, https://doi.org/10.3390/f9030130, 2018.
Farr, T. G., Rosen, P. A., Caro, E., Crippen, R., Duren, R., Hensley, S., Kobrick, M., Paller, M., Rodriguez, E., Roth, L., and Seal, D.: The shuttle radar topography mission, Rev. Geophys., 45, RG2004, https://doi.org/10.1029/2005RG000183, 2007.
Fernández-Guisuraga, J. M., Suárez-Seoane, S., García-Llamas, P., and Calvo, L.: Vegetation structure parameters determine high burn severity likelihood in different ecosystem types: A case study in a burned Mediterranean landscape, J. Environ. Manage., 288, 112462, https://doi.org/10.1016/j.jenvman.2021.112462, 2021.
Gallagher, R. V., Allen, S., Mackenzie, B. D., Yates, C. J., Gosper, C. R., Keith, D. A., Merow, C., White, M. D., Wenk, E., Maitner, B. S., He, K., Adams, V. M., and Auld, T. D.: High fire frequency and the impact of the 2019–2020 megafires on Australian plant diversity, Divers. Distrib., 27, 1166–1179, https://doi.org/10.1111/ddi.13265, 2021.
Gallagher, R. V., Allen, S. P., Mackenzie, B. D., Keith, D. A., Nolan, R. H., Rumpff, L., Nolan R. H., Rumpff L., Gosper C. R., Pegg G., van Leeuwen S., Ooi M. K. J., Yates C. J., Merow C., Williams R. J., Nikolopoulos E. I., Beaumont L. J., and Auld, T. D.: An integrated approach to assessing abiotic and biotic threats to post-fire plant species recovery: Lessons from the 2019–2020 Australian fire season, Global Ecol. Biogeogr., 31, 2056–2069, https://doi.org/10.1111/geb.13478, 2022.
García, M. L. and Caselles, V.: Mapping burns and natural reforestation using Thematic Mapper data, Geocarto Int., 6, 31–37, https://doi.org/10.1080/10106049109354290, 1991.
Giglio, L., Randerson, J. T., and van der Werf, G. R.: Analysis of daily, monthly, and annual burned area using the fourth-generation global fire emissions database (GFED4), J. Geophys. Res.-Biogeo., 115, 317–328, https://doi.org/10.1002/jgrg.20042, 2010.
Gill, A. M.: Fire and the Australian flora: A review, Aust. Forestry, 38, 4–25, https://doi.org/10.1080/00049158.1975.10675584, 1975.
Gómez, C., White, J. C., and Wulder, M. A.: Optical remotely sensed time series data for land cover classification: A review, ISPRS J. Photogramm., 116, 55–72, https://doi.org/10.1016/j.isprsjprs.2016.03.011, 2015.
Gorokhovich, Y. and Voustianiouk, A.: Accuracy assessment of the processed SRTM-based elevation data by CGIAR using field data from USA and Thailand and its relation to the terrain characteristics, Remote Sens. Environ., 104, 409–415, https://doi.org/10.1016/j.rse.2006.05.012, 2006.
Harris, L. and Taylor, A. H.: Topography, fuels, and fire exclusion drive fire severity of the Rim Fire in an old-growth mixed-conifer forest, Yosemite National Park, USA, Ecosystems, 18, 1192–1208, https://doi.org/10.1007/s10021-015-9890-9, 2015.
Hawker, L., Uhe, P., Paulo, L., Sosa, J., Savage, J., Sampson, C., and Neal, J.: A 30 m global map of elevation with forests and buildings removed, Environ. Res. Lett., 17, 024016, https://doi.org/10.1088/1748-9326/ac4d4f, 2022.
Hennessy, K., Lucas, C., Nicholls, N., Bathols, J., Suppiah, R., and Ricketts, J.: Climate change impacts on fire-weather in south-east Australia, Climate Impacts Group, CSIRO Atmospheric Research and the Australian Government Bureau of Meteorology, Aspendale, https://www.researchgate.net/profile/James-Ricketts-3/publication/252471836_Climate_Change_Impacts_on_Fire-Weather_in_South-East_Australia/links/54a86d870cf257a6360bdfea/Climate-Change-Impacts-on-Fire-Weather-in-South-East-Australia.pdf (last access: 19 September 2022), 2005.
Holden, Z. A., Morgan, P., and Evans, J. S.: A predictive model of burn severity based on 20 year satellite-inferred burn severity data in a large southwestern US wilderness area, Forest Ecol. Manag., 258, 2399–2406, https://doi.org/10.1016/j.foreco.2009.08.017, 2009.
Holden, Z. A., Swanson, A., Luce, C. H., Jolly, W. M., Maneta, M., Oyler, J. W., Warren, D. A., Parsons, R., and Affleck, D.: Decreasing fire season precipitation increased recent western US forest wildfire activity, P. Natl. Acad. Sci. USA, 115, E8349–E8357, https://doi.org/10.1073/pnas.1802316115, 2018.
Howe, A. A., Parks, S. A., Harvey, B. J., Saberi, S. J., Lutz, J. A., and Yocom, L. L.: Comparing Sentinel-2 and Landsat 8 for burn severity mapping in Western North America, Remote Sens.-Basel, 14, 5249, https://doi.org/10.3390/rs14205249, 2022.
Hudak, A. T., Strand, E. K., Vierling, L. A., Byrne, J. C., Eitel, J. U., and Martinuzzi, S.: Quantifying aboveground forest carbon pools and fluxes from repeat LiDAR surveys, Remote Sens. Environ., 123, 25–40, https://doi.org/10.1016/j.rse.2012.02.023, 2012.
Hudak, A. T., Ottmar, R. D., Vihnanek, R. E., Brewer, N. W., Smith, A. M., and Morgan, P.: The relationship of post-fire white ash cover to surface fuel consumption, Int. J. Wildland Fire, 22, 780–785, https://doi.org/10.1071/WF12150, 2013.
Jolly, W. M., Cochrane, M. A., Freeborn, P. H., Holden, Z. A., Brown, T. J., Williamson, G. J., and Bowman, D. M. J. S.: Climate-induced variations in global wildfire danger from 1979 to 2013, Nat. Commun., 6, 7537, https://doi.org/10.1038/ncomms8537, 2015.
Keeley, J. E.: Fire intensity, fire severity and burn severity: a brief review and suggested usage, Int. J. Wildland Fire, 18, 116–126, https://doi.org/10.1071/WF07049, 2009.
Keeley, J. E., Bond, W. J., Bradstock, R. A., Pausas, J. G., and Rundel, P. W.: Fire in Mediterranean ecosystems: Ecology, evolution and management, Cambridge University Press, https://doi.org/10.1017/CBO9781139033091, 2009
Keetch, J. J. and Byram, G. M.: A drought index for forest fire control, USDA Forest Service Research Paper SE-38, Asheville, NC, https://research.fs.usda.gov/treesearch/40 (last access: 26 April 2022), 1968.
Keith, D. A.: Ocean shores to desert dunes: the native vegetation of New South Wales and the ACT, Department of Environment and Conservation (NSW), ISBN 10: 0731367804, 2004.
Keith, D. A., Allen, S. P., Gallagher, R. V., Mackenzie, B. D., Auld, T. D., Barrett, S.,Buchan, A., English, V., Gosper, C., Kelly, D., McIllwee, A., Melrose, R. T., Miller, B. P., Neldner, V. J., Simpson, C. C., Tolsma, A. D., Rogers, D., van Leeuwen, S., White, M. D., Yates, C. J., and Tozer, M. G.: Fire-related threats and transformational change in Australian ecosystems, Global Ecol. Biogeogr., 31, 2070–2084, https://doi.org/10.1111/geb.13500, 2022.
Key, C. H. and Benson, N. C.: Landscape assessment (LA), FIREMON: Fire effects monitoring and inventory system, 164, LA-1, https://research.fs.usda.gov/treesearch/24066 (last access: 23 June 2022), 2006.
Lentile, L. B., Holden, Z. A., Smith, A. M., Falkowski, M. J., Hudak, A. T., Morgan, P., Lewis, S. A., Gessler, P. E., and Benson, N. C.: Remote sensing techniques to assess active fire characteristics and post-fire effects, Int. J. Wildland Fire, 15, 319–345, https://doi.org/10.1071/WF05097, 2006.
Lutes, D. C., Keane, R. E., Caratti, J. F., Key, C. H., Benson, N. C., Sutherland, S., and Gangi, L. J.: FIREMON: Fire effects monitoring and inventory system, Gen. Tech. Rep. RMRS-GTR-164, US Department of Agriculture, Forest Service, Rocky Mountain Research Station, Fort Collins, CO, https://research.fs.usda.gov/treesearch/24042 (last access: 24 June 2022), 2006.
Mallinis, G., Mitsopoulos, I., and Chrysafi, I.: Evaluating and comparing Sentinel 2A and Landsat-8 Operational Land Imager (OLI) spectral indices for estimating fire severity in a Mediterranean pine ecosystem of Greece, GIsci. Remote Sens., 55, 1–18, https://doi.org/10.1080/15481603.2017.1354803, 2018.
McArthur, A. G.: Fire behaviour in eucalypt forests, Commonwealth of Australia, Forest and Timber Bureau Leaflet 107, Canberra, ACT, Australia, https://www.cabidigitallibrary.org/doi/full/10.5555/19670604037 (last access: 1 July 2022), 1967.
Miller, J. D., Knapp, E. E., Key, C. H., Skinner, C. N., Isbell, C. J., Creasy, R. M., and Sherlock, J. W.: Calibration and validation of the relative differenced Normalized Burn Ratio (RdNBR) to three measures of fire severity in the Sierra Nevada and Klamath Mountains, California, USA, Remote Sens. Environ., 113, 645–656, https://doi.org/10.1016/j.rse.2008.11.009, 2009.
Morgan, P., Keane, R. E., Dillon, G. K., Jain, T. B., Hudak, A. T., Karau, E. C., Sikkink, P. G., Holden, Z. A., and Strand, E. K.: Challenges of assessing fire and burn severity using field measures, remote sensing and modelling, Int. J. Wildland Fire, 23, 1045–1060, https://doi.org/10.1071/WF13058, 2014.
Muñoz Sabater, J.: ERA5-Land hourly data from 1950 to present, Copernicus Climate Change Service (C3S) Climate Data Store (CDS) [data set], https://doi.org/10.24381/cds.e2161bac, 2019.
Nolan, R. H., Boer, M. M., Collins, L., Resco de Dios, V., Clarke, H. G., Jenkins, M., Kenny, B., and Bradstock, R. A.: Causes and consequences of eastern Australia's 2019–20 season of mega-fires, Glob. Change Biol., 26, 1039–1041, https://doi.org/10.1111/gcb.14987, 2020.
Nolan, R. H., Collins, L., Leigh, A., Ooi, M. K., Curran, T. J., Fairman, T. A., Resco de Dios, V., and Bradstock, R.: Limits to post-fire vegetation recovery under climate change, Plant Cell Environ., 44, 3471–3489, https://doi.org/10.1111/pce.14176, 2021.
NSW Department of Climate Change, Energy, the Environment and Water: NPWS Fire History - Wildfires and Prescribed Burns, SEED [data set], https://datasets.seed.nsw.gov.au/dataset/1d05e145-80cb-4275-af9b-327a1536798d (last access: 8 June 2022), 2010.
Pausas, J. G. and Fernández-Muñoz, S.: Fire regime changes in the Western Mediterranean Basin: from fuel-limited to drought-driven fire regime, Climatic Change, 110, 215–226, https://doi.org/10.1007/s10584-011-0060-6, 2012.
Shine, J.: Statement regarding Australian bushfires, https://www.science.org.au/news-and-events/news-and-media-releases/australian-bushfires-why-they-are-unprecedented, last access: 4 February 2020.
Shortridge, A. and Messina, J.: Spatial structure and landscape associations of SRTM error, Remote Sens. Environ., 115, 1576–1587, https://doi.org/10.1016/j.rse.2011.02.017, 2011.
Soverel, N. O., Perrakis, D. D., and Coops, N. C.: Estimating burn severity from Landsat dNBR and RdNBR indices across western Canada, Remote Sens. Environ., 114, 1896–1909, https://doi.org/10.1016/j.rse.2010.03.013, 2010.
Speer, M. S., Wiles, P., and Pepler, A.: Low pressure systems off the New South Wales coast and associated hazardous weather: establishment of a database, Aust. Meteorol. Ocean., 58, 29, https://doi.org/10.22499/2.5801.004, 2009.
Takeuchi, W., Darmawan, S., Shofiyati, R., Khiem, M. V., Oo, K. S., Pimple, U., and Heng, S.: Near-real time meteorological drought monitoring and early warning system for croplands in Asia, in: Asian Conference on Remote Sensing 2015: Fostering Resilient Growth in Asia, Quezon City, Metro Manila, Philippines, 24–28 October 2015, Vol. 1, 171–178, https://www.researchgate.net/profile/Uday-Pimple/publication/313647536_NEAR-REAL_TIME_
METEOROLOGICAL_DROUGHT_MONITORING_AND_
EARLY_WARNING_SYSTEM_FOR_CROPLANDS_IN_
ASIA/links/58a1675592851c7fb4bf51d3/NEAR-REAL-TIME-
METEOROLOGICAL-DROUGHT-MONITORING-AND-
EARLY-WARNING-SYSTEM-FOR-CROPLANDS-IN-ASIA.pdf (last access: 3 May 2022), 2015.
Tran, B. N., Tanase, M. A., Bennett, L. T., and Aponte, C.: Evaluation of spectral indices for assessing fire severity in Australian temperate forests, Remote Sens.-Basel, 10, 1680, https://doi.org/10.3390/rs10111680, 2018.
Ukkola, A. M., De Kauwe, M. G., Roderick, M. L., Abramowitz, G., and Pitman, A. J.: Robust future changes in meteorological drought in CMIP6 projections despite uncertainty in precipitation, Geophys. Res. Lett., 47, e2020GL087820, https://doi.org/10.1029/2020GL087820, 2020.
Wang, C. and Glenn, N. F.: Estimation of fire severity using pre-and post-fire LiDAR data in sagebrush steppe rangelands, Int. J. Wildland Fire, 18, 848–856, https://doi.org/10.1071/WF08173, 2009.
Weiss, A.: Topographic position and landforms analysis, in: Poster presentation, ESRI user conference, San Diego, CA, USA, 9–13 July 2001, Vol. 200, https://www.jennessent.com/downloads/TPI-poster-TNC_18x22.pdf (last access: 4 April 2022), 2001.
Zheng, D., Jiang, Y., and Cheng, T.: UAV-based remote sensing technology in the rapid monitoring of forest fires, Int. J. Remote Sens., 40, 4257–4275, https://doi.org/10.11834/jrs.20210351, 2019.