the Creative Commons Attribution 4.0 License.
the Creative Commons Attribution 4.0 License.
 | 10 Sep 2024
Shoreline and land use–land cover changes along the 2004-tsunami-affected South Andaman coast: understanding changing hazard susceptibility
Vikas Ghadamode
Aruna Kumari Kondarathi
Kirti Srivastava
The 2004 tsunami affected the South Andaman coast, causing it to experience dynamic changes in the coastal geomorphology and making the region vulnerable. We focus on pre-and post-tsunami shoreline and land use–land cover changes from 2004, 2005, and 2022 to analyze the dynamic change in hazard. We used General Bathymetric Chart of the Ocean (GEBCO) data to calculate run-up [m], arrival times [min], and inundation [m] at a few locations using three tsunamigenic earthquake source parameters, namely the 2004 Sumatra, 1941 North Andaman, and 1881 Car Nicobar earthquakes. The Digital Shoreline Analysis System is used for the shoreline change estimates. Landsat data are used to calculate shoreline and land use–land cover (LULC) change in five classes, namely built-up areas, forests, inundation areas, croplands, and water bodies during the above period. We examine the correlation between the LULC changes and the dynamic change in shoreline due to population flux, infrastructural growth, and gross state domestic product growth. The Indian industry estimates the Andaman and Nicobar Islands losses exceeded INR 10 billion during 2004, which would today see a 5-fold increase in economic loss due to a doubling of built-up area, a 3-fold increase in tourist inflow, and population density growth. The unsustainable decline in the forest cover, mangroves, and cropland would affect sustainability during a disaster despite coastal safety measures.
- Article
(16527 KB) - Full-text XML
-
Supplement
(1878 KB) - BibTeX
- EndNote


Coastal shorelines are dynamic and highly vulnerable to erosion and accretion caused by hydrodynamic, tectonic, geomorphic, and climate forcing, including tsunamis, cyclones, flooding, storm surges, wave action, wind and tide changes, and sea level variations (Nayak, 2002; Boak and Turner, 2005; Kumar et al., 2010; Mukhopadhyay et al., 2011). In addition to natural coastal processes, coastal resources are constantly under stress due to anthropogenic activities, such as industrialization, port construction, beach sand mining, garbage dumping, urbanization, trade, tourism, and recreational activities, which significantly impact the shoreline and result in damage to natural ecosystems (Yi et al., 2018; Davis, 2019). It is important to regularly monitor spatiotemporal, land use–land cover (LULC), and geomorphic features along shorelines (Moran, 2003; Cooper et al., 2004; Scheffers et al., 2005; Jayakumar and Malarvannan, 2016). Several studies have analyzed various coastal processes including mapping shoreline change, LULC change detection, and analysis of geomorphological landforms using satellite data. The temporal multispectral satellite data allow for the identification of regions undergoing erosion or accretion change (Misra and Balaji, 2015; Kumari et al., 2012; Tonisso et al., 2012; Mani Murali et al., 2013; Sudha Rani et al., 2015; Rowland et al., 2022; Thiéblemont et al., 2021). The Mw 9.3 undersea earthquake on 26 December 2004 near the coast of Sumatra, Indonesia, triggered the Indian Ocean tsunami and caused massive destruction of the coastal ecosystem in the Andaman region (Sheth et al., 2006; Ramalanjaona, 2011). Several researchers have analyzed shoreline and geomorphological changes due to the 2004 Sumatra tsunami using remote sensing data (Kumari et al., 2012; Yuvaraj et al., 2014; Yunus and Narayana, 2015; Yunus et al., 2016).
Since the 2004 tsunami, the Andaman and Nicobar Islands have experienced notable population growth, infrastructural development, and flourishing tourism activities (Yuvaraj et al., 2014). The development is profound in the South Andaman region. This is a cause of concern for the tsunami vulnerability as the region is prone to large earthquakes and is a seismotectonically active plate boundary. In this study, we compute tsunami arrival times, run-up heights, and inundation extent along the South Andaman region. We also analyzed dynamic vulnerability using temporal and spatial changes in shoreline and LULC for the tsunami-affected areas (Velmurugan et al., 2006; Ghadamode et al., 2022). The analysis covers three time periods (2004 – pre-tsunami, 2005 – post-tsunami, and 2022 –current state) of shoreline changes using multi-temporal Landsat data employing the end point rate (EPR) and net shoreline movement (NSM) methods (Himmelstoss et al., 2021) and LULC changes. A relationship between LULC changes and vital socioeconomic factors such as population dynamics, tourism trends, and the gross state domestic product (GSDP) is established to assess the potential future impacts of tsunamis in the region. The results can provide actionable insights to the policymakers, coastal planners, and stakeholders in disaster management and sustainable coastal development.
The South Andaman region, with ∼1262 km2 in area and a 413 km coastline, is the southernmost island of the Great Andaman, where most of the population and infrastructure of Andaman Island are centered. As per the 2011 Indian census, South Andaman had a population of 238 142 people, which increased to 266 900 in 2021 (estimate based on https://www.census2011.co.in, last access: 26 August 2024). The most habitable areas in the eastern part of South Andaman are located on low lands at bay heads, in addition to the higher slopes bordering bays and coastal flat lands (Ghosh et al., 2004), which experienced devastation and losses during the 2004 tsunami (Fig. 1). We selected 13 locations, namely South Point in Port Blair, Rutland Island, Corbyn's Cove beach, Madhuban Bay, Brichgunj, Chidiya Tapu, Tirupati Temple, Wandoor Jetty, Bamboo Flat, Potatang, Shoal Bay, Radhanagar Beach, and Govinda Nagar (Fig. 1), for vulnerability assessment in the present study.
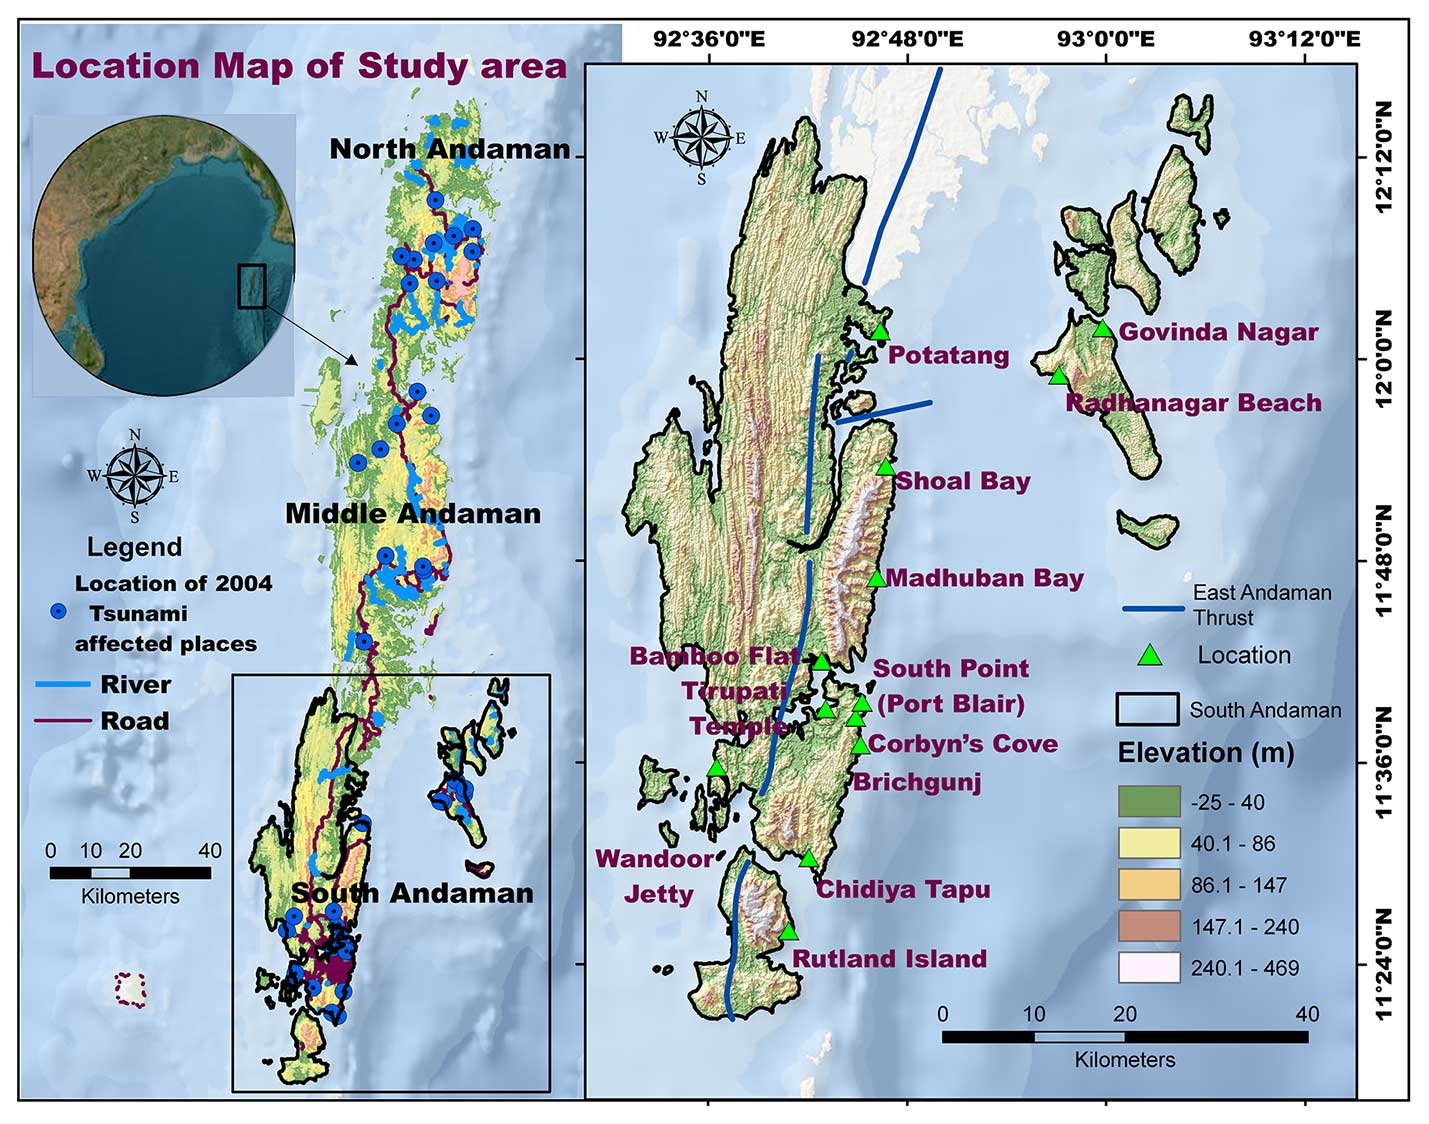
Figure 1Location map of the South Andaman region (© Google Maps (2023) and © Google Earth (2023)).
The tectonic activity and weathering processes have influenced the region's topography growth and evolution (Curray, 2005; Bandopadhyay and Carter, 2017). The East Andaman Thrust, also called the East Boundary Thrust, is a linear or curvilinear ∼500 km long fault zone and is the locus of ongoing convergent and crustal deformation along the Sunda–Andaman plate boundary. This structure is pivotal in creating accretionary prisms within the outer-arc ridge of the Andaman and Nicobar subduction zones (Fig. 1; Bhat et al., 2023).
The structure-bound major geomorphological features in South Andaman include hills, valleys, beaches, mangroves, and coral reefs (Fig. 2a). The highest peak on the island is Mount Harriet, at approximately 1200 m (3937 ft) (https://southandaman.nic.in/, last access: 26 August 2024). The northwestern and northeastern parts of South Andaman are highly and moderately dissected, whereas the southern part has low dissected structural hills and valleys (Fig. 2a–d). The upper slopes of the region are covered with high dissected structural hills with dense, pristine forest (Fig. 2a). The slope ranges between 0 and 44.9°, with lower slopes in the coastal region mostly inhabited and undergoing rapid coastline modification and land use change. The north, northeast, and southern portions of South Andaman have the steepest slope and relief area, while the eastern, southeastern, and western parts have relatively lower slopes (Fig. 2b and c). The island has a rough coastline with various bays, inlets, and headlands (Fig. 2). The younger coastal plain is a relatively flat and low-lying area adjacent to the coastline, which is formed through the accumulation of sediments brought by the ocean (Fig. 2e). A wave-cut platform, formed by the erosive action of waves, is a flat or gently sloping rock surface that is found along South Point coastlines in Port Blair (Fig. 2f). These platforms can be exposed at low tide, which gradually wear away the rock over time and are unique features of rocky coastlines. Coral reefs along the coast contribute to the formation of sandy beaches and barrier islands (Reguero et al., 2018). Mangrove forests are found on coasts in South Andaman Island, primarily in the salty water and muddy sediment lagoons and in the tidal zone (Fig. 2g). Mangroves are crucial for stabilizing coastal ecosystems and providing habitat for various species. Wandoor, Chidiya Tapu, and Sippighat are some notable locations of mangrove forests in South Andaman coastal areas. The coastal plains in South Andaman are dynamic and prone to tsunamis due to their location and active plate boundary. Therefore, studying shoreline change and LULC change is especially important because of the potential impacts on local communities and ecosystems.
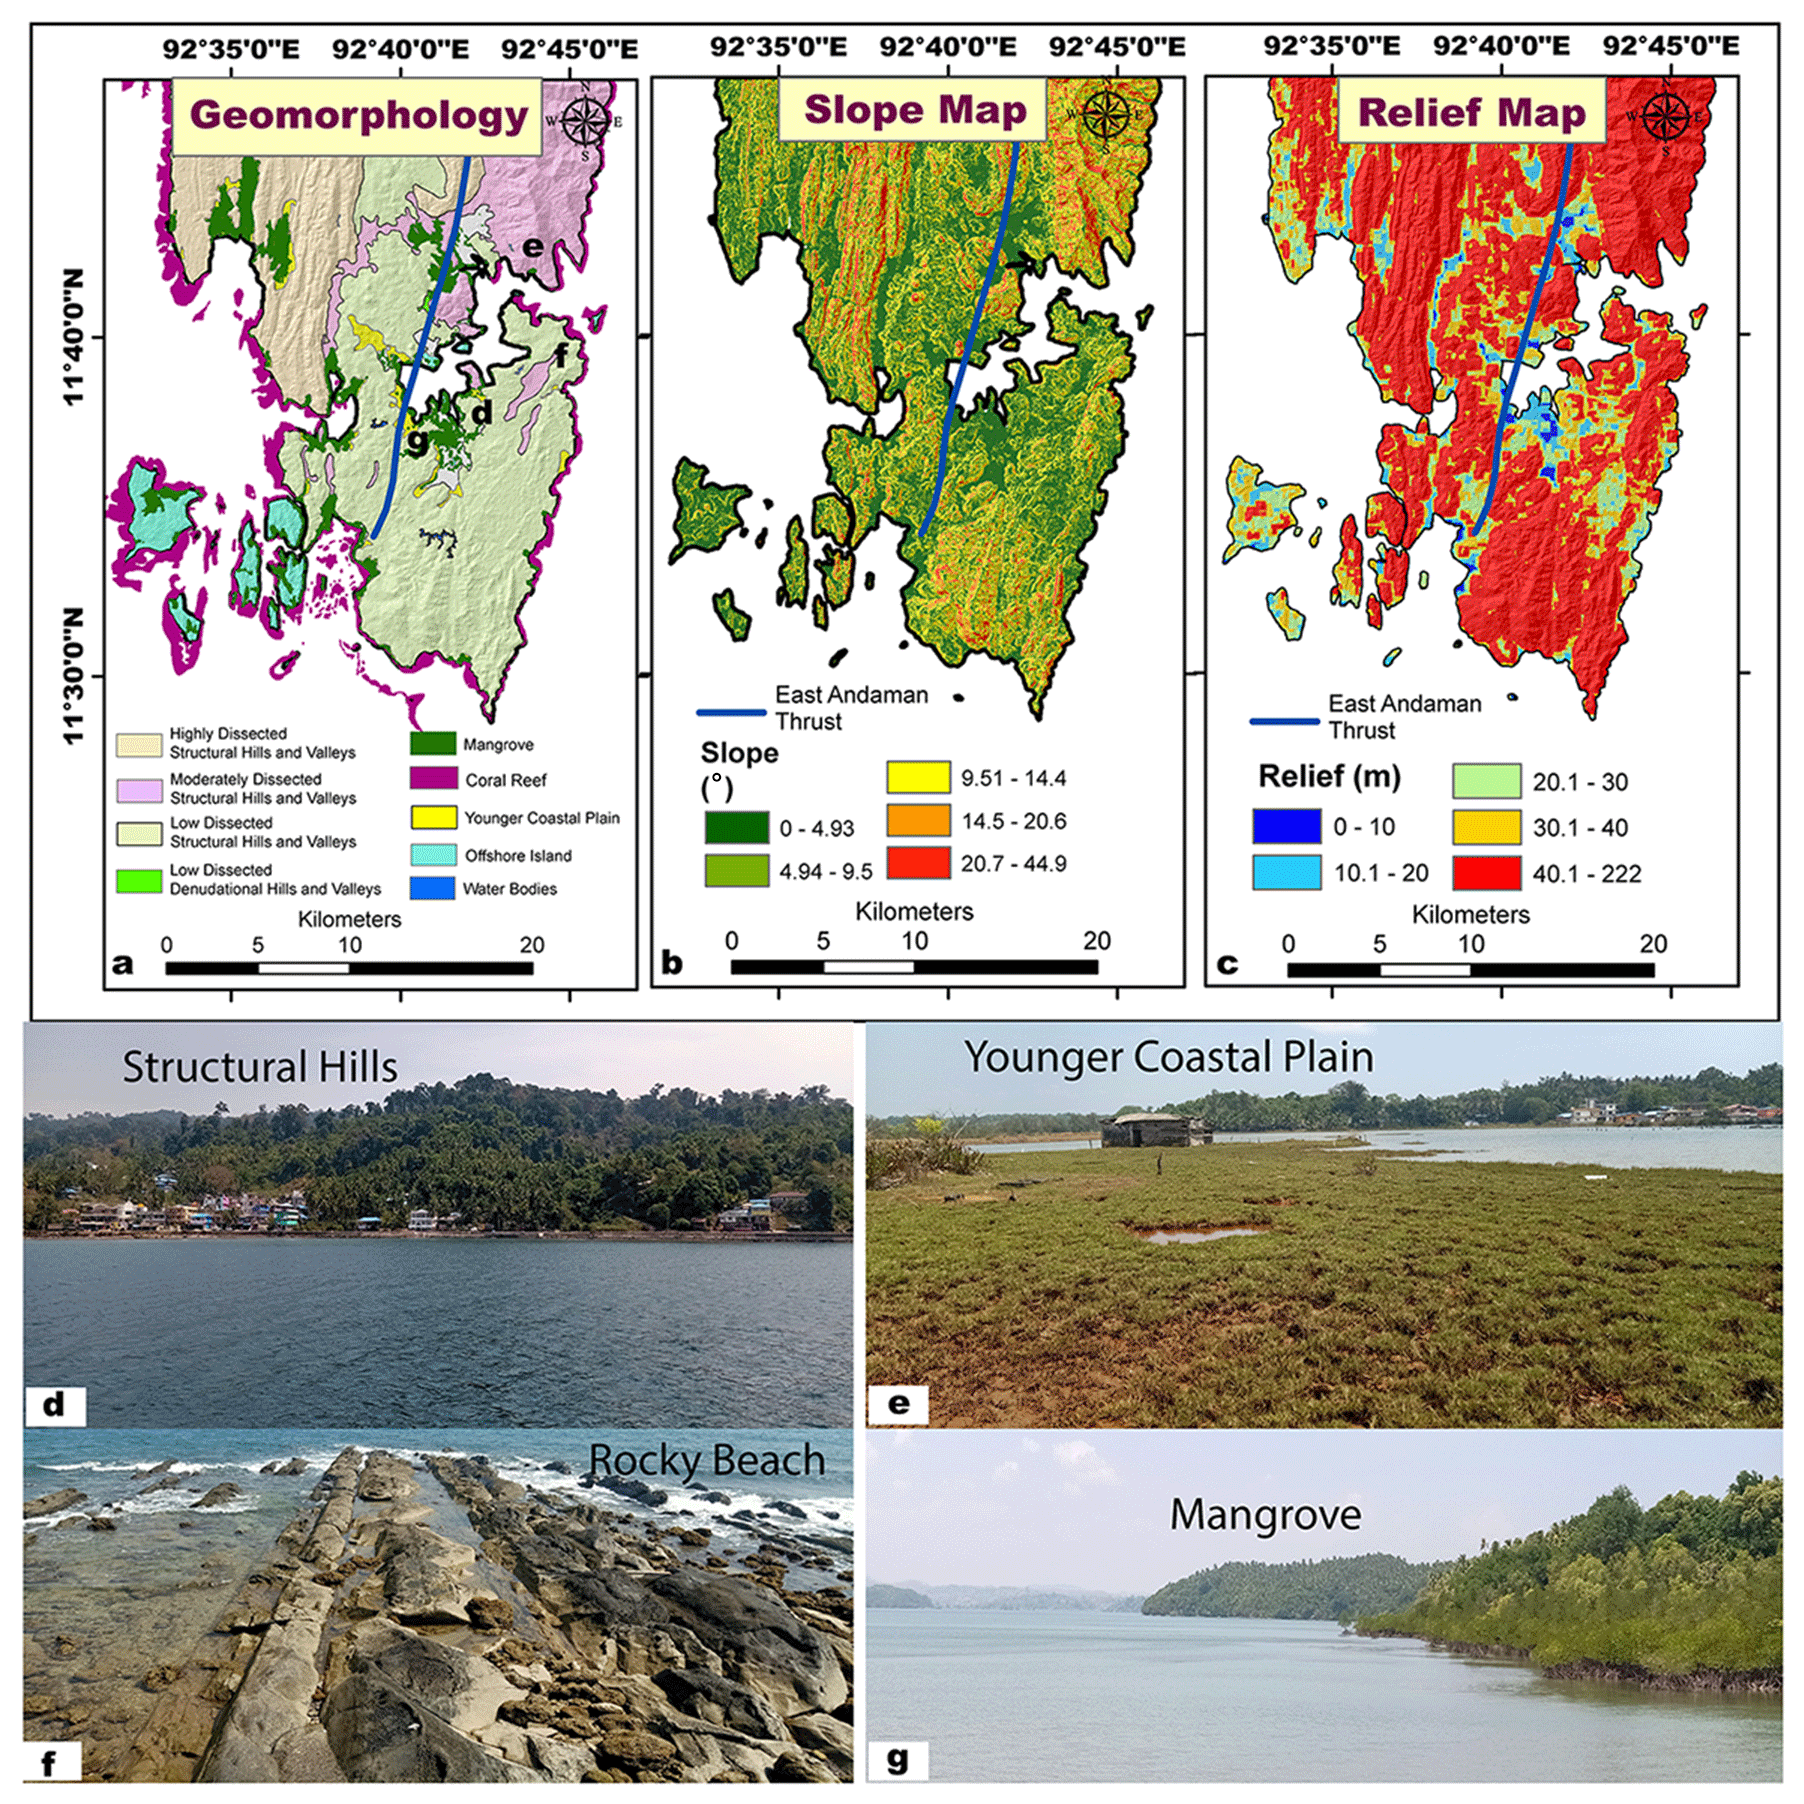
Figure 2(a) Geomorphology; (b) slope map; (c) relief map; (d) structural hills; (e) the younger coastal plain; (f) rocky beach with a wave-cut platform near South Point, Port Blair; and (g) mangroves.
It is imperative to generate a spatial dataset that may have a bearing on the dynamic changes to assess the vulnerability.
3.1 Data used
Landsat satellite data, such as from the Thematic Mapper (TM) and Operational Land Imagery (OLI) sensors for the years 2004, 2005, and 2022, are used to analyze the shoreline and monitor the LULC changes along the South Andaman coast in the present study. The Shuttle Radar Topography Mission (SRTM) digital elevation model (DEM) is used to prepare the study area's slope and relief map. We used the General Bathymetry Chart of the Ocean (GEBCO) for run-up and inundation studies along the South Andaman coastal areas (Table 1).
Table 1Data used in the present study region.
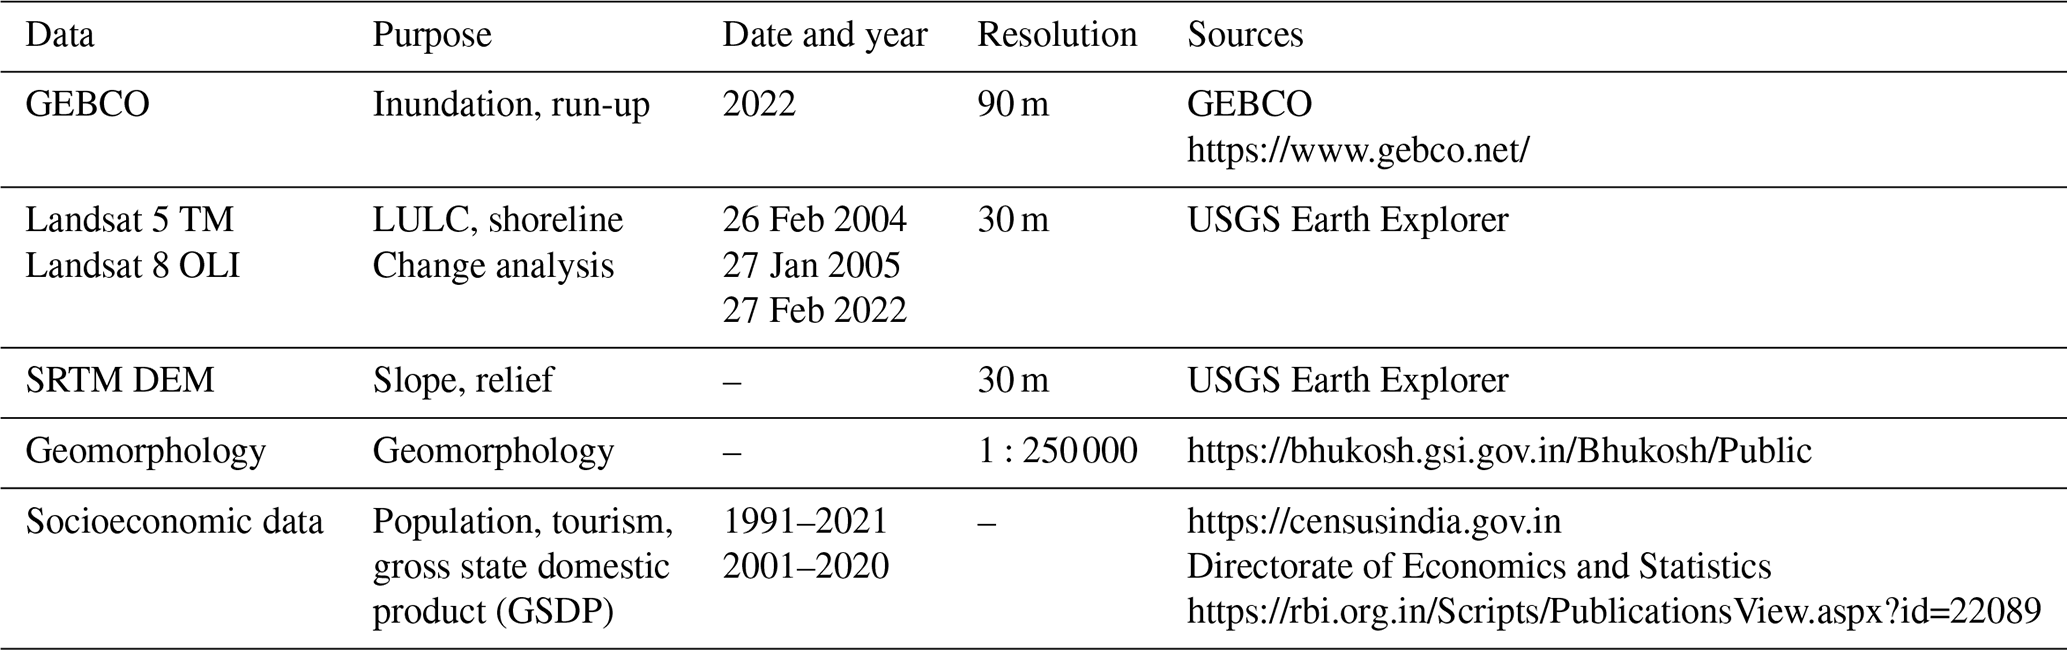
All links were accessed on 26 August 2024.
3.2 Tsunami modeling
Several attempts have been made to model tsunamis to calculate inundation and determine run-up heights to evaluate their impact and hazards along mainland Indian coastal areas and elsewhere (Cho et al., 2008; Srivastava et al., 2021; Sugawara, 2021; Dani et al., 2023).
3.2.1 Tsunamigenic source
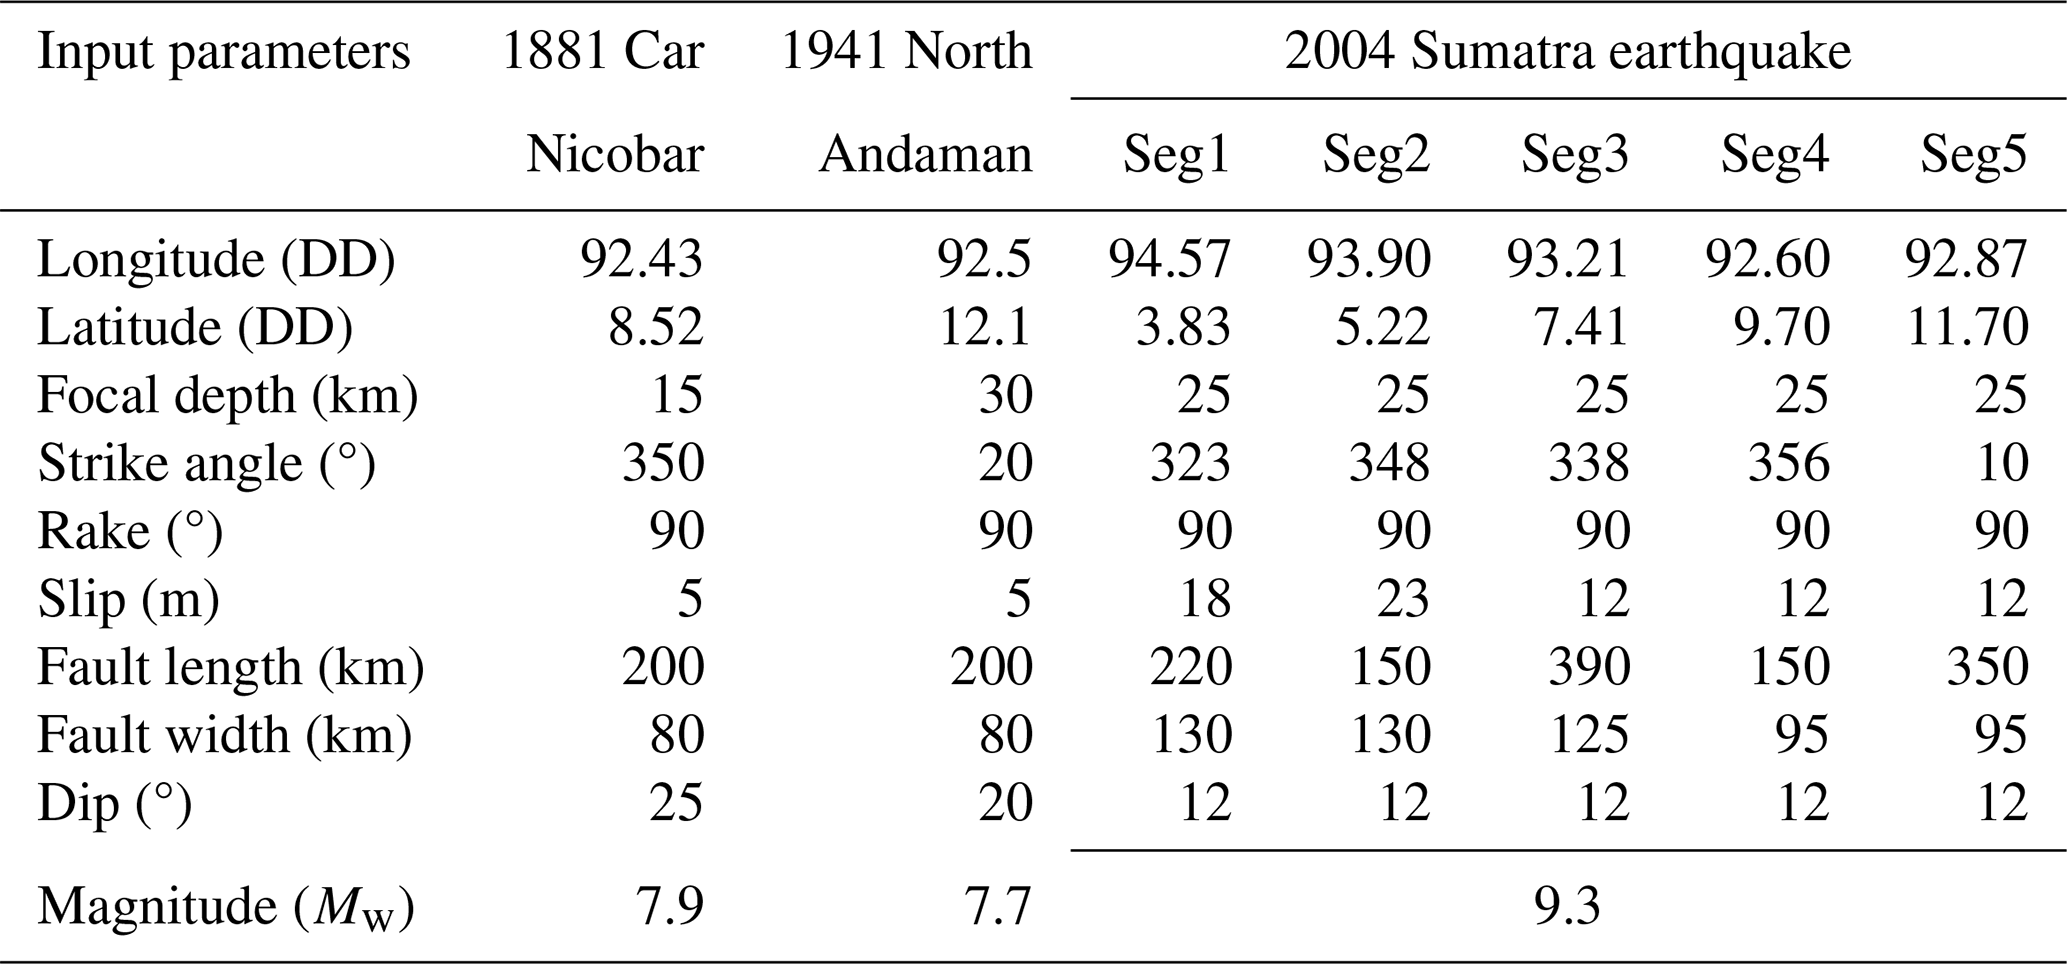
Mansinha and Smylie (1971) and Okada (1985) derived closed-form expressions for the stress and strain field at the source location for different source mechanisms. The focal mechanism and fault parameters like strike angle, dip angle, slip, and focal depth are necessary to compute the initial deformation at the source at t=0 s (Ioualalen et al., 2007; Rani et al., 2011; Mishra et al., 2014; Srivastava et al., 2021). The 26 December 2004 Sumatra earthquake of magnitude 9.3 ruptured almost 1400 km. The region is known to have ruptured into five segments with different slip distributions. Other great tsunamigenic earthquakes in the Andaman region are the 1881 Car Nicobar and the 26 June 1941 North Andaman earthquakes (Table 2).
Table 2Tsunamigenic earthquake deformation parameters used to simulate different scenarios: (a) 1881 Car Nicobar, (b) 1941 North Andaman (Mishra et al., 2014), and (c) 2004 Sumatra earthquakes (Ioualalen et al., 2007).
3.2.2 Tsunami wave propagation
We used the Tohoku University Numerical Analysis Model for the Investigation of Near-field tsunamis (TUNAMI-N2) to simulate the tsunami run-ups and impact using explicit leap-frog finite-difference methods by solving nonlinear shallow water wave equations and incorporating bathymetry, earthquake source parameters, and fault geometry (Imamura and Imteaz, 1995; Imamura, 1996; Goto et al., 1997; Imamura et al., 2006; Yalciner et al., 2005). The two-dimensional governing equations for tsunami modeling are
In Eq. (1), D is the total water depth given by h+η, τx and τy are the bottom friction in the x and y directions, A is the horizontal eddy viscosity that is a constant in space, and the shear stress on a surface wave is neglected. M and N are the discharge fluxes in the x and y directions that are given by
The bottom friction is generally expressed as follows:
The friction coefficient f and Manning's roughness n are related by
It is seen that when D is small and f becomes large, then n remains almost a constant. M, N, and the above values in fundamental equations of the TUNAMI-N2 model are substituted; they are used to solve the wave propagation using the explicit leap-frog finite-difference scheme as given by Imamura et al. (2006).
3.2.3 Computational grid
In deep-sea regions with longer wavelengths, coarse grid spacing to model linear effects is sufficient to resolve the wave with minimal error. As the tsunami wave propagates from deep to shallow waters, the wavelength shortens and the amplitude increases; it follows a nonlinear pattern of amplitude dispersion, energy dissipation, and bottom friction and requires finer-resolution grids with more node points to accurately capture the wave dynamics and minimize errors. The grid spacing should follow the Courant–Friedrichs–Lewy conditions for checking the convergence of the numerical code to a certain asymptotic limit using the following relationship:
where Δt and Δx are temporal and spatial grid sizes, hmax is the maximum still-water depth in the computational domain, and g is the gravitational acceleration.
To observe the nonlinear or near-shore effects of a tsunami, high-resolution bathymetry and topography are considered. In the present study, we used GEBCO bathymetry and topography data formatted into four grids of 81, 27, 9, and 3 arcsec resolutions at a spacing ratio of 1:3 for grids A, B, C, and D, respectively (Fig. S1 in the Supplement). In most computations, the Manning coefficient is around 0.025 as it consists of gravel and sand (Masaya et al., 2020); however, different Manning coefficients can be considered for rough bathymetry (Dao and Tkalich, 2007). A value of 0.01 is considered for smooth bathymetry and stony cobbles, and a roughness of 0.035 can be considered. The viscosity and roughness have a certain influence on mild slopes, but this influence is negligible for steep slopes, and a dynamic friction coefficient from 0.01 to 0.1 can be considered (Zhang et al., 2024). For the propagation of tsunamis in shallow water, the horizontal eddy turbulence terms are negligible as compared with the bottom friction (Dao and Tkalich, 2007). We simulate the tsunami waves using the TUNAMI-N2 code to get the directivity map, the wave amplitudes (run-up heights), and inundation distance at different locations in the study region.
3.3 Shoreline analysis in DSAS
The USGS Digital Shoreline Analysis System (DSAS) version 5.1 (an ArcGIS extension) estimates shoreline changes. The procedures are executed in four steps: shoreline digitization, baseline generation, transect generation, and computation of the shoreline change rate (Raj et al., 2020; Natarajan et al., 2021). The digitized shorelines for the years 2004, 2005, and 2022 have been added to a personal geodatabase in a single shapefile. The shoreline image data are added to the attributes as MM/DD/YYYY, and the baseline is in the UTM-projected coordinate system [m]. To estimate rates of change, DSAS uses baseline measurements of a time series of shorelines and a shapefile (Leatherman, 2003). Generating transects involves initially choosing a predefined set of parameters from the personal geodatabase, including settings for the baseline and shoreline. Subsequently, we placed these transects perpendicular to the shoreline, extending 800 m at intervals of 150 m along the entire shoreline, originating from the baseline. A 50 m smoothing distance was applied using the cast transects tool within DSAS to ensure a smoother outcome.
The evaluation of uncertainty encompasses natural and anthropogenic forces such as wind, waves, tides, currents, and human influences, along with the accuracy of measurement techniques including digitization, interpretation, and GPS error. The accuracy of shoreline position and the rates of shoreline change can be influenced by various error sources, such as the position of the tidal level, image resolution, digitization error, and image registration (Jayson-Quashigah et al., 2013; Vu et al., 2021). Therefore, the shoreline positional error (Ea) for each transect was calculated using Eq. (6):
where Ea is the seasonal error due to seasonal shoreline fluctuations, which is m in extreme ocean level (EOL); Ew is the tidal error; Ed is the digitization error; Er is the rectification error; and Ep is the pixel error (Fletcher et al., 2011; Vu et al., 2021). This approach assumes that the component errors are normally distributed (Dar and Dar, 2009). The total uncertainties were used as weights in the shoreline change calculations. The values were annualized to provide error (Eu) estimation for the shoreline change rate at any given transect, expressed in Eq. (7),
where t1, t2, and tn are the total shoreline position errors for the various years, and T is the years of analysis.
The uncertainty in the shoreline analysis is due to the influence of tides on the Landsat satellite imagery, which is minuscule in the extensive coastline of the study area. We used monthly tide gauge data from the Permanent Service for Mean Sea Level (PSMSL) database (https://psmsl.org/data/obtaining/stations/206.php, last access: 26 August 2024) at Port Blair station for 2003–2004 and 2017–2021. The data for 2004–2005 and 2022 are unavailable. The tide excursion of 383 mm or 0.383 m (Fig. S2) is estimated from the highest (1100 mm) and lowest (717 mm) tide gauge measurements recorded between 2017 and 2020. We calculated uncertainty of 7.21 and 7.12 m for 2018–2019 and 2019–2020, respectively, and the same is adopted for 2022 owing to similar ranges (Table S1 in the Supplement). The mean slope of the shore areas is 4–12° near the seven zones. (Fig. S3 and Table S2). We used the end point rate (EPR) and net shoreline movement (NSM) methods to analyze the shoreline change (Himmelstoss et al., 2021). To quantify uncertainty, a confidence interval of 90 % and a shoreline uncertainty value of 10 m were adopted based on the recommendations of the United States Geological Survey (USGS) under the National Assessment of Shoreline Change Project (Himmelstoss et al., 2021; Den Boer et al., 2018; Joesidawati, 2016).
3.3.1 Net shoreline movement (NSM)
NSM is used to determine the net change in the shoreline position over a specific period by finding the perpendicular distance between the most recent shoreline (in this case, 2022) and the oldest shoreline (2004) along each transect. The formula for NSM can be expressed as
3.3.2 End point rate (EPR)
EPR quantifies the shoreline change rate over time and is calculated by dividing the net shoreline movement (NSM) by the time elapsed between the oldest and most recent shoreline measurements, which indicates the rate of erosion or accretion. It is important to have data from at least two shoreline dates (Dolan et al., 1991; Crowell et al., 1997). The formula for EPR can be expressed as follows:
3.4 Land use–land cover analysis (LULC)
The LULC map uses Landsat 5 TM (2004 and 2005) and Landsat 8 OLI (2022). False-color composite (FCC) satellite images combine near-infrared, red, and green bands to delineate five classes: forest, built-up area, cropland, water bodies, and inundated areas (Singh and Khanduri, 2011). Tone, texture, size, shape, pattern, association, and other visual interpretation techniques were also used to interpret different land use classes. Maximum likelihood is a supervised classification method used in this study to detect LULC change. Each pixel in the classified Landsat images varies over time due to changes in land cover.
An analysis of the 2004 tsunamigenic earthquake's impact on the South Andaman region, focusing on tsunami directivity, arrival times, run-up heights, shoreline changes, and LULC impact, is examined in detail.
4.1 Tsunami studies along the South Andaman region
We considered three tsunamigenic seismic scenarios, namely (a) the 1881 Car Nicobar earthquake, (b) the 1941 North Andaman earthquake, and (c) the 2004 Sumatra earthquake, and generated the directivity and run-up maps (Fig. 3). The directivity map shows that most of the energy propagation is in the east–west direction (Fig. 3a–c), and the shallower waters surrounding the Andaman and Nicobar Islands had a significance influence on the east–west propagation of tsunamis (Singh et al., 2012). The run-up height along the eastern coast of South Andaman is greater than the western coast (Fig. 3b'–d'; Table 3). This difference is due to the wider continental shelf on the western coast of the South Andaman region and the shallow water depths. In the case of a higher magnitude of tsunamigenic earthquakes in the Car Nicobar or North Andaman regions, higher run-ups will be observed along the locations that are considered for the present study (Table 3).
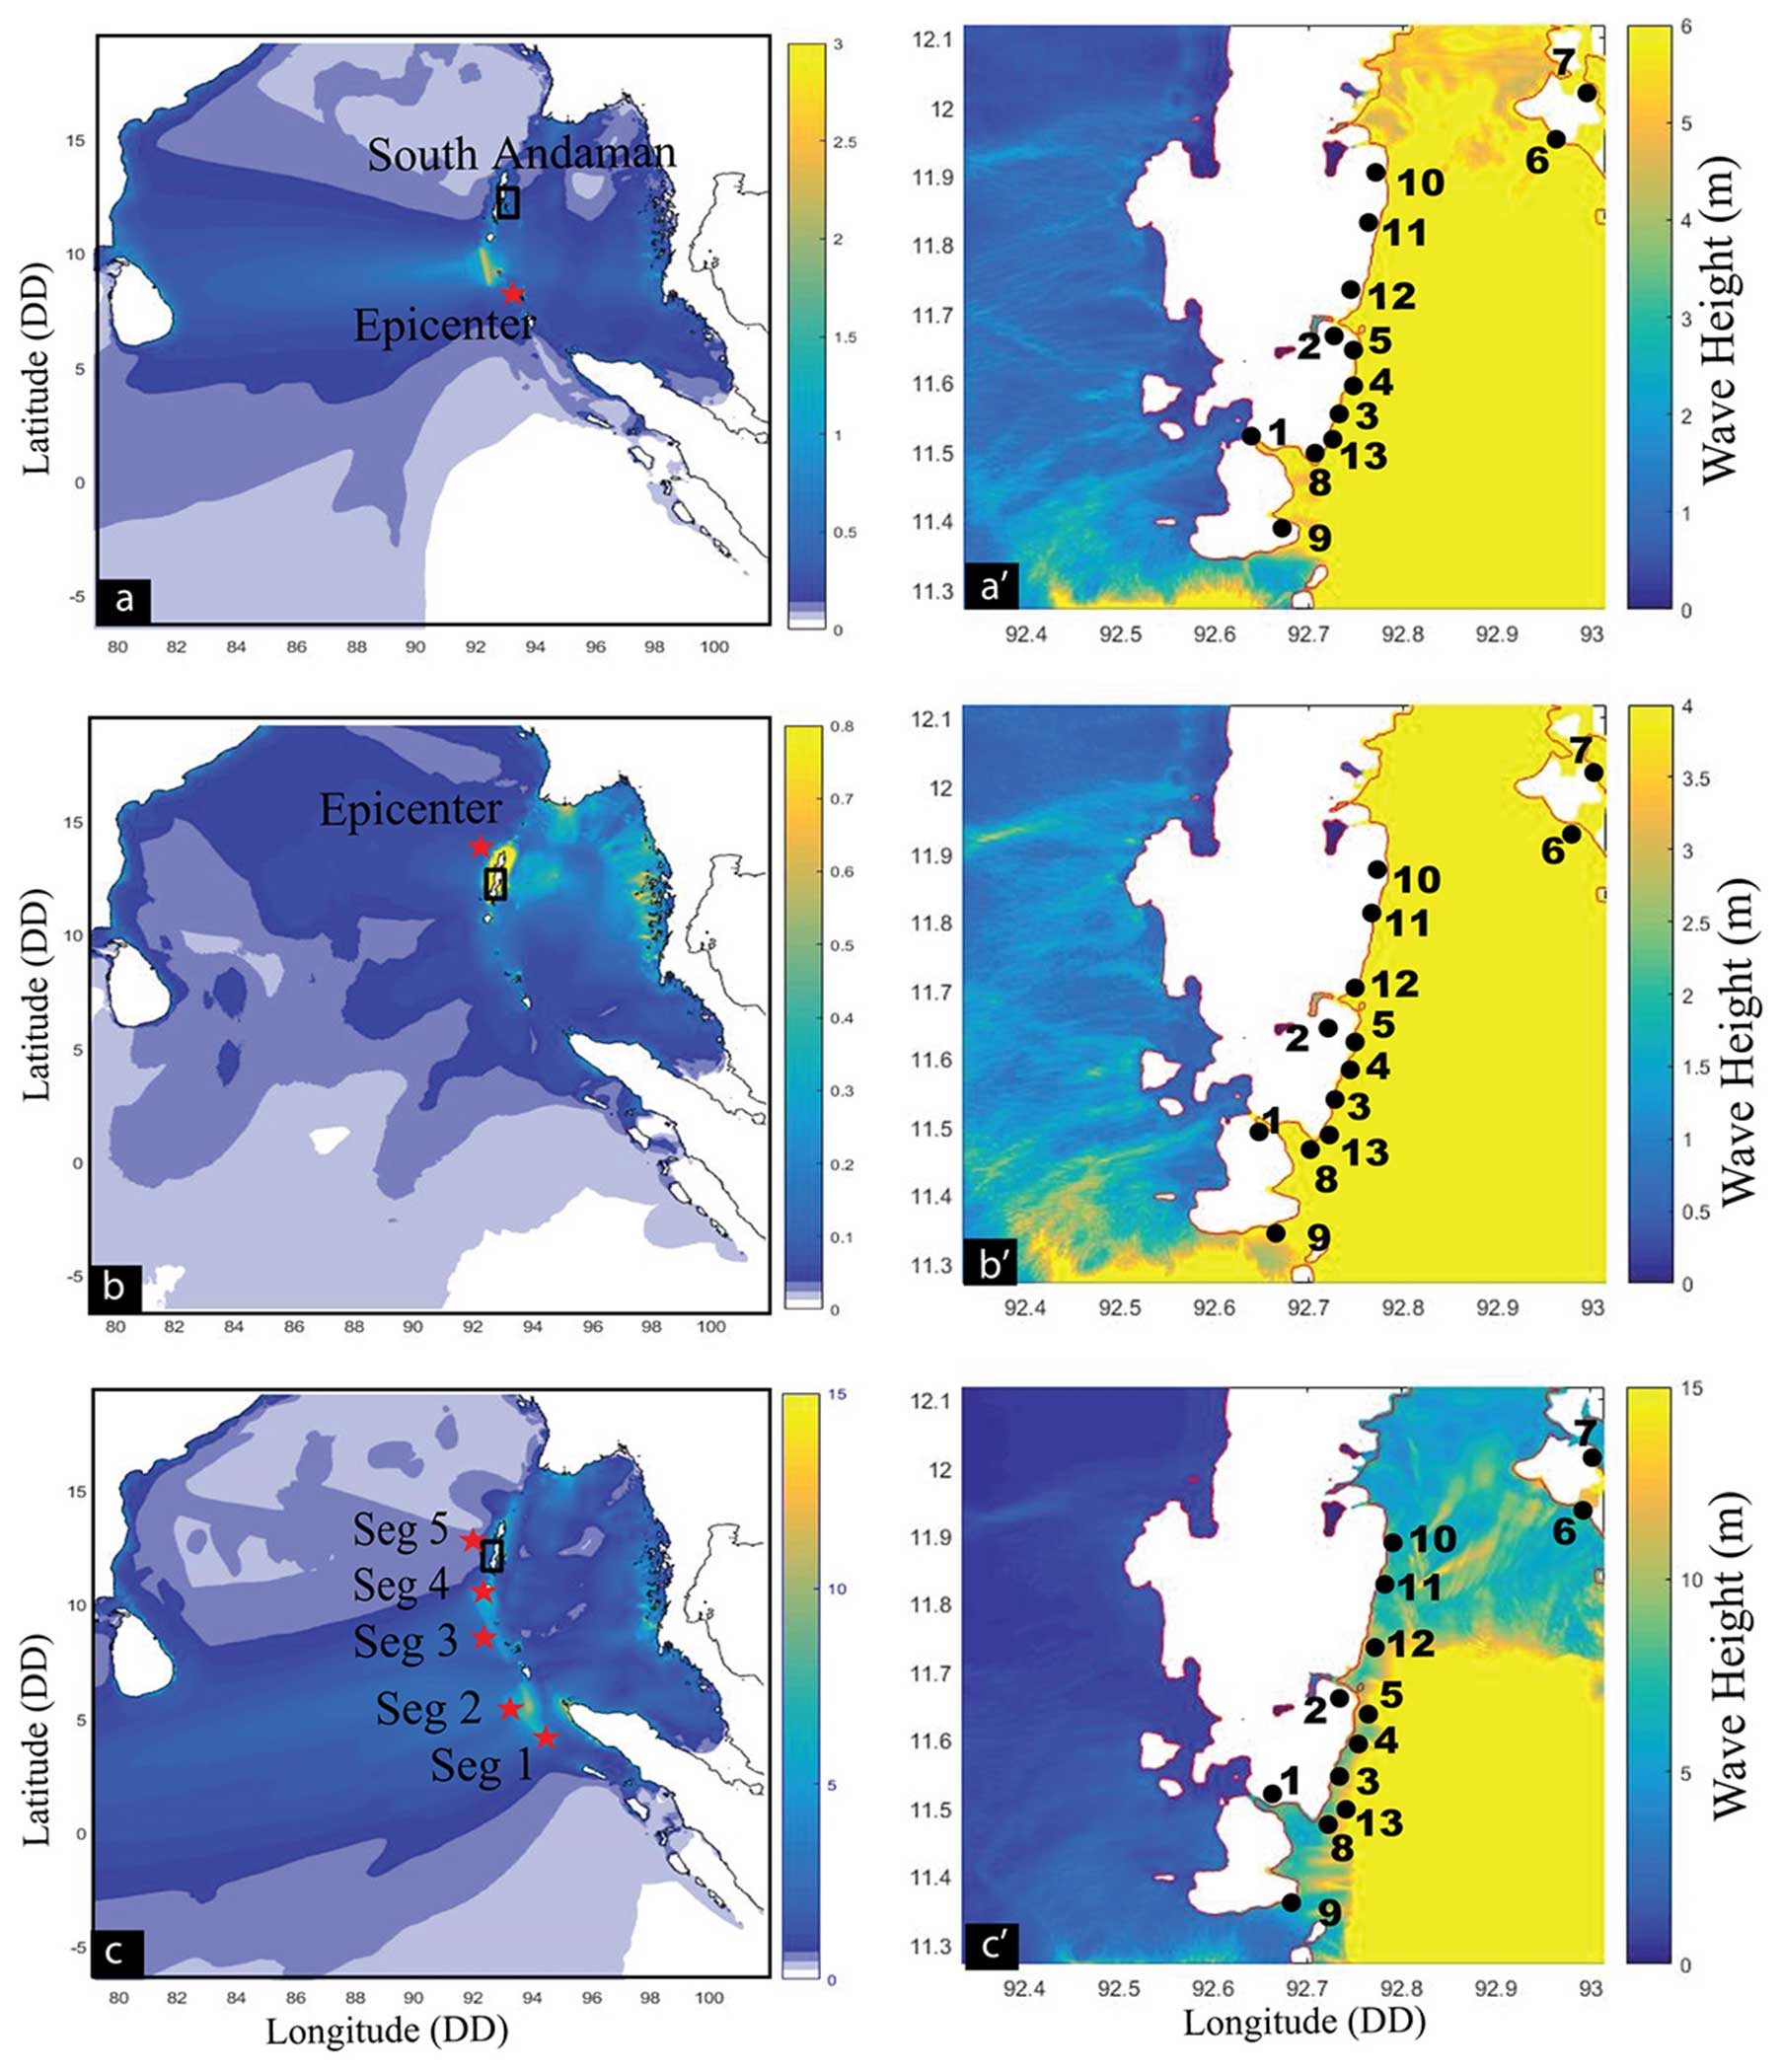
Figure 3(a) Directivity and (a') wave run-up height for the 1881 Car Nicobar, (b, b') for the 1941 North Andaman, and (c, c') for the 2004 Sumatra earthquakes.
Table 3Estimated arrival times, run-up heights, and inundations at the studied locations from the tsunamigenic (a) 1941 North Andaman, (b) 1881 Car Nicobar, and (c) 2004 Sumatra earthquake sources. The serial number of the locations is the same for Figs. 3 and 4.
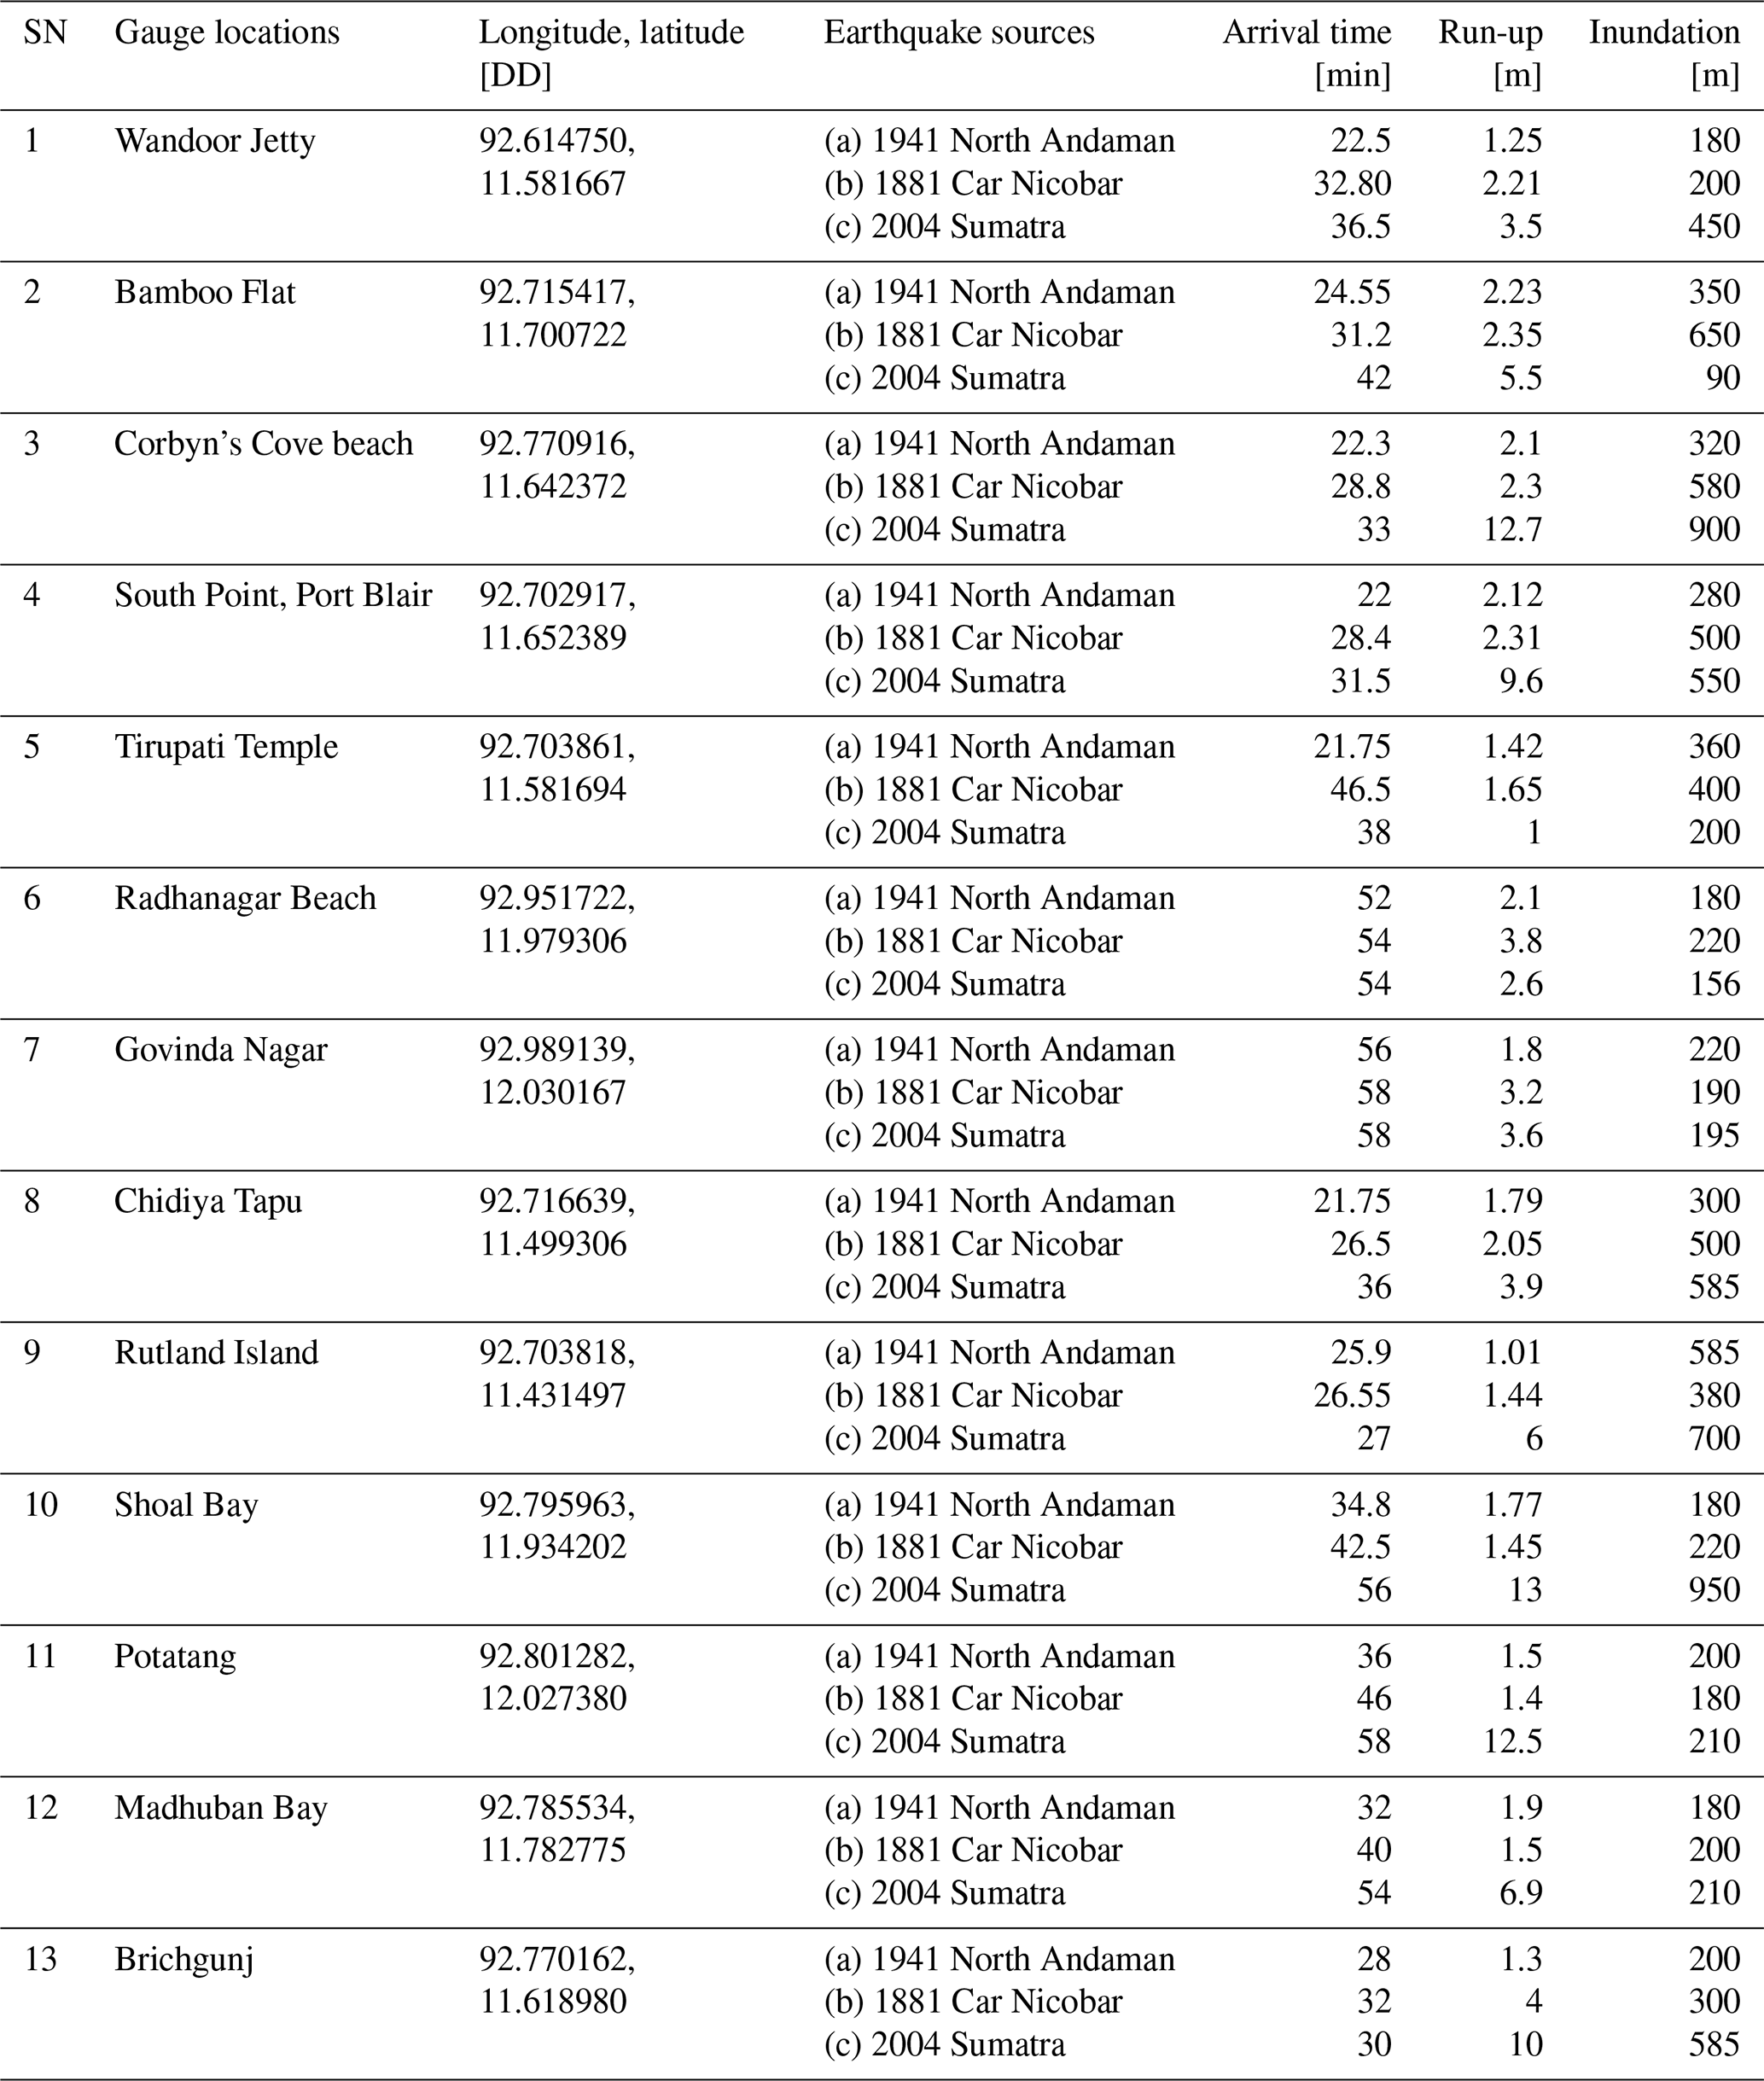
The arrival times of tsunamis vary from 21 to 58 min across different locations for these earthquakes, with the 1881 Car Nicobar earthquake generally resulting in the shortest arrival time (Fig. 3; Table 3). The run-up heights range from 1 to 13 m at different locations (Fig. 3; Table 3), which are the results of the earthquake magnitude, the source's proximity to observation locations, and the local coastal topography that also affected inundations. The extent of inundation, representing the area covered by the tsunami, ranges from 10 to 950 m, with a wide variation across locations and earthquake events. The 2004 Sumatra–Andaman earthquake resulted in higher run-up heights and inundations compared to the 1881 Car Nicobar and 1941 Andaman earthquakes and caused extensive damage. Hence, we considered the 2004 Sumatra–Andaman earthquake for a detailed analysis of hazard assessment and scenario analysis. The arrival times [min], run-up height [m], and inundation extent [m] at 13 different locations along the South Andaman region for the 2004 Sumatra earthquake (Table 3) are considered for further analysis.
Due to the effects of the 2004 tsunami, the stagnation of tsunami water in the agricultural lands and low-lying areas of the Wandoor Jetty region resulted in increased soil salinity (Fig. 4a); it also damaged the bridge in the Bamboo Flat area (Fig. 4b) and houses near the Sippighat area (Fig. 4c and d). Shoal Bay recorded the highest inundation extent of 950 m and experienced the highest run-up height of 13 m, indicating significant wave impact (Fig. 3b; Table 3). Corbyn's Cove beach and Rutland Island experienced significant inundation distances exceeding 700 m (Fig. 3b; Table 3). Potatang, Corbyn's Cove beach, and Brichgunj also recorded relatively high run-up heights that exceeded 9 m (Table 3). Most locations experienced arrival times between 27 and 58 min, indicating a relatively quick propagation of the tsunami wave. Jain et al. (2005) mentioned that tsunami waves arrived in the Andaman and Nicobar Islands between 40 and 50 min after the earthquake. Our results agree with the tsunami run-up height estimations by Cho et al. (2008) and Prerna et al. (2015) at a few locations in the present study area. Since the tide gauge data are available at a few locations along the Indian coast, we rely on limited field observations along the coast to validate our findings. The field observations of the water marks on a light post at Bamboo Flat in Port Blair were seen to be around 3.8 m (Cho et al., 2008), and our computations show them to be ∼3.5 m, within ∼7 % error limit. Similarly, at South Point, Port Blair, the field observations are 10 m, and our computation value is 9.6 m, which is ∼4 % deviation, and the deviation is 7 % at Chidiya Tapu. The Bamboo Flat region and harbor area of Port Blair experienced liquefaction affecting several buildings (Murty et al., 2006), and our calculations show that the tsunami wave heights were around 5.5 m. At most locations, the computed values are within 10 % error.
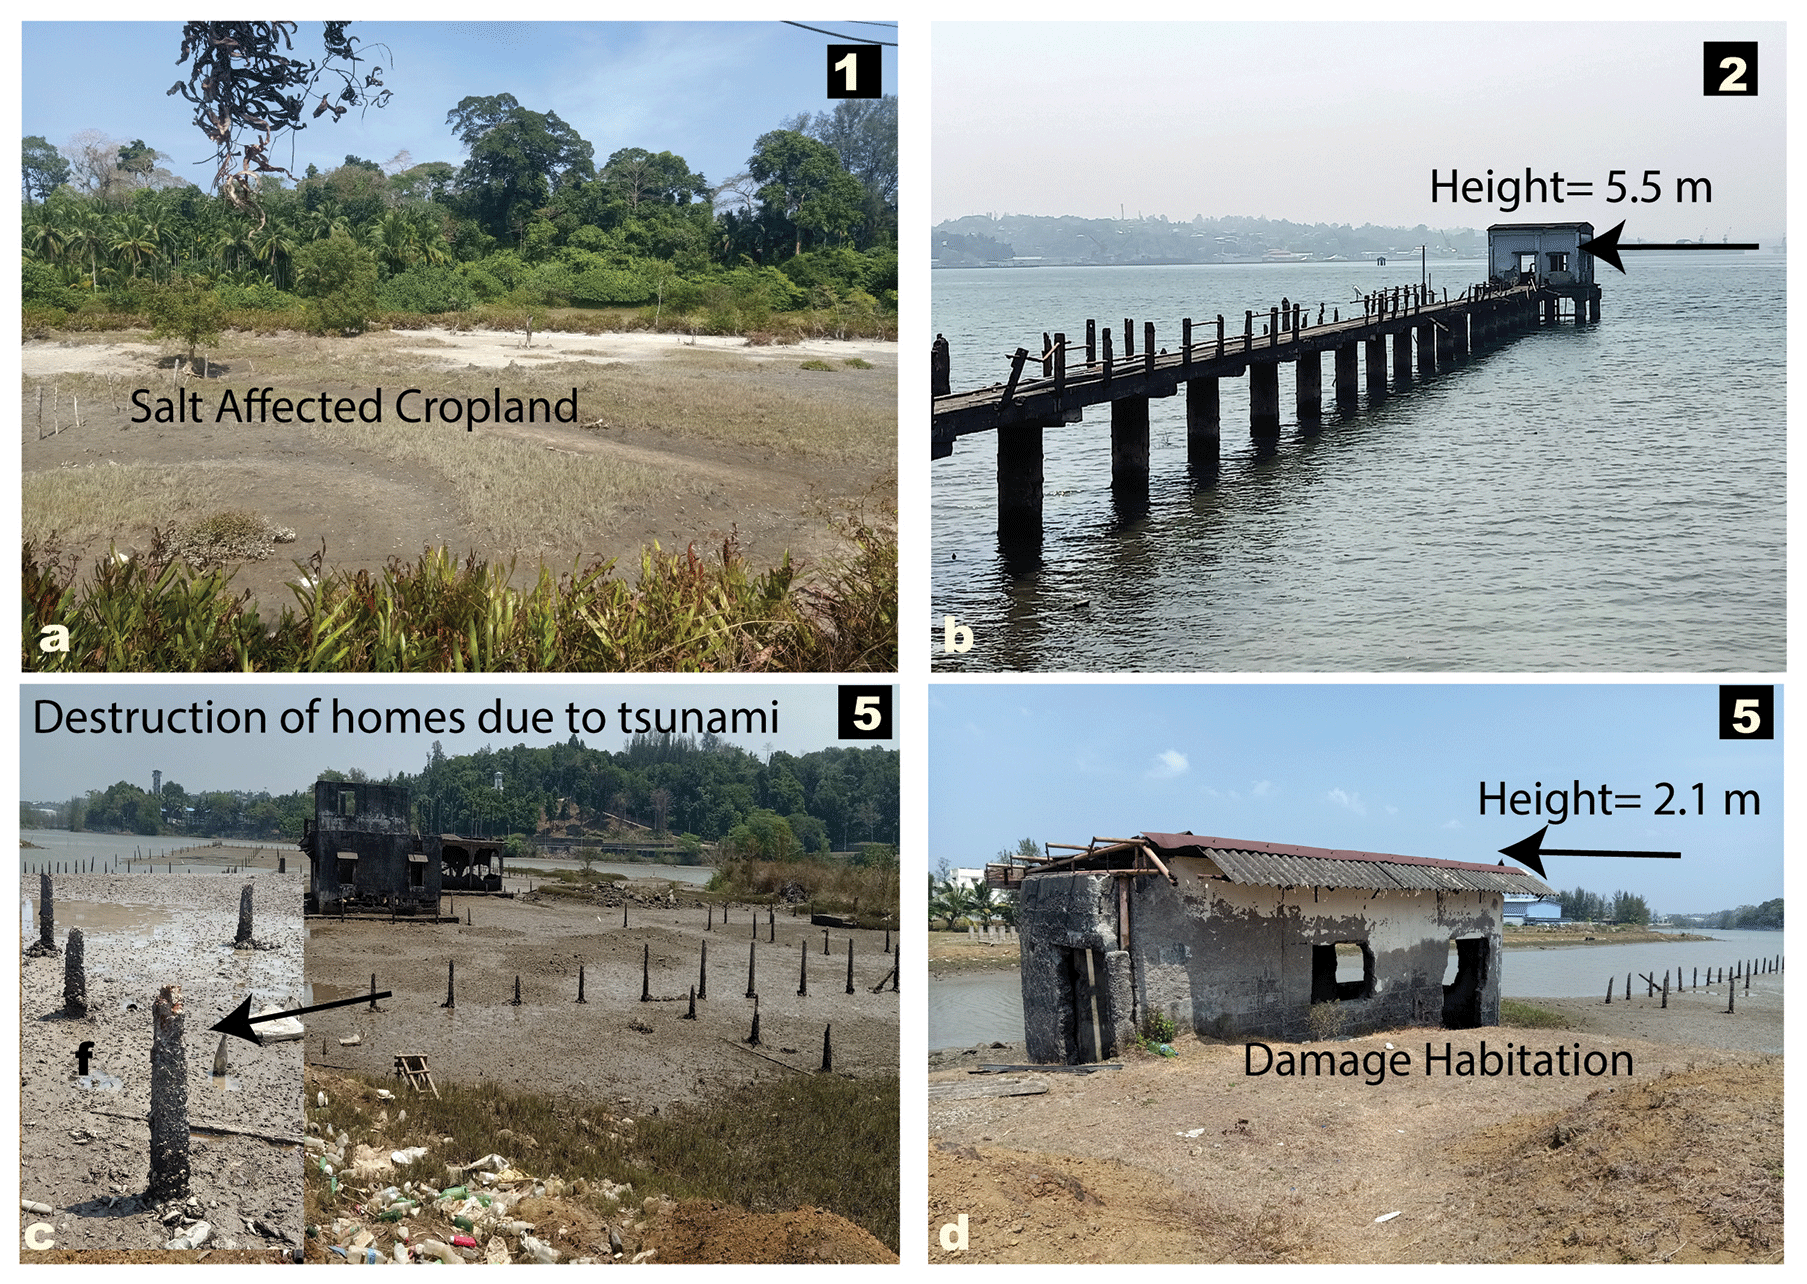
Figure 4(a) Stagnation of tsunami water in the agricultural fields and low-lying areas in Port Blair, (b) a damaged bridge in Bamboo Flat, and (c, d) damaged houses in the Sippighat area near Port Blair (photo: 1 March 2023). The numbers on the field photographs correspond to the respective locations shown in Fig. 3.
South Andaman experienced significant inundations during the 2004 Sumatra earthquake, highlighting the urgent need for robust mitigation and preparedness measures in these vulnerable coastal regions. We aim to contribute to this broader goal by providing essential data and insights to support evidence-based decision-making and mitigate the adverse impacts of tsunamis on coastal populations. The study will provide workable input to the local risk management strategies involving local communities, optimizing evacuation planning, enhancing early warning systems, fortifying infrastructure resilience, and adopting a multi-hazard risk assessment approach (National Research Council, 2011).
4.2 Shoreline change during the tsunami (2004–2005) and post-tsunami (2005–2022)
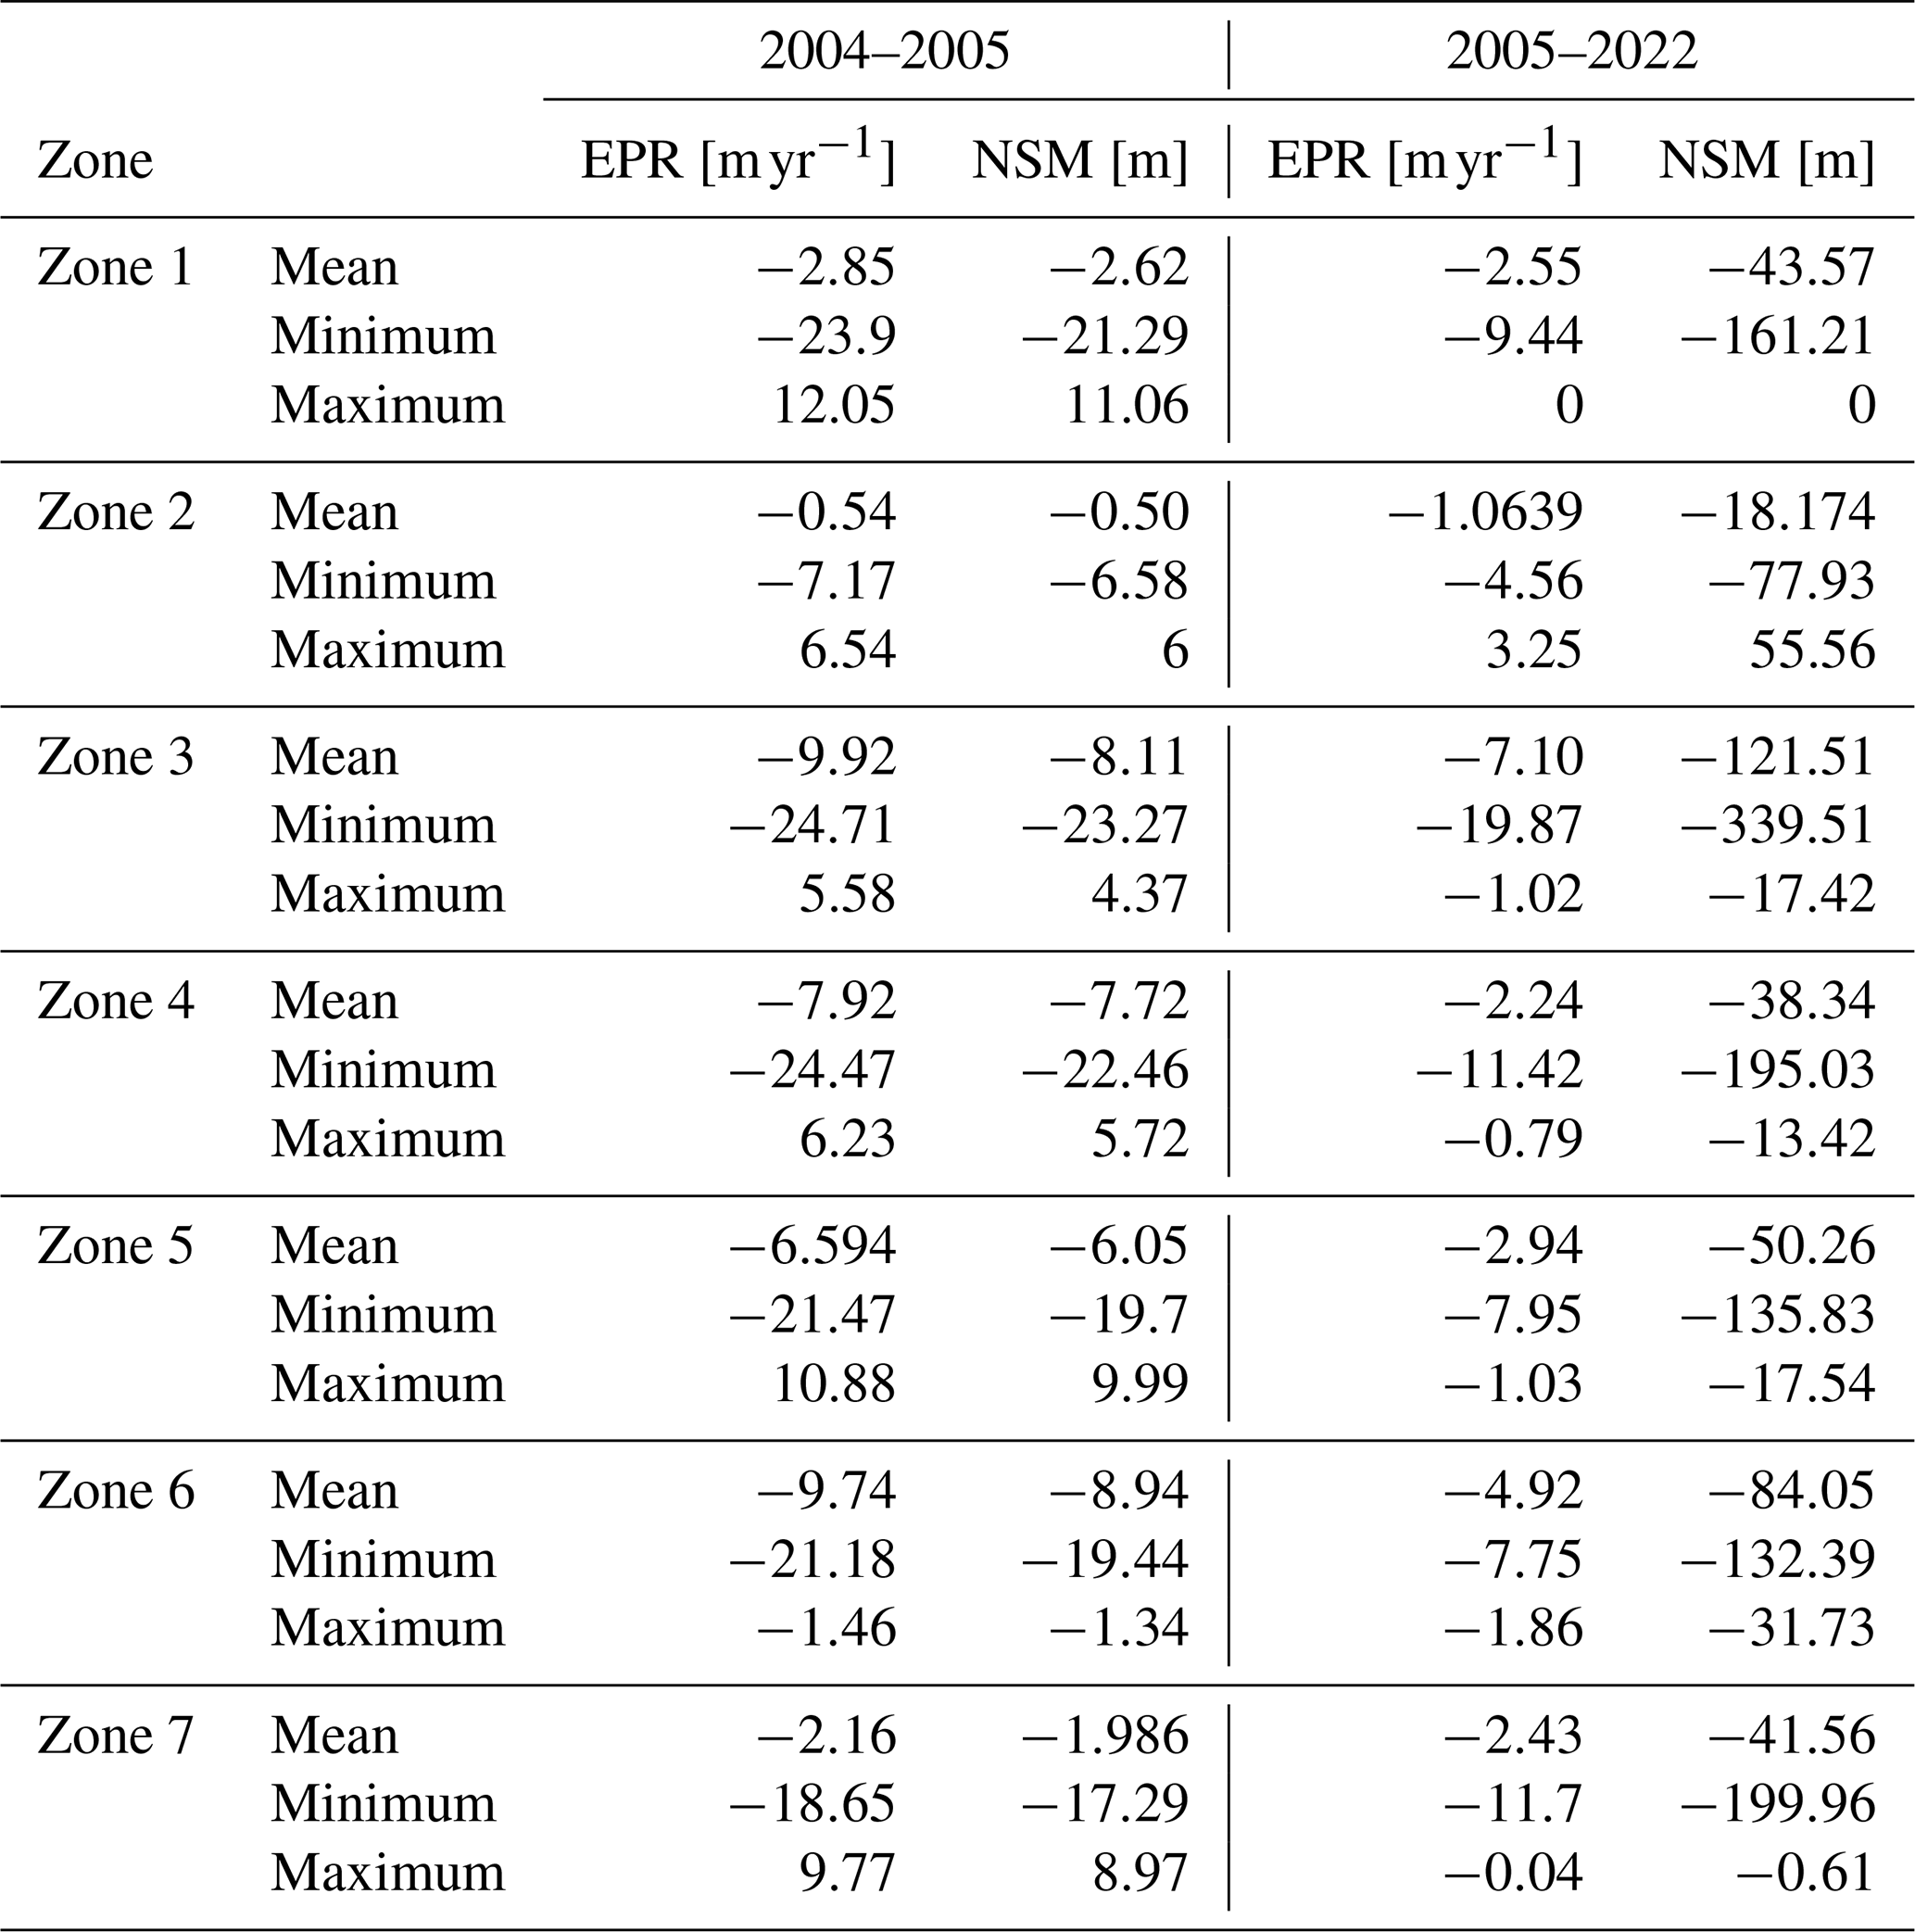
The South Andaman coast is divided into seven zones based on proximity to the inundation studies to calculate NSM and EPR to understand the short-term and long-term change impact of coastal erosion (Figs. 5 and S4–S10). The NSM and EPR are calculated over two separate time frames to comprehend the damage caused by tsunamigenic and regular wind–wave–surge events in South Andaman Island. These zones were used to understand erosion and accretion rates between (i) 2004–2005 (Fig. 5a) and (ii) 2005–2022 (Fig. 5b). The EPR and NSM values from 2004 to 2005 indicate the direct effect of tsunami waves, whereas 2005 to 2022 values represent periodic wind–wave–surge dynamics. Periodic coastal shoreline changes refer to the regular and repeating fluctuations in the position of the shoreline along the coast. Natural and human-induced factors can influence these changes. A total of 1083 transects are created at 50 m intervals, distributed among the zones as follows: zone 1 (339 transects), zone 2 (147 transects), zone 3 (89 transects), zone 4 (74 transects), zone 5 (137 transects), zone 6 (73 transects), and zone 7 (220 transects). The shoreline variation rates indicate positive accretion and negative erosion (Fig. 6; Table 4). The EPR changes in meters per year [m yr−1] for the period 2004–2005 show a higher erosion rate compared to 2005–2022, particularly in zones 3, 4, and 5 (Fig. 6a). The NSM focused on two distinct time frames, indicating the NSM rates during the tsunami for the years 2004–2005, and the NSM rates over the extended 17-year period from 2005 to 2022 are measured in meters (Fig. 6b). The detailed analysis of the maximum (accretion), minimum (erosion), and mean shoreline changes for each of the seven zones that occurred during the tsunami event and the post-tsunami period are discussed below.
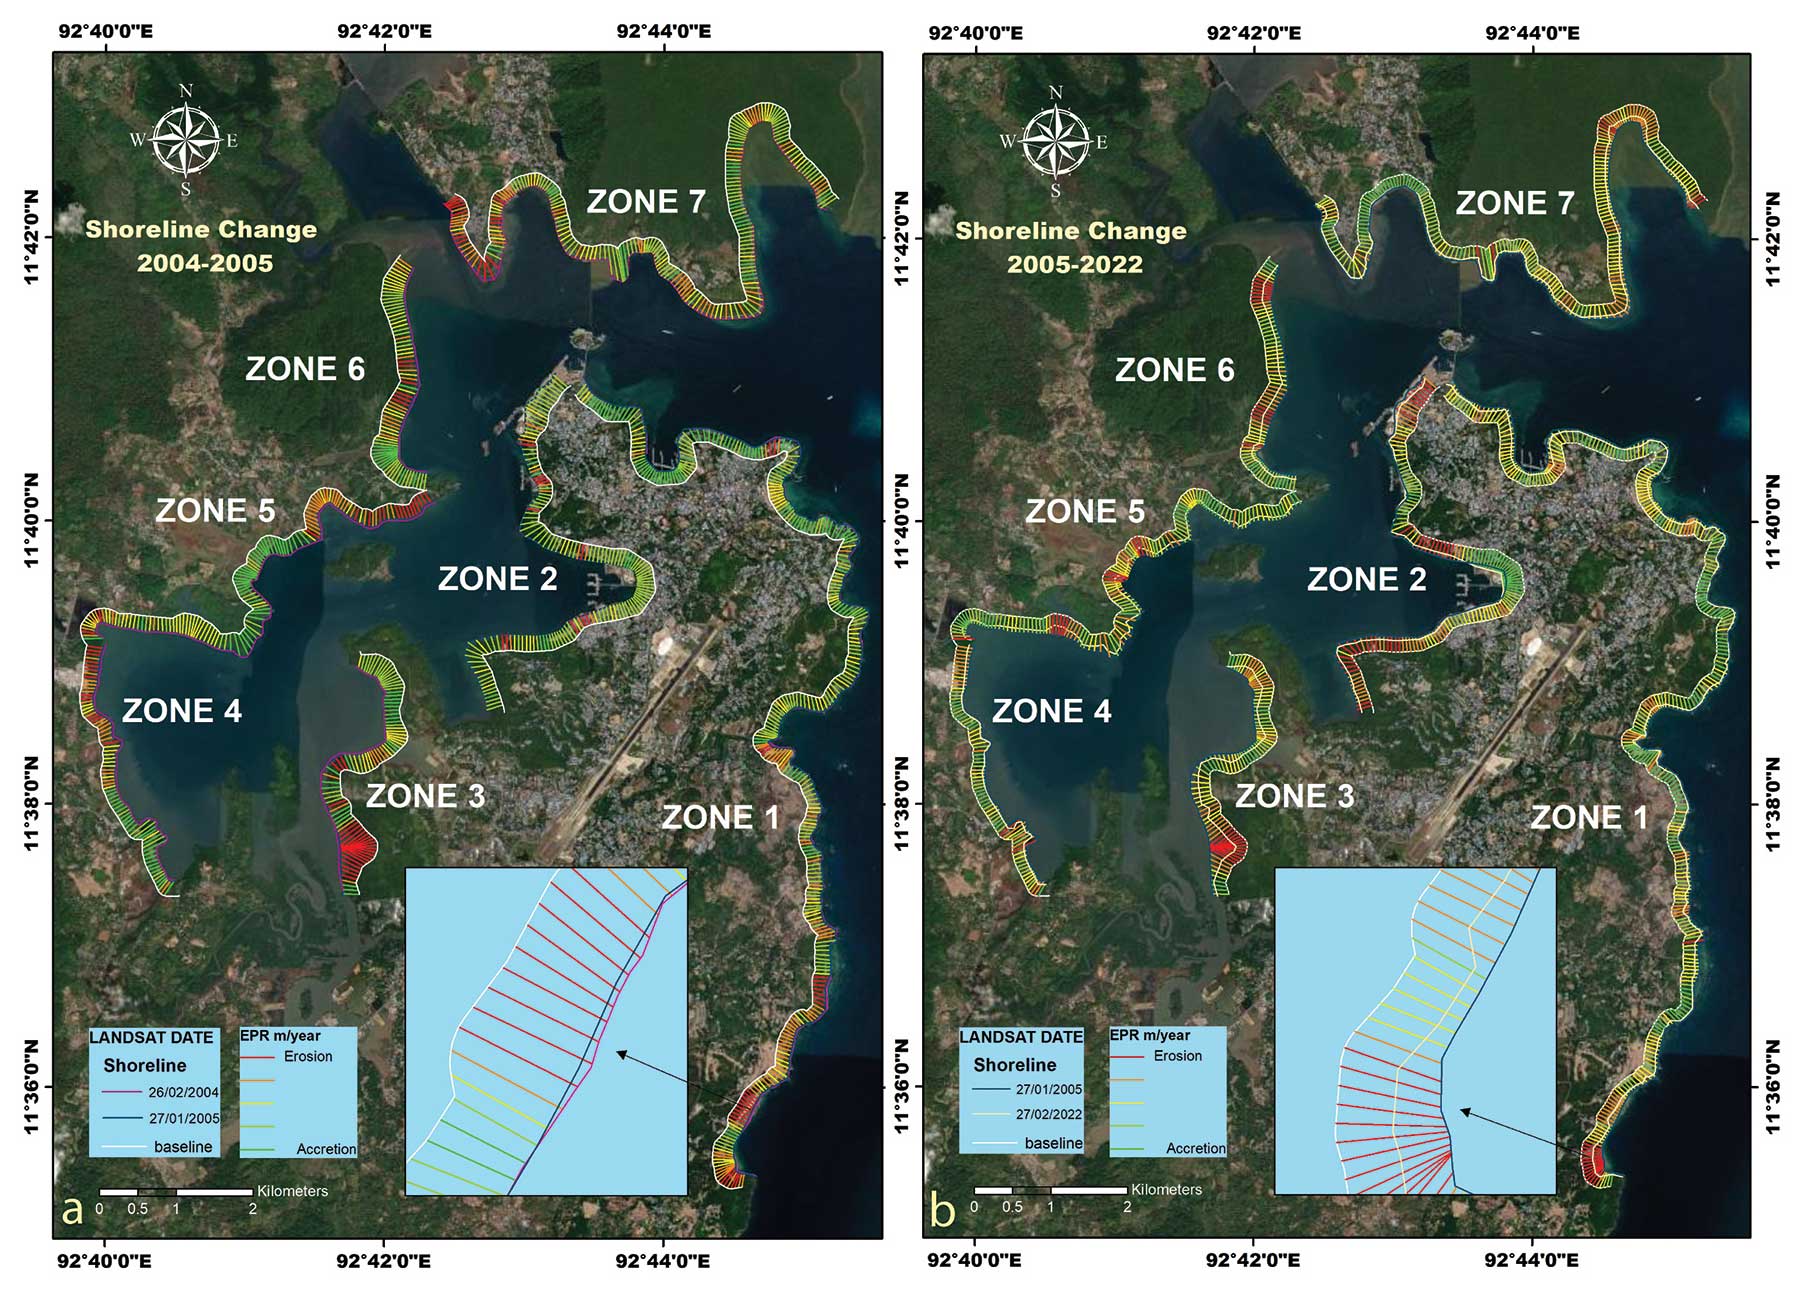
Figure 5Shoreline changes observed (a) during 2004–2005 due to the tsunamigenic process and (b) from 2005 to 2022 due to wind–wave surges; the images are overlaid on Google Earth images (© Google Earth). The affected coastline is subdivided into seven distinct zones for detailed analysis.
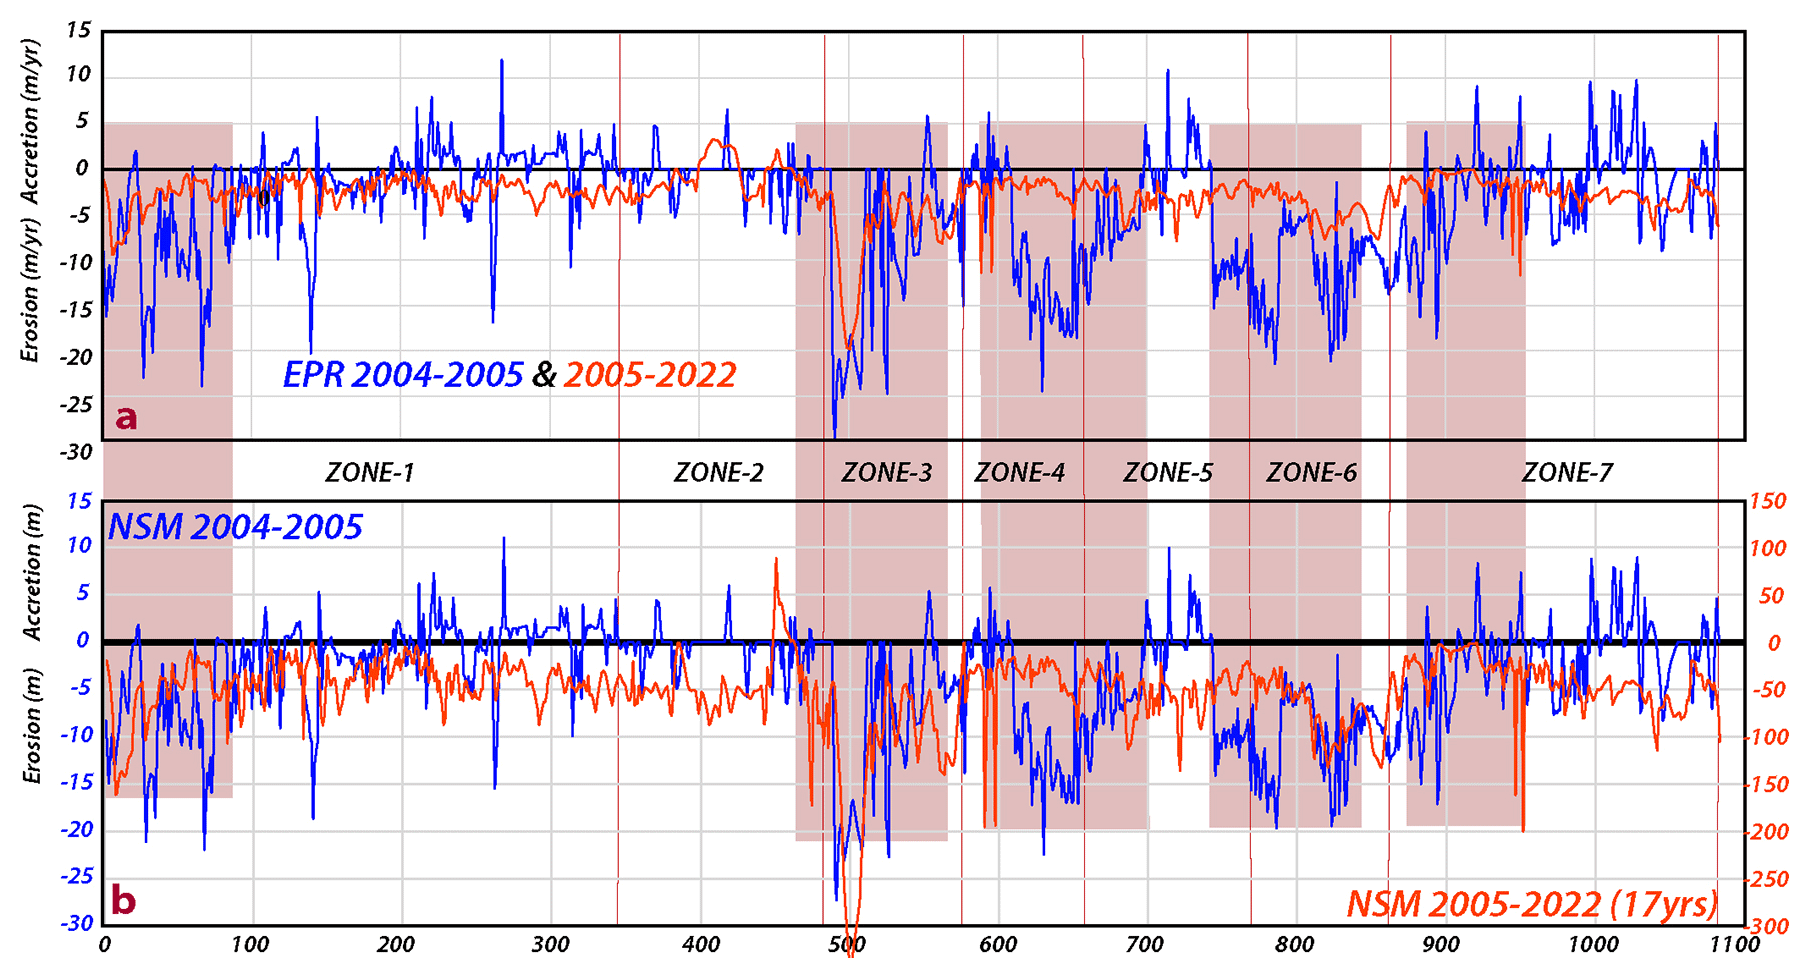
Figure 6(a) The rates of erosion and accretion in seven distinct zones along the South Andaman shoreline using EPR and (b) NSM methods have been calculated for the years 2004–2005 and 2005–2022. Red highlighted areas indicate high-erosion zones.
Table 4Shoreline change in South Andaman observed in 2004–2005 and 2005–2022 using the USGS DSAS methods (Himmelstoss et al., 2021).
Zone 1. This zone experienced a combination of erosion and accretion between 2004–2005 and 2005–2021. The maximum erosion rates are observed at Megapode Resort, with EPR of −23.9 and −9.44 m yr−1; NSM analysis shows the estimated erosion is −21.29 and −161.21 m, (Fig. S4a and b; Table 4). The southern part of South Andaman Island has more shoreline erosion than accretion, which can be attributed to the heightened impact of tsunamis on the southern region, a phenomenon that is more significant when compared to the northern part of South Andaman Island. These sediments eroded from one coastline area are often transported along the shoreline by the alongshore currents. The angle-of-wave approach creates these currents and is responsible for moving sediment parallel to the coastline.
Zone 2. This zone experienced a combination of erosion and accretion between 2004–2005 and 2005–2021. The maximum rate of erosion of −7.17 and −4.56 m yr−1 (EPR) was recorded at IOC Colony, while the maximum accretion rate of 6.54 and 3.25 m yr−1 (EPR) was observed at Ashvini Nagar. The NSM analysis indicated a shoreline retreat of −6.58 m at IOC Colony and −77.93 m advancement at Ashvini Nagar. The jetties in the Junglighat port played a role in controlling erosion and accretion at these sites (Fig. S5; Table 4).
Zone 3. This zone experienced a combination of erosion and accretion between 2004–2005 and 2005–2021. The maximum erosion rate is −24.71 m yr−1 and −19.87 (EPR) at Flat Bay, while the maximum accretion rate is 5.58 m yr−1 (EPR) at the NLC Limited solar farm. The NSM analysis revealed a shoreline retreat of −23.27 and −339.51 m at Flat Bay. High wave energy and exposure to strong currents, which are more common near Flat Bay, can lead to increased erosion of mangrove shorelines (Fig. S6; Table 4).
Zone 4. This zone experienced a combination of erosion and accretion between 2004–2005 and 2005–2021. The maximum erosion rate is −24.47 m yr−1 at Ferrargunj and −11.24 m yr−1 (EPR) at PLA Creek Resort, NSM-estimated erosion is −22.46 and −195.03 m at Chouldari (Fig. S7). We observed the shoreline erosion area using the Landsat time-lapse satellite images between 2004–2005 and 2022 near Flat Bay, South Andaman, which has revealed noteworthy environmental changes. The dark-blue color observed in 2004 and 2005 indicates the presence of deep-water bodies, whereas the light-blue color in the 2022 image suggests that the water bodies have become shallow with significant fresh sediment load (Fig. 7; Table 4).
Zone 5. The maximum erosion rate of −21.47 m yr−1 (2004–2005) and −7.95 (EPR 2005–2022) is recorded at Mithakhari. According to the NSM analysis, the shoreline retreated by −19.7 and −132.39 m at Mithakhari (Fig. S8). In this zone, coastal development, infrastructure construction, and alteration of natural hydrological patterns can disrupt sediment transport and exacerbate erosion (Fig. 8; Table 4).
Zone 6. This zone is predominantly affected by erosion, with no observed accretion. The maximum erosion rate is −21.18 and −7.75 m yr−1 (EPR) at Namunaghar, and the NSM estimated erosion is −19.44 and −132.39 m at Namunaghar (Fig. S9). In February 2004, immediately before the catastrophic tsunami event, there was no observable presence of stagnant water in the area (Fig. 9). However, by January 2005, following the tsunami, the images distinctly exhibited the stagnant water. In February 2022, the same location exhibited substantial shoreline erosion within the extensive mangrove and agricultural area, accompanied by increased urban development along the shoreline. The progression of urban development was also validated using Google satellite imagery. The sediment carried by ocean currents deposited in low-lying areas caused shallowing and significant changes in ocean water color.
Zone 7. This zone experienced a combination of erosion and accretion between 2004–2005 and 2005–2021. The maximum erosion rate is −8.36 and −11.7 m yr−1 (EPR) at Shore Point, while the maximum accretion rate is 9.77 m yr−1 (EPR). The NSM analysis indicated an erosion of −17.29 m at Shore Point and −199.96 m at North Bay (Fig. S10; Table 4). Notably, a tsunami with a height of 9.6 m was observed at Shore Point.
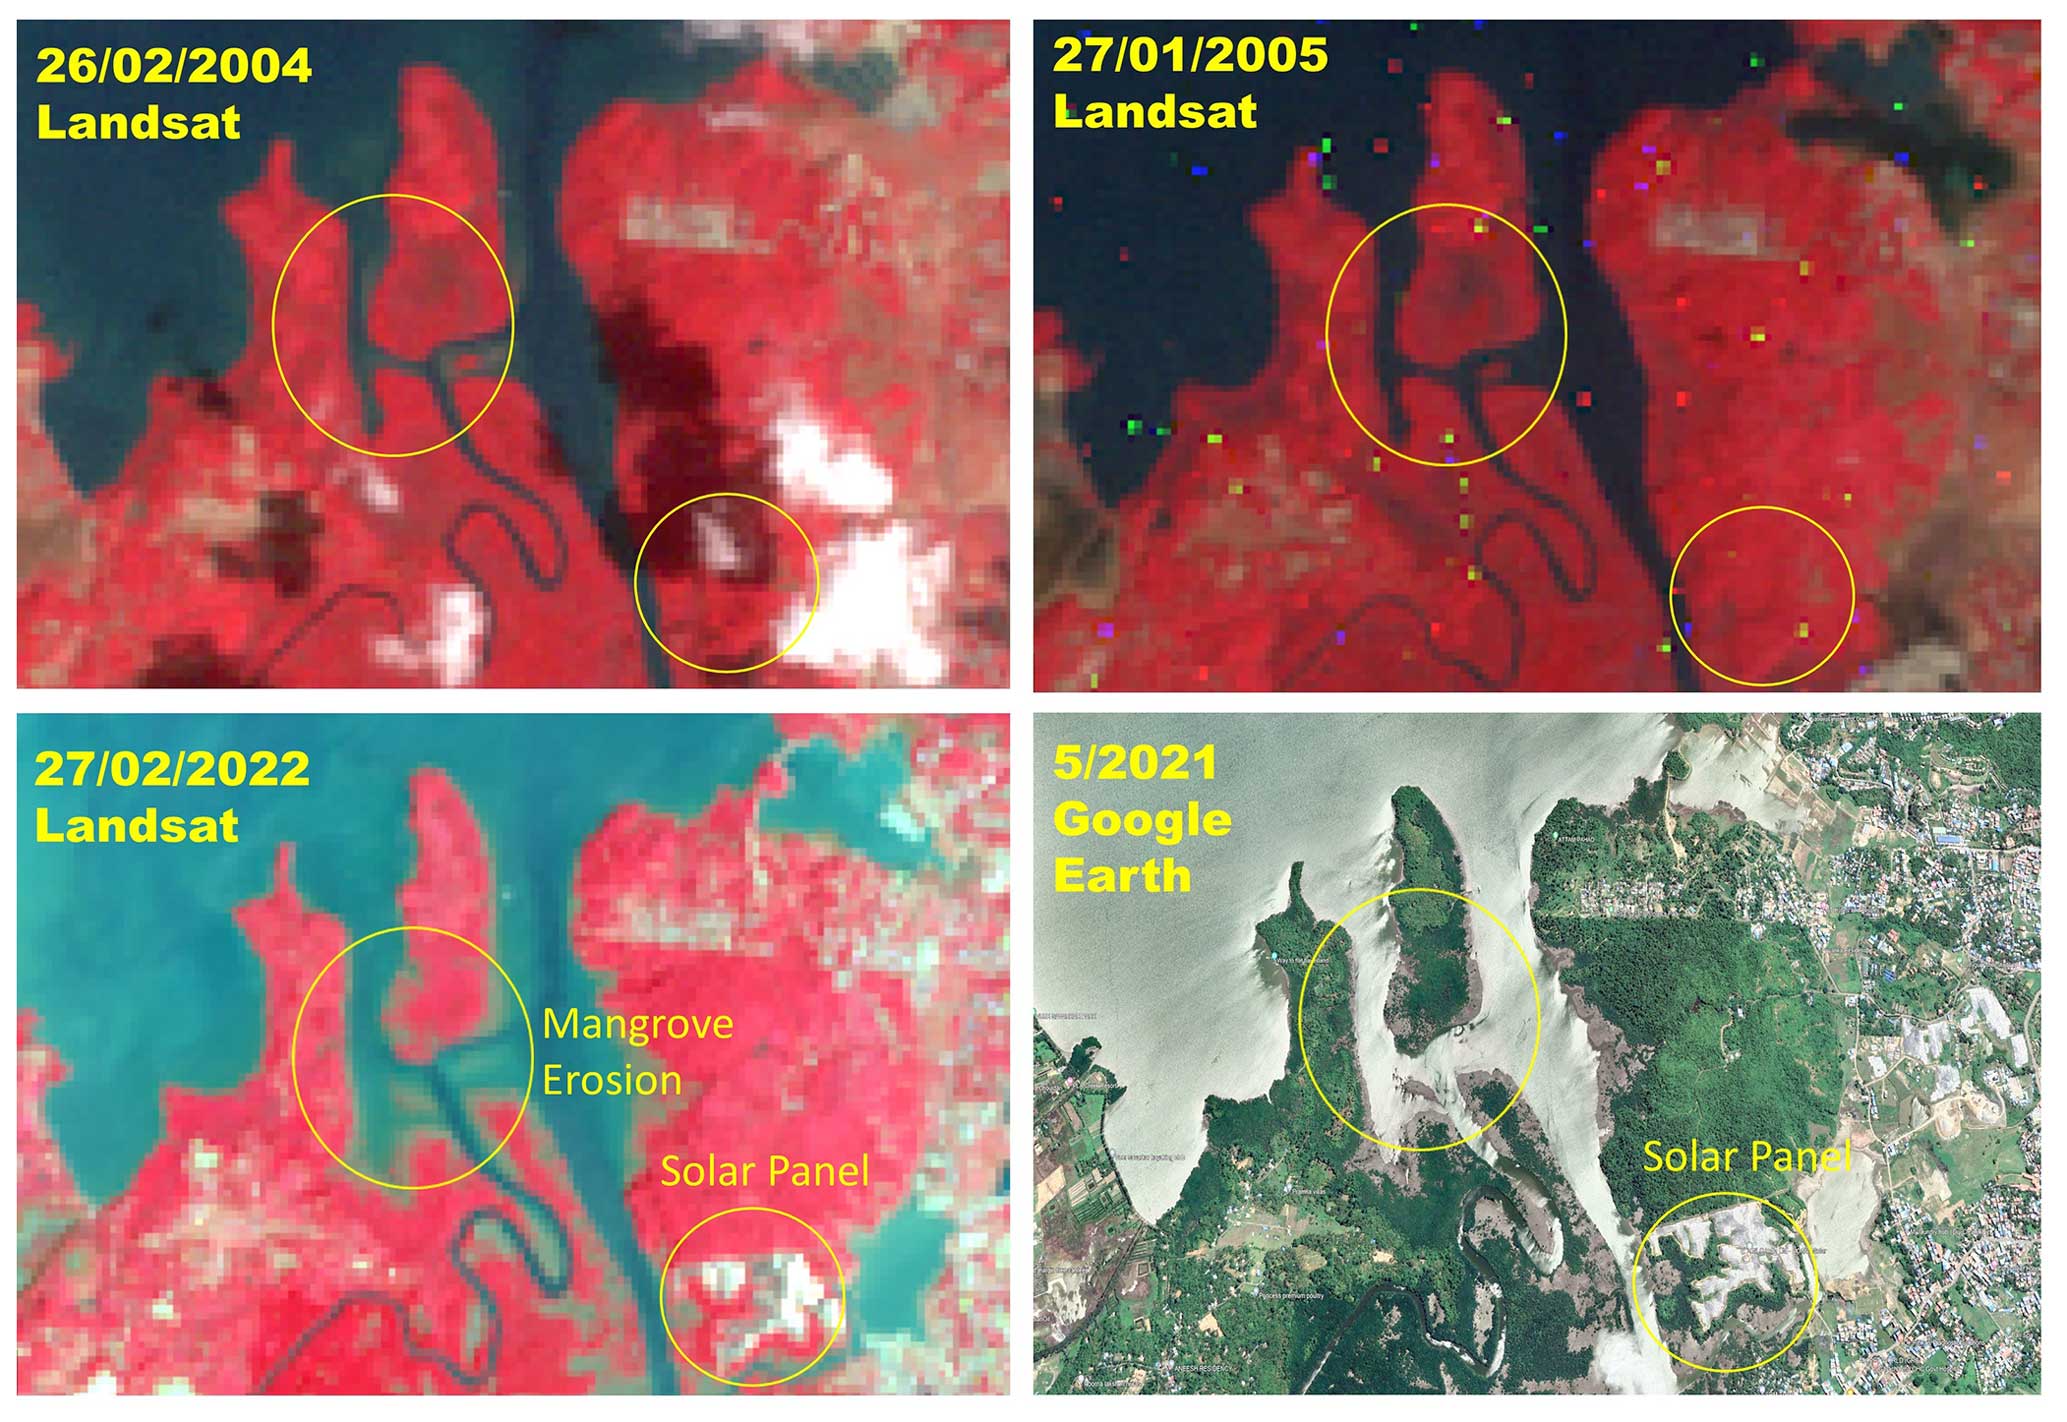
Figure 7Time-lapse satellite imagery from Landsat 8 FCC near the Flat Bay area (marked in yellow circles) during the years 2004 and 2005 showing robust mangrove coverage. However, when comparing the Landsat 8 image in 2022 and the corresponding Google Earth image (© Google Earth), it is apparent that the mangrove ecosystem in this area has experienced substantial erosion and the development of solar panels.
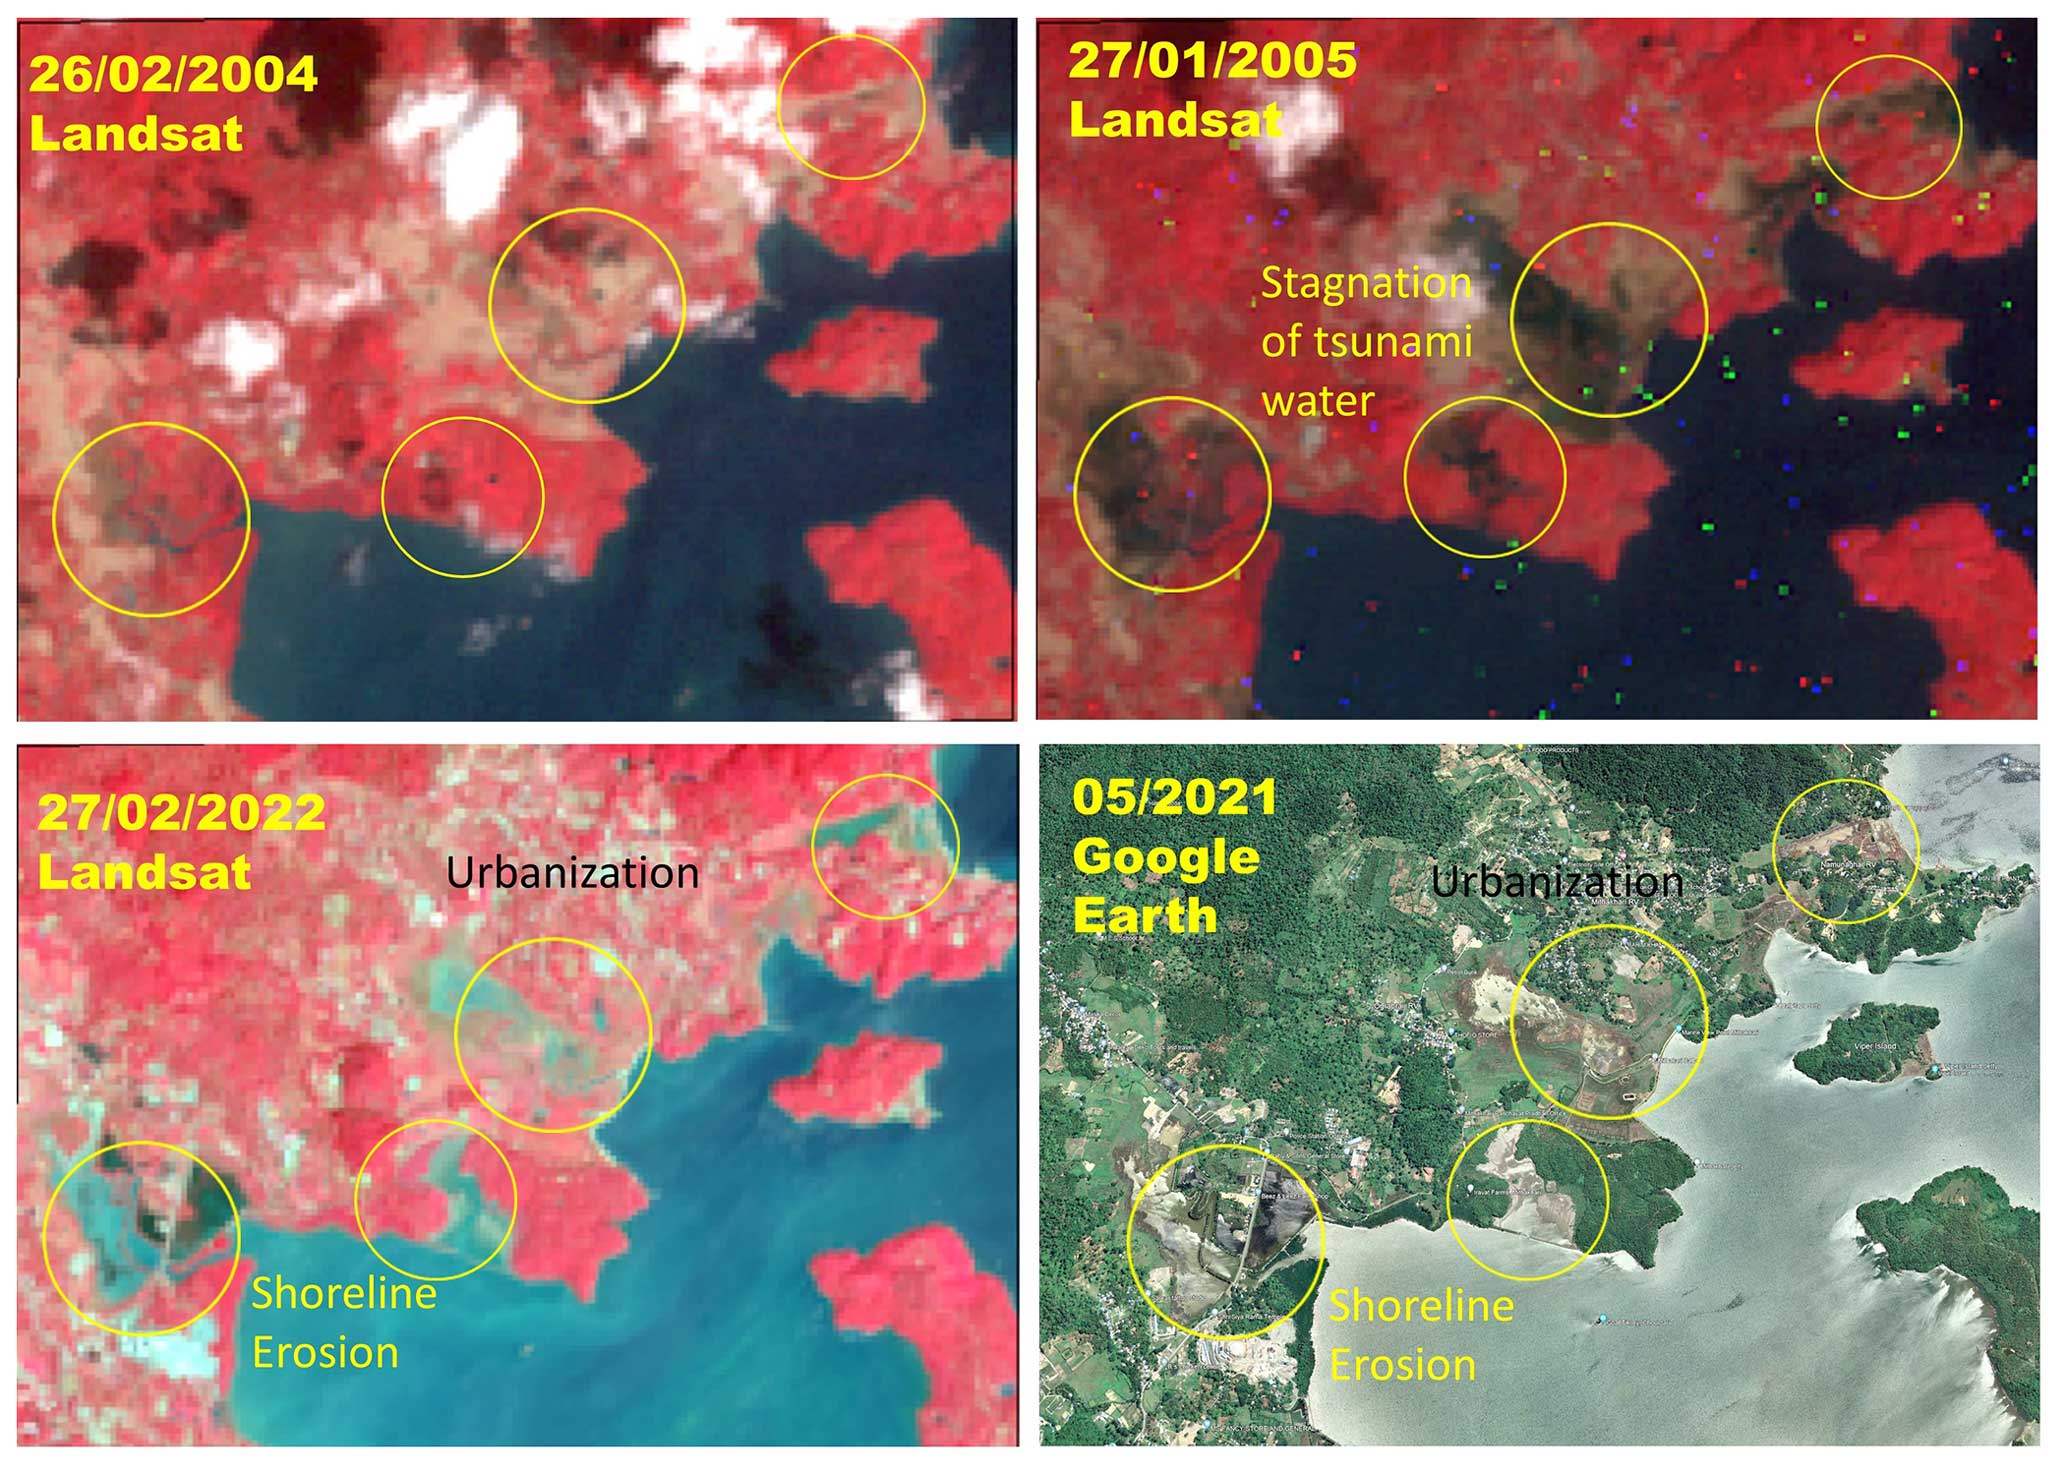
Figure 8Landsat 8 time-lapse imagery and © Google Earth imagery near the Ograbraj and Mithakhari regions depicting the erosion activity during and after the tsunami. The imagery shows significant growth in the built-up areas surrounding the 2004-tsunami-affected areas.
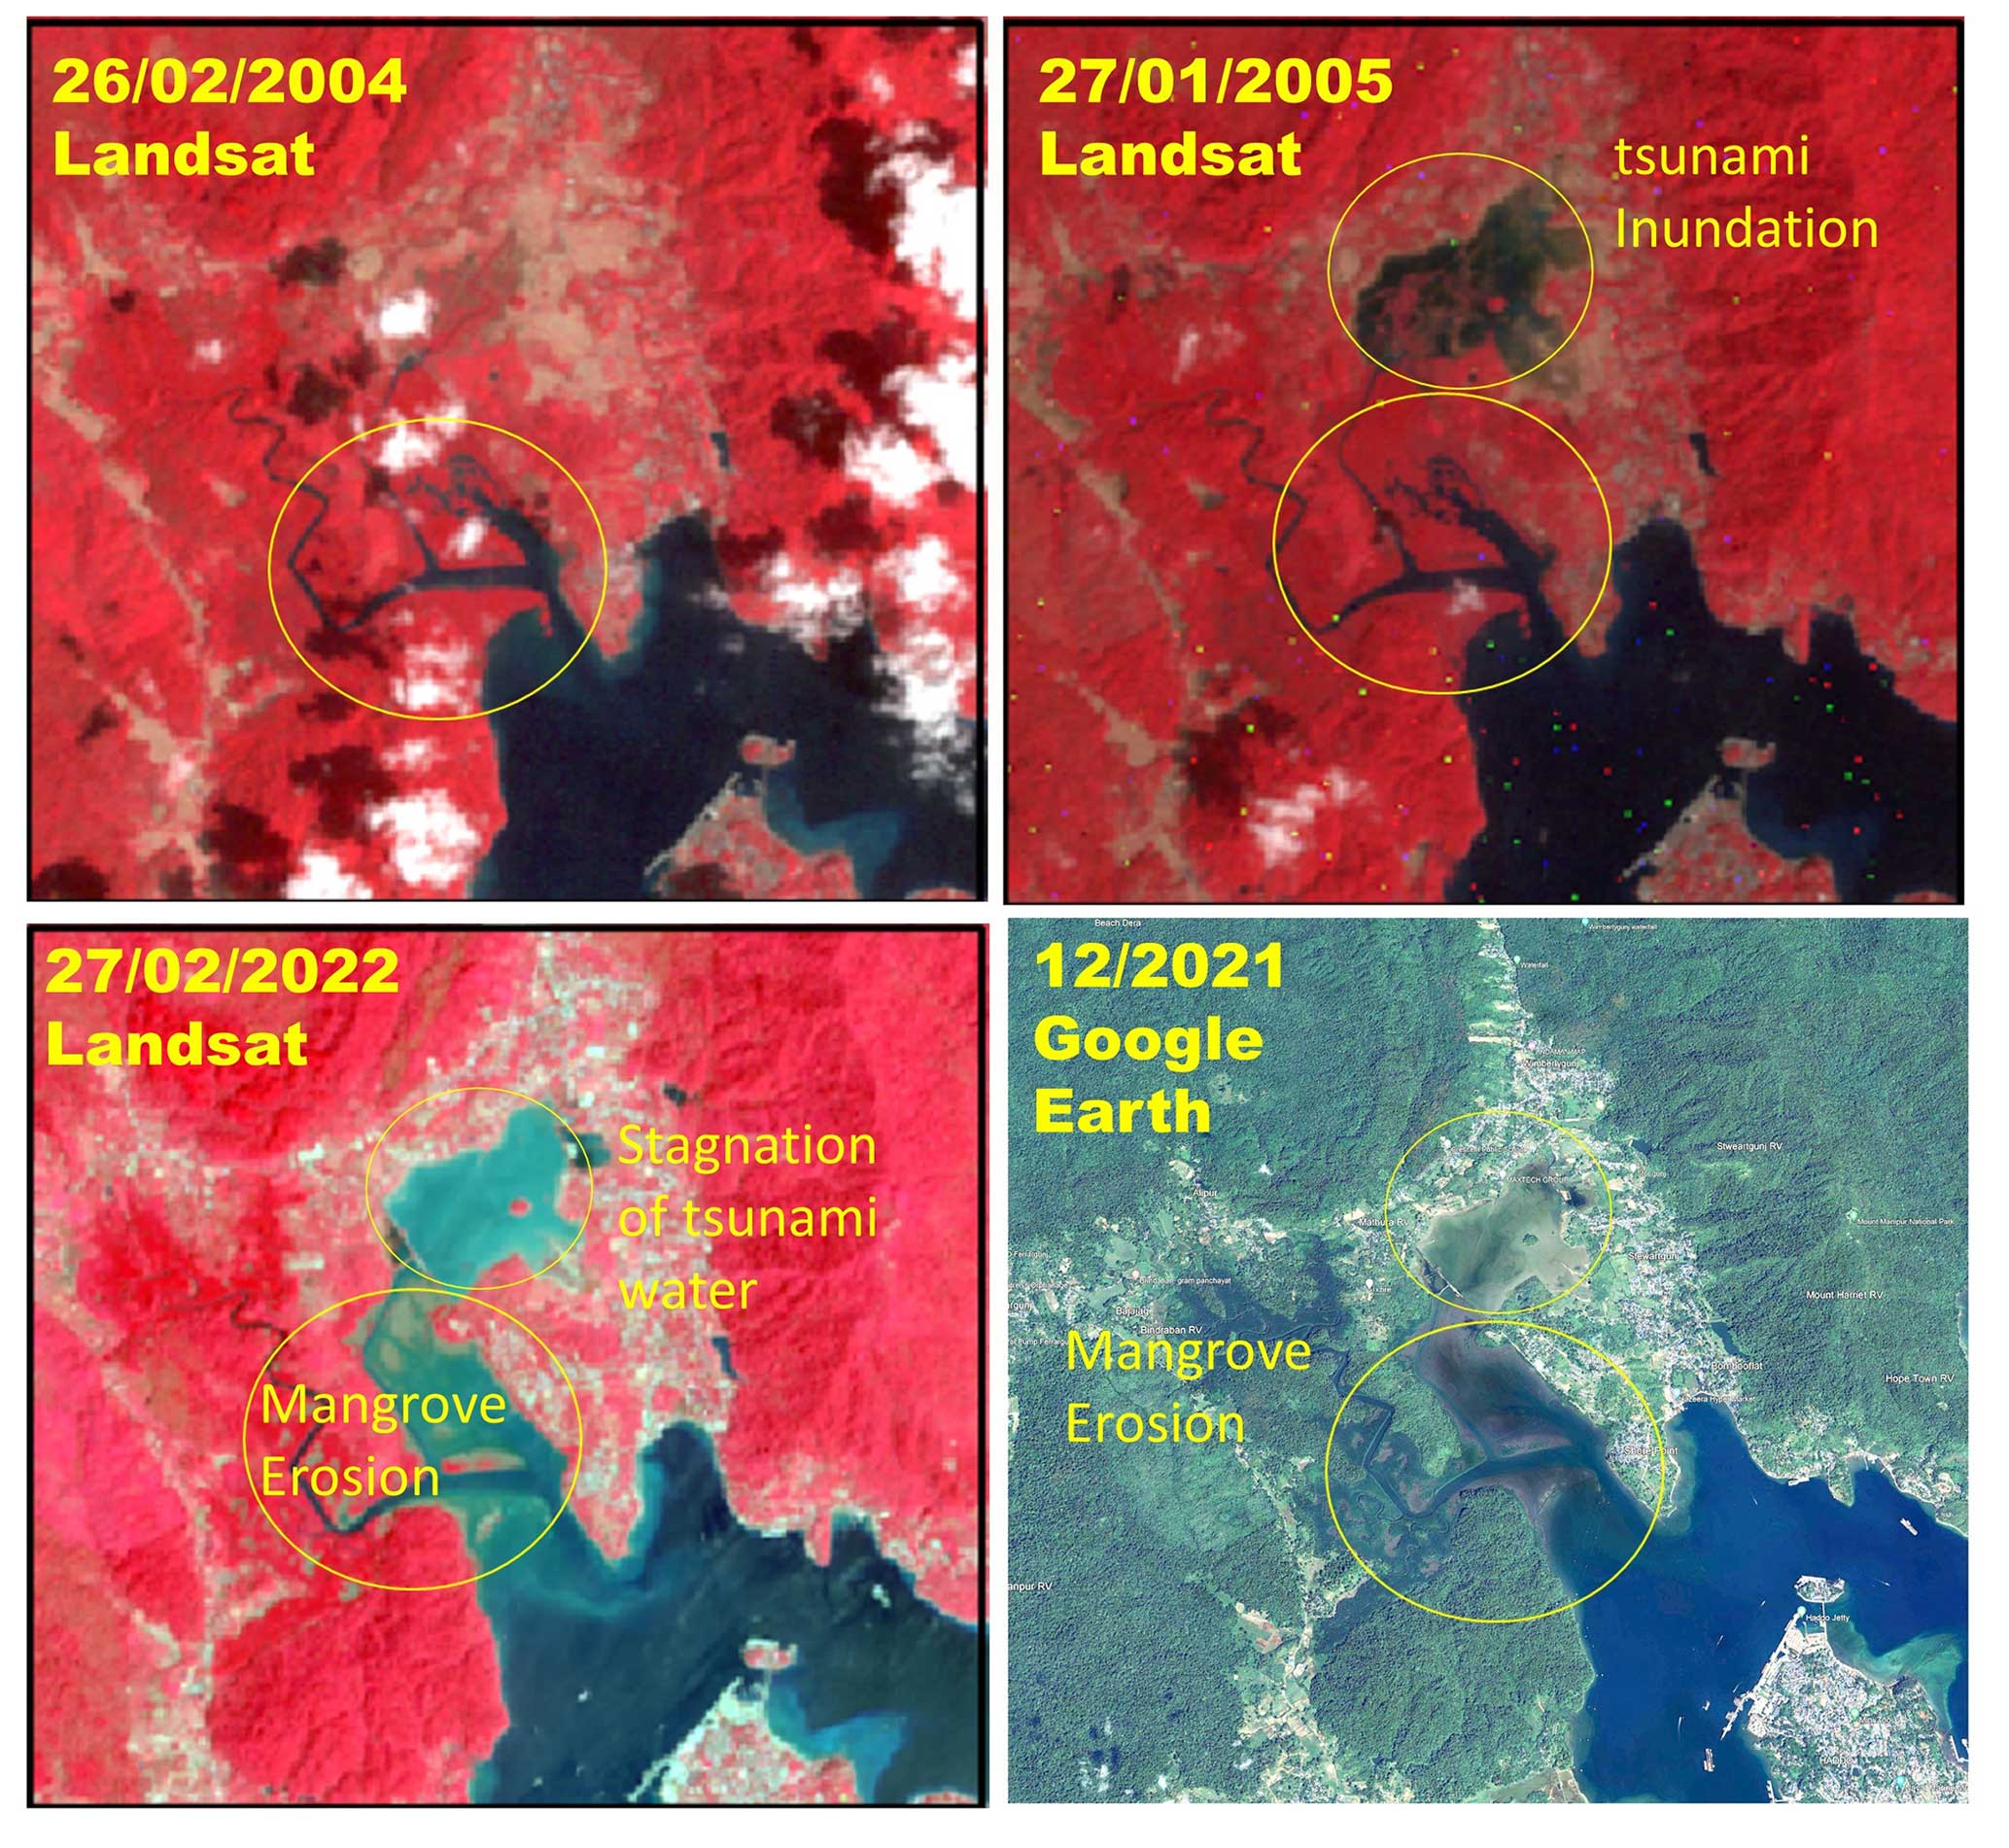
Figure 9Change detection of the shoreline using Landsat 8 time-lapse imagery and © Google Earth imagery: 2004 before the tsunami, 2005 after the tsunami, and the present status of the shoreline in 2022.
The natural rate of shoreline movement in the South Andaman region has increased following the tsunami event, which is attributed to several factors including the removal of vegetation cover, the softening of exposed bedrock, and the destabilization of unconsolidated materials caused by the tsunami, all of which have made the region more susceptible to erosion (Yunus et al., 2016). Comparing the erosion and accretion rates suggests that the erosion rates were significantly smaller during the 2005–2022 period in comparison to the 2004–2005 tsunami, highlighting the adverse effect of the tsunami.
4.3 Land use and land cover (LULC) analysis
LULC is categorized into five distinct classes: built-up area, forest, inundation, cropland, and water bodies (Fig. 10). The overall accuracy obtained is 90.11 %, 89.96 %, and 90.30 %, and with a quantitative assessment of Khat (Kappa) the coefficient is 0.78, 0.762, and 0.79 for the 2004, 2005, and 2022 images, respectively (Table S3). Our primary objective is to determine the extent of land use pattern changes from 2004 to 2022 in areas affected by the 2004 tsunami. Several researchers have already examined the vulnerability and impact of the 2004 tsunami on South Andaman, including Velmurugan et al. (2006) and Sachithanandam et al. (2014).
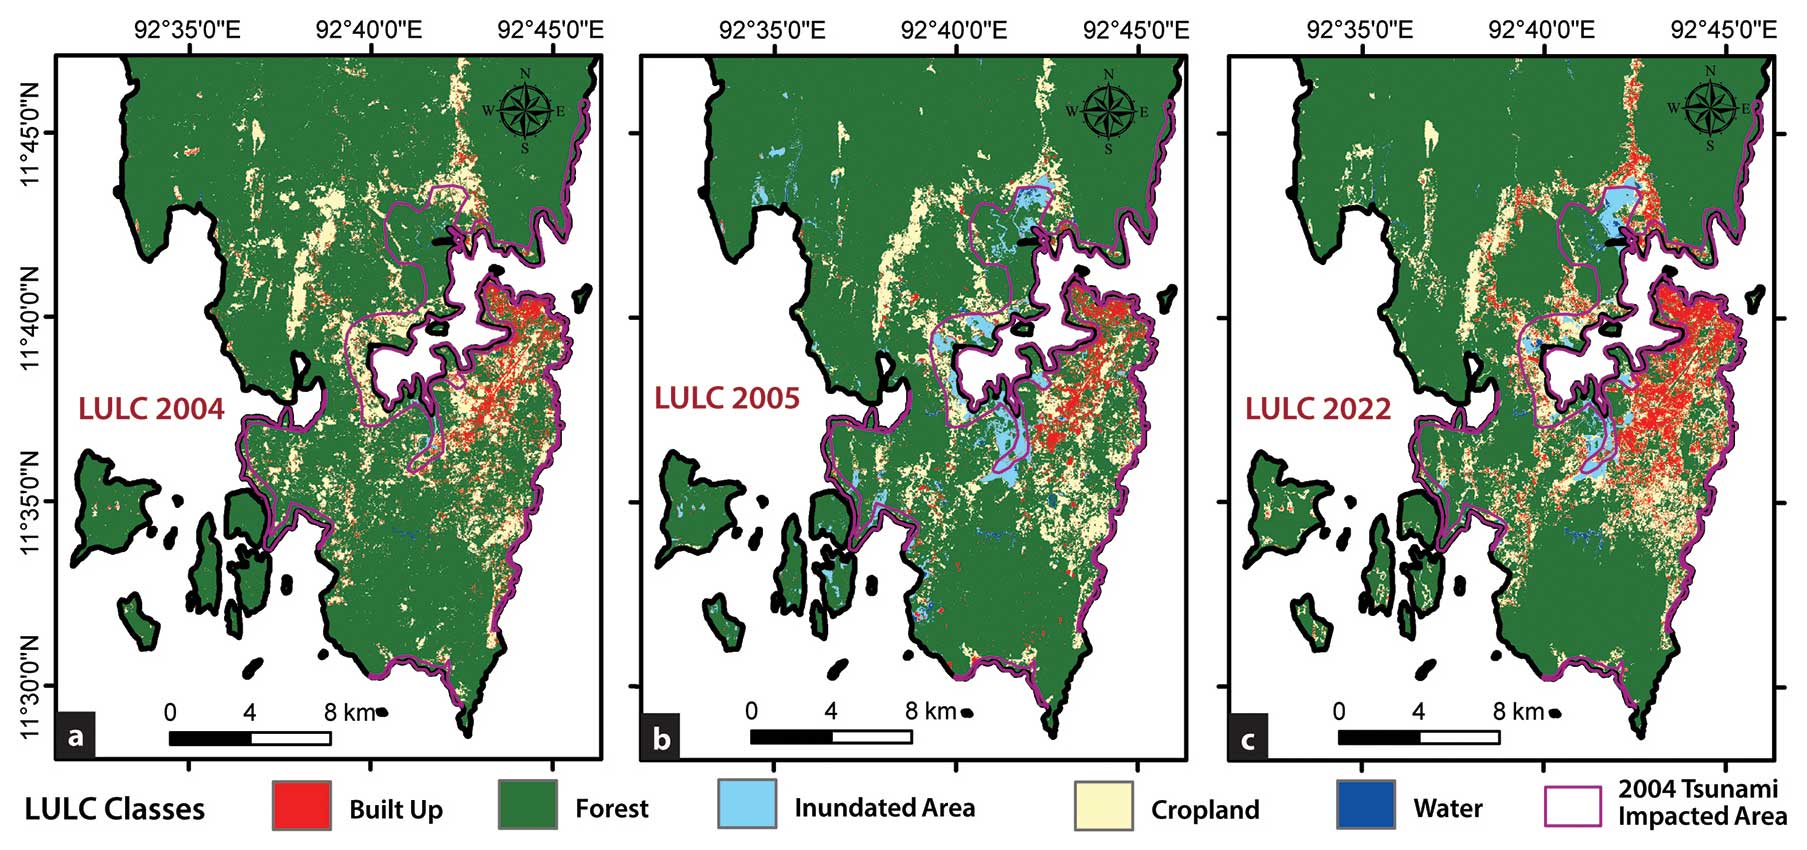
Figure 10(a) LULC 2004, (b) LULC 2005, and (c) LULC 2022 in tsunami-impacted areas (pink outline) in South Andaman.
The LULC classification for the South Andaman region in tsunami-impacted areas in the years 2004, 2005, and 2022 reveals significant changes (Fig. 10; Table 5). (1) The built-up area decreased from ∼7.38 % in 2004 to 6.23 % in 2005, marking a 1.15 % decrease. However, it subsequently increased by 11.11 % by 2022. (2) Cropland coverage decreased from around 22.12 % in 2004 to ∼11.93 % in 2005, indicating a substantial reduction of 10.19 %. It then increased to 17.15 % by 2022. (3) Inundation areas increased from about 3.29 % in 2004 to 27.65 % in 2005, showing a notable rise of 24.36 %. However, by 2022, they decreased by ∼18.57 %. (4) Forested areas saw a significant decrease from ∼66.46 % in 2004 to about 51.10 % in 2005, signifying a reduction of 15.36 %. This decrease persisted in 2022, remaining at ∼51.10 %. (5) Water bodies covered around 0.62 % of the area in 2004, which increased slightly to about 0.76 % in 2005. By 2022 there was a more significant increase, reaching 2.05 %.
The LULC classification for the South Andaman region in the years 2004, 2005, and 2022 shows significant changes (Fig. 10; Table 6).
Table 5LULC analysis for 2004, 2005, and 2022 in the tsunami-impacted area.
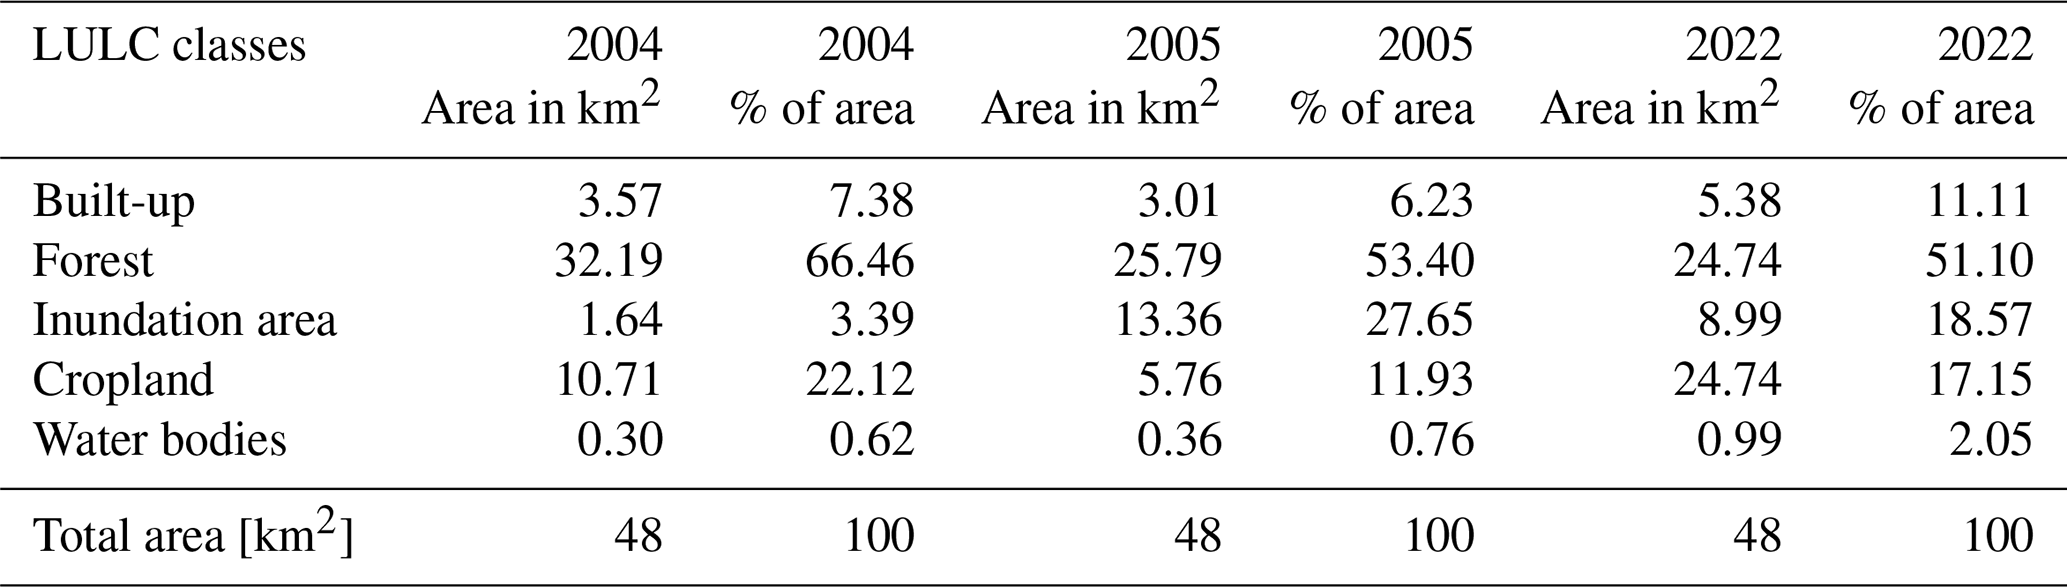
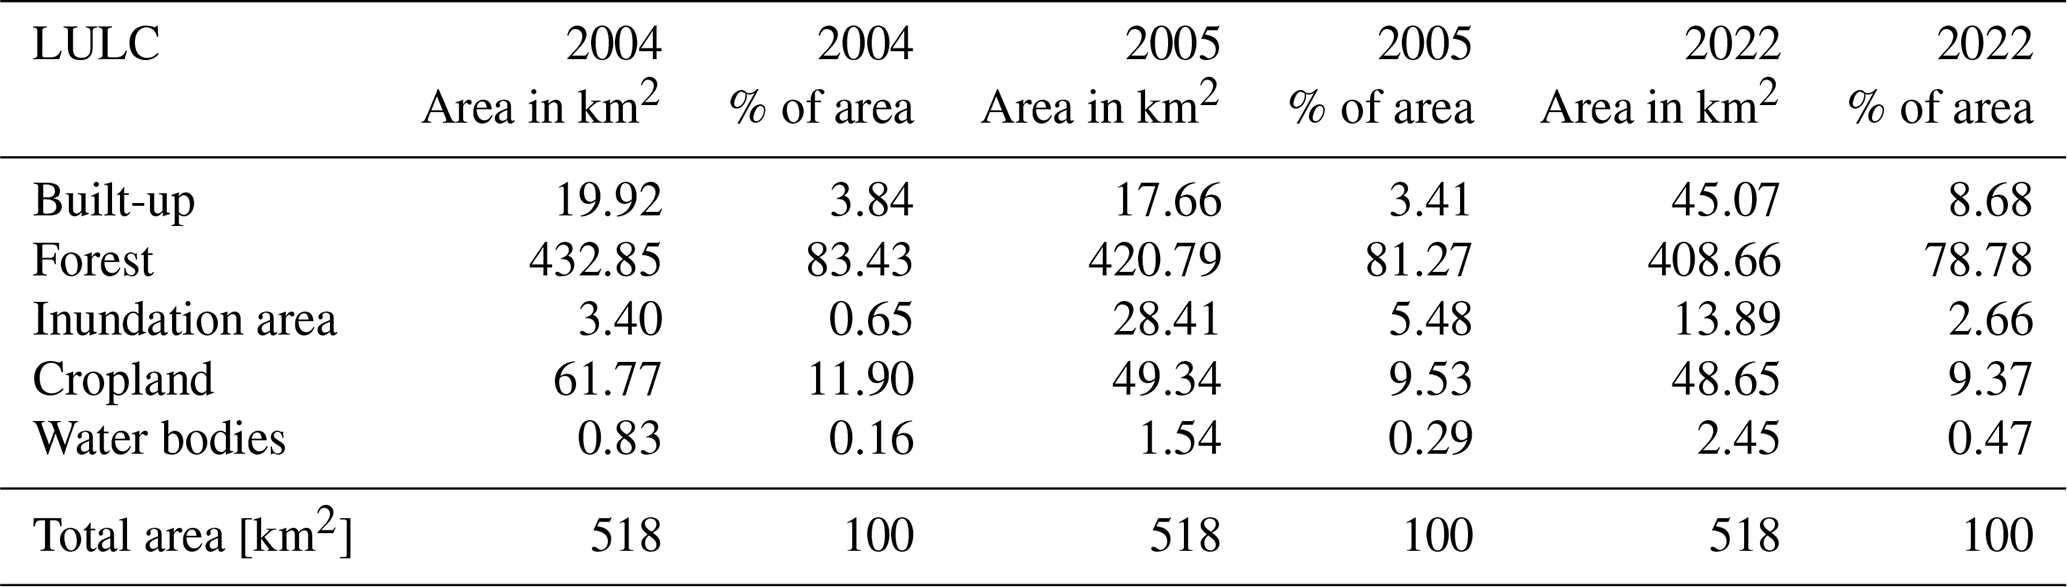
Table 6LULC analysis for 2004, 2005, and 2022 in the study region.
-
Built-up area. In 2004, the built-up area covered 19.92 km2, constituting ∼3.84 % of the total study area. By 2005, this area had reduced to 17.66 km2, accounting for 3.41 % of the total area. By 2022, there was a significant expansion, with the built-up area occupying 45.07 km2, representing 8.68 % of the total region.
-
Forest. In 2004, forests dominated the landscape, covering 432.85 km2, which was approximately 83.43 % of the total study area. By 2005, this forested area slightly decreased to 420.79 km2, comprising 81.27 % of the total area. However, by 2022, the forest cover continued to decline, with an area of 408.66 km2, accounting for 78.78 % of the total region.
-
Inundation area. In 2004, the inundation area was limited, covering 3.40 km2 or 0.65 % of the total area. In 2005, there was a substantial increase, expanding to 28.41 km2, which represented 5.48 % of the total area. By 2022, the inundation area decreased to 13.89 km2, making up 2.66 % of the total region.
-
Cropland. Cropland covered 61.77 km2 in 2004, accounting for 11.90 % of the total study area. By 2005, this area had reduced to 49.34 km2, representing 9.53 % of the total area. In 2022, the cropland area further decreased to 48.65 km2, making up 9.37 % of the total region.
-
Water bodies. In 2004, water bodies covered a small area of 0.83 km2, approximately 0.16 % of the total area. By 2005, this area had slightly increased to 1.54 km2, constituting 0.29 % of the total region. There was a more significant expansion during 2022, with water bodies occupying 2.45 km2, accounting for 0.47 % of the total area.
The complex interaction between geomorphology, shoreline change, LULC changes, and economic factors affecting tsunami vulnerability and impact assessment in South Andaman is discussed below.
5.1 Shoreline changes vs. LULC
The impact of tsunamis varies due to differences in landforms, relief, slope, elevation, and the presence (or absence) of natural barriers such as coral reefs and mangroves. It has been observed that for a given water depth on the shelf (if the continental slope is steeper), greater mangrove cover, greater relief, and higher elevation can result in a greater amount of energy being reflected, leading to a lower tsunami wave height on the shelf. On the other hand, with a flatter slope, low relief, and less vegetation cover area on the coastal side, the reduced reflection and effect of shoaling can increase tsunami wave height (Siva and Behera, 2016). Coastal erosion is a natural process in South Andaman that occurs when waves, currents, tsunamis, and tides erode the shoreline, removing sediment and land over time. Factors such as sea-level rise, wave energy, storm events, and human activities can contribute to increased rates of erosion.
Over time, the geomorphological landforms continue to shape and modify the landscape. However, human activities and developmental pressures are significant drivers of LULC change in South Andaman (Fig. 10a–c). Common LULC changes observed in the area include deforestation for urban expansion, conversion of land for agriculture, infrastructure development, and alterations to the coastal zone (Yuvaraj et al., 2014; Thakur et al., 2017; Jaman et al., 2022). The interaction between geomorphology and LULC change is particularly evident in the coastal regions of South Andaman, where coastal erosion and accretion processes influence both LULC patterns and development decisions. The erosion occurring near the shoreline leads to the loss of valuable land, affecting agricultural areas and forest regions (Figs. 7–9). Conversely, accretion processes can contribute to the growth of coastal areas by building new landforms and influencing land use decisions in those locations (Nagabhatla et al., 2006; Ali and Narayana, 2015; Mageswaran et al., 2021).
5.2 Inundation and run-up observation
Our computations have shown that the tsunami wave heights for around 5.5 m inundation (90 m) were observed in Bamboo Flat (Fig. 4b). Similarly, the harbor area of Port Blair has seen structural failures in some building foundations, and our computations show wave heights of 3.6 m in that area. In Chidiya Tapu, which is 25 km from Port Blair, the estimated run-up is 3.9 m, and the inundation is 585 m, which shows a gradual slope in the region (Fig. 2). Coming to the South Point Magar area (Port Blair), a high run-up of 8.5 m is computed, and the inundation level is 550 m. Houses located near the open sea were completely washed away. At Wandoor Jetty in Port Blair, the calculated run-up is 3.46 m, the inundation is 450 m, and saltwater intrusion was observed due to the tsunami.
5.3 LULC vs. economic change
The presence of people, infrastructure, or assets in a hazard-prone location is referred to as exposure, and vulnerability is the degree to which a person, community, or system is susceptible to the impacts of a hazard. Vulnerability is determined by physical, social, economic, and environmental factors (UNDRR, 2017). Several factors can contribute to changes in exposure, such as population growth, industrial development, and LULC change. It is anticipated that the population of the Andaman and Nicobar Islands will double by 2050 (Nanda and Haub, 2007), and the islands are experiencing an increasing influx of tourists. The increased population density in these regions intensifies the strain on already vulnerable lands. As a result, when a disaster such as a natural calamity occurs in these areas, it affects the tourists and has severe repercussions for the large local population heavily dependent on tourism-related activities (Shaw and Williams, 2006; Wood et al., 2019; Sathiparan, 2020; Hamuna et al., 2019; Population Census, 2024). The increases in population from 1971 to 2020, as well as increases in built-up areas, are shown before and after the 2004 tsunami, and the GSDP from 2001 to 2020 in tsunami-prone areas of South Andaman is shown in Fig. 11.
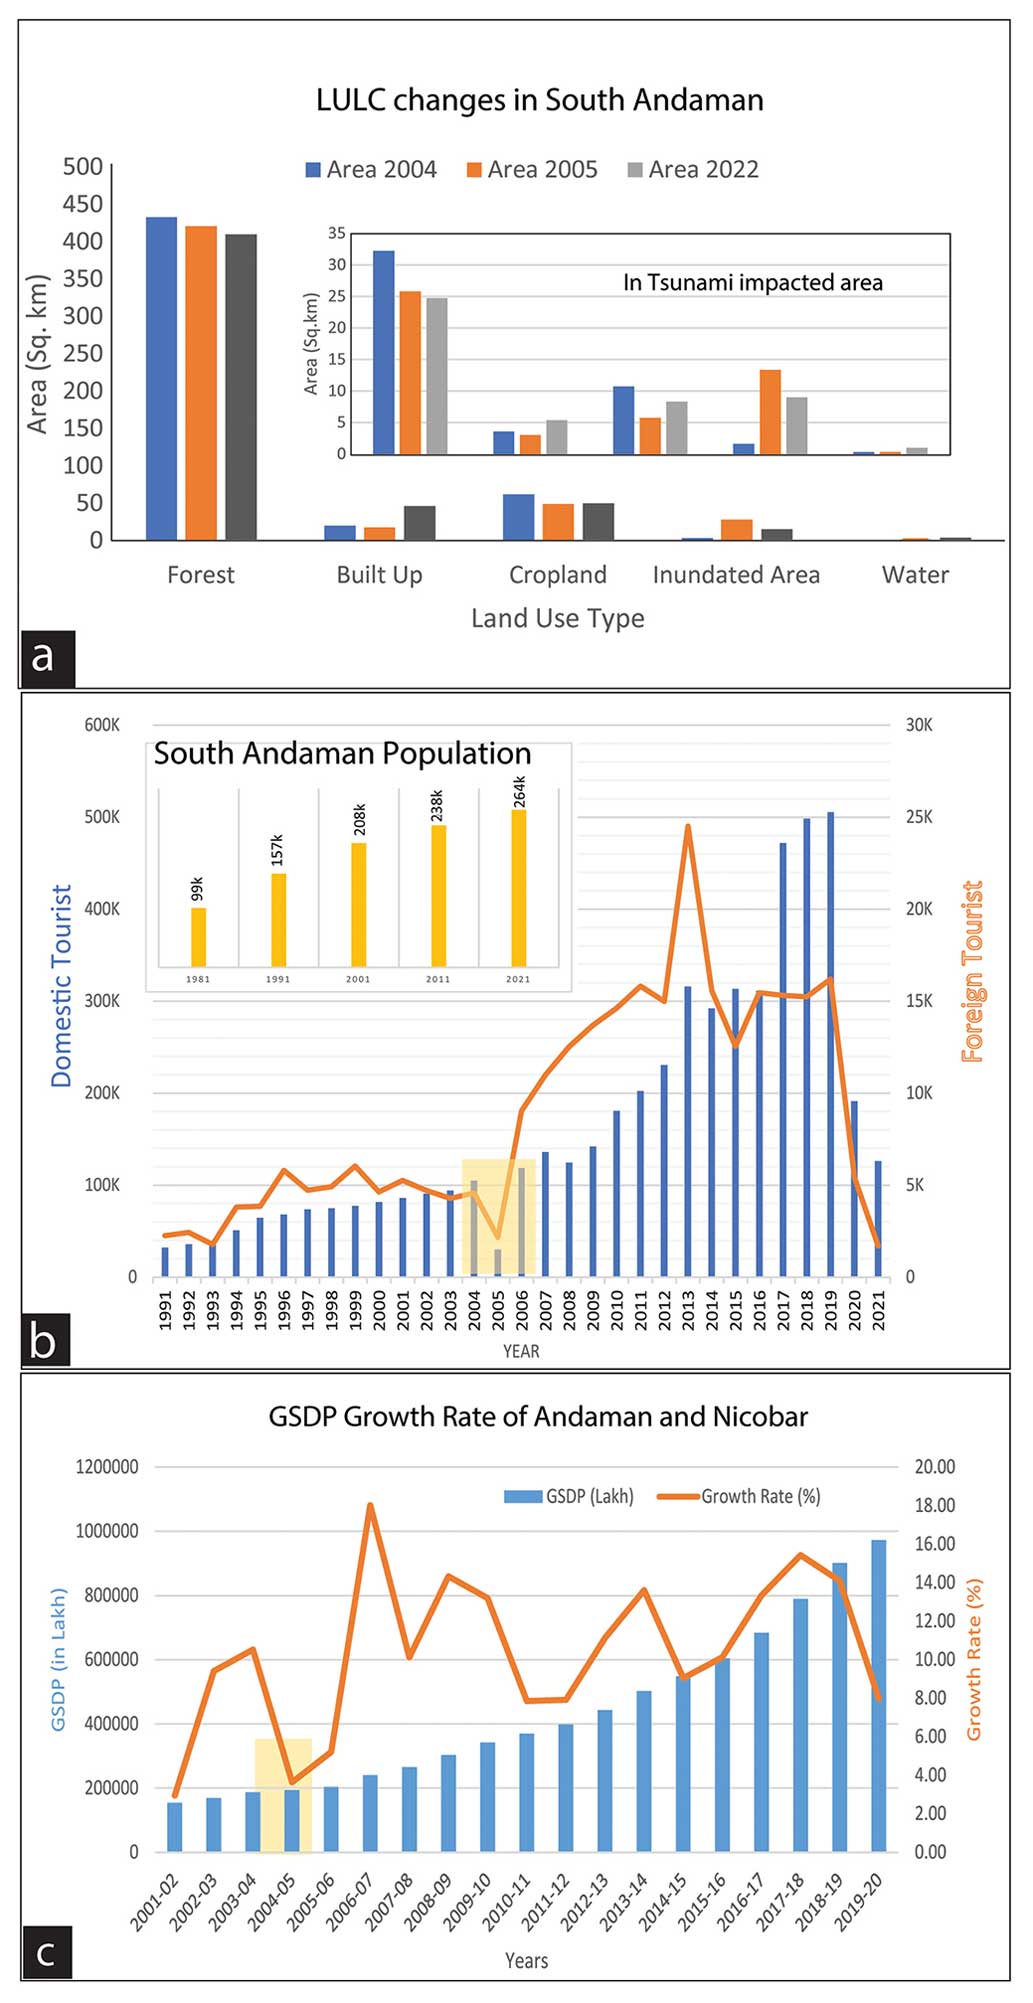
Figure 11(a) LULC change in South Andaman and in the 2004-tsunami-affected areas. The LULC classification reveals that there has been a significant increase in built-up areas, inundated areas, and water bodies, while the agricultural land and vegetation have decreased. The increasing trends of tourists and local population in South Andaman can be seen in (b). The GSDP growth rate shows the macroeconomic impact on GSDP in 2005 due to the tsunami impact (c). Note that 1 lakh = 100 000.
The increase in built-up areas could also positively impact the GSDP by boosting the construction and real-estate sectors and providing more job opportunities in the tourism and hospitality industries (Fig. 11a). The 2004 Indian Ocean tsunami significantly impacted the GSDP of the Andaman and Nicobar Islands, particularly in the tourism and fisheries industries (Fig. 11c). According to a report by the National Institute of Disaster Management, the Andaman and Nicobar Islands suffered losses amounting to INR 7.5 billion due to the 2004 tsunami, with damages to the tourism industry being the most significant. It is important to carefully manage this growth and ensure sustainable development practices protecting both the natural environment and the local population's well-being. This includes implementing effective disaster preparedness measures, promoting sustainable tourism practices, and balancing economic development with environmental conservation in the region.
5.4 Implication for changing scenario of vulnerability
India Inc. estimates that the total losses surpassed INR 30 billion. Specifically, the losses in the Andaman and Nicobar Islands exceeded INR 10 billion as per industry estimates (The Economic Times, 2004). If a tsunami of similar magnitude were to occur again, the economic loss would be 5 times as high as that experienced in 2004. After the 2004 tsunami, the coastal area experienced significant development, with built-up areas expanding in already-affected areas from ∼7.38 % in 2004 to ∼11.11 % in 2022. This increase in urbanization and infrastructure means that more properties, businesses, and critical facilities are now located in the coastal zone. The affected region's local population grew from 208 000 in 2001 to 264 000 in 2021 (Fig. 11b). With more people living in the coastal area, there is a higher risk of casualties and a greater demand for resources and aid during and after a tsunami. The number of tourists visiting the coastal area has increased significantly, from 98 000 tourists in 2001 to 500 000 by 2019 (Fig. 11b). Tourists are generally less familiar with local hazards and evacuation routes, making them more vulnerable during a tsunami. The presence of a large number of tourists can add complexity to evacuation and relief efforts, potentially leading to higher economic losses. The region has experienced a sharp decline in forest and cropland areas. Forests act as natural buffers, helping to reduce the impact of a tsunami by absorbing some of the wave energy. Additionally, the loss of cropland can disrupt the supply chain during and after a disaster, affecting food availability and leading to economic losses beyond property damage.
The South Andaman region is vulnerable to tsunamis due to its location in the seismically active zone. In such an environment, tsunami preparedness and resilience are crucial. This includes implementing effective early-warning systems, raising public awareness, and strengthening infrastructure resilience. Incorporating ecosystem-based approaches, such as preserving and restoring natural coastal land, can also contribute to reducing tsunami vulnerability. The South Andaman region is prone to shoreline changes due to natural processes and human activities. Regular monitoring and assessment of these changes is crucial to understanding their impacts on coastal ecosystems and communities. Implementing appropriate coastal management strategies, such as beach nourishment, dune restoration, and erosion control measures, can help mitigate the negative effects of shoreline changes. It is important to adopt sustainable land use practices that balance economic development with resource conservation and responsible use. This involves promoting eco-friendly tourism, protecting sensitive ecosystems like mangroves and coral reefs, and implementing land use planning that considers the carrying capacity and vulnerability of the region. Tsunami modeling along the coastal locations shall help decision-makers to construct structures along the coast. Decision-makers will also be able to quantify the tsunami impact on sloping beaches, flat beaches, and areas with boulders/mangroves. Engaging local communities, stakeholders, and indigenous knowledge holders in decision-making processes and promoting capacity-building initiatives are critical for ensuring the sustainable development of the Andaman region.
All data included in this study are available upon request by contacting the corresponding author.
The supplement related to this article is available online at: https://doi.org/10.5194/nhess-24-3013-2024-supplement.
VG: computations, fieldwork, and paper writing. KKA: TUNAMI-N2 computation, fieldwork, and paper writing. AKP: paper editing and contribution of ideas and suggestions. KS: paper writing and TUNAMI-N2 computations.
The contact author has declared that none of the authors has any competing interests.
Publisher's note: Copernicus Publications remains neutral with regard to jurisdictional claims made in the text, published maps, institutional affiliations, or any other geographical representation in this paper. While Copernicus Publications makes every effort to include appropriate place names, the final responsibility lies with the authors.
The authorsacknowledge encouragement and permission to publish from the director of CSIR-NGRI, Prakash Kumar (ref. no. NGRI/Lib/2024/Pub-51).
This research has been supported by CSIR-NGRI (grant no. MLP-7014-28 to AKP). Vikas Ghadamode received a fellowship to pursue a PhD from the university grants commission, UGC, India (grant no. 10/UGC-JRF/209/19-ESTT).
This paper was edited by Brunella Bonaccorso and reviewed by Gordon Woo and one anonymous referee.
Ali, P. Y. and Narayana, A. C.: Short-term morphological and shoreline changes at Trinkat Island, Andaman and Nicobar, India, after the 2004 tsunami, Mar. Geod., 38, 26–39, https://doi.org/10.1080/01490419.2014.908795, 2015.
Bandopadhyay, P. C. and Carter, A.: Introduction to the geography and geomorphology of the Andaman–Nicobar Islands, Chap. 2, Geological Society, London, Memoirs, 47, 9–18, https://doi.org/10.1144/M47.2, 2017.
Bhat, G. R., Balaji, S., and Yousuf, M.: Tectonic geomorphology and seismic hazard of the east boundary thrust in northern segment of the Sunda–Andaman subduction zone, Nat. Hazards, 116, 401–423, https://doi.org/10.1007/s11069-022-05680-6, 2023.
Boak, E. H. and Turner, I. L.: Shoreline definition and detection: a review, J. Coastal Res., 21, 688–703, https://doi.org/10.2112/03-0071.1, 2005.
Cho, Y. S., Lakshumanan, C., Choi, B. H., and Ha, T. M.: Observations of run-up and inundation levels from the teletsunami in the Andaman and Nicobar Islands: A field report, J. Coastal Res., 24, 216–223, https://doi.org/10.2112/06-0662.1, 2008.
Cooper, J. A., Jackson, D., Nava, F., McKenna, J., and Malvarez, G.: Storm impacts on an embayed high energy coastline, western Ireland, Mar. Geol., 210, 261–280, https://doi.org/10.1016/j.margeo.2004.05.012, 2004.
Crowell, M., Douglas, B. C., and Leatherman, S. P.: On forecasting future US shoreline positions: a test of algorithms, J. Coastal Res., 13, 1245–1255, 1997.
Curray, J. R.: Tectonics and history of the Andaman Sea region, J. Asian Earth Sci., 25, 187–232, https://doi.org/10.1016/j.jseaes.2004.09.001, 2005.
Dani, B., Srivastava, V., Singh, A., and Bhatla, R.: Numerical modeling of tsunami wave to assess the possible impacts along western coasts of India, MAUSAM, 74, 1131–1140, https://doi.org/10.54302/mausam.v74i4.6028, 2023.
Dao, M. H. and Tkalich, P.: Tsunami propagation modelling – a sensitivity study, Nat. Hazards Earth Syst. Sci., 7, 741–754, https://doi.org/10.5194/nhess-7-741-2007, 2007.
Dar, I. A. and Dar, M. A.: Prediction of shoreline recession using geospatial technology: a case study of Chennai Coast, Tamil Nadu, India, J. Coastal Res., 25, 1276–1286, 2009.
Davis, R. A.: Human Impact on Coasts, in: Encyclopedia of Coastal Science. Encyclopedia of Earth Sciences Series, edited by: Finkl, C. W. and Makowski, C., Springer, Cham, https://doi.org/10.1007/978-3-319-93806-6_175, 2019.
Den Boer, E. L., Suntoyo, and Oele, A. C.: Determination of shoreline change along the East-Java coast, using the Digital Shoreline Analysis System, in: MATEC Web of Conferences, vol. 177, EDP Sciences, 01022, https://doi.org/10.1051/matecconf/201817701022, 2018.
Dolan, R., Fenster, M. S., and Holme, S. J.: Temporal analysis of shoreline recession and accretion, J. Coastal Res., 7, 723–744, 1991.
Fletcher, C. H., Romine, B. M., Genz, A. S., Barbee, M. M., Dyer, M., Anderson, T. R., Lim, S. C., Vitousek, S., Bochicchio, C., and Richmond, B. M.: National assessment of shoreline change: Historical shoreline change in the Hawaiian Islands, https://pubs.usgs.gov/of/2011/1051 (last access: 26 August 2024), 2011.
Ghadamode, V., Srivastava, K., Singh, R. K., and Pandey, A. K.: Spatial analysis techniques for tsunami vulnerability and inundation mapping of Andaman region using remote sensing, GIS, AHP, and Fuzzy logic methods, Environ. Earth Sci., 81, 427, https://doi.org/10.1007/s12665-022-10548-w, 2022.
Ghosh, T., Jana, P., Giritharan, S., Bardhan, S., Basir, S. R., and Roy, A. G.: Tsunami Survey in Andaman Nicobar Group of Islands, Sumatra–Andaman Earthquake and Tsunami, Geological Survey of India, Special Report no. 89, 165–184, 2004.
Goto, C., Ogawa, Y., Shuto, N., and Imamura, F.: Numerical method of tsunami simulation with the Leap-Frog Scheme (IUGG/IOC Time Project), IOC Manual, no. 35, UNESCO, https://www.jodc.go.jp/info/ioc_doc/Manual/122367eb.pdf (last access: 26 August 2024), 1997.
Hamuna, B., Kalor, J. D., and Tablaseray, V. E.: The impact of tsunami on mangrove spatial change in the eastern coast of Biak Island, Indonesia, Journal of Ecological Engineering, 20, 1–6, https://doi.org/10.12911/22998993/95094, 2019.
Himmelstoss, E., Henderson, R. E., Kratzmann, M. G., and Farris, A. S.: Digital shoreline analysis system (DSAS) version 5.1 user guide, no. 2021-1091, US Geological Survey, https://doi.org/10.3133/ofr20211091, 2021.
Imamura, F.: Review of Tsunami Simulation with a Finite Difference Method, in: Long-Wave Runup Models, edited by: Yeh, H., Liu, P., and Synolakis, C. E., World Scientific Publishing, Singapore, 25–42, https://cir.nii.ac.jp/crid/1573950400649241216 (last access: 30 August 2024) 1996.
Imamura, F. and Imteaz, M. A.: Long waves in two-layers: governing equations and numerical model, Science of Tsunami Hazards, 13, 3–24, 1995.
Imamura, F., Yalciner, A. C., and Ozyurt, G.: Tsunami modeling manual. UNESCO Tsunami modeling course, UNESCO, https://www.tsunami.irides.tohoku.ac.jp/media/files/_u/project/manual-ver-3_1.pdf (last access: 26 August 2024), 2006.
Ioualalen, M., Asavanant, J., Kaewbanjak, N., Grilli, S. T., Kirby, J. T., and Watts, P.: Modeling the 26 December 2004 Indian Ocean Tsunami: Case study of impact in Thailand, J. Geophy. Res., 112, C07024, https://doi.org/10.1029/2006JC003850, 2007.
Jain, S. K., Murty, C. V. R., Rai, D. C., Malik, J. N., Sheth, A., and Jaiswal, A.: Effects of M9 Sumatra earthquake and tsunami of December 26, 2004, Curr. Sci. India, 88, 357–359, 2005.
Jaman, T., Dharanirajan, K., and Rana, S.: Land use and Land cover Change detection and Its Environmental Impact on South Andaman Island, India using Kappa coefficient Statistical Analysis and Geospatial Techniques, https://www.irjet.net/archives/V9/i4/IRJET-V9I454.pdf (last access: 26 August 2024), 2022.
Jayakumar, K. and Malarvannan, S.: Assessment of shoreline changes over the Northern Tamil Nadu Coast, South India using WebGIS techniques, J. Coast. Conserv., 20, 477–487, https://doi.org/10.1007/s11852-016-0461-9, 2016.
Jayson-Quashigah, P. N., Addo, K. A., and Kodzo, K. S.: Medium resolution satellite imagery as a tool for monitoring shoreline change. Case study of the Eastern coast of Ghana, J. Coastal Res., 65, 511–516, https://doi.org/10.2112/SI65-087.1, 2013.
Joesidawati, M. I.: Shoreline change in Tuban district, East Java using geospatial and digital shoreline analysis system (DSAS) techniques, International Journal of Oceans and Oceanography, 10, 235–246, 2016.
Kumar, S. T., Mahendra, R. S., Nayak, S., Radhakrishnan, K., Sahu, K. C.: Coastal vulnerability assessment for Odisha state, East coast of India, J. Coastal Res. 26, 523–534, https://doi.org/10.2112/09-1186.1, 2010.
Kumari, P., Jnaneswari, K., Rao, D., and Sridhar, D.: Application of remote sensing and geographical information system techniques on geomorphological mapping of coastal part of East Godavari district. Andhra Pradesh, India, Int. J. Eng. Sci. Tech., 4, 4296–4300, https://agris.fao.org/search/en/providers/122415/records/647367aa53aa8c89630cddf9 (last access: 30 August 2024), 2012.
Leatherman, S. P.: Shoreline change mapping and management along the US East Coast, J. Coastal Res., 38, 5–13, http://www.jstor.org/stable/25736596 (last access: 30 August 2024), 2003.
Mageswaran, T., Sachithanandam, V., Sridhar, R., Mahapatra, M., Purvaja, R., and Ramesh, R.: Impact of sea level rise and shoreline changes in the tropical island ecosystem of Andaman and Nicobar region, India, Nat. Hazards, 109, 1717–1741, https://doi.org/10.1007/s11069-021-04895-3, 2021.
Mani Murali, R., Ankita, M., Amrita, S., and Vethamony, P.: Coastal vulnerability assessment of Puducherry coast, India, using the analytical hierarchical process, Nat. Hazards Earth Syst. Sci., 13, 3291–3311, https://doi.org/10.5194/nhess-13-3291-2013, 2013.
Mansinha, L. and Smylie, D. E.: The displacements fields of inclined faults, Bull. Seismol. Soc. Am., 61, 1433–1440, https://doi.org/10.1785/BSSA0610051433, 1971.
Masaya, R., Suppasri, A., Yamashita, K., Imamura, F., Gouramanis, C., and Leelawat, N.: Investigating beach erosion related with tsunami sediment transport at Phra Thong Island, Thailand, caused by the 2004 Indian Ocean tsunami, Nat. Hazards Earth Syst. Sci., 20, 2823–2841, https://doi.org/10.5194/nhess-20-2823-2020, 2020.
Mishra, P., Usha, T., and Ramanamurthy, M. V.: Evaluation of tsunami vulnerability along the northeast coast of India, Cont. Shelf Res., 79, 16–22, https://doi.org/10.1016/j.csr.2014.02.007, 2014.
Misra, A. and Balaji, R.: A study on the shoreline changes and Land-use/land-cover along the South Gujarat coastline, Procedia Engineer., 116, 381–389, https://doi.org/10.1016/j.proeng.2015.08.311, 2015.
Moran, C. A. A.: Spatio-temporal analysis of texas shoreline changes using GIS technique, Mediterr. Mar. Sci., 2, 5–13, 2003.
Mukhopadhyay, A., Mukherjee, S., Hazra, S., and Mitra, D.: Sea level rise and shoreline changes: a geoinformatic appraisal of Chandipur coast, Orissa, Int. J. Geol. Earth Environ. Sci., 1, 9–17, 2011.
Murty, C. V. R., Rai, D. C., Jain, S. K., Kaushik, H. B., Mondal, G., and Dash, S. R.: Performance of structures in the Andaman and Nicobar Islands (India) during the December 2004 great Sumatra earthquake and Indian Ocean tsunami, Earthq. Spectra, 22, 321–354, https://doi.org/10.1193/1.2206122, 2006.
Nagabhatla, N., Roy, P. S., and Jagdale, R.: Evaluating the change (1968–2001) in landscape pattern and analyzing disturbance in Baratang Forest Division (Andaman Islands), Southeast Asia, https://hdl.handle.net/10568/40948 (last access: 26 August 2024), 2006.
Nanda, A. R. and Haub, C.: The future population of India – a long-range demographic view, Popul. Res. Bureau, http://www.indiaenvironmentportal.org.in (last access: 26 August 2024), 2007.
Natarajan, L., Sivagnanam, N., Usha, T., Chokkalingam, L., Sundar, S., Gowrappan, M., and Roy, P. D.: Shoreline changes over last five decades and predictions for 2030 and 2040: a case study from Cuddalore, southeast coast of India, Earth Sci. Inform., 14, 1315–1325, https://doi.org/10.1007/s12145-021-00668-5, 2021.
National Research Council: Tsunami warning and preparedness: an assessment of the US tsunami program and the nation's preparedness efforts, Committee on the Review of the Tsunami Warning and Forecast System and Overview of the Nation's Tsunami Preparedness, National Research Council, 284 pp., https://nap.nationalacademies.org/catalog/12628/tsunami-warning-and-preparedness-an-assessment-of-the-us-tsunami (last access: 26 August 2024), 2011.
Nayak, S.: Use of coastal data in coastal mapping, Indian Carto CMMC, 147–156, https://citeseerx.ist.psu.edu/document?repid=rep1&type=pdf&doi=6e0602663a4b631966d949de280a274036cd7b64 (last access: 26 August 2024), 2002.
Okada, Y.: Surface deformation due to shear and tensile faults in a half space, B. Seismol. Soc. Am., 75, 1135–1154, https://doi.org/10.1785/BSSA0750041135, 1985.
Prerna, R., Srinivasa Kumar, T., Mahendra, R. S., and Mohanty, P. C.: Assessment of Tsunami Hazard Vulnerability along the coastal environs of Andaman Islands, Nat. Hazards, 75, 701–726, https://doi.org/10.1007/s11069-014-1336-8, 2015.
Raj, N., Rejin Nishkalank, R. A., and Chrisben Sam, S.: Coastal Shoreline Changes in Chennai: Environment Impacts and Control Strategies of Southeast Coast, Tamil Nadu, in: Handbook of Environmental Materials Management, edited by: Hussain, C., Springer, Cham, https://doi.org/10.1007/978-3-319-58538-3_223-1, 2020.
Ramalanjaona, G.: Impact of 2004 tsunami in the islands of Indian Ocean: Lessons learned, Emergency Medicine International, 2011, 920813, https://doi.org/10.1155/2011/920813, 2011.
Rani, V. S., Srivastava, K., and Dimri, V. P.: Tsunami propagation and inundation due to tsunamigenic earthquakes in the Sumatra-Andaman subduction zone: Impact at Visakhapatnam, Mar. Geod., 34, 48–58, https://doi.org/10.1080/01490419.2011.547802, 2011.
Reguero, B. G., Beck, M. W., Agostini, V. N., Kramer, P., and Hancock, B.: Coral reefs for coastal protection: A new methodological approach and engineering case study in Grenada, J. Environ. Manage., 210, 146–161, https://doi.org/10.1016/j.jenvman.2018.01.024, 2018.
Rowland, E. D., Lolade, A. A., Nicholas, D. O., Opukumo, A. W., and Omonefe, F.: The Environmental Impact of Shoreline Changes and Land Use/Land Cover Change Detection in the Niger Delta Region using Geospatial Technology, Journal of Asian Scientific Research, 12, 237–248, https://doi.org/10.55493/5003.v12i4.4650, 2022.
Sachithanandam, V., Mageswaran, T., Ragavan, P., Mahapatra, M., Sridhar, R., Ramesh, R., and Mohan, P. M.: Mangrove regeneration in tsunami-affected area of north and south Andaman using insitu and remote sensing techniques, https://nopr.niscpr.res.in/bitstream/123456789/28976/3/IJMS%2043(6)%201061-1067.pdf (last access: 26 August 2024), 2014.
Sathiparan, N.: An assessment of building vulnerability to a tsunami in the Galle coastal area, Sri Lanka, Journal of Building Engineering, 27, 100952, https://doi.org/10.1016/j.jobe.2019.100952, 2020.
Scheffers, A., Scheffers, S., and Kelletat, D.: Paleotsunami relics on the southern and central Antillean island arc, J. Coastal Res., 21, 263–273, https://doi.org/10.2112/03-0144.1, 2005.
Shaw, G. and Williams, A.: Impact of the Tsunami on the Tourism Industry and Ecosystem of the Andaman and Nicobar Islands, India, https://unesdoc.unesco.org/ark:/48223/pf0000178632 (last access: 26 August 2024), 2006.
Sheth, A., Sanyal, S., Jaiswal, A., and Gandhi, P.: Effects of the December 2004 Indian Ocean tsunami on the Indian mainland, Earthq. Spectra, 22, 435–473, https://doi.org/10.1193/1.2208562, 2006.
Singh, A. P., Murty, T. S., Rastogi, B. K., and Yadav, R. B. S.: Earthquake generated tsunami in the Indian Ocean and probable vulnerability assessment for the east coast of India, Mar. Geod., 35, 49–65, https://doi.org/10.1080/01490419.2011.637849, 2012.
Singh, P., and Khanduri, K.: Land use and Land cover change detection through Remote Sensing & GIS Technology: Case study of Pathankot and Dhar Kalan Tehsils, Int. J. Geomat. Geosci., 1, 839–846, 2011.
Siva, M. and Behera, M. R.: Effect of continental slope on N-wave type tsunami run-up, The International Journal of Ocean and Climate Systems, 7, 47–54, https://doi.org/10.1177/1759313116656865, 2016.
Population Census: South Andaman District – Population 2011–2024, https://www.census2011.co.in/census/district/53-south-andaman.html (last access: 26 August 2024), 2024.
Srivastava, K., Begum, F., and Jakkula, M.: Tsunami Modelling and Run-ups along Indian Coasts, J. Geol. Soc. India, 97, 1307–1312, https://doi.org/10.1007/s12594-021-1861-5, 2021.
Sudha Rani, N. N. V., Satyanarayana, A. N. V., and Bhaskaran, P. K.: Coastal vulnerability assessment studies over India: a review, Nat. Hazards, 77, 405–428, https://doi.org/10.1007/s11069-015-1597-x, 2015.
Sugawara, D.: Numerical modeling of tsunami: Advances and future challenges after the 2011 Tohoku earthquake and tsunami, Earth-Sci. Rev., 214, 103498, https://doi.org/10.1016/j.earscirev.2020.103498, 2021.
Thakur, S., Dharanirajan, K., Ghosh, P. B., Das, P., and De, T. K.: Influence of anthropogenic activities on the land use pattern of South Andaman Islands, Research Journal of Marine Sciences, 5, 1–10, 2017.
The Economic Times: Tsunami hits India, Inc. with Rs 3,000 cr loss, https://economictimes.indiatimes.com/tsunami-hits-india-inc-with-rs-3000-cr-loss/articleshow/974281.cms?from=mdr (last access: 26 August 2024), 29 December 2004.
Thiéblemont, R., Le Cozannet, G., Rohmer, J., Toimil, A., Álvarez-Cuesta, M., and Losada, I. J.: Deep uncertainties in shoreline change projections: an extra-probabilistic approach applied to sandy beaches, Nat. Hazards Earth Syst. Sci., 21, 2257–2276, https://doi.org/10.5194/nhess-21-2257-2021, 2021.
Tonisso, H., Suursarr, U., and Kont, A.: Maps, aerial photographs, orthophotos, and GPS data as a source of information to determine shoreline changes, coastal geomorphic processes and their relation to hydrodynamic conditions on Osmussa island, The Baltic sea, in: 2012 IEEE International Geoscience and Remote Sensing Symposium (IGRSS), 22–27 July 2012, 987–1159, Munich, Germany, https://doi.org/10.1109/IGARSS.2012.6350382, 2012.
UNDRR – United Nations Office for Disaster Risk Reduction: Understanding disaster risk, https://www.preventionweb.net/understanding-disaster-risk/component-risk/vulnerability (last access: 26 August 2024), 2017.
Velmurugan, A., Swarnam, T. P., and Ravisankar, N.: Assessment of tsunami impact in South Andaman using remote sensing and GIS, J. Indian Soc. Remote, 34, 193–202, https://doi.org/10.1007/BF02991825, 2006.
Vu, M. T., Lacroix, Y., and Vu, Q. H.: Assessment of the Shoreline Evolution at the Eastern Giens Tombolo of France, in: Proceedings of the International Conference on Innovations for Sustainable and Responsible Mining: ISRM 2020, Vol. 2, Springer International Publishing, 349–372, https://doi.org/10.1007/978-3-030-60269-7_18, 2021.
Wood, N., Jones, J. M., Yamazaki, Y., Cheung, K. F., Brown, J., Jones, J. L., and Abdollahian, N.: Population vulnerability to tsunami hazards informed by previous and projected disasters: a case study of American Samoa, Nat. Hazards, 95, 505–528, https://doi.org/10.1007/s11069-018-3493-7, 2019.
Yalciner, A. C., Perincek, D., Ersoy, S., Presateya, G., Hidayat, R., and McAdoo, B.: Report on December 26, 2004, Indian Ocean Tsunami, Field Survey on Jan 21–31 at North of Sumatra by ITST of UNESCO IOC, https://web.archive.org/web/20161010004216/http://faculty.vassar.edu/brmcadoo/yalciner-et-al-2005.pdf (last access: 26 August 2024), 2005.
Yi, L., Chen, J., Jin, Z., Quan, Y., Han, P., Guan, S., and Jiang, X.: Impacts of human activities on the coastal ecological environment during the rapid urbanization process in Shenzhen, China, Ocean Coast. Manage., 154, 121–132, https://doi.org/10.1016/j.ocecoaman.2018.01.005, 2018.
Yunus, A. P. and Narayana, A. C.: Short-term morphological and shoreline changes at Trinkat Island, Andaman and Nicobar, India, after the 2004 tsunami, Mar. Geod., 38, 26–39, https://doi.org/10.1080/01490419.2014.908795, 2015.
Yunus, A. P., Dou, J., Avtar, R., and Narayana, A.: Shoreline and coastal morphological changes induced by the 2004 Indian Ocean tsunami in the Katchal Island, Andaman and Nicobar – a study using archived satellite images, in: Tsunamis and earthquakes in coastal environments, Springer, Cham, 65–77, https://doi.org/10.1007/978-3-319-28528-3_5, 2016.
Yuvaraj, E., Saravanan, E., and Dharanirajan, K.: Assessment of land use and land cover changes in south Andaman Island using remote sensing and GIS, Int. J. Geomat. Geosci., 5, 171–181, 2014.
Zhang, Y., Yin, K., Tang, Y., and Xiao, L.: Tsunami Squares: Leapfrog scheme implementation and benchmark study on wave–shore interaction of solitary waves, Sci. Rep.-UK, 14, 13053, https://doi.org/10.1038/s41598-024-63010-1, 2024.