the Creative Commons Attribution 4.0 License.
the Creative Commons Attribution 4.0 License.
 | 01 Jul 2024
Hydrometeorological controls of and social response to the 22 October 2019 catastrophic flash flood in Catalonia, north-eastern Spain
Romu Romero
María Carmen Llasat
Alejandro Hermoso
Montserrat Llasat-Botija
On 22 October 2019, the Francolí River basin in Catalonia, north-eastern Spain, experienced a heavy precipitation event that resulted in a catastrophic flash flood, causing six fatalities. Few studies comprehensively address both the physical and human dimensions and their interrelations during extreme flash flooding. This research takes a step forward towards filling this gap in knowledge by examining the alignment among all these factors. The hydrometeorological factors are investigated using the new Triangle-based Regional Atmospheric Model, radar-derived precipitation estimates, post-flood field and gauge observations, and the Kinematic Local Excess Model. The social dimension is assessed by examining the relationship between catchment dynamics and warning response times and by quantifying human behaviour during the course of the flash flood through a post-event citizen science campaign. Results reveal that a persistent south-easterly airflow brought low-level moisture and established convective instability in the region, while local orography was instrumental to triggering deep moist convection. A convective train promoted intense, copious, and prolonged precipitation over the north-western catchment headwaters. Basin response was significantly modulated by the very dry initial soil moisture conditions. After the long-lasting rainfall, an acute burst of precipitation resulted in extreme flash flooding. Fast and abrupt increases in streamflow affect small spatial scales and leave limited time for the effective implementation of protective measures. The institutional organization–protection–prevention cycle unfolded at the spatial and temporal scales typically dominated by the meteorological rather than hydrological scales. Although the citizen science campaign reveals the effectiveness of the warnings in reaching the population living in the most affected areas, a significant proportion of the respondents expressed a lack of adequate information or were unfamiliar with the intended meaning. In addition, a majority of the interviewees did not perceive any significant threat to life or property. In view of these results, this study identifies potential areas for improving social preparedness for similar natural hazards in the future.
- Article
(5198 KB) - Full-text XML
- BibTeX
- EndNote


Flash floods are defined as floods with high peak discharges that are observed within 6 h or less of the causative heavy rainfall and affect areas often limited to a few hundred square kilometres (Georgakakos, 1986; Marchi et al., 2010). In the Mediterranean region, flash floods are a highly destructive natural hazard in terms of economic and human losses. According to Llasat et al. (2010), 185 episodes were registered during the 1990–2006 period, resulting in a death toll of 4500 and damage exceeding EUR 29 billion. Petrucci et al. (2019) identified a total of 812 floods in Europe during the 1980–2018 period, resulting in 2466 fatalities. Most of the flash flood events occurred in countries located in the Mediterranean region. The Emergency Events Database (EM-DAT) of the Centre for Research on the Epidemiology of Disasters lists a total of 233 episodes related to riverine floods and flash floods in southern Europe for the 1953–2023 period. These natural disasters caused a death toll of 3286 and adjusted-inflation economic damages close to EUR 94.4 billion (http://www.emdat.be/; last access: 3 January 2024).
Besides being a region with a high frequency of flash flooding, the associated social risks are steadily increasing due to an enhanced vulnerability connected with human activities and global warming. On the one hand, intense economic activity and high population density in the Mediterranean coastal fringe increase the potential of flash-flood-related casualties and damages. On the other hand, global warming is intensifying the hydrological cycle, resulting in an increase in heavy precipitation at regional and global scales (Groisman et al., 2005; Huntington, 2006; Beniston, 2009). Consequently, flash floods are expected to increase in frequency and severity, while the Mediterranean region has been identified as one of the hotspots for climate change impacts (Diffenbaugh and Giorgi, 2012; Paeth et al., 2017; Cramer et al., 2018; Tuel and Eltahir, 2020).
Mediterranean Spain is prone to flash floods during late summer and autumn, recurrently experiencing heavy precipitation episodes (HPEs). Several factors contribute to the occurrence of these flash-flood-producing HPEs. Firstly, the relatively high sea surface temperature serves as a source of heat and moisture for the lower layers of the atmosphere. Secondly, the arrival of mid-level cold troughs promotes the advection of warm and moist air masses from the maritime environment, resulting in strong convective instability with high convective available potential energy (CAPE). Thirdly, the complex topography of the Spanish Mediterranean region plays a significant role in channelling low-level jets and initiating deep and moist convection through mechanical uplift. The prominent orography anchors the convective systems, which are continuously fuelled by high moisture convergence. The combination of all these factors leads to the development of quasi-stationary HPEs that tend to persist over specific areas (Romero et al., 2000; Llasat et al., 2003; García-Herrera et al., 2005; Martín et al., 2007; Pastor et al., 2010; Hermoso et al., 2021).
Given the complex topography of coastal regions, numerous small to medium semi-arid basins are scattered along the coastal fringe (Fig. 1). Most of these catchments are ephemeral in nature and are highly responsive to HPEs. Basin response occurs within few hours, reacting with an acute spatial and temporal variability to heavy precipitation. On the one hand, moist deep convection can trigger large rainfall rates and amounts, which inherently feature high heterogeneity in both space and time. On the other hand, thin soils, limited vegetation cover, steep slopes, and urbanization can contribute to the generation of fast and high infiltration–excess runoff rates and surface flows. Following the long dry and warm summer, the occurrence of extreme precipitation intensities and amounts can easily surpass the initially high soil infiltrabilities. The combination of all these factors can result in the sudden formation of flood bores, which rapidly route through normally dry river beds, leading to catastrophic effects downstream (Amengual et al., 2007, 2015; Roca et al., 2009; Vennari et al., 2016; Martín-Vide and Llasat, 2018; Lorenzo-Lacruz et al., 2019).
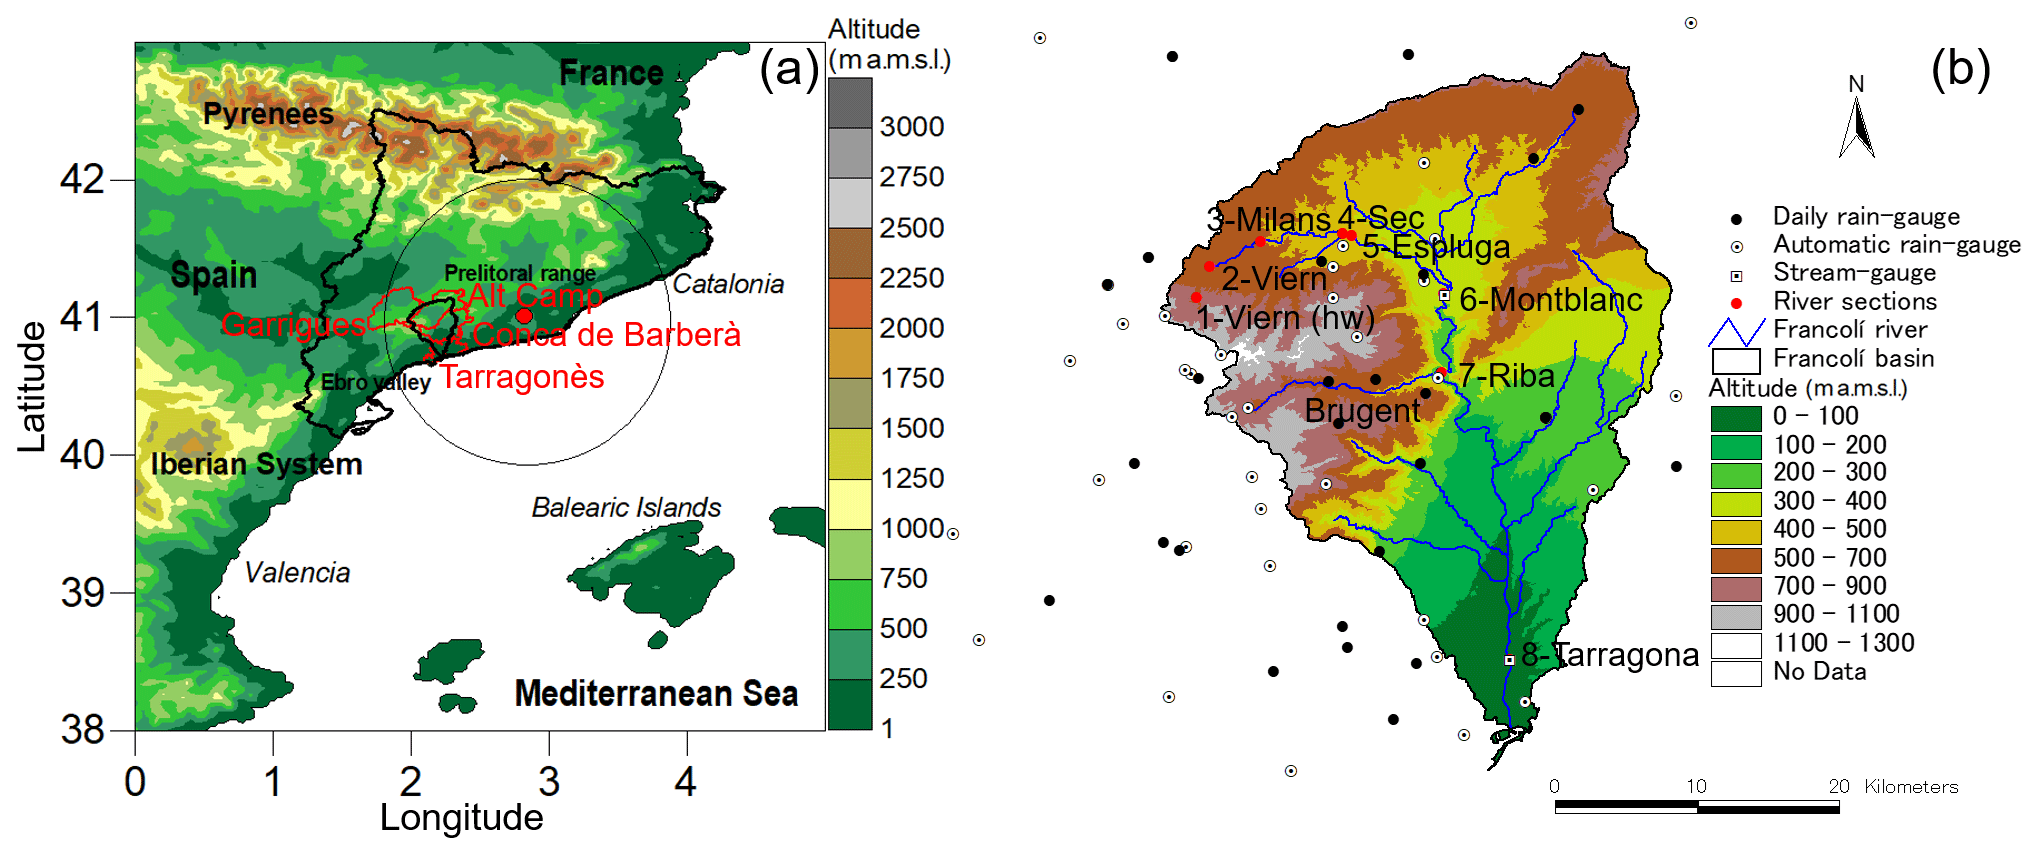
Figure 1(a) Main geographical features of the north-eastern coast of Spain. The location of the Barcelona weather radar from the Spanish State Meteorological Agency is shown as a red dot. The Francolí catchment is highlighted with a thick black line. Radius of the radar circle is 100 km. The municipalities traversed by the Francolí River are also shown in red. (b) Main geographical features of the Francolí basin. The automatic rain gauges are shown as white dots. Automatic stream gauges are labelled and depicted as white squares. Daily pluviometers are illustrated as black dots. River sections are denoted as red circles and labelled downstream.
Basin response to flash flooding is linked to drainage size and runoff triggering. As the catchment area decreases, the time reduction in basin response implies that people are more exposed to flash-flood-related risks: individuals are not so protected by structural measurements, and non-structural policies for defence become more crucial. Flash flood monitoring and forecasting build on the relationship between catchment and social response times (Creutin et al., 2009). When the catchment response time is larger than the social response time, hydrological and/or hydraulic models can provide forecasts at the required lead times. Otherwise, flash flood forecasting and warning issuance rely on quantitative precipitation estimates (QPEs) derived from radar observations and/or quantitative precipitation forecasts (QPFs) from high-resolution numerical weather prediction (NWP) models. QPE-driven runoff simulations can provide forecasts with lead times of a few hours, depending on hydrological response. Short-range NWP models coupled with hydrological models can extend the forecast lead times to 24–48 h (Cloke and Pappenberger, 2009; Hapuarachchi et al., 2011; Wu et al., 2020).
However, various factors external to flash flooding can influence the nature and extent of resulting damages. To reduce vulnerability, it is also necessary to explore the social dimension and examine human behaviour, perceptions, and specific reactions during these natural hazards (Špitalar et al., 2014). Bodoque et al. (2016) assessed the social resilience level of a municipality in central Spain in response to flash floods. Interviewees exhibited both low risk perception and awareness levels regarding civil protection plans, limiting their effectiveness. Morss et al. (2016) conducted an investigation on flash flood forecast and warning communication, interpretation, and decision-making, using data from a survey of the population in Boulder, Colorado. Respondents exhibited diverse perceptions and understanding of flash flood risks, with some harbouring misconceptions. These authors highlighted the multi-dimensional, situationally dependent meanings of flash flood alerts and emphasized the importance of evaluating interpretation and the use of warning information, including alert terminology. They concluded that a more in-depth investigation into how different people perceive, interpret, and respond to hydrometeorological alerts is essential within realistic informational, social, and decision contexts.
Hence, it is crucial not only to provide timely forecasts and warnings grounded in a deeper understanding of the concurrent and interconnected underlying physical processes but also to discern how individuals perceive flash flood risks. Understanding how people integrate and respond to different types of warning information is essential in decision-making. Public participation in assessing local risks in post-event flash flood scenarios, along with exploring the associated short-term social response, is particular important as a central point for societal adaptation. This knowledge can be used to formulate evidence-based recommendations for improving alerts, enabling individuals to more effectively assess risk and take fast and effective measures to protect themselves.
To gain insight into the hydrometeorological and social factors relevant to flash flooding in Mediterranean Spain, a case study is analysed. The event took place on 22 October 2019, with observations revealing a maximum 10 min rainfall accumulation of approximately 21.0 mm and a total amount of 299.5 mm. Subsequent flash flooding devastated the upper Francolí basin in Catalonia, north-eastern Spain (Fig. 1). The event resulted in a death toll of six inside the Francolí basin and the destruction of several dwellings and three bridges along the river. This flash flood was characterized by the significant amount of woody debris carried by the water, leading to the formation of large jams at various bridges along the river. The anomalous and short-lived peak flow caused by the collapse of a debris jam on one of the bridges resulted in two of the six fatalities. The regional water authority is now warning flood planners about the potential for catastrophic floods in the valley towns situated along vegetated, torrential basins, particularly if their narrow bridges are susceptible to woody debris (Martín-Vide et al., 2023).
The 22 October 2019 HPE serves as a prototypical case for well-organized and quasi-stationary convective systems, which are often responsible for the most catastrophic flash floods in Mediterranean Spain. This study aims to examine the primary hydrometeorological factors that contributed to the unfolding of this extreme event. To achieve this goal, large-scale meteorological grid analyses, high-resolution NWP modelling, QPEs obtained from radar observations and automatic rain-gauge measurements, stream-gauge records, post-event field observations by Martín-Vide et al. (2023), and hydrological modelling are used. The specific objectives are to (i) identify the leading physical mechanisms responsible for the onset and evolution of the convective systems, (ii) investigate the main features of the HPE over the Francolí catchment, and (iii) assess basin response to the torrential rainfall. This study places particular emphasis on the social dimension during the course of the flash flood by examining the relationship between catchment dynamics and social response times. Additionally, it quantifies human behaviours, perceptions, and reactions. Few studies comprehensively address both the physical and human dimensions of catastrophic flash flooding. By examining the alignment among these factors, this research aims to take another step towards filling this knowledge gap, providing insights into the effectiveness of current social protocols in meeting the requirements of the population at risk. Furthermore, it seeks to identify potential areas for improving mitigation actions before these natural hazards.
2.1 The study area
2.1.1 Francolí catchment: an overview
The Francolí River is about 109 km, including tributaries, until it reaches the Mediterranean Sea at the city of Tarragona, and the river basin covers an area of approximately 858 km2 (Fig. 1). The north-western part of the catchment is shaped by the Catalonian Prelitoral mountain range, reaching a maximum elevation close to 1200 m and featuring bed slopes of up to 2.0 %. According to the Köppen–Geiger classification, the climate in the Francolí basin is classified as a warm-summer Mediterranean climate (CSb; Chazarra-Bernabé et al., 2018). Precipitation is scarce; evapotranspiration is intense; and there is marked seasonality of rainfall, often causing drought periods during summer. The annual mean rainfall is 565.4 mm, annual mean temperature is 16.1 °C, and annual mean actual evapotranspiration is 416.7 mm (Marquès et al., 2013).
The Francolí River basin is divided into three different geological units. The upper watershed settles over weakly resistant tertiary materials, including conglomerates, sandstones, marls, calcareous formations, and dentritic deposits. Beneath much of this unit lies a Plio–Quaternary dentritic aquifer, primarily composed of silts, sands, and gravels. The western mountain ranges consist of Palaeozoic slate, granite, limestone, schists, and dolomite formations, with predominantly thin and poorly developed lithosoils (Fig. 1; Barettino and Pujadas, 1992; Postigo et al., 2010; Sendròs et al., 2014). The middle and lower course of the Francolí River flows across a Miocene sedimentary basin, separated from the preceding unit by a network of normal faults. The prevalent sedimentary deposits consist of dentritic patterns and calcium carbonate, distributed according to an alluvial fan formation (Arrufat, 1972; Pujadas, 1994).
The Brugent River is the main left tributary feeding into the upper Francolí basin (Fig. 1). Its southern stretch traverses extensive karstified limestone, carbonate, and dolomitic fractured bedrock, promoting high infiltration rates and facilitating the recharge of deep calcareous aquifers. In areas of exposed karst, surface drainage networks are typically underdeveloped, with runoff being scarce except during exceptionally heavy rainfall events (Gunn, 2007; Bailly-Comte et al., 2009). During flood occurrences, the Brugent River's main channel flows through a large gravel fan at the confluence with the Francolí River (Roca et al., 2009).
The mountains sustain a deciduous forest, while pine trees dominate at lower elevations. In the river valley, clay loam and silt loam soils prevail, primarily supporting rainfed agriculture, with grapevines and cereals as the primary crops. Several small towns with populations exceeding 8000 inhabitants are located on the valley plains of the upper basin, in close proximity to the river. Being hydraulically disconnected from the underlying aquifers, the Francolí River exhibits a highly irregular streamflow regime, reliant on rainfall. Low streamflow is a characteristic of the Francolí River, which is modulated by significant inter-annual and seasonal variability in precipitation. Its mean annual streamflow is 1.2 m3 s−1, yet it occasionally experiences hazardous flash floods. The most catastrophic episodes on record took place on 23 September 1874, 18–19 October 1930, and 10 October 1994 (Roca et al., 2009).
2.1.2 The observational networks
The Francolí River is monitored by the Catalan Water Agency (Agència Catalana de l'Aigua, ACA) at two cities, Montblanc and Tarragona, enclosing basin areas of 339.9 and 809.1 km2, respectively. Raw streamflow data are collected by the automatic stream-gauge stations with a temporal resolution of 5 min (Fig. 1). However, the flood bore destroyed the stream gauge in Montblanc, resulting in the unavailability of a complete time series of data for the 22 October 2019 episode. Automatic raw precipitation data are recorded by several agencies at different temporal frequencies across Catalonia.
The Catalan Meteorological Service (Servei Meteorológic de Catalunya, SMC) operates 172 pluviometers with a 10 min frequency. The Spanish State Meteorological Agency (Agencia Estatal de Meteorología, AEMET) has 62 rain gauges with a 10 min temporal resolution in Catalonia. The Meteoprades amateur association maintains 17 stations with a 5 min time step. Out of these 251 stations, 59 are located inside or very close to the Francolí catchment. Additionally, daily rainfall amounts are recorded by AEMET in 212 additional and independent rain gauges across Catalonia, 48 of them are situated inside or near the basin. The region is also monitored by the SMC XRAD radar network and the AEMET Doppler C-band weather radar. The AEMET radar is deployed in close proximity to the city of Barcelona, approximately 60 km away from the Francolí catchment, and it is used in this work (Fig. 1).
2.2 Synoptic situation
Prior to the onset of the convective episode in Catalonia, the synoptic evolution was characterized by the presence of an intense potential vorticity (PV) streamer progressing towards the Atlantic coast of the Iberian Peninsula at upper levels (Fig. 2a). The PV streamer reached values of more than 8 PVU (1 PVU = 106 km2 s−1 kg−1, potential vorticity unit) at 250 hPa. In correspondence with this upper-level dynamic structure, a deep trough with cold air could be identified at mid-tropospheric levels. During the following hours, the PV streamer tilted eastwards while eventually breaking from the main circulation and forming a closed centre over the southern half of the Iberian Peninsula on 23 October at 00:00 UTC. Correspondingly, the mid-tropospheric disturbance adopted the structure of a cut-off cyclone with a cold core (Fig. 2b). Previous studies have indicated that the forward flank of such PV streamers provides favourable regions for the development of deep moist convection (Doswell et al., 1998; Schumann and Roebber, 2010). The presence of these upper-level anomalies not only contributes to the dynamical uplift through the advection of PV but also leads to the convective destabilization of the tropospheric column. This destabilization is achieved by the intrusion of cold air aloft, which sets up steep lapse rates within the domain of the trough.
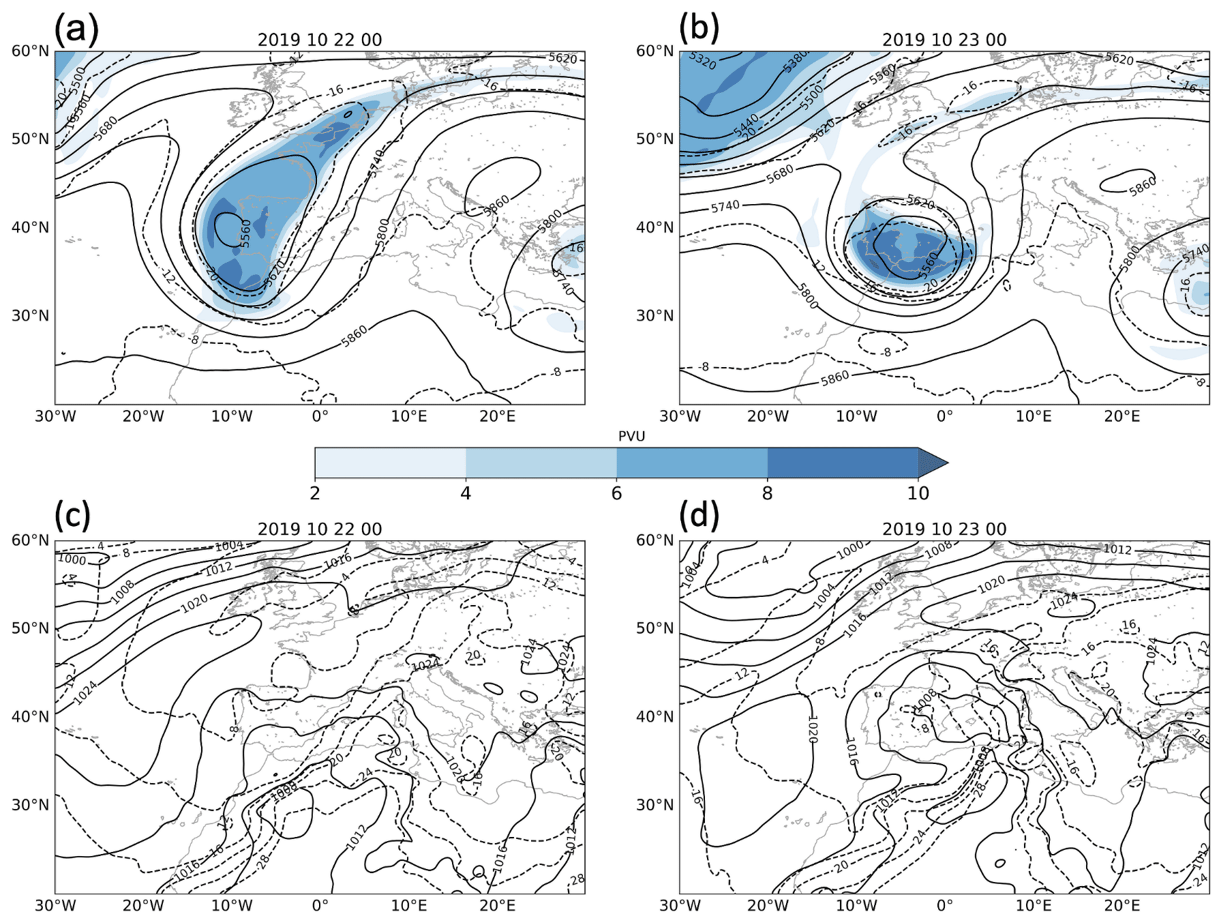
Figure 2European Centre for Medium-Range Weather Forecasts analyses for geopotential height (solid lines, in geopotential metres), temperature (dashed, in °C) at 500 hPa, and 250 hPa potential vorticity (PVU; shaded in blue) on (a) 22 and (b) 23 October 2019 at 00:00 UTC. European Centre for Medium-Range Weather Forecasts analysis for mean sea level pressure (solid lines, hPa) and temperature at 850 hPa (dashed, in °C) on (c) 22 and (d) 23 October 2019 at 00:00 UTC.
At low levels, the synoptic situation was also highly supportive of the upward dynamical forcing and convective destabilization of the vertical profile, particularly along the Mediterranean coasts of Spain (Fig. 2c and d). The low-level thermal structure was characterized by the intrusion of cold air over the Iberian Peninsula, along with the upper-level PV streamer, together with the genesis of a marked temperature gradient towards the western Mediterranean.
Cyclogenesis took place over the Balearic Islands, that is, in the forward flank of the upper-level PV anomaly as it tilted and closed. The circulation associated with the surface cyclone contributed to the strengthening of the thermal front and the advection of warm and moist Mediterranean air towards Catalonia. The evolution of this baroclinic structure at low levels was instrumental to promoting upward vertical motion and the destabilization of low-level air parcels. In addition, once the convective systems formed, this circulation pattern ensured a continuous supply of warm and moist air conveyed over Mediterranean waters, which still feature high sea surface temperatures in autumn.
To comprehensively address both the physical and human dimensions, along with their interrelations during extreme flash flooding, this research is based on a comprehensive set of physical, numerical, and social approaches, briefly introduced below (Fig. 3).
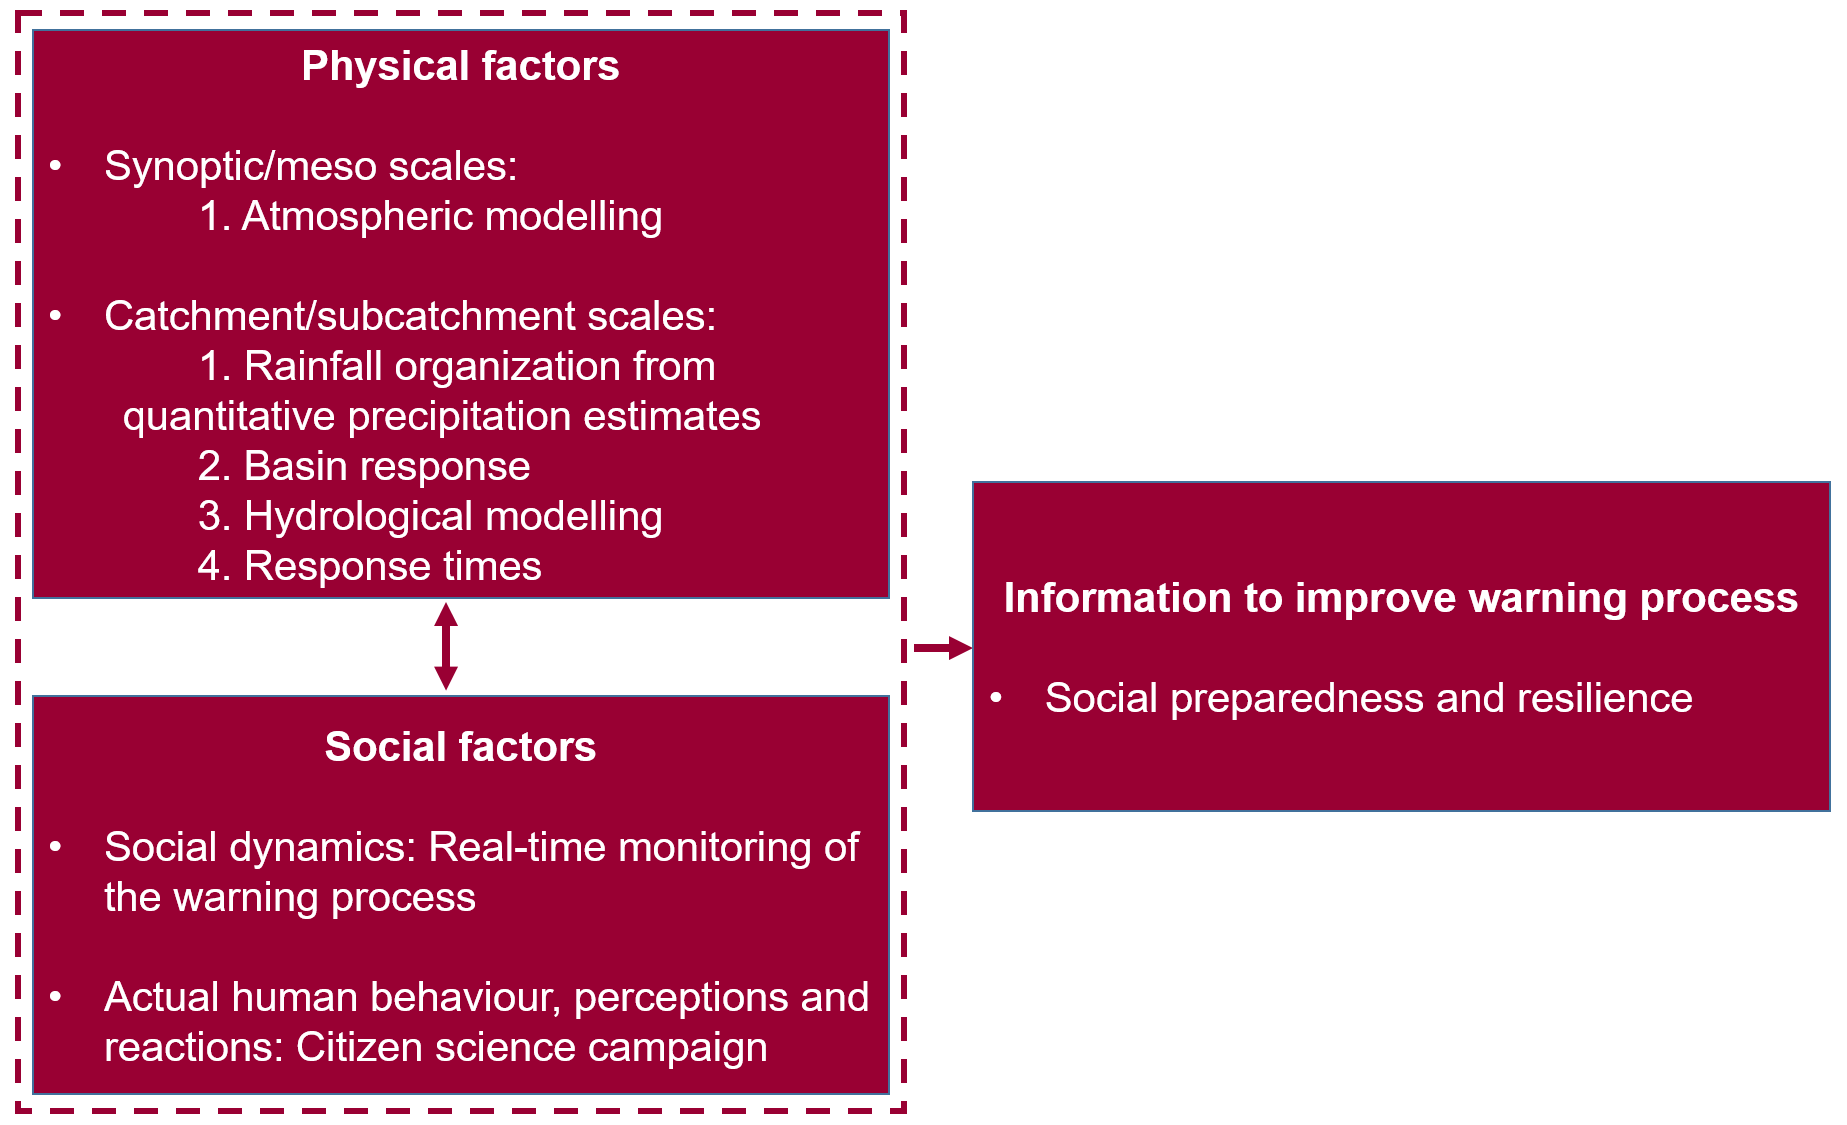
Figure 3Procedure followed to analyse physical and human dimensions and their interrelations during extreme flash flooding.
3.1 Mesoscale atmospheric modelling
Regarding the mesoscale numerical simulation of the HPE, it is applied the new Triangle-based Regional Atmospheric Model (TRAM) developed by the Grup de Meteorologia at the Universitat de les Illes Balears (Romero, 2023). The model is currently fully operational, providing regional forecasts at different resolutions; twice daily these forecasts are disseminated online (further information at https://meteo.uib.es/tram, last access: 25 June 2024). Through primitive equation models like this one, suitable for all scales, it is possible to advance the understanding of the synoptic and mesoscale factors that were decisive for the genesis of the catastrophic rainfall in this study case. Moreover, once validated, tools of this nature can serve as the foundation for future focused applications, such as driving operational runoff models that enable the anticipation of potential risks to infrastructure and population (an objective of subsequent studies on this case). Key technical characteristics of TRAM are the following (see Romero, 2023, for full details and Romero et al., 2019, for an earlier 2D version of the model).
-
Dynamical core. The model employs a classical non-hydrostatic fully compressible version of Euler's equations for the atmosphere, predicting three velocity components and perturbations of Exner pressure and potential temperature. Although not in flux form, this formulation is suitable for short- to medium-range weather predictions. No explicit filters are required to control numerical instabilities.
-
Spatial representation. TRAM uses a mesh of equilateral triangles in the horizontal, with no staggering of variables. Horizontal advection avoids dimensional splitting and employs the reconstruct–evolve–average (REA) strategy with the monotonized central-difference (MC) slope limiter (Leveque, 2002).
-
Vertical coordinate. The classical height coordinate is used in the vertical with arbitrary stretching of computational levels, allowing for higher resolution in the planetary boundary layer (PBL). The fields are not staggered vertically, and a 1D REA method is used for advection. A proper treatment of terrain slopes and bottom boundary conditions allows for correctly incorporating the effects of the complex orography.
-
Time integration. Time splitting is applied (Wicker and Skamarock, 1998), with a short time step for fast terms (e.g. gravity waves and acoustic modes) and a longer time step for slow terms (e.g. advection). A second-order Runge–Kutta (RK2) method is used for fast terms, and semi-implicit solving in the vertical relaxes the CFL (Courant–Friedrichs–Lewy) stability condition.
-
Physical parameterizations. TRAM is fully coupled with up to six water species, incorporating realistic parameterizations for cloud microphysics, cumulus convection, radiation, PBL processes, and surface fluxes; these parameterizations schemes are imported from the PSU–NCAR (Pennsylvania State University–National Center for Atmospheric Research) MM5 modelling system (Dudhia, 1993; Grell et al., 1995). Moist effects on pressure and thermodynamics are retained.
-
Earth representation. Applications on the real Earth use the Lambert map projection, retaining all Coriolis and curvature terms in the equations.
The basic idea in the context of this study is to describe as accurately as possible the leading physical mechanisms responsible for the onset and evolution of the convective systems. Therefore, first, a good control or reference simulation – under reasonable computational resources – was sought. Specifically, the TRAM model was forced with large-scale analysis coming from the European Centre for Medium-Range Weather Forecasts (ECMWF) and the National Centers for Environmental Prediction (NCEP) and tested for different domain sizes, time horizons, and vertical/horizontal resolutions in order to optimize its performance in terms of the simulated rainfall (i.e. a closer resemblance to the radar-estimated pattern of Fig. 4b). In conclusion, selected TRAM simulations are forced with initial and lateral boundary conditions from the ERA5 grid reanalyses and are performed over the western Mediterranean domain shown in Figs. 5 and 6. The control simulation starts on 22 October 2019 at 00:00 UTC and extends for 48 h, concluding on 24 October 2019 at 00:00 UTC. In the vertical 61 computational levels are used, with a thickness increasing from 25 m near sea level to about 400 m in the upper troposphere (model top is located at 16 km). Horizontally, the resolution of the mesh – in terms of the side length of the triangular cells – is set at 4.5 km, with parameterized moist convection. Note that when referring to a traditional square-based mesh, this resolution is equivalent to 3 km.
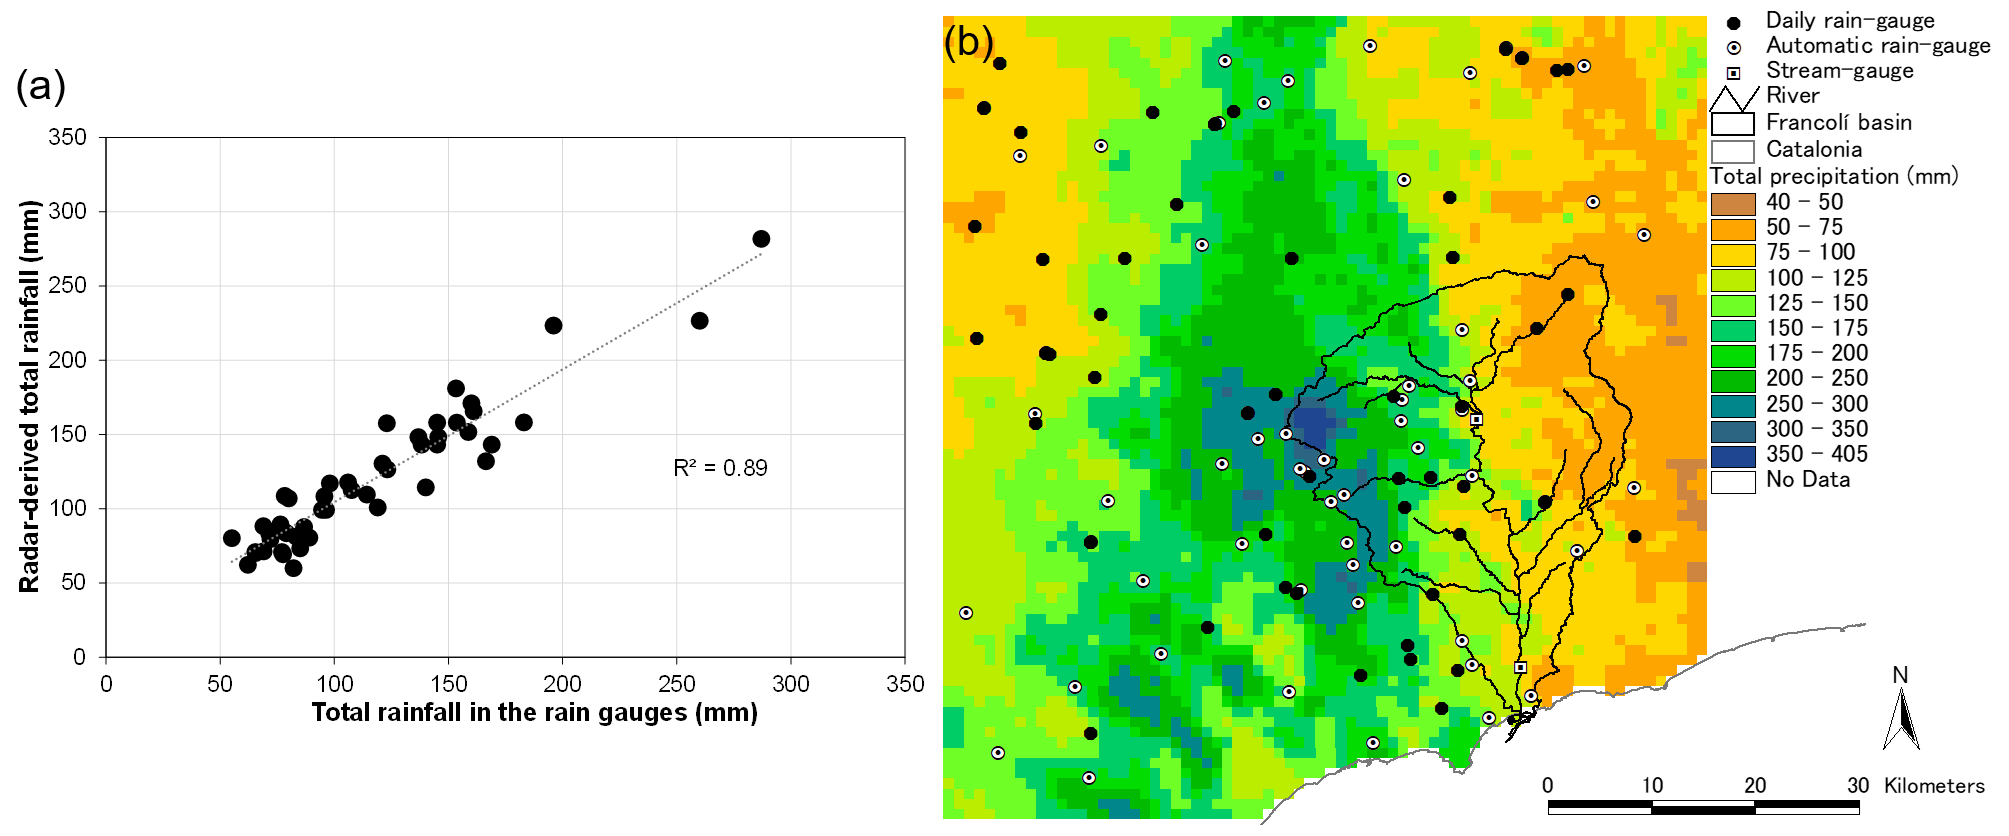
Figure 4(a) Scatterplot of the 48 h radar-derived rainfall estimates against accumulations observed by the daily Spanish State Meteorological Agency rain-gauge network over the selected region. (b) Spatial distribution of the 48 h accumulated radar-estimated precipitation from 22 to 24 October 2019 at 00:00 UTC. The Francolí River catchment is highlighted with a thin black line. White squares stand for the automatic stream gauges. White dots show the position of the automatic rain gauges. Daily pluviometric stations are denoted by black dots.
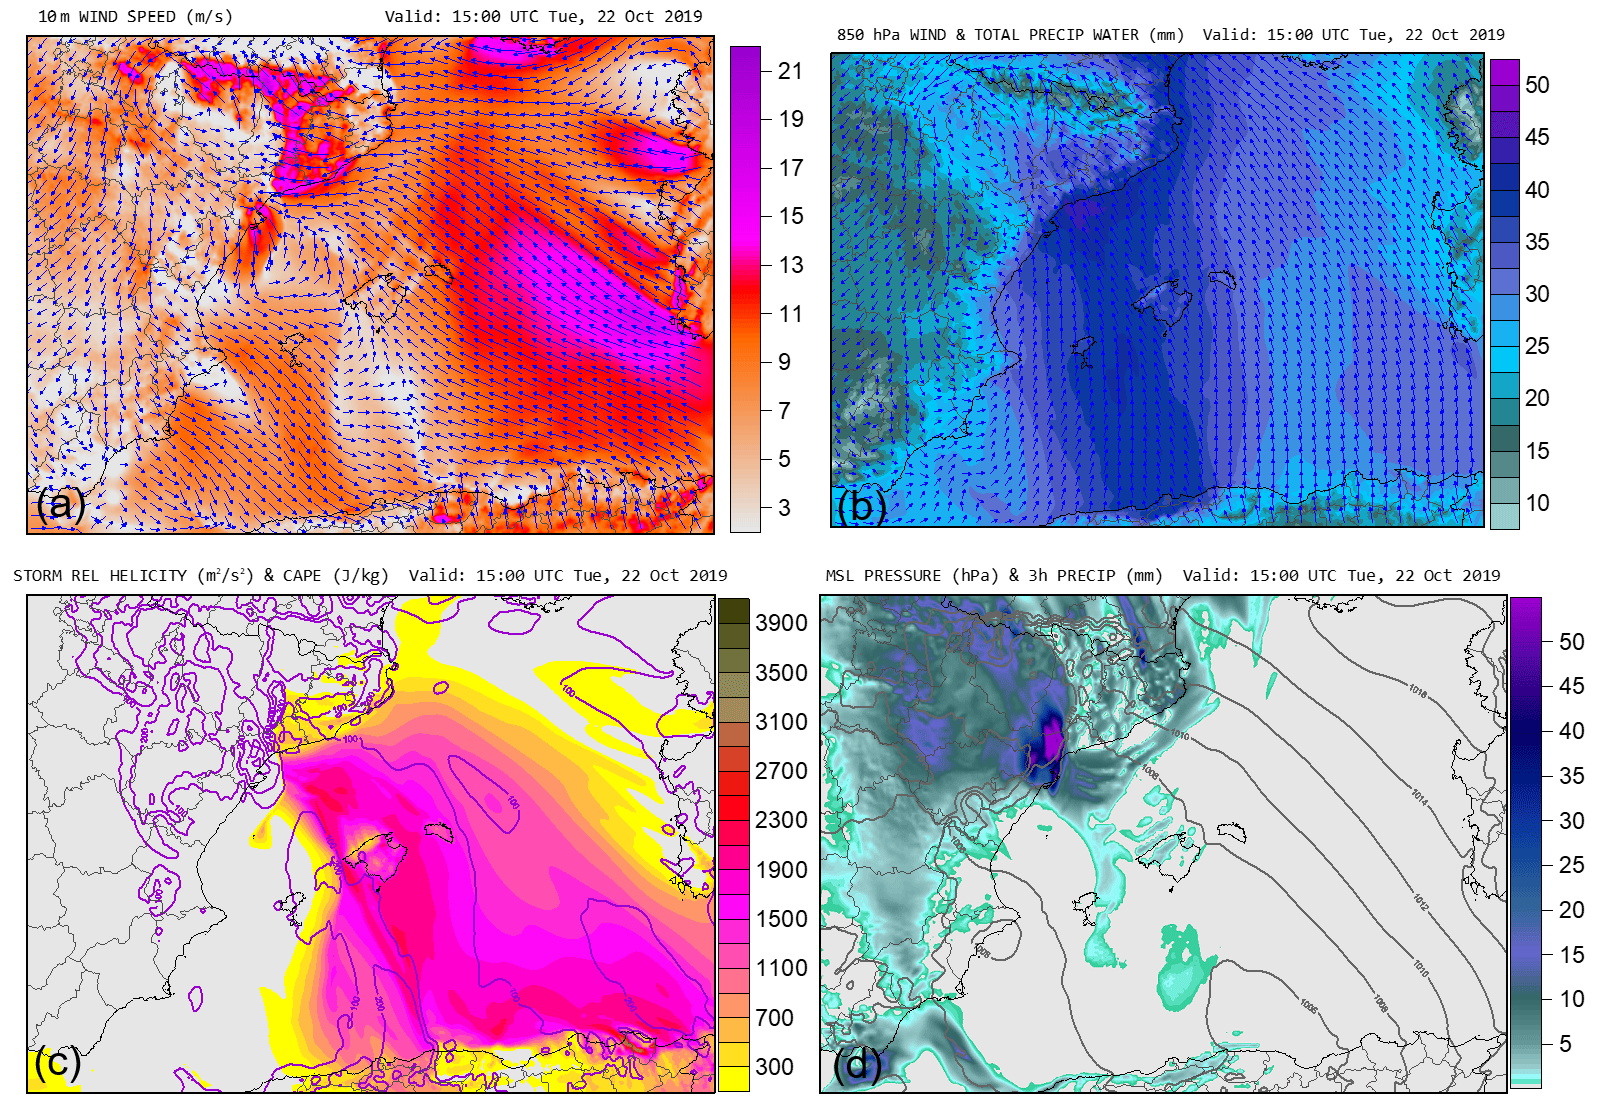
Figure 5Results of the control simulation at 15:00 UTC on 22 October 2019, showing (a) surface wind field (vectors and speed in m s−1, according to colour scale), (b) 850 hPa wind vectors and precipitable water in the tropospheric column (mm, according to colour scale), (c) storm-relative helicity (m2 s−2, contour lines) and convective available potential energy (J kg−1, according to colour scale), and (d) mean sea level (MSL) pressure (hPa, contour lines) and accumulated precipitation from the previous 3 h (mm, according to colour scale).
3.2 Quantitative precipitation estimates
QPEs are derived from the reflectivity volume scans of the Barcelona Doppler C-band radar of AEMET during the period of 22 to 24 October 2019 at 00:00 UTC (Fig. 1). The radar has a spatial resolution of 1 km in range and 0.8° in azimuth. A complete volume scan is conducted every 10 min, covering a maximum range of 240 km. As volume scanning is affected by complex terrain, partial beam occlusion is amended by simulating the blocked percentage of beam power. The correction for partial beam occlusion is performed by numerically modelling the propagation of the radar beam over a high-resolution digital terrain model (Pellarin et al., 2002). Furthermore, the signal attenuation caused by heavy rainfall is corrected using the mountain reference technique (Bouilloud et al., 2009). Finally, the quantitative rainfall estimates are obtained by applying the standard WSR-88D (weather surveillance radar, 1988, Doppler) convective rainfall rate–reflectivity relationship. This approach relates the radar reflectivity factor Z and rainfall rate R through the empirical relationship (Hunter, 1996; Fulton et al., 1998).
Due to the inherent uncertainties in radar quantitative precipitation estimation (e.g. Gochis et al., 2015), additional inaccuracies in the hourly cumulative rainfall and patterns are amended using a dynamical fitting technique to the 59 automatic pluviometers from AEMET, Meteoprades, and the SMC (Fig. 4; Cole and Moore, 2008). To further ensure the reliability of the radar-derived precipitation estimates, verification is performed by comparing the 48 h radar-derived precipitation against observations from the 48 independent AEMET daily pluviometers. The scatterplot between both databases shows a squared correlation coefficient of 0.89 over the selected area (Fig. 4). Overall, the QPEs exhibit a slight average underestimation of 2.8 %.
3.3 Hydrological modelling
The event-based and fully distributed Kinematic Local Excess Model (KLEM; Da Ros and Borga, 1997) is implemented to analyse hydrological response. KLEM takes into account the properties of topography, soil, and vegetation. The Soil Conservation Service curve number (SCS-CN) method (USDA, 1986) is used to compute runoff from precipitation. The drainage network is identified using a threshold area procedure, which helps characterize both hillslope and channelized flow paths. The response of the drainage system is then described to represent runoff routing (Giannoni et al., 2003). The routing of surface and channel flows through the drainage structure is completely translational, relying on two invariant velocities along the hillslopes (vh) and channels (vc). In addition, the hydrological model also simulates baseflow using a linear conceptual reservoir based on the Horton–Izzard equation (Moore and Bell, 2002). Runoff models, incorporating an infiltration equation and invariant flow velocities, have been also used for flash flood simulation in several studies (Zhang et al., 2001; Giannoni et al., 2003; Javier et al., 2007; Borga et al., 2007; Sangati and Borga, 2009). The evaluation of simulations presented in these studies supports the assumption that hydrologic models employing basin-constant channel celerity can effectively explain observed travel time distributions, particularly under high-flow conditions as observed in Pilgrim (1976). Furthermore, this outcome suggests the potential applicability of model results from this study to other investigations.
Landscape morphologies and soil properties are described by a 25 m grid size cell. Specifically, the laser imaging detection and ranging-derived digital elevation models were provided by the Spanish National Geographic Institute, lithology information was obtained from the Geological and Mining Institute of Spain (Instituto Geológico y Minero de España; IGME, 2010), and land use maps are obtained from the CORINE (Coordination of Information on the Environment) Land Cover project (EEA, 2018). From these data, curve numbers are accordingly derived, set to dry antecedent moisture conditions (i.e. AMC I). KLEM is forced by the 10 min radar-derived QPEs from 22 to 24 September at 00:00 UTC. The computational model time step aligns with the 10 min radar observing frequency.
3.4 Socioeconomic information
Socioeconomic data regarding impacts were acquired from news reports and payments disbursed by the Consorcio de Compensación de Seguros (CCS). The CSS is the Spanish entity responsible for compensating damages in the case of natural hazards. Real-time monitoring of the early warning procedure is carried out by closely following the information issued by the civil protection service and the SMC via social networks. After the flash flood, a citizen campaign was developed to collect more information (Llasat-Botija et al., 2022). The Floodup Francolí campaign consisted of a participatory citizen science process conducted in collaboration with the Museu de la Vida Rural de l'Espluga de Francolí (Museum of Rural Life of Espluga de Francolí).
Witnesses were interviewed in order to (i) collect detailed information for facilitating the reconstruction of the episode, (ii) identify key impacts and adaptation behaviours and actions, and (iii) determine the level of understanding of the issued alerts and the most effective communication channels. The campaign was additionally designed to contribute to improving citizens' preparedness for future episodes by promoting participation and fostering shared reflection on the first-hand experience.
4.1 Mesoscale processes and the role of orography
Besides the control numerical simulation designed to identify the key mesoscale factors simultaneous to the development of the HPE, a complementary non-orographic numerical simulation is performed to assess whether local and regional orography played a crucial role in the unfolding and stationarity of torrential rainfall. Simulations involving the annulment of terrain height in the initial configuration of the domain have proven to be very useful in studying the effects of this boundary factor when it is suspected of being relevant (e.g. Alpert and Sholokhman, 2011). These effects can be both local (e.g. enhancing/suppressing rainfall over up-/downslopes) and remote (e.g. generating maritime depressions leeward of mountain ranges that aid in organizing atmospheric circulation and producing low-level convergences). In truth, a perturbed simulation of this kind would not be entirely free from orographic influences, as the initial and lateral boundary fields logically retain their effects. However, after a few hours of spin-up during which the model adjusts to the new reality, it can be affirmed that the mechanisms linked to orography have practically disappeared.
Regarding the control or full simulation, a comprehensive set of mesoscale diagnostic products focusing on low levels is shown in Figs. 5 and 6 for two representative times, 15:00 and 21:00 UTC on 22 October. Except for the storm-relative helicity (SRH) field, which would rather apply to the examination of severe weather environments (e.g. squall line or supercell thunderstorm genesis), the rest of the products emphasize the special characteristics of this HPE, regarding the triggering of the convective precipitation systems and their efficient feeding – over several hours – with moist, unstable Mediterranean air. Note that the SRH is a meteorological parameter used to assess the potential for rotating updraughts within a storm environment (e.g. Markowski and Richardson, 2010). It quantifies the relative rotation of air near a storm, particularly in the lower atmosphere. In this case study, the SRH is calculated by considering the wind speed and direction at different altitudes within the 1000–700 hPa layers.
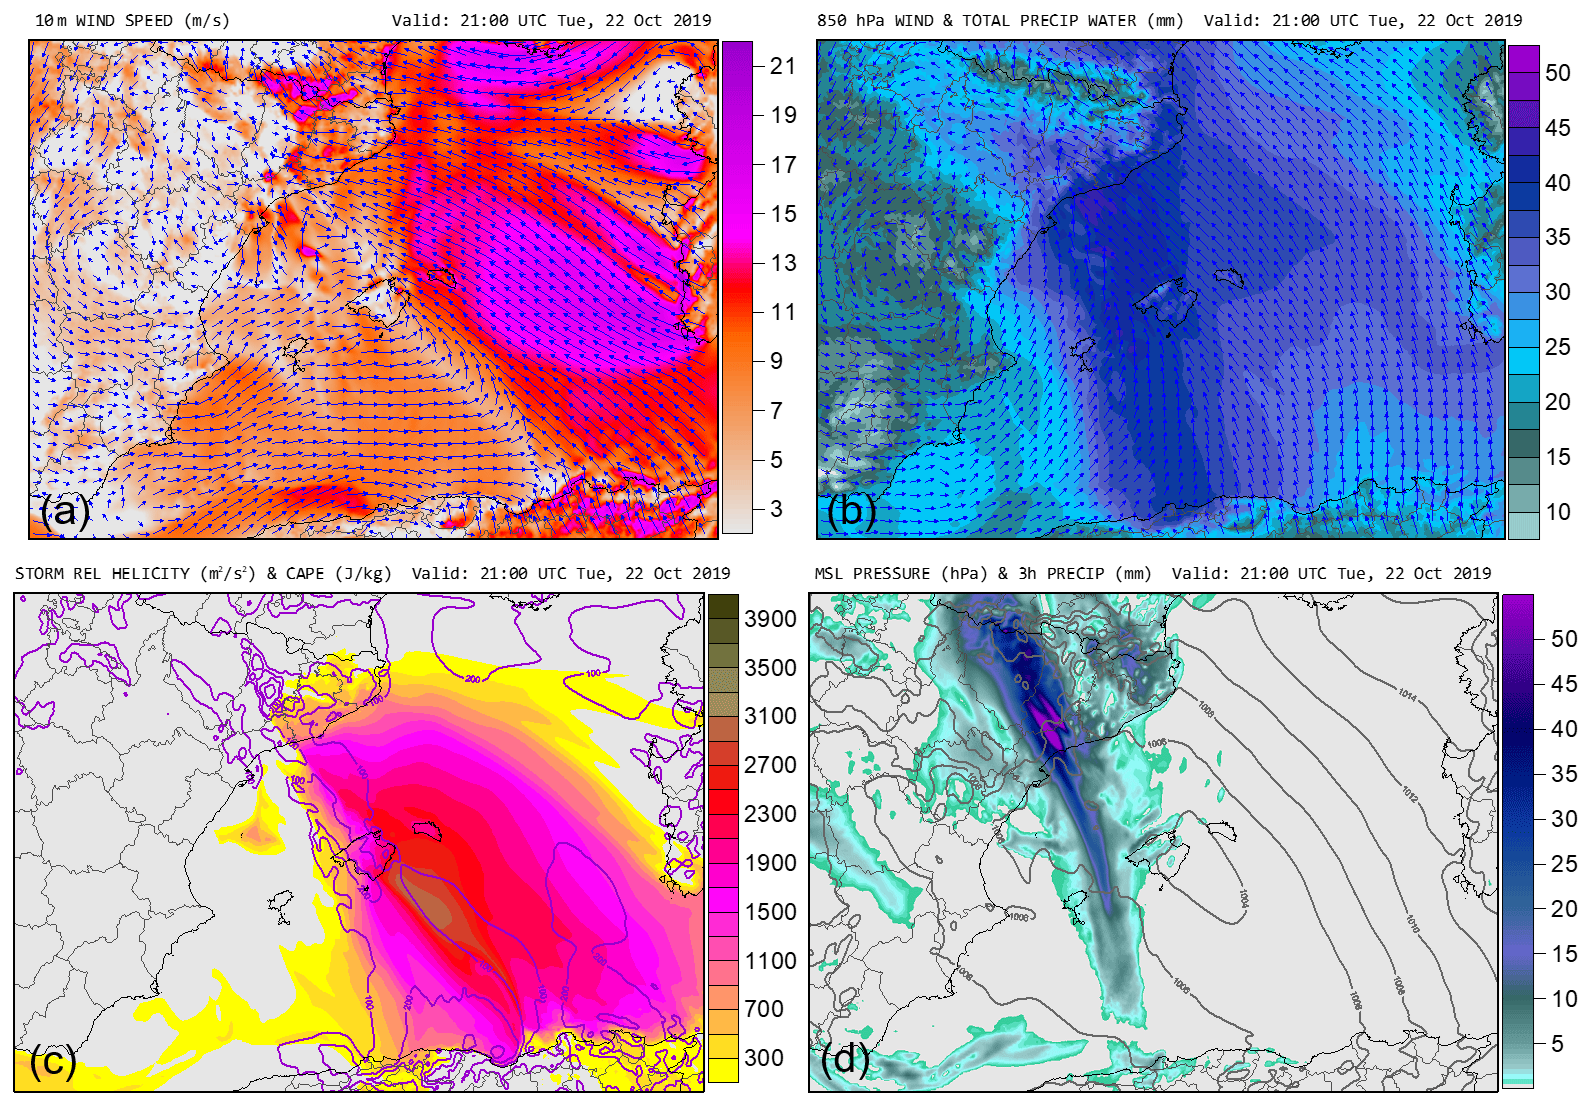
Figure 6Results of the control simulation at 21:00 UTC on 22 October 2019, showing (a) surface wind field (vectors and speed in m s−1, according to colour scale), (b) 850 hPa wind vectors and precipitable water in the tropospheric column (mm, according to colour scale), (c) storm-relative helicity (m2 s−2, contour lines) and convective available potential energy (J kg−1, according to colour scale), and (d) mean sea level pressure (hPa, contour lines) and accumulated precipitation from the previous 3 h (mm, according to colour scale).
The surface wind fields confirm the impinging of a south-easterly flow towards the Catalonian precoastal orography (Figs. 5a and 6a). Such a direction is optimal for the mechanical uplift of surface parcels by the mountain slopes of Tarragona, since its ridges are aligned parallel to the coastline (Romero et al., 1999). Broadly speaking, the impinging surface airflow is the leading portion of a maritime low-level jet (LLJ) pattern that initiates towards the south-western coasts of Sardinia. This LLJ tends to reinforce and shift northwards during the second half of 22 October, in association with the evolution of the synoptic-scale system described in Sect. 2.2. An additional feature of interest that enhances the low-level convergence in the southern sector of Catalonia, where the convective systems developed and persisted for several hours, is the north-westerly flow channelled along the Ebro valley, which encounters – in the opposing direction – the abovementioned maritime flow. Although this feature losses importance at night (Figs. 1 and 6a), the combined pattern of land and maritime flows and the corresponding convergence over Tarragona and the nearby sea persisted during the entire HPE.
The maritime flow against the coast maintains coherence through the low troposphere (see, for instance, the wind field at 850 hPa in Figs. 5 and 6). As expected, this airflow brings plenty of moisture of Mediterranean origin towards the Catalonian coast, as evidenced by the simulated values of vertically integrated precipitable water above 40 mm. Since this pattern persisted for several hours, the atmospheric circulation clearly favoured a continuous feeding of the precipitation systems and its quasi-stationary character, that is, the so-called convective train effect: a successive development of convective cells in a line lying over the same zone (Doswell et al., 1996).
Two basic factors for the development and maintenance of deep moist convection were the (i) low-level water vapour flux convergence and (ii) upward vertical motion. Both factors were synoptically favoured and specifically modulated and enhanced by mesoscale-forced and topographically forced circulations. However, an additional factor became crucial for the development and maintenance of deep moist convection: ingestion of air parcels possessing convective or latent instability (e.g. Doswell et al., 1998; Romero et al., 2000). The model-simulated CAPE (Figs. 5c and 6c) during the most intense phase of the episode confirms this important requirement of the synoptic-scale/mesoscale environment: moderate to high values of CAPE existed on 22 October 2019 over the western Mediterranean Sea. These unstable vertical profiles were persistently advected towards the coastlands of Catalonia.
In summary, the control simulation is apparently successful in capturing both the synoptic and mesoscale processes/factors responsible for the onset, intensification, and maintenance of a slow-moving convective system over south-western Catalonia. As a result, the model effectively simulates extreme precipitation rates in this region from the afternoon of 22 October until early hours of next day (Figs. 5d and 6d). The same panels display the sea level pressure field during the convective event, highlighting the important role of the western Mediterranean cyclogenesis and the rather slow progression of the resulting low for the configuration of the abovementioned kinematic and thermodynamic factors.
Finally, it is repeatedly hypothesized that the topographically complex terrain of the affected area, in particular the arrangement of the precoastal mountain ridges in Tarragona, basically parallel to the coast, would ultimately have been the critical element for the disproportionate rain totals and intensities over the Francolí catchment. This hypothesis is fully confirmed when examining the results of a new simulation in which the terrain elevation is removed, while the land–sea transition and the rest of surface characteristics are maintained. In particular, the total precipitation amount during the event yielded by this non-orographic simulation merely reaches 50 mm over the area of interest, in stark contrast with a maximum value above 300 mm in the control simulation (Fig. 7).
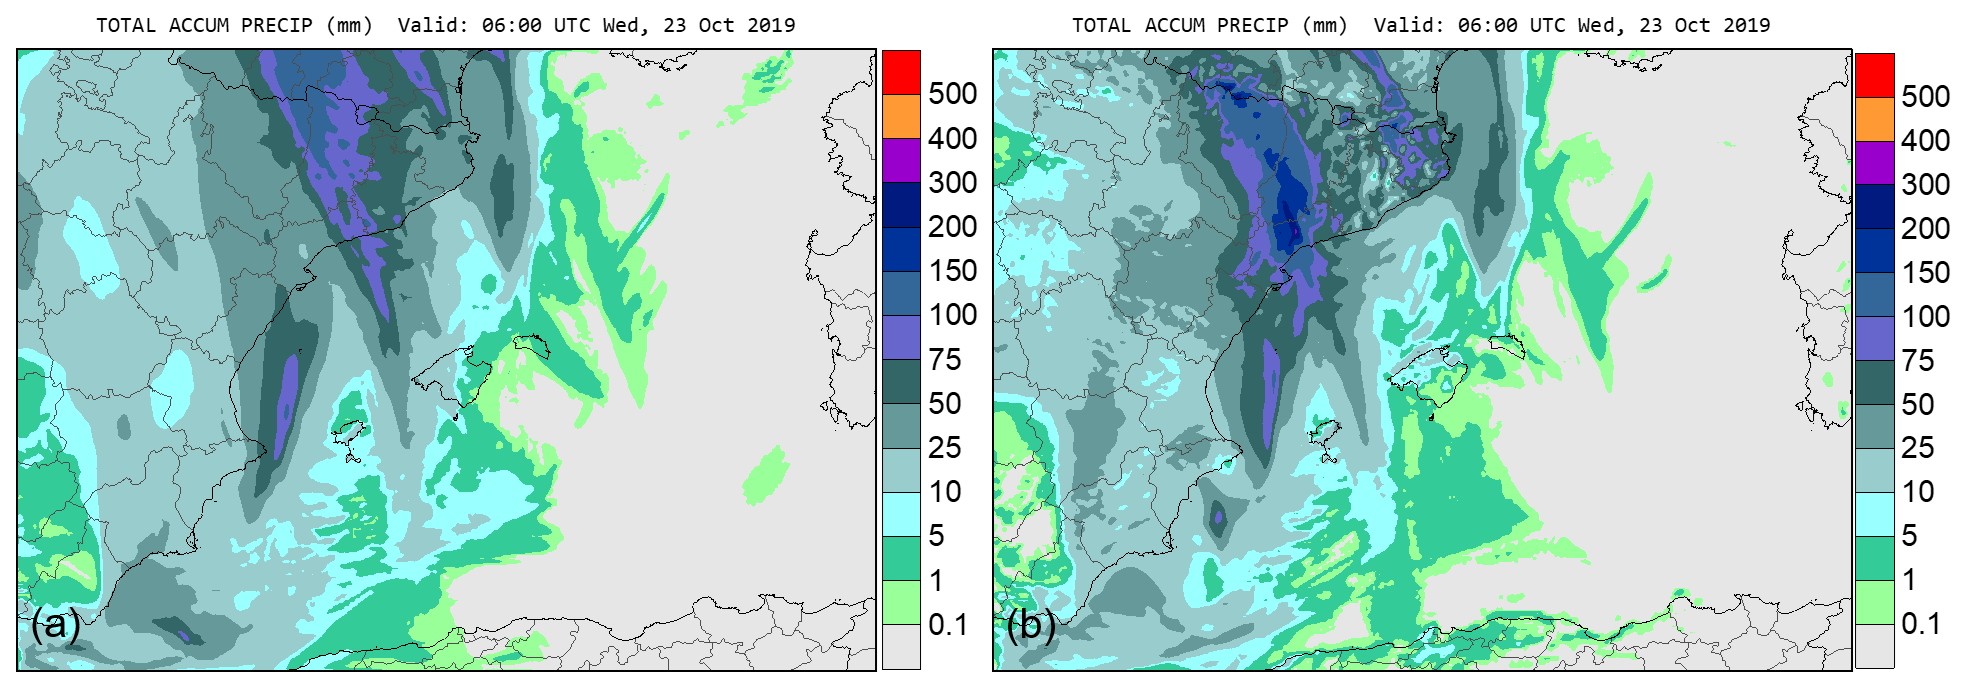
Figure 7Comparison of the Triangle-based Regional Atmospheric Model-simulated precipitation, accumulated over 24 h from 22 to 23 October 2019 at 06:00 UTC, between the (a) non-orographic and (b) full control simulations.
It should be noted that a general structure of heavy precipitation – oriented in the NW–SE direction and crossing the western half of Catalonia – is still found in this perturbed simulation, highlighting the flood potential of the described meteorological setting by itself.
4.2 Spatial and temporal organization of the HPE
According to the five automatic rain gauges which recorded the highest rainfall amounts for the entire episode – varying from 240.4 to 299.5 mm – over the study region, the duration of total rainfall was 21 h. The first organized convective band resulted in cumulative precipitation ranging from 50.3 to 72.3 mm between 02:00 and 14:00 UTC on 22 October (Fig. 8a). The maximum 10 min rainfall intensity varied between 28.5 and 42.0 mm h−1 during this period. Simultaneously with an hour rainfall hiatus inside the catchment, a persistent and elongated area of convection developed to the south-west and gradually moved north-eastward towards the basin.
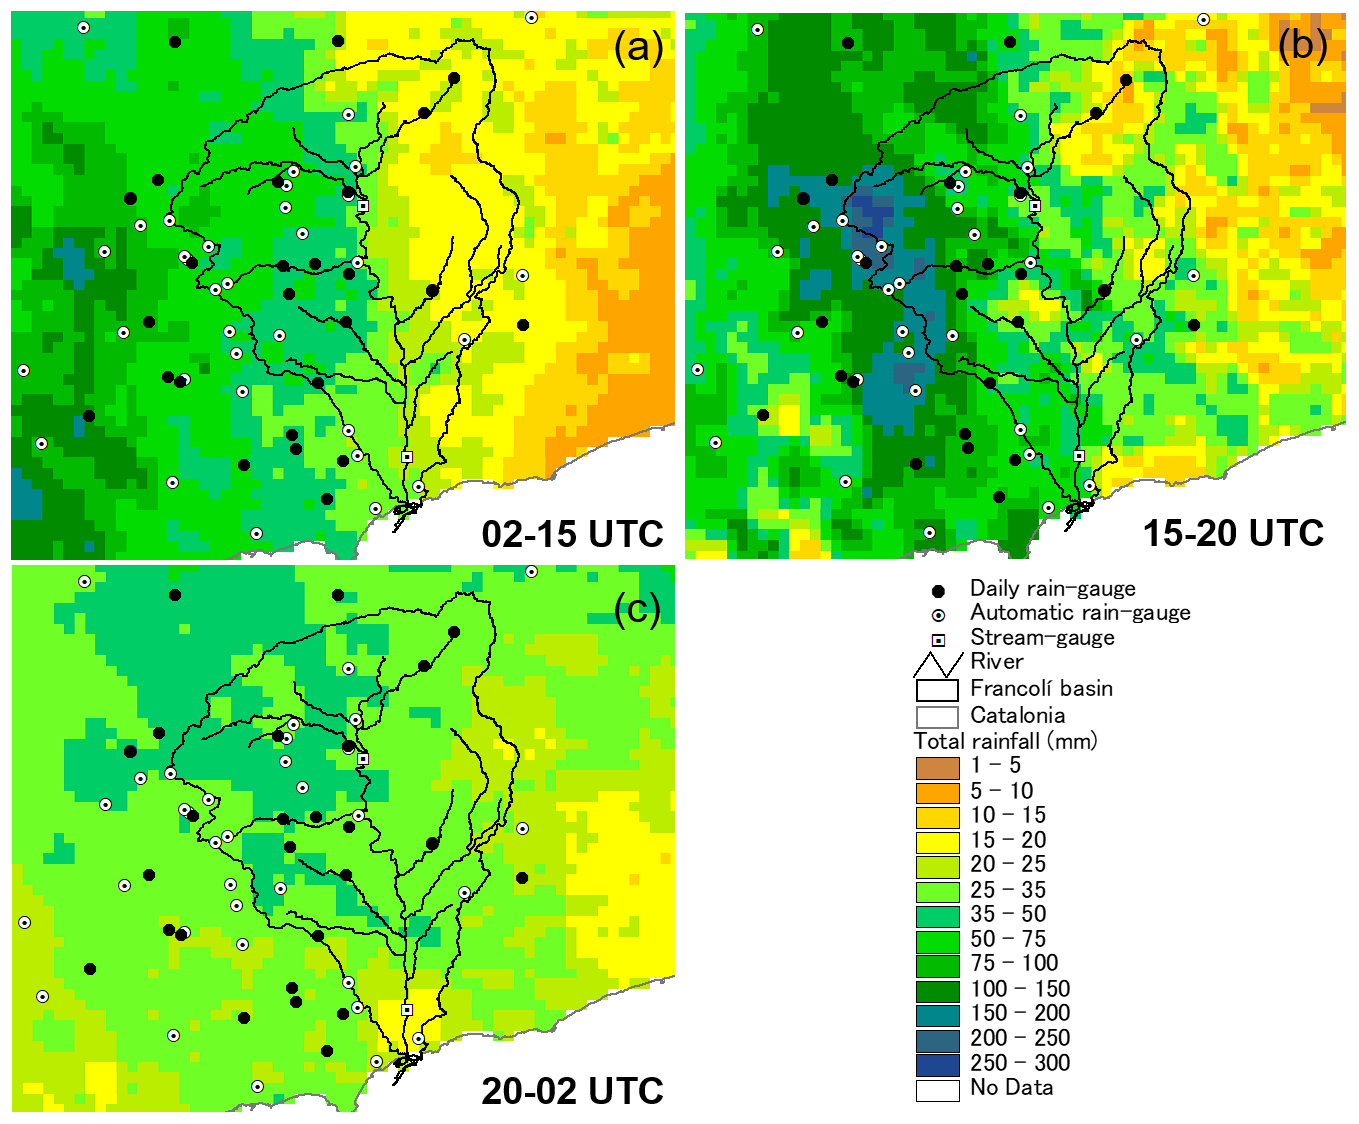
Figure 8Spatial distribution of the accumulated radar-derived precipitation: (a) from 02:00 to 15:00 UTC on 22 October, (b) from 15:00 to 20:00 UTC on 22 October, and (c) from 20:00 UTC on 22 October to 02:00 UTC on 23 October. The Francolí River catchment is outlined with a thin black line. White squares represent the locations of automatic stream gauges. White dots indicate the positions of automatic rain gauges. Daily pluviometric stations are marked by black dots.
From 16:00 to 20:00 UTC, this second convective band remained quasi-stationary over the western Francolí headwaters, leading to heavy rainfall that overwhelmed this area (Fig. 8b). The persistent convective systems resulted in bursts of rain, with a maximum 10 min rainfall rate of 124.8 mm h−1 and a 4 h accumulation of 193.4 mm. According to the selected pluviometers, the duration of 10 min precipitation intensities exceeding 20 mm h−1 ranged from 3.5 h to nearly 5 h, while the duration of 10 min rainfall rates above 50 mm h−1 varied between 0.3 and 1.5 h. From 21:00 UTC, a third organized convective band moved across the watershed from south to north, causing a third wave of precipitation that lasted approximately 5 h (Fig. 8c). Cumulative precipitation ranged from 29.8 to 39.5 mm among the selected rain gauges, with maximum 10 min rainfall rates ranging between 18.0 and 26.4 mm h−1.
The 48 h radar-derived rainfall field confirms that the lifting caused by local topographic forcing played a crucial role in amplifying the maximum rainfall amounts over the north-western headwaters of the Francolí catchment (Fig. 4). Precipitation amounts exceeding 150 mm were confined to this particular area, with cumulative rainfall surpassing 300 mm in the highest mountainous reliefs. This spatial concentration of total precipitation is evident in terms of the areas where a given amount of rainfall was exceeded. The extent of the areas surpassing the 200 and 300 mm thresholds was approximately 110 and 25 km2, respectively.
The main features of this HPE over the Francolí watershed are investigated by analysing the 10 min catchment-area average rainfall rates and the proportion of the drainage area affected by 10 min rainfall rates exceeding 20 and 50 mm h−1. Both metrics are commonly used to describe rainfall conducive to flash flooding as they link the influence of rain and basin scales on the hydrological response (Zhang et al., 2001; Smith et al., 2002; Borga et al., 2007; ten Veldhuis et al., 2018). Furthermore, the dependence between basin size and exceedance area above a specific set of rainfall amount thresholds, ranging from 50 to 400 mm, at 25 mm steps, is investigated. These thresholds represent the range of cumulative QPE within the Francolí basin for this HPE. Additionally, the drainage areas impacted by precipitation intensities surpassing 20 and 50 mm h−1 as well as their durations are explored. The basic idea is to further explore the spatial and temporal organization of the rainfall fields conducive to this extreme flooding (Fig. 9).
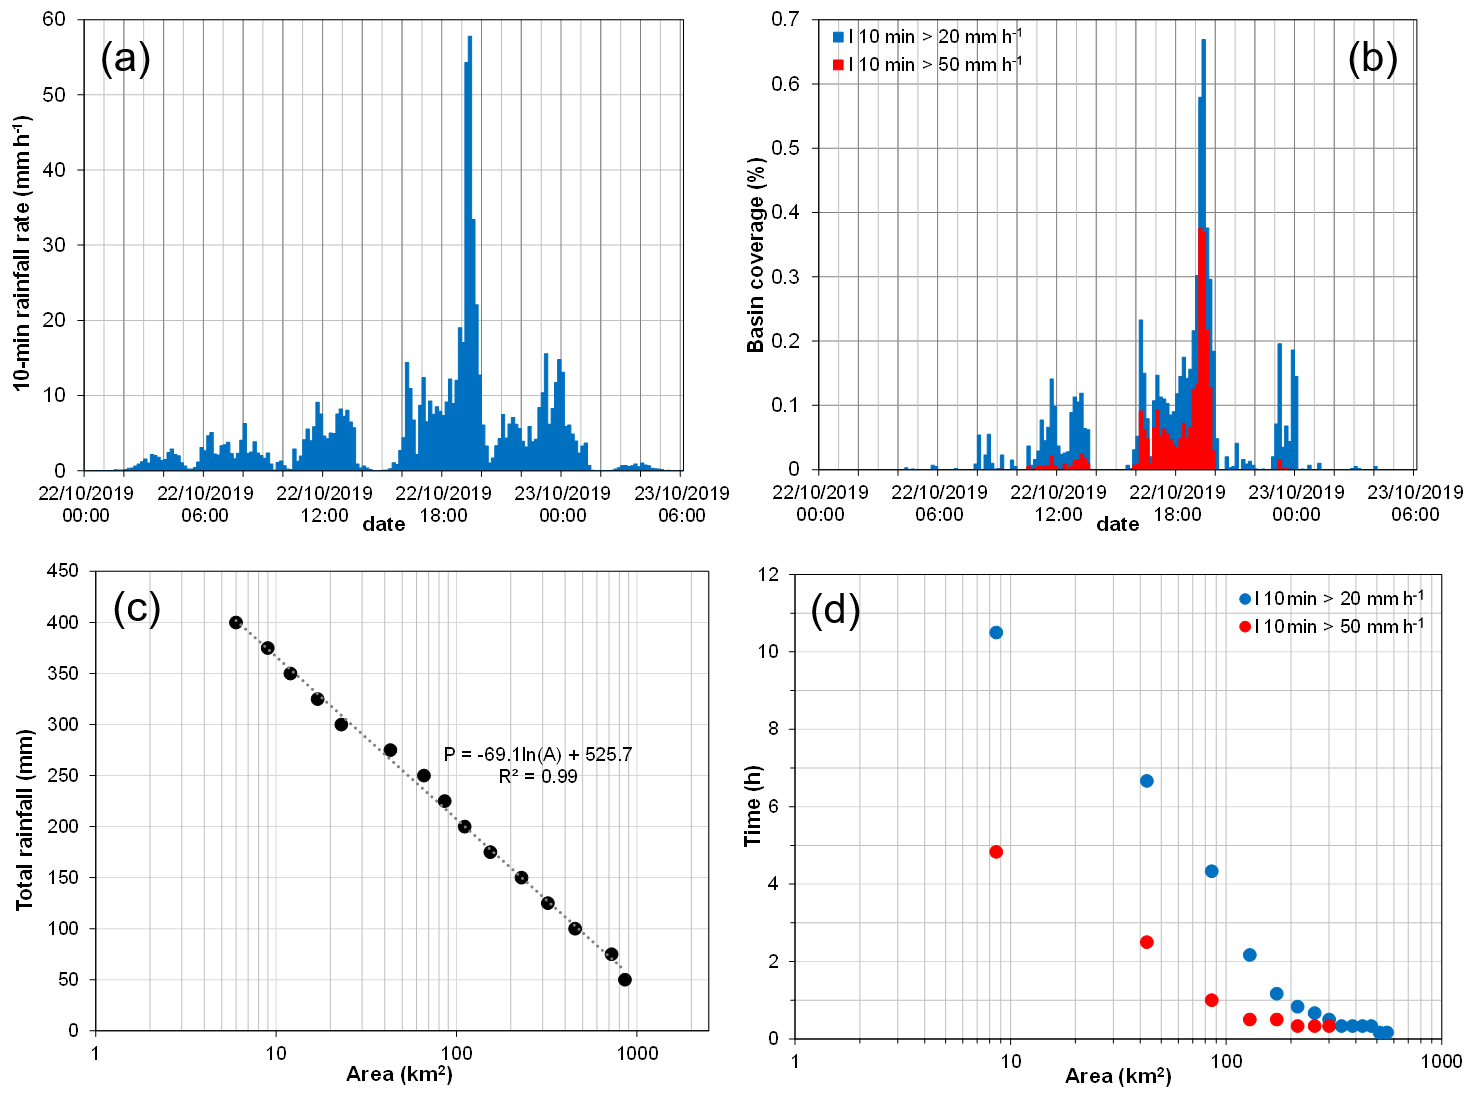
Figure 9Time series from 00:00 UTC on 22 October to 06:00 UTC on 23 October showing the (a) 10 min catchment-area average rainfall and (b) fractional basin areas covered by 10 min precipitation rates of > 20 mm h−1 (blue bars) and > 50 mm h−1 (red bars). (c) Exceedance drainage extents above the indicated thresholds for total precipitation. (d) Basin areas affected by 10 min rainfall rates of > 20 mm h−1 (blue dots) and > 50 mm h−1 (red dots) and their durations.
The catchment-area average total rainfall and maximum 10 min basin-area average precipitation rate during the passage of the three successive organized convective bands were 33.9 mm and 9.1 mm h−1 from 02:00 to 14:00 UTC, 62.8 mm and 57.8 mm h−1 from 16:00 to 20:00 UTC, and 31.8 mm and 15.6 mm h−1 from 20:00 UTC on 22 October to 02:00 UTC on 23 October. Interestingly enough, the exceedance drainage areas above the selected rain thresholds are connected by a strong logarithmic relationship (R2= 0.99; Fig. 9c). This suggests that, at least for this case study, the spatial organization of the total rainfall amount could have served as a useful predictive proxy for identifying basin scales that were most likely to experience runoff triggering.
A striking feature of this HPE is that 10 % of the basin size experienced rainfall intensities larger than 20 mm h−1 for more than 4 h and precipitation rates higher than 50 mm h−1 for 1 h (Fig. 9d). Furthermore, 5 % of the total catchment area was subjected to precipitation rates of 20 mm h−1 for almost 7 h and 50 mm h−1 for 2.5 h. It is worth noting that the spatial and temporal scales of these rainfall rates also exhibit a logarithmic decrease up to 100 km2 for this case study. For larger scales, the time decrease exhibits a tail with drainage extent (Fig. 9d). This behaviour can be expected if heavy and persistent rain is the result of a certain hierarchical organization of the convective system. Specifically, short-lasting and small-sized convective cores with very high rainfall rates are embedded with more persistent convective clusters characterized by lower precipitation intensities, which, in turn, are embedded within even larger convective structures of even lower rainfall rates. If the hierarchical convective system organization is inverted, the spatial and temporal scales of deep and moist convective activity can result in a self-similar organization between maximum 30 min rainfall rates and total precipitation amounts over a region (Amengual, 2022). In the end, the hierarchy of a flash-flood-producing storm is influenced by its spatial structure and temporal evolution, orographic enhancement, and quasi-stationary character.
4.3 Flood response and water balance
4.3.1 Basin response
According to radar estimates, the catchment-area average total rainfall amount was 129.9 mm, while the runoff ratio over the entire basin was remarkably small, at 0.1 (Table 1). The severe soil moisture deficit in the Francolí catchment was a result of the long, warm, and dry summer typical of the Mediterranean climate. September 2019 experienced above-average temperatures and below-average rainfall, with total observed amounts within the basin being less than 35 mm. October was also warmer and drier than average, with maximum cumulative precipitation reaching only 20 mm until 20 October (SMC, 2019a, b).
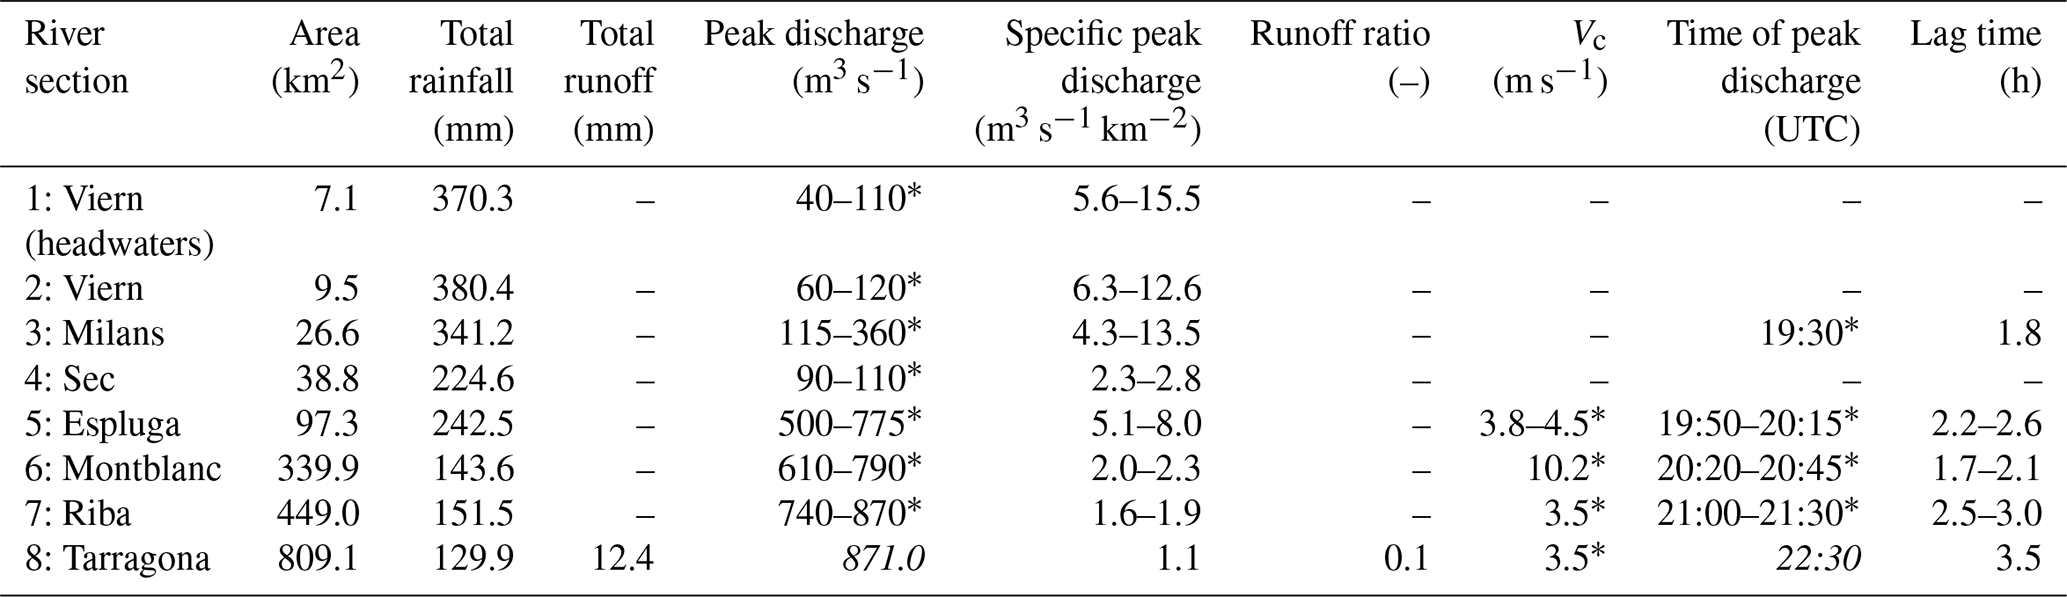
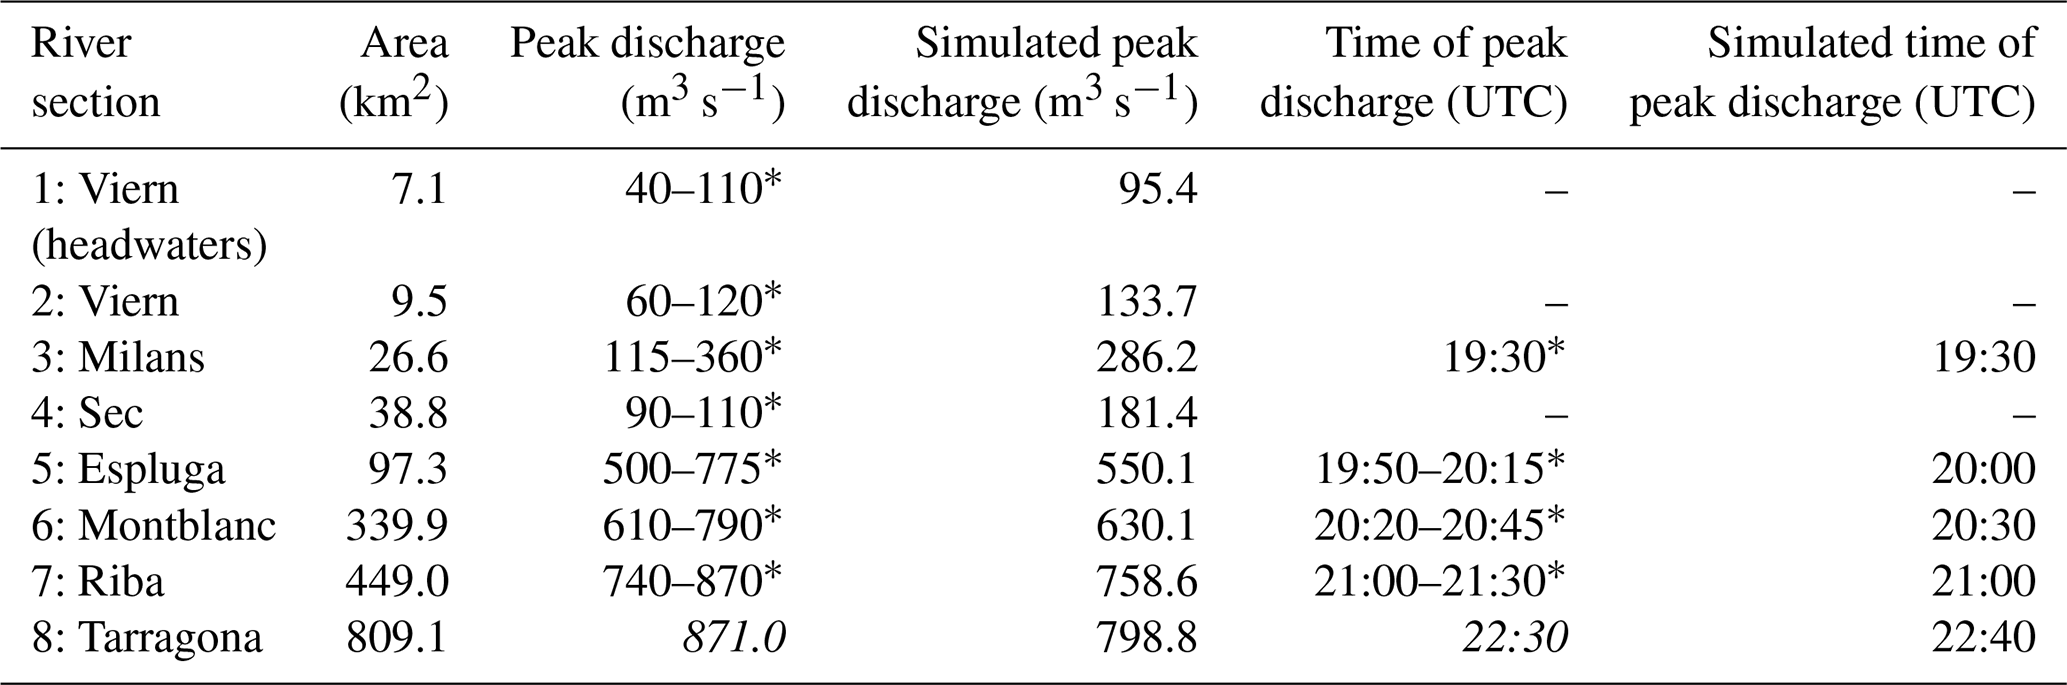
Table 1Main hydrometeorological features of the 22 October 2019 flash flood at the surveyed river sections. The total rainfall amount is derived from radar data and represents the area average value enclosed by each river section. The times of peak discharges correspond to 22 October. Data marked with an asterisk (*) denote estimates based on field observations and hydraulic modelling conducted by Martín-Vide et al. (2023). Data in italics denote observations of the automatic stream gauge.
During the passage of the first convective band (02:00–14:00 UTC), the rainfall rates and amounts were not large enough to result in infiltration–excess runoff generation. However, they did ameliorate the strong deficit in soil moisture content. The extreme precipitation intensities and amounts associated with the quasi-stationary convective systems (16:00–20:00 UTC) led to a paradigmatic case of fast infiltration–excess runoff generation. Specifically, from 18:50 to 19:40 UTC, the north-western Francolí basin suffered the most striking rainfall period, with a total catchment-area average precipitation of 34.3 mm and a maximum 10 min basin-area average rainfall rate of 57.8 mm h−1. Furthermore, the maximum basin fraction covered by rainfall intensities greater than 20 and 50 mm h−1 was of 0.67 and 0.38, affecting drainage areas of 574.0 and 322.6 km2, respectively (Fig. 9a and b). This very heavy rainfall burst, lasting for approximately an hour, produced a flash flood with catastrophic impacts over drainage areas of ca. 500 km2.
The availability of automatic stream-gauge data is limited to a site near the mouth of the Francolí River, in the city of Tarragona (Table 1; Fig. 1). Unfortunately, the automatic flow station located in the city of Montblanc, which closes the upper Francolí catchment, was damaged by the flood bore. Before its destruction, the stream gauge recorded a sudden and significant increase in flow from 2.3 m3 s−1 at 20:10 UTC to 186.2 m3 s−1 at 20:15 UTC on 22 October. The Tarragona station observed a main peak discharge of 871.0 m3 s−1 at 22:30 UTC. Prior to this peak, a very minor peak of 75.4 m3 s−1 had been measured at 22:00 UTC. The rising limb of the hydrograph was exceptionally steep, with discharge increasing from 65.6 to 871.0 m3 s−1 in just 15 min (Fig. 10). That is, the discharge multiplied by more than 13 times. Furthermore, the peak discharge was more than 2900 times the daily mean baseflow on 21 October, which was 0.3 m3 s−1, highlighting the dominant contribution of fast superficial flow. In response to the last rainy period of precipitation, a secondary peak discharge of 212.3 m3 s−1 was registered on 23 October at 03:15 UTC.
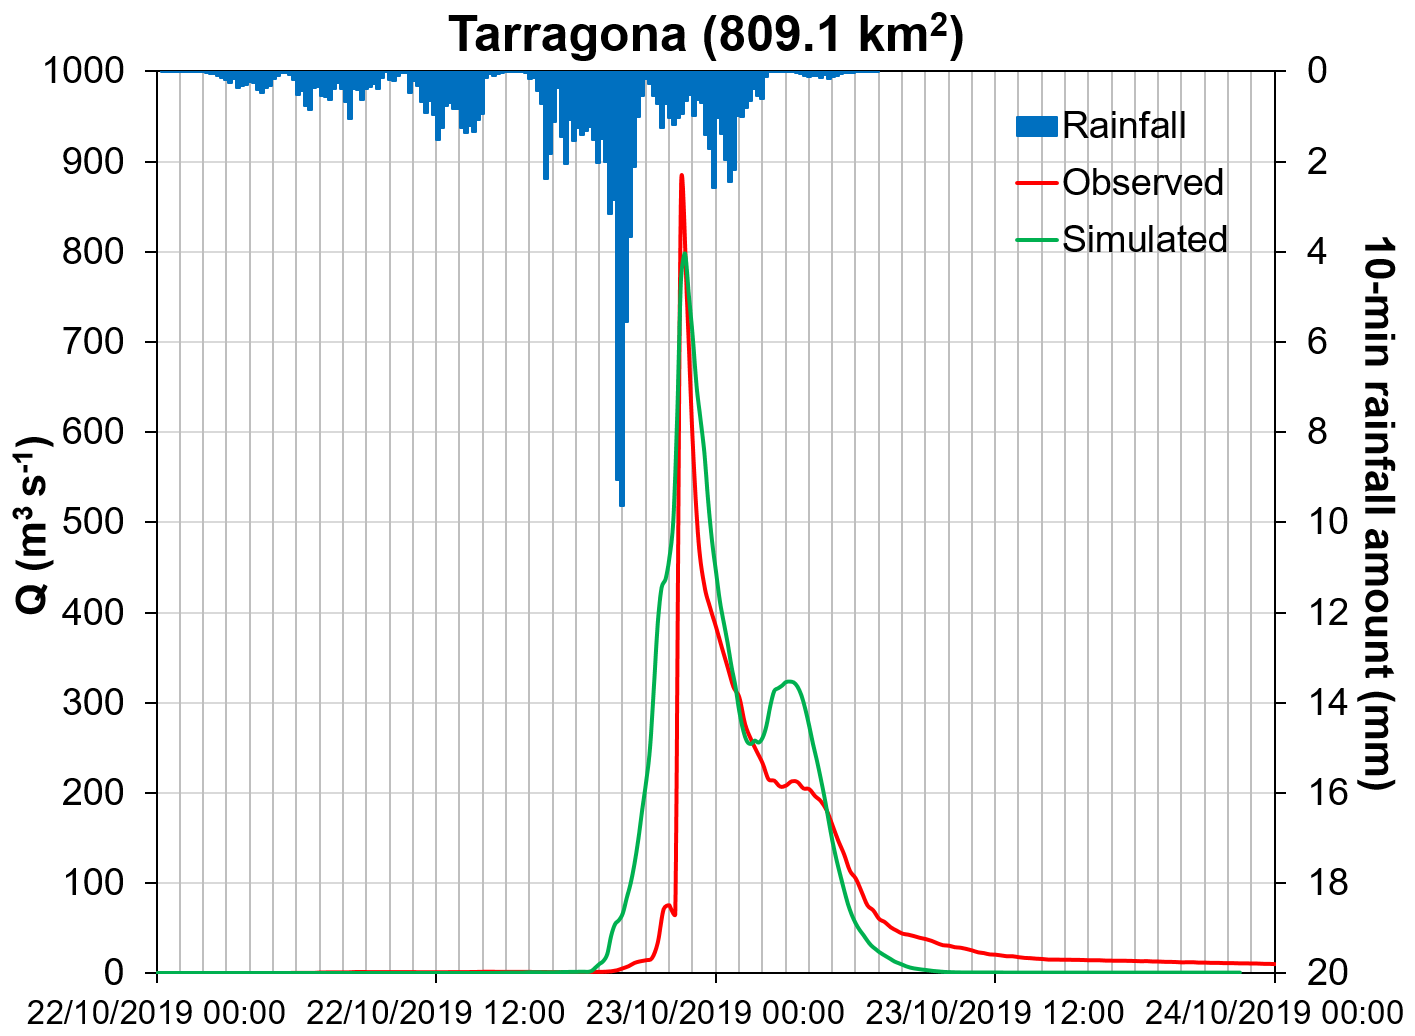
Figure 10Observed and Kinematic Local Excess Model radar-driven discharge simulation for the 22 October flash flood at the Tarragona flow gauge. Also shown are the 10 min catchment-area average rainfall amounts enclosed by this river section.
Shortly after the occurrence of the flash flood, Martín-Vide et al. (2023) conducted a comprehensive field campaign that involved post-flood field observations and interviews with local residents. Fieldwork focused on documenting high-water marks and changes in channel geometry at various river sections along the upper Francolí watershed. Eyewitness accounts provided valuable information on the severity of the flood, the rates of stream rise, and the timing of peak discharges. Following hydraulic modelling, a range of plausible peak discharges values were estimated (Table 1). Variation in specific peak discharge with cumulative precipitation highlights the marked nonlinear nature of basin response. Furthermore, the abrupt change in flood velocity between the towns of Espluga de Francolí and Montblanc reflects the interaction of woody debris with the bridges along this river reach (for further technical details, the reader is referred to Martín-Vide et al., 2023).
4.3.2 Hydrological modelling
Hydrological response is further examined by implementing the KLEM model. Calibration efforts are focused in reproducing the peak discharge, time to peak, and runoff volume at the Tarragona river section where observations are available. These features are primarily influenced by infiltration and surface flow velocities. Curve numbers represent a piece of input data in this work and are kept invariant, as these are derived from field observations. The initial abstraction ratio is considered a calibration parameter in the infiltration process due to large soil retention capabilities. Large storativities are associated with the exceptionally low initial soil moisture content and with the recharge of deep aquifers through infiltration, percolation, and transmission losses along the river beds. In this way, it is possible to correctly simulate the observed water balance (Table 1). As channel flow velocity is determined from field estimations, the hillslope flow velocity is considered a calibration parameter for correctly reproducing the dynamical processes.
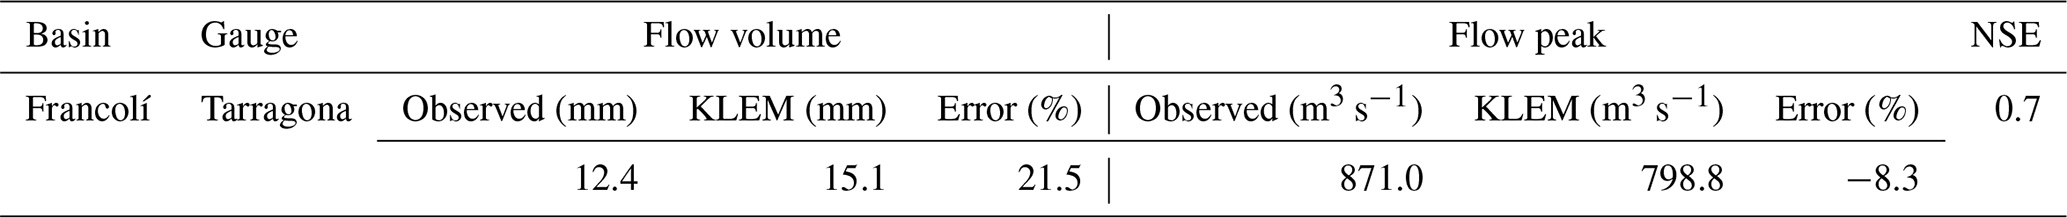
During the calibration tasks, the performance of the hydrological model is evaluated against the observed hydrograph using different objective functions. In particular, the skill of the QPE-driven runoff simulation is evaluated by means of the Nash–Sutcliffe efficiency criterion (NSE; Nash and Sutcliffe, 1970) and the relative errors in peak discharge and total direct runoff volume, expressed as a percentage. After calibration, KLEM adequately captures the overall basin response, exhibiting a high goodness of fit in terms of peak magnitude and timing (Tables 2 and 3; Fig. 10). The adequate performance of the model can be partially attributed to the significant impact of the heavy rainfall burst between 18:50–19:40 UTC, which strongly modulated the basin response. However, the observed water balance is moderately overestimated, with an error slightly exceeding 20 %. The peak discharge at the catchment outlet is slightly underestimated, with a deviation of −8.3 %. These discrepancies in reproducing the overall observed hydrograph contribute to a NSE score of 0.7 (Table 3). The errors in simulating the water balance primarily stem from inaccuracies in reproducing the sharp rising limb of the observed hydrograph, resulting in an excessive initial runoff volume (Fig. 10). The Francolí watershed exhibited a combination of high abstractions and subsequent extreme infiltration–excess runoff rates.
Table 2KLEM parameters for infiltration and dynamical processes at the Tarragona river section. The curve number (CN), initial abstraction (Ia), and soil retention capacity (S) are expressed as area average values, while their standard deviations are shown in brackets.

Table 3Observed and radar-driven simulated flow volume and peak discharge at the Tarragona river section. Model performance also shown in terms of the different skill scores. Negative values in relative errors denote model underestimation.
Although calibration tasks are based on the observed flood hydrograph at the catchment outlet, 16 additional river sections have been included in KLEM to explore hydrological response at smaller drainage areas. These 17 control points include the river sections indicated in Table 1, which serve to validate model performance. Comparison of the numerical results for the peak flows and the times to peak against the post-event field estimates at the surveyed river sections along the upper Francolí catchment confirms the quality of the control simulation in reproducing the hydrological response at smaller drainage areas (Table 4 and Fig. 12 in Sect. 5). Even so, inaccuracies emerge at some river sections. A moderate overestimation of 11.4 % is found in the simulated peak discharge at the Viern river section, when compared against the maximum value of the range of reconstructed peak discharges. This fact could be partly attributed to the strong geomorphological changes that affected the river beds along the upper basin. The overestimation in the simulated peak flow is more pronounced at the outlet of the Sec tributary, with a relative error of 64.9 % when compared against the maximum of the range of estimated peak flow values (Table 4, Fig. 1). The Sec tributary was characterized by the highest transmission losses among the entire channel network of the Francolí River during the course of this flash flood event. Such specificities in geomorphology cannot be accurately accounted for when simulating the entire catchment with a single parameterization. In addition, the simulated peak discharges at the Espluga and Montblanc river sections are in the lower range of the reconstructed peak flow values. As mentioned above, an anomalous and short-lived peak flow resulted from a sudden release of a wood debris jam at a bridge located upstream of the town of Espluga. This surge propagated downstream, while the wood debris also obstructed several bridges between both cities. These transient-state and complex flow conditions cannot be accurately simulated by hydrological modelling, but they need the implementation of 2D hydraulic modelling (Martín-Vide et al., 2023).
Table 4Comparison of data obtained from the hydrological control simulation and estimates based on field observations and hydraulic modelling conducted by Martín-Vide et al. (2023). Estimates are marked with an asterisk (*). Observations have been included for completeness (in italics).
As QPEs are estimated with relatively good accuracy over the Francolí basin, it is unlikely that inaccuracies in the simulated water balance emerge from large errors in QPEs (Fig. 4). Instead, these imprecisions are more likely due to errors in accurately representing soil response to heavy rainfall. Nevertheless, the uncertainties in reproducing fine features of the highly variable precipitation pattern need to be acknowledged due to the assumptions used in different correction procedures. Further research efforts in the future should be devoted to performing a sensitivity analysis of the hydrological response with respect to uncertainties in QPE estimates coming from different radar networks (i.e. AEMET and SMC) and by applying distinct correction procedures. Moreover, the SCS-CN infiltration scheme depends on antecedent precipitation for assessing initial soil moisture conditions. The hydrological model does not currently ingest soil moisture fields derived from global models or satellite data, a potential enhancement that could reduce uncertainties in the initial conditions. Integrating more complex infiltration schemes into KLEM, with the capability to start the model by assimilating soil moisture fields from such data sources, remains a future research task.
4.3.3 Sensitivity tests
Three sensitivity tests are devised to evaluate the influence of different factors on the unfolding of the flash flood (Table 5). The first sensitivity test (labelled as test 1) focuses on the role of soil moisture in hydrological response. In this simulation, only the rainfall that occurred from 16:00 UTC onwards is considered, disregarding the previous precipitation during the event. CNs are set to represent normal antecedent moisture conditions (AMC II), based on the SCS recommendation of 5 d total antecedent rainfall up to 53.3 mm for high evapotranspiration rates (Maidment, 1993). The second sensitivity test (labelled as test 2) assesses the effect of early precipitation between 02:00 and 14:00 UTC, before the onset of the most intense rainfall period. In this experiment, the precipitation during this period is also disregarded, while CNs remain the same as in the control simulation, representing AMC I. The third sensitivity test (labelled as test 3) examines the role of the heaviest rainfall rates from 18:50 to 19:40 UTC on basin response. In this experiment, the variability in 10 min rainfall during this temporal span is smoothed out by considering its temporal average. That is, instead of using the actual 10 min precipitation rates, a constant and averaged 10 min rainfall intensity of 33.9 mm h−1 is employed for the entire 18:50–19:40 UTC period. Test 3 maintains the same CNs as in the control simulation, and it preserves the total rainfall amount of the event. The remaining KLEM parameters are kept invariant through the sensitivity experiments to ensure consistency with the control simulation (Table 2; Fig. 10).
Table 5Observed and radar-driven simulated flow volume and peak discharge of the Francolí River at the Tarragona river section for the control and test experiments. Negative values in relative errors denote model underestimation. Total rainfall amount is radar derived and is expressed as the area average basin value. Time of peak discharge refers to 22 October 2019.
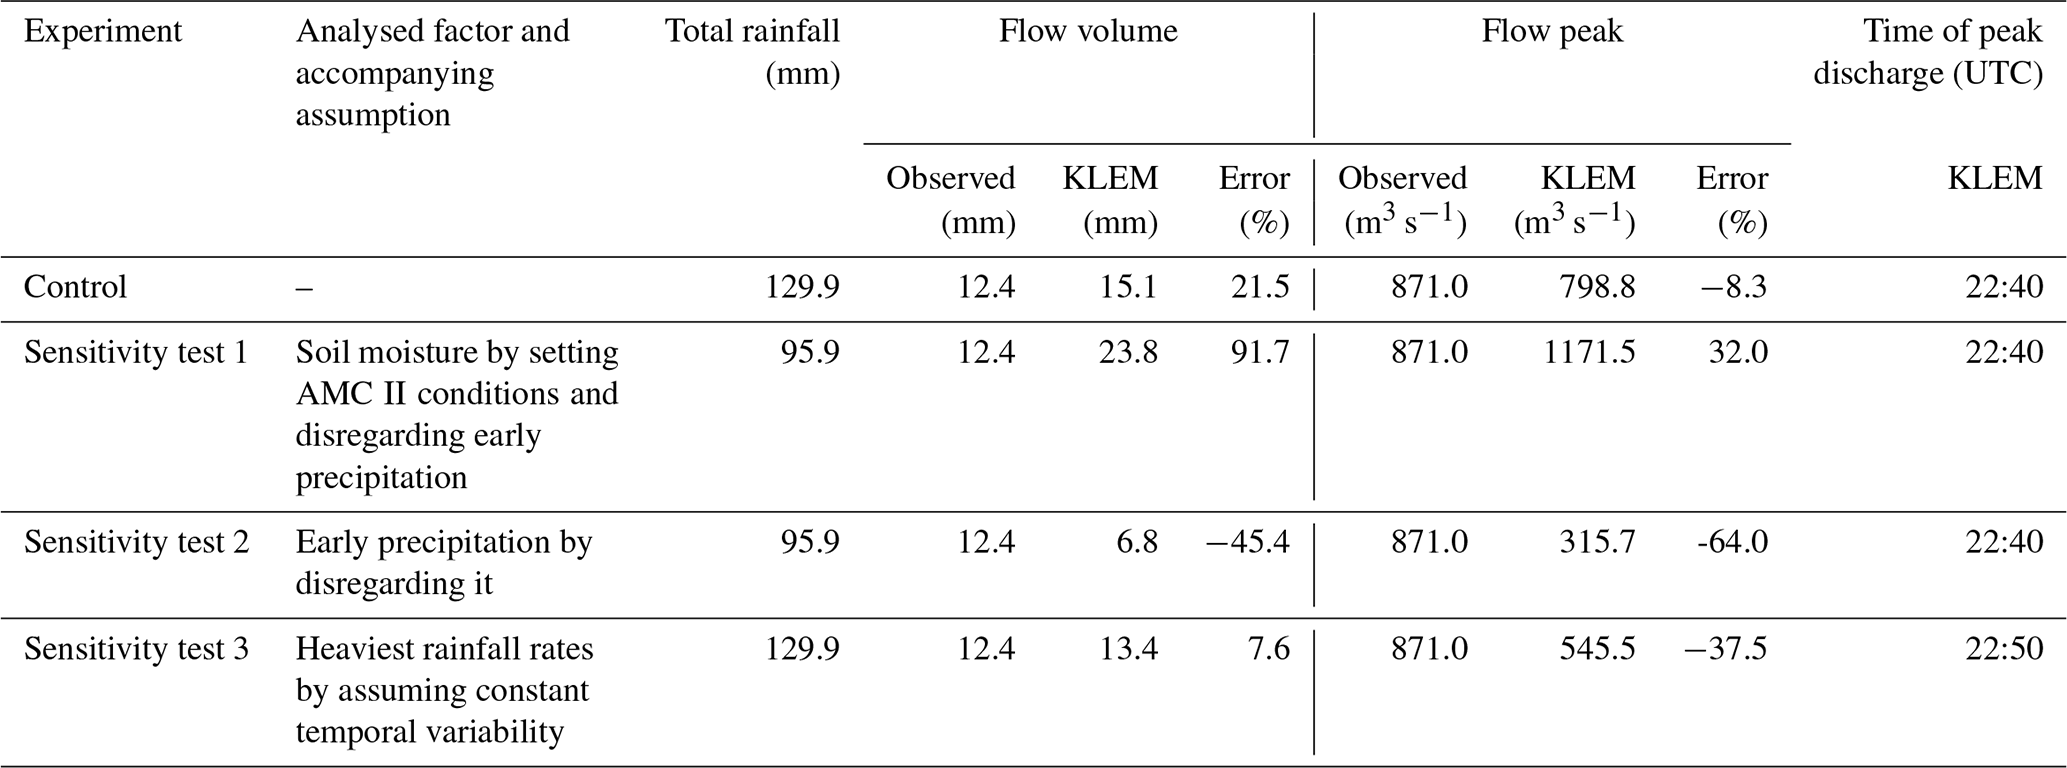
The outcomes of the different sensitivity tests highlight the relative importance of each factor in modulating the overall basin response, quantified by the errors in reproducing the control simulation. Firstly, results indicate significant overestimations of the simulated peak discharge and total runoff volume for sensitivity test 1. Errors in peak discharge and direct runoff volume amount up to 32.0 % and 91.7 %, respectively, even when the catchment-area average cumulative precipitation during the event is smaller (Table 5; Fig. 11). This outcome would indicate that soil was far from saturation prior to the extreme precipitation intensities and amounts that triggered the 22 October 2019 flash flood. Secondly, sensitivity test 2 suggests the importance of the early rainy period between 02:00 and 14:00 UTC on 22 October. Disregarding this factor leads to significant underestimations of the simulated peak discharge and total runoff volume, with errors of −64.0 % and −45.4 %, respectively (Table 5). This early precipitation stage was instrumental for the development of the catastrophic flash flood: it moistened the topsoil, resulting in decreased infiltration rates. As a result, it promoted large infiltration–excess runoff ratios as a response to the subsequent extreme rainfall intensities and amounts. Finally, sensitivity test 3 would indicate that the rainfall intensities between 18:50–19:40 UTC played a fundamental role in triggering sudden and large infiltration–excess runoff rates. Disregarding rainfall variability leads to a high underestimation in peak discharge, with a relative error of −37.5 %. Therefore, rainfall variability resulted in an enhanced and very narrow peak discharge, promoting a very flashy basin response (Table 5; Fig. 11).
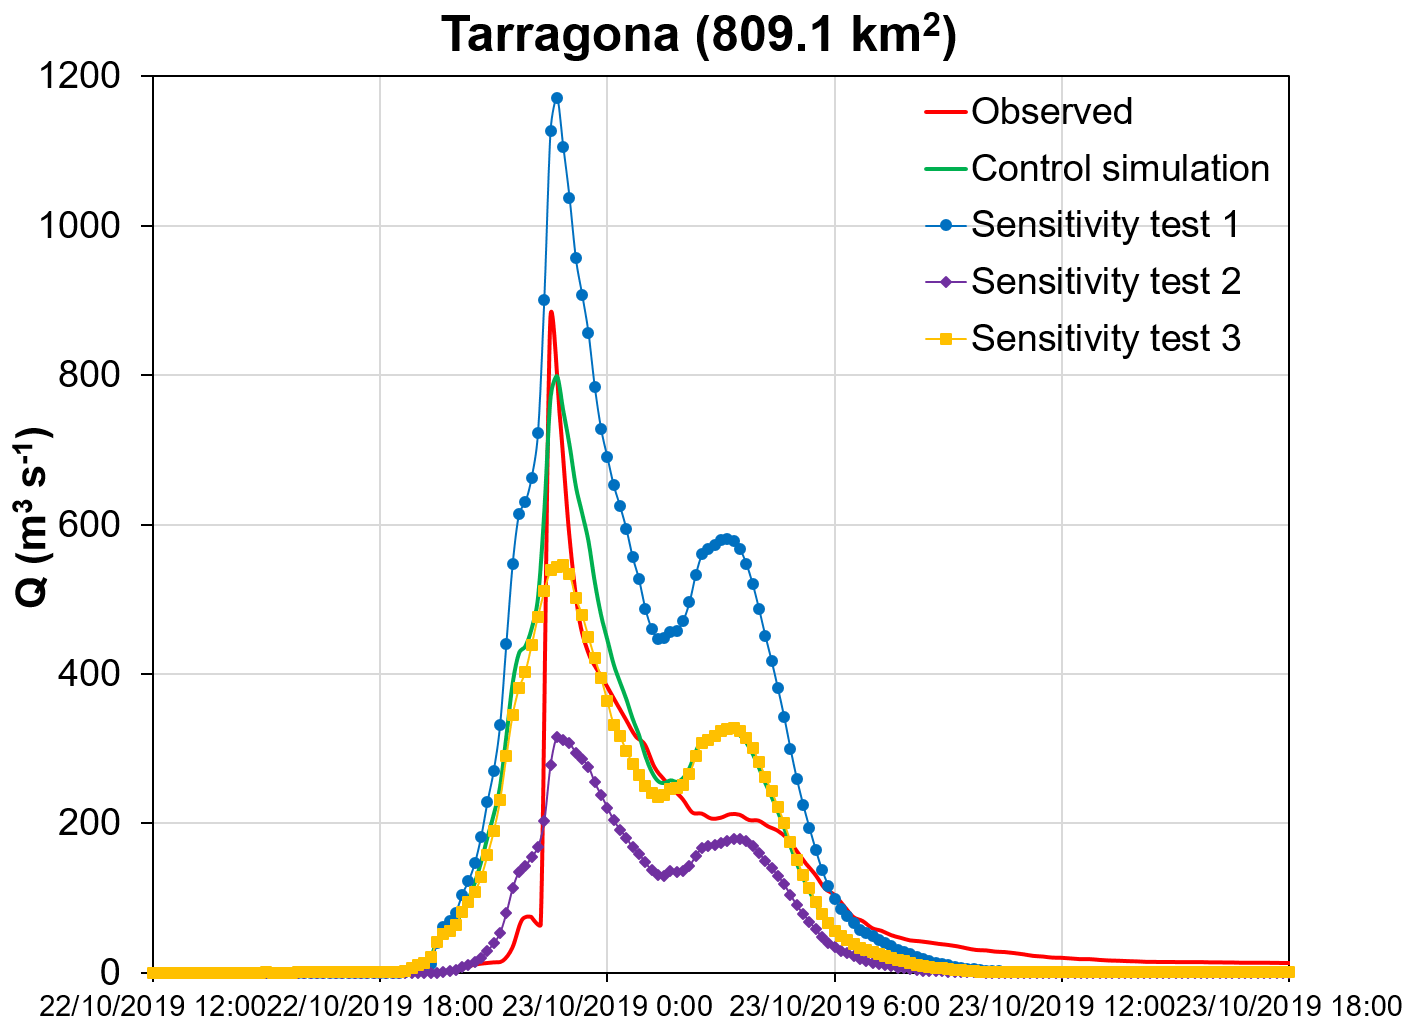
Figure 11Observed and radar-driven runoff simulations for the control and sensitivity test experiments and the 22 October flash flood at the Tarragona flow gauge in the Francolí basin.
This flash flood was primarily the result of the combination of a high precipitation volume, alleviating the acute soil water deficit, and extreme rainfall intensities that overwhelmed the reduced soil infiltrability. These findings suggest that runoff triggering was intimately connected to the spatial and temporal variability in the heaviest precipitation rates. That is, the acute infiltration–excess runoff generation was relatively short-lived, as the recession limb of the flood decreased very fast after the peak discharge. In fact, it took just 1 h for the flow to recede to 50 % of the maximum peak, which corresponds to the temporal span of the heaviest rainfall period (Fig. 10). The presence of a simulated secondary maximum peak discharge that was larger than observed in response to the last rainy period would suggest that losses persisted even after the onset of the catastrophic flash flood. In addition, the fast decrease in the recession limb suggests a relatively minor subsurface flow contribution to the event from the karst region of the Brugent tributary. This karst area is limited in extent and experienced less impact from heavy rainfall. Therefore, it appears that much of the surface runoff infiltrated quickly and incorporated to the deep aquifers, not contributing to a relatively rapid flow through fractures and conduits before discharge via springs and/or gaining streams into the Brugent River. However, these flood-generating mechanisms cannot be disregarded in basins mainly situated over karst formations. Herman et al. (2008), De Waele et al. (2010), Zanon et al. (2010), and Jourde et al. (2014), among others, have reported significant contributions of karst to discharge and flow dynamics during extreme flash flooding. In this regard, Gutiérrez et al. (2014) provide a comprehensive review addressing this issue.
5.1 Catchment response times
Field data and the control hydrological simulation support the observation that the Francolí basin experienced paroxysmal runoff and dynamic processes, characteristic of extreme flooding. According to the control simulation, the catchment-area average hillslope flow velocity was 0.25 m s−1, while field estimates point out a channel average flow velocity of 4.5 m s−1 (Tables 1 and 2). These high superficial flow velocities were primarily a result of the steep hillslopes and river beds in the upper catchment. In addition, several studies have indicated that during extreme flash flooding, large amounts of sheet flow generated on the hillslopes can concentrate in previously unchannelized areas, leading to increased water velocity (Smith et al., 2002; Borga et al., 2007). In this event, it seems that the extensive vegetation cover in the upper Francolí watershed contributed to slowing down the overland flow by increasing surface roughness and providing resistance to flow. Previous studies examining similar extreme flash floods in mountainous catchments of Mediterranean Spain have estimated hillslope velocities were between 0.35 and 0.40 m s−1 (Lorenzo-Lacruz et al., 2019; Amengual et al., 2022).
Undoubtedly, people responsible for risk management must cope with unusually short lead times when confronted with these sudden natural hazards in Mediterranean Spain. It is of great interest to quantify the hydrological response times across drainage scales for the paradigmatic 22 October 2019 flash flood and to compare them with the timing of social responses at different spatial scales. Comparing both response times could assist in developing more effective strategies for flood forecasting, early warning systems, and emergency response planning.
The catchment response time is influenced by drainage extent, runoff generation, and hillslope and channel network routing. Lag time is a useful measure for characterizing basin dynamics, and it can be defined as the temporal difference between the centre of mass of the rainfall hyetograph (i.e. the rainfall centroid) and the timing of peak discharge (Smith et al., 2000; Creutin et al., 2009). Lag times are computed using observations, post-flood field estimates, and the hydrological control simulation. The rainfall hyetographs are computed for each drainage area enclosed by the 17 control river sections in the hydrological model. To provide a reference, the lag times for the 22 October 2019 event are compared to the power-law relationships established by Marchi et al. (2010) in their study on flash flood features across Europe (Fig. 12). These authors empirically derived the following envelope curves, characterizing the lower limit of lag time TL (in h) versus basin area A (in km2):
Lag times were less than 2 h for basin areas up to 50 km2, 2.5–3 h for drainage extents ranging from 50 and 350 km2, and 3–3.5 h for catchment extensions between 375–810 km2 (Fig. 12). Interestingly, lag times feature a relative constant value of roughly 1.5 h for basin areas less than 15 km2. Similarly, the response times remain relatively steady at about 1.8 h for drainage extents between 15 and 40 km2. These outcomes suggest that these drainage areas experienced a similar rainfall severity and duration, resulting in comparable times to peak. Another noteworthy observation is the contrasting impact of the increasing drainage area on lag time. Basin extents larger than 350 km2 are near the lower limit of the envelope curve, while lag times for drainage areas smaller than 350 km2 are well above the lower envelope bound (Fig. 12).
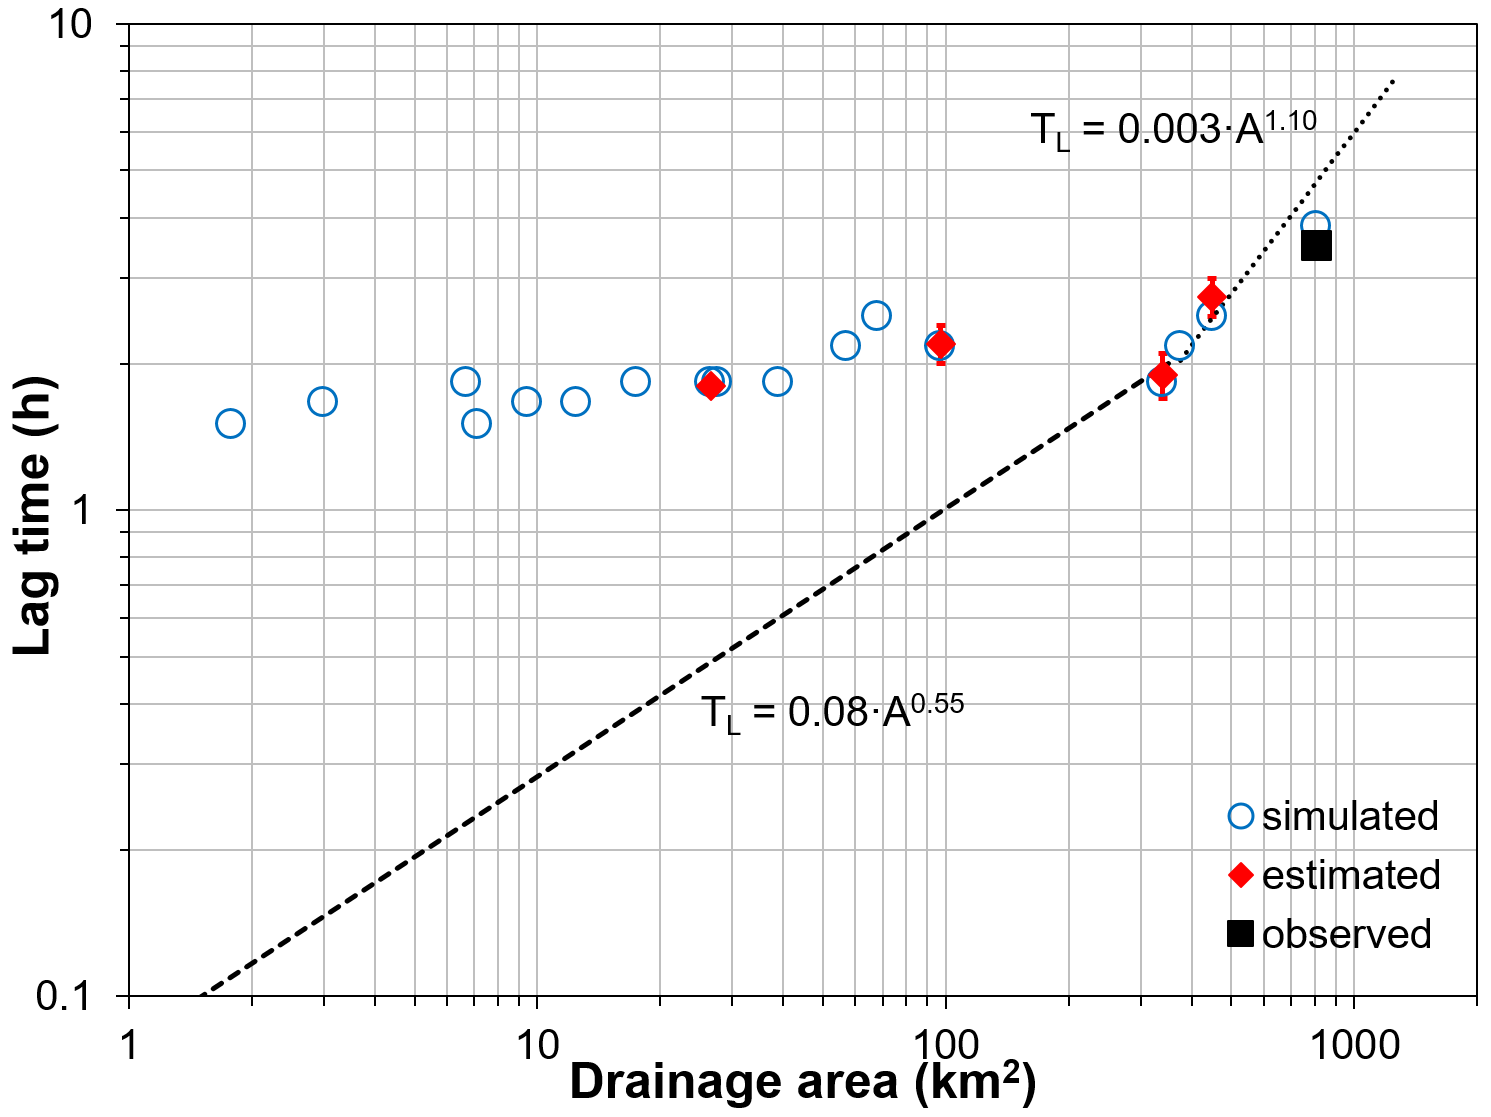
Figure 12Lag time versus drainage area for the 22 October 2019 flash flood event in the Francolí basin. Vertical bars represent uncertainties in the estimated lag times derived from the post-event field campaign. Also shown are the power-law relationships after Marchi et al. (2010). Note that the terms “observed”, “estimated”, or “simulated” lag time indicate whether the lag time has been computed from the stream-gauge measurements at the Tarragona river section, the post-event field estimations at the indicated river sections, or the hydrological simulation, respectively.
This behaviour can be attributed to the relatively delayed basin response to precipitation at small drainage scales due to the large soil moisture replenishment and the effect of runoff threshold exceedance. The lower envelope limit of lag time for watersheds smaller than 350 km2 is determined by the occurrence of flash flooding in continental Europe (Marchi et al., 2010). According to these authors, these natural hazards unfold during the prevalent regime of short-duration and low-amount rainfall events typically associated with summer storms and normal to wet initial soil conditions. Soils that are closer to saturation exhibit a faster response to precipitation than very dry soils, resulting in shorter lag times at small scales. Nevertheless, the mean residence time strongly relies on other factors: the distance between the catchment outlet and the geometrical centre of mass of the event runoff and the flow velocity (Woods and Sivapalan, 1999). The response times of the 22 October 2019 event for drainage sizes larger than 350 km2 were strongly influenced by the collapse of a wood debris jam at a bridge between the towns of Espluga and Montblanc. According to Martín-Vide et al. (2023), the sudden release resulted in a surge that travelled downstream – while attenuating – at a velocity of 10.2 m s−1. The exceptionally high channel velocity in this river reach led to a sharp transition in lag time with increasing drainage size. As a result, the lag times for drainage areas larger than 350 km2 lie on the lower limit of the envelope curve (Table 1; Fig. 12).
5.2 Social dynamics
5.2.1 Risk management, human response, and aftermath
Creutin et al. (2009) categorized the management activities before flash flooding into three different types of actions: information, organization, and protection. The information step involves collecting data and ensuring its quality and relevance through comparison with other inputs and involving several stakeholders. This phase initializes the warning cycle and aims to protect inhabitants and material goods through situation assessment. The organization stage synthesizes and analyses the gathered information and leads to the implementation of structured responses in the form of pre-established defence plans. This step sets the stage for the subsequent protection phase, which concludes the cycle. The protection stage involves the deployment of preventive safety measures. These authors also categorized human responses into three distinct groups, based on the scale and nature of the social group involved: individual, communal, and institutional. The term “individual” relates specifically to a single person or a small social entity, such as a family. The term “communal” is applicable to small groups of people, which may vary in organization, aimed at addressing emergencies. Examples include neighbourhood groups, volunteer associations, and the population of small villages. “Institutional” refers to public organizations, encompassing civil protection services, regional meteorological offices, or water management departments. For the case under study, Tables 6 and 7 show the types of management, actions, and agents involved. Figure 13 provides a summary of the specific social response in the county of Conca de Barberà, while Fig. 14 relates the catchment dynamics with the institutional spatial and temporal scales over the affected municipalities and Catalonia. Recall that the counties along the Francolí River are Garrigues, Conca de Barberà, Alt Camp, and Tarragonès, from up- to downstream (Fig. 1).
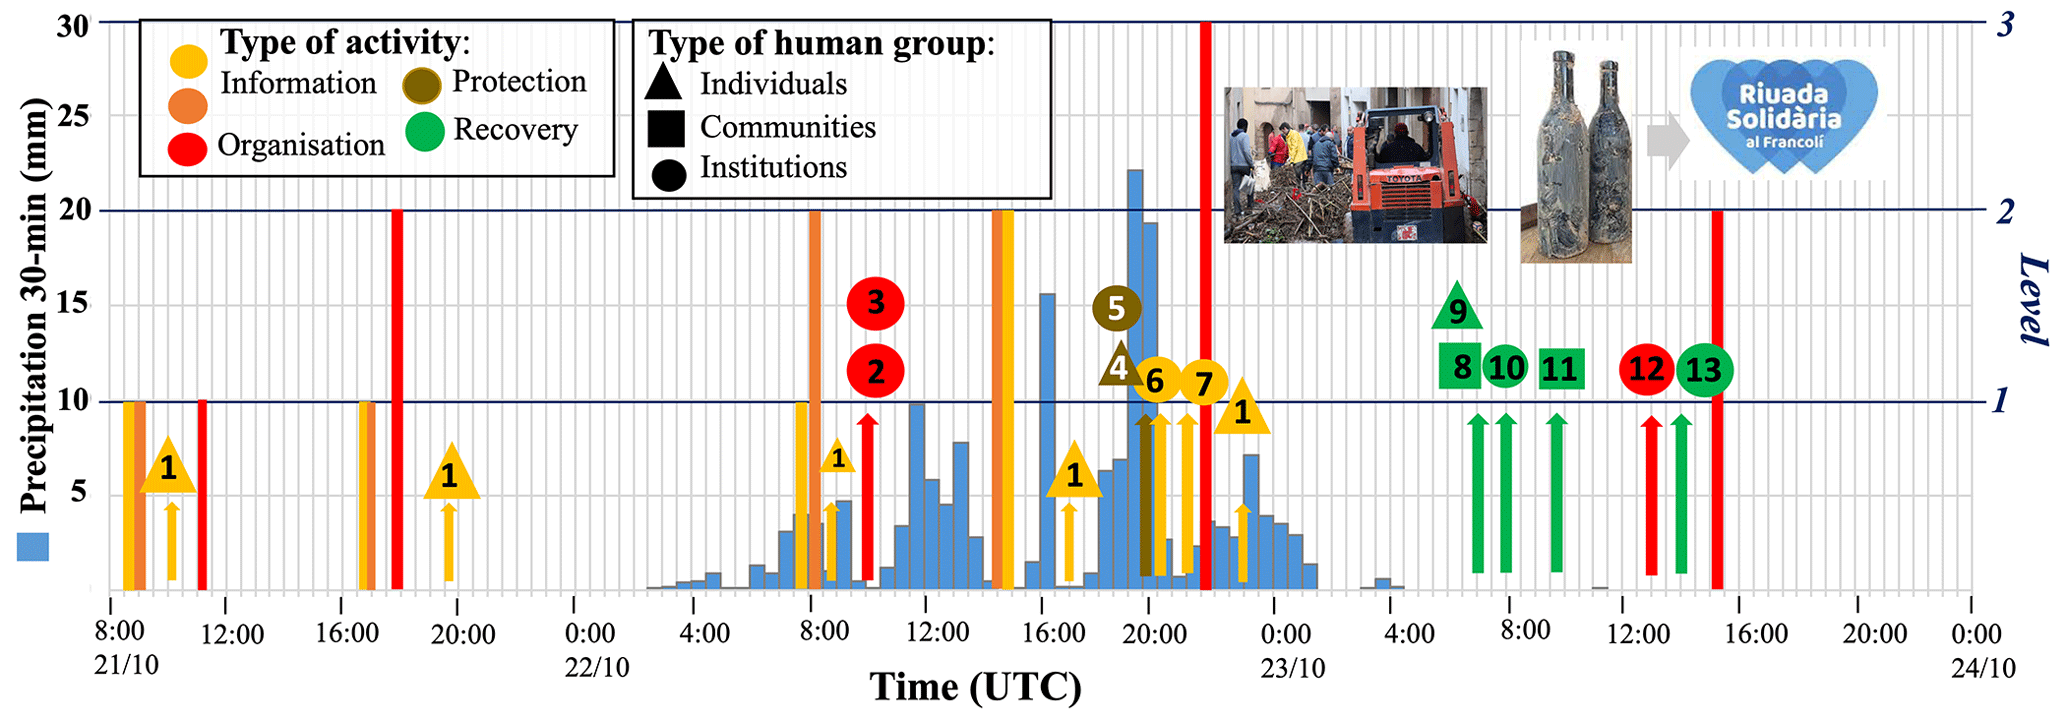
Figure 13Timeline of warnings issued by the Catalan Meteorological Service in the county of Conca de Barberà from 21 October at 08:00 UTC to 24 October at 00:00 UTC. Light- and dark-orange bars denote the accumulated precipitation and rainfall rate, respectively. On the right vertical axis, levels 1, 2, and 3 indicate moderate, high, and very high meteorological risk assessments by the Catalan Meteorological Service for these bars. The progression of activation phases in the Flood Management Plan of Catalonia is illustrated by the red bars. In this case, levels 1, 2, and 3 on the right vertical axis correspond to the pre-alert, alert, and emergency stages, respectively. Social actions are also indicated, with colour representing management activities and shape indicating human responses. The associated numbers align with specific actions detailed in Table 7. Additionally, the background vertical bars in blue showcase the evolution of 30 min rainfall accumulations in Espluga de Francolí.
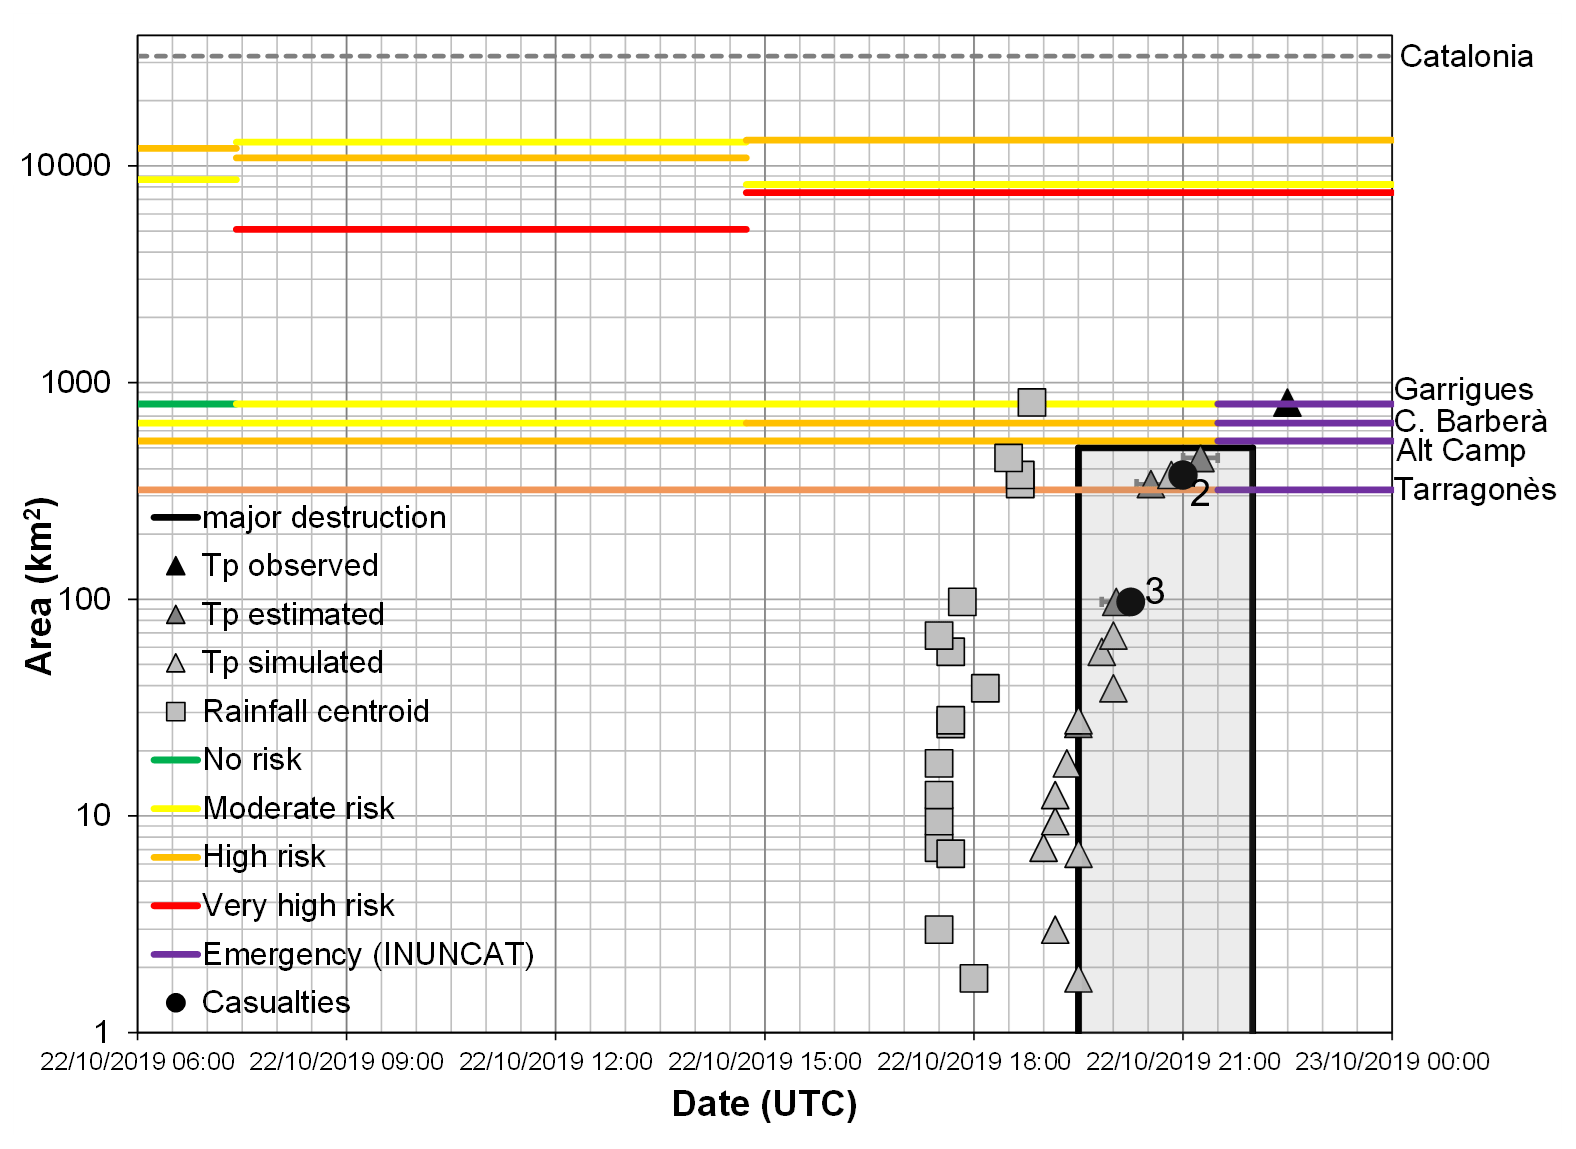
Figure 14Catchment and warning spatial and temporal scales during the catastrophic flash flood of the Francolí River on 22 October 2019. The number of casualties, timing, and extent of the most devastating period of destruction according to witnesses (grey-shaded area in the rectangle surrounded by thick black lines) are also indicated. Triangles in varying shades of grey represent observed, estimated, and simulated times of the peak discharges (Tp). Uncertainties in the estimated times to peak based on the post-event field campaign are shown as horizontal bars. Rainfall centroid refers to the time of the centre of mass of the rainfall hyetograph. The coloured lines above the horizontal lines of the municipalities crossed by the Francolí River correspond to the total spatial extension of the risk assessment. The dashed grey line denotes the whole spatial extension of Catalonia. Risk assessment and associated colour codes can be found in Table 6.
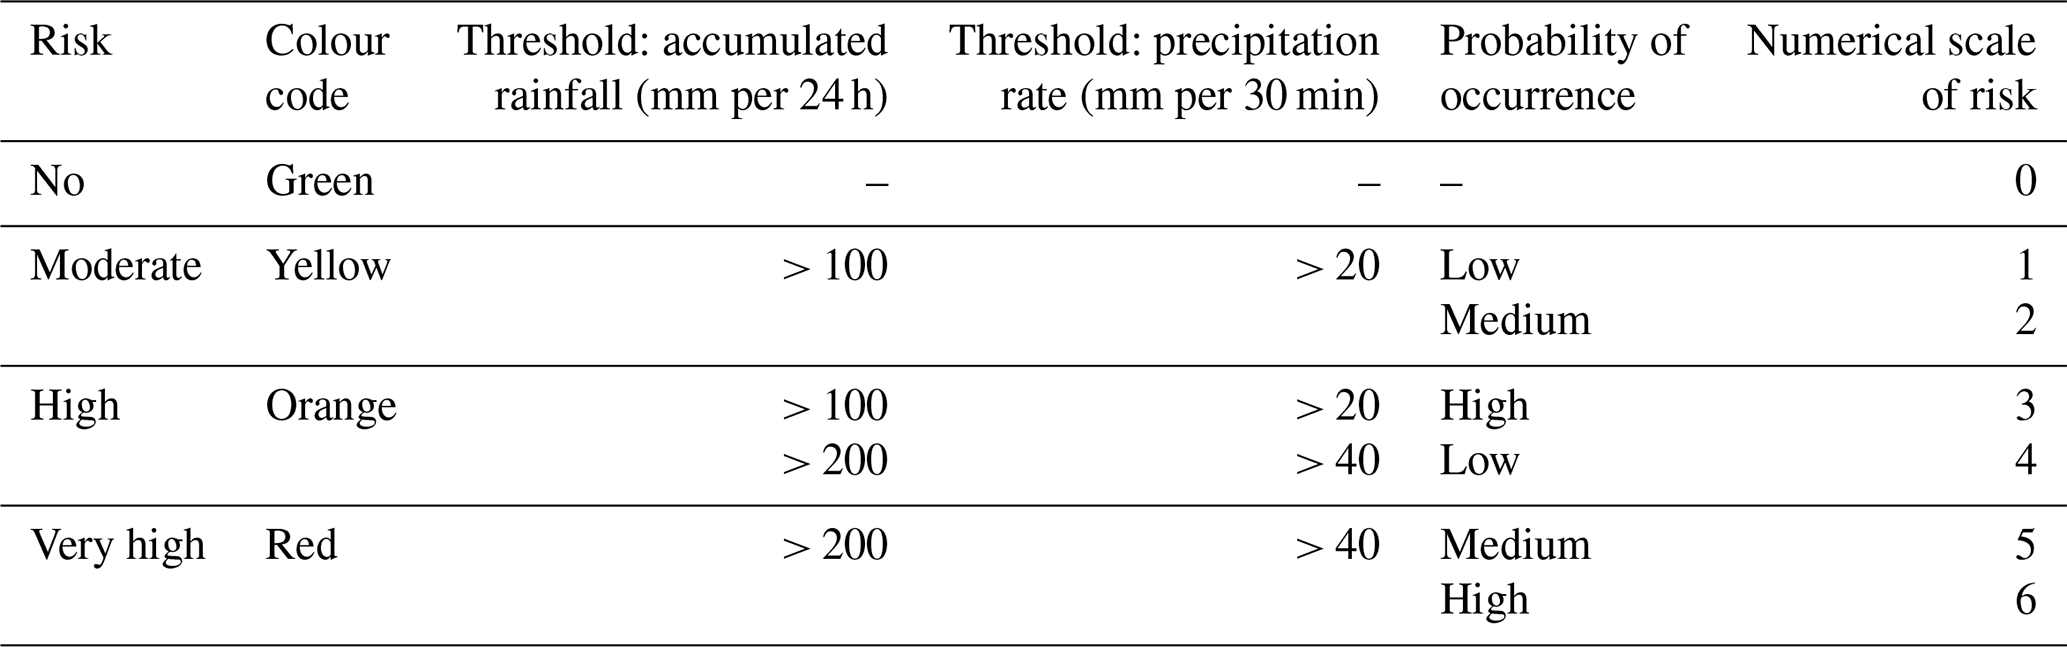
The information stage started on 21 October in response to forecasts of heavy rain, strong wind, and sea waves by the SMC. The regional meteorological office issued a warning, indicating a high probability of rainfall exceeding 100 mm in 24 h, with certain areas expected to experience up to 200 mm, as well as intense rain of 20 mm within a 30 min interval. The SMC assigned the warning colour code as orange (Table 6; i.e. level 2 in Fig. 13) for the majority of the coastal counties in Catalonia, encompassing an area exceeding 12 000 km2. The precoastal administrative divisions were issued a yellow alert (i.e. level 1 in Fig. 13), covering a spatial extent slightly over 8600 km2. The organizational step began around noon on the same day, when the civil protection service activated the pre-alert phase (i.e. level 1 in Fig. 13) of the Flood Management Plan of Catalonia (Pla especial d’emergències per inundacions de Catalunya, INUNCAT). During this phase, the civil protection service notifies local and regional administrations, broadcasts informatory and advisory warnings through the media and social networks, and coordinates the emergency response teams. The civil protection service shared a tweet emphasizing the following specific recommendations for individuals to take preventive actions: (i) drive primarily on main routes and highways; (ii) reduce speed and maintain safe distances; and (iii) avoid crossing any rivers, streams, or flooded areas.
Table 6Risk assessment and alert issuance according to the SMC.
On the afternoon of 21 October, the risk management plan transitioned to the organization stage, as indicated by the red colour in Fig. 13. The INUNCAT plan was upgraded to the alert level, denoted as level 2 in Fig. 13. This phase entails systematic and preventive actions executed by relevant local and regional administrations. The alert phase of INUNCAT usually continues as long as the situation can be effectively managed with the existing resources of the civil protection service, and the impact on the population is either non-existent or reduced. Throughout the day, the population was mainly informed from television (Fig. 13). Therefore, the institutional response in terms of the organization–protection–prevention cycle started approximately 30 to 24 h before the flow peak, in line with previous findings by Creutin et al. (2009).
During the alert phase of INUNCAT, the SMC carries out uninterrupted weather surveillance and maintains continuous communication with municipal stakeholders to monitor streamflow, assess traffic conditions, and inform the population. On 22 October, the SMC continuously updated alerts due to the forecast of a medium to high probability of rainfall surpassing 200 mm within a 24 h period. Consequently, the INUNCAT technical committee was convened in Barcelona and some municipal emergency plans were activated. With respect to Conca de Barberà, the warning for rain intensity shifted to orange, while the colour code for rainfall amounts within 24 h remained yellow during the morning (Figs. 13 and 14). In the early afternoon, the SMC expanded the orange and red (levels 2 and 3 in Fig. 13) warnings across Catalonia, spanning areas of more than 13 000 and 7500 km2, respectively. The yellow alert covered an extension of 8200 km2 (Fig. 14).
The counties along the Francolí River maintained a low probability of exceeding 200 mm of rainfall within a 24 h period. In fact, the county of Garrigues remained under the yellow alert throughout the day, while the other administrative divisions were under an orange code (Fig. 14). The SMC warning levels did not reach red in any of the counties crossed by the Francolí River, even though the corresponding thresholds were exceeded (Table 6). Heavy rains and power outages prompted the population to adopt individual self-protection measures, such as returning home or moving to higher floors (Table 7; Fig. 13), despite the fact that they had not been officially notified by institutions advising against approaching the affected areas until the end of the day.
Table 7Types of actions and classification during the course of the flash flood in the county of Conca de Barberà from 21 October 2019 at 08:00 UTC to 24 October 2019 at 00:00 UTC. The colour criteria are the same as those shown in Fig. 13.
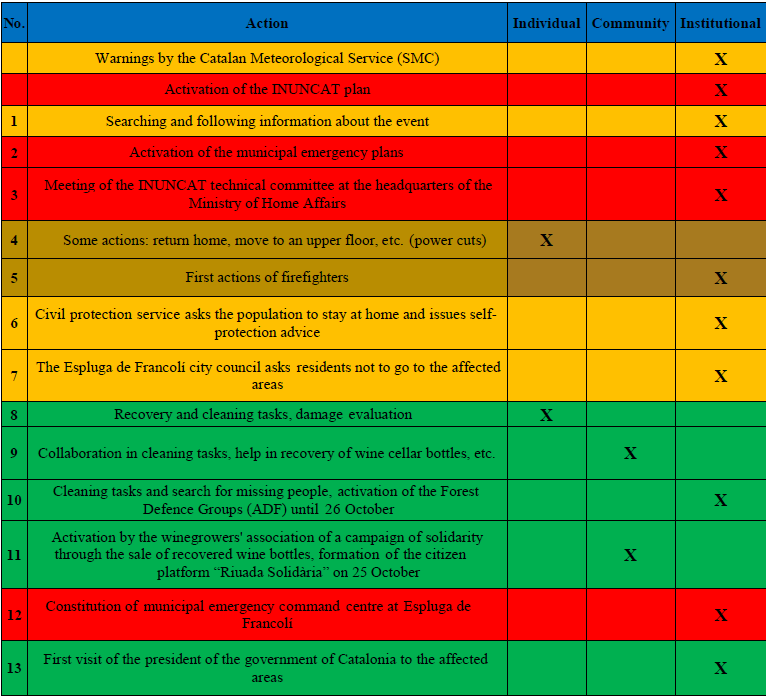
On 22 October, at 21:30 UTC, INUNCAT entered the emergency phase in response to the severe incidents developing inside the Francolí catchment. The emergency stage involves several key actions, including (i) the establishment of a central emergency committee; (ii) the immediate mobilization of all relevant response teams and resources for rescue, evacuation, and accommodation purposes; (iii) the determination of the extent of flooding; (iv) extensive communication with the media to provide updates on the flood situation, meteorological conditions, the status of the road network, and alternative routes; and (v) the dissemination of information to the population, including instructions and self-protection recommendations.
The overall episode caused seven fatalities in Catalonia, six of which occurred inside the Francolí basin. The flash flood affected numerous riverside towns such as Vimbodí, Poblet, Montblanc, and Vilaverd. Impacts were primarily due to the forceful flow of water carrying woody debris. One of the most affected municipalities was Espluga de Francolí. Some riverside buildings such as a wine cellar and a restaurant were completely destroyed. Fortunately, both establishments were unoccupied and closed to the public at the time of their destruction. Additionally, numerous residences, roads, bridges, railways, and other pieces of infrastructure suffered extensive damage. Flooding also affected lowlands; cultivated fields; and local manufacturing, especially the agrifood industry due to the destruction of crops and the loss of livestock. The CCS paid a total compensation of EUR 44 million for the insured damages across Catalonia, EUR 7.4 million of which corresponded to municipalities inside the Francolí watershed, representing 16.6 % of the total amount.
On 23 October, the emergency phase continued in the counties crossed by the Francolí River, due to the significant impacts that had been experienced (Fig. 14). The municipal emergency command centre was established in Espluga de Francolí, with the presence of the president of the government of Catalonia. Recovery tasks began, encompassing both institutional efforts, such as the search for missing persons, and communal actions, like cleaning debris. The Association of Winegrowers of Conca de Barberà DO (designation of origin) launched the first solidarity action to support the cellar that had been completely destroyed by the flash flood. This communal action culminated in the formation of a citizen platform called “Riuada Solidària” (i.e. “Solidarity Flood”; Table 7).
According to the insights from the Floodup Francolí campaign, residents remembered that the most devastating period of destruction took place between 19:30 and 22:00 UTC on 22 October. This perception was attributed to the force of the water and the obstruction of the bridge's arch caused by the woody debris carried by the flood in Espluga de Francolí. In this riverside town, a car carrying two elderly men and a driver along with his truck were swept away by the raging waters on this bridge. This incident took place between 20:00 and 20:30 UTC, resulting in the loss of all three occupants' lives. In Vilaverd, a bungalow was carried away, killing the two inhabitants around 21:00 UTC (Fig. 14). The sixth casualty was found in Pobla de Mafumet (basin extent of ca. 750 km2), a location further downstream in the drainage areas that experienced the most catastrophic consequences. The precise location and timing of this victim being swept away by the flood bore remain unknown.
5.2.2 Citizen perception
The citizen campaign has also allowed for a follow-up evaluation of the warning system. According to eyewitnesses, the peak of precipitation occurred on 22 October between 18:00 and 20:00 UTC. More than half of the respondents received the warnings, with television being the most frequently mentioned media, followed by the city council and social networks (including accounts of the civil protection services and the SMC). All respondents reported an easy understanding of the warnings. Regarding the recommendations they received, most participants remembered being advised to avoid rivers and displacements. In general, they felt very well informed, although 33 % of respondents indicated feeling uninformed. When asked about their understanding of the probability classification and warnings provided by the SMC (Table 6), 60 % expressed a lack of comprehension. While over half of the participants considered the episode as exceptional, stating that “they had never witnessed such severe floods before”, a significant majority (66 %) did not perceive any threat to their homes or properties. Furthermore, none of the participants reported feeling endangered in terms of their personal safety. These personal impressions align with previous findings by Creutin et al. (2009), who stated that rising water levels in rivers are the primary trigger for individual and community organization and protection actions on scales smaller than 100 km2, rather than the information provided by public entities. Institutional actions tend to apply at administrative scales of ca. 800 km2 on average over Catalonia.
6.1 Physical factors
As pointed out by Doswell et al. (1998), HPEs in the western Mediterranean region typically occur downstream of a significant cyclone aloft, although important structural and evolutionary differences are found among different cases. These HPEs usually occur in the autumn, since the Mediterranean Sea surface temperatures are still high from the summer heating, while the onset of autumn increases the chances for strong synoptic forcing. At low levels, the advection of warm and moist Mediterranean air frequently interacts with local orography to produce long-lasting heavy rainfall. The 22 October 2019 HPE also developed in the overlapping area between the forward flank of an upper-level anomaly and a lower-level warm and moist easterly jet with a large course over the Mediterranean Sea. These factors are common to other flash-flood-producing HPE episodes experienced in the Spanish Mediterranean region (Amengual et al., 2015; Hermoso et al., 2021).
The flash-flood-producing HPE was the result of low-level and highly unstable air fed by a continuous moisture supply and ascending rapidly through local orographic lifting. The result was disproportionate rainfall rates and accumulations, mainly concentrated in the north-western headwaters of the Francolí catchment. Local orography emerges, once again, as the differential feature leading to devastating flash floods in the western Mediterranean region (Gaume et al., 2004; Delrieu et al., 2005; Borga et al., 2007; Zanon et al., 2010; Amengual et al., 2007, 2017; Martinotti et al., 2017). The spatial concentration in rainfall within the Francolí catchment resulted in extreme flooding at drainage scales of about 100 km2. The consequences included important geomorphological changes such as stream widening at the headwaters and a woody debris flood. The flood consisted essentially of extreme streamflow with large wood debris that clogged bridges and propagated the catastrophic impacts downstream (Martín-Vide et al., 2023). As a consequence of the limited spatial extent of the extreme rainfall rates and amounts that mainly affected a densely forested and relatively inhabited mountainous area, most of the fatalities occurred in relatively large drainage scales, ranging from 100 to 400 km2. Other studies of similar catastrophic events in the western Mediterranean region show that most of flash-flood-related fatalities occur at smaller basin scales. For instance, Ruin et al. (2008) reported that half of the 23 fatalities during the 8–9 September 2002 episode occurred in drainage areas of around 10 km2. And the 13 fatalities during the 9 October 2018 catastrophic flash flood in Mallorca, Spain, were in basins of less than 25 km2 (Lorenzo-Lacruz et al., 2019).
Large soil retention capabilities strongly modulated catchment response, dampening flood peak and runoff volume with respect to rainfall amount, as confirmed by the first sensitivity test. These large abstractions were associated with the exceptionally low initial soil moisture content and with the recharge of deep aquifers through infiltration, percolation, and transmission losses along the river beds. This feature in catchment response has also been documented in other catastrophic flash floods (Smith et al., 1996; Martín-Vide et al., 1999; Camarasa-Belmonte and Beltrán Segura, 2001; Gaume et al., 2003; Delrieu et al., 2005; Borga et al., 2007; Zanon et al., 2010; Vennari et al., 2016; Amengual et al., 2017; Smith et al., 2019; Amengual, 2022). The second sensitivity test has highlighted the important role of the early precipitation stage by decreasing infiltration rates. This finding would support the hypothesis that until runoff thresholds were exceeded, massive generation of infiltration–excess runoff was not triggered, in line with previous findings by Gaume et al. (2004), Borga et al. (2007), and Amengual (2022) when examining catastrophic flooding in the western Mediterranean. The third sensitivity test has illustrated how rainfall variability during the heaviest precipitation period exacerbated the magnitude of the flood peak and modulated the flashy hydrograph shape. These outcomes align with previous findings by Castillo et al. (2003) when studying the role of antecedent soil water content in the runoff response of semi-arid catchments in Mediterranean Spain. These authors found that initial soil water content strongly controls runoff generation for low to medium rainfall rates. On the contrary, hydrological response is more uniform and rather independent of initial conditions when infiltration–excess runoff generation prevails under heavy precipitation rates.
The relative delay in runoff triggering resulted in a comparatively long hydrological response for the drainage areas affected by the heaviest rainfall rates and amounts. This threshold-type hydrological behaviour led to a delay, but it was then followed by sudden and massive runoff production. This delay in runoff triggering with very dry initial soils has been observed in other catastrophic flash floods across the western Mediterranean region (Gaume et al., 2004; Borga et al., 2007; Amengual et al., 2022) and may lead to improvements in management actions before these natural hazards, as will be discussed in the conclusions.
6.2 Social protocols and potential areas for improving preparedness
The catastrophic effects of the 22 October 2019 flash flood distributed over a spatial extent of ca. 500 km2 and a time span of less than 3 h. The institutional organization–protection–prevention cycle developed at the spatial and temporal scales typically dominated by meteorological factors. However, hydrometeorological monitoring and forecasting in such small drainage areas should rely on hydrologic and hydraulic models driven by high-resolution reliable rainfall fields, providing warnings with the shortest lead times possible after the onset of the flash-flood-producing HPEs. But errors in the initial and boundary atmospheric conditions, uncertainties in mesoscale model parameterizations, and the complex and nonlinear nature of the processes involved in developing deep moist convection hinder the precise forecasting of the location, intensity, and timing of quasi-stationary HPEs triggering flash floods. In addition, small-scale extreme weather phenomena that initiate over the sea typically have significantly lower numerical predictability. Despite these challenges, three out of the four municipalities crossed by the Francolí River were under a high risk alert before 15:00 UTC on 22 October. The remaining administrative unit was classified as being under moderate danger.
Given the inherent limitations in predicting storm-scale features, operational forecasting strategies can benefit from the use of advanced short-range, convection-permitting ensemble prediction systems. In particular, producing disturbances at the scales explicitly resolved by convection-permitting NWP models has become paramount in addressing the rapid growth of errors associated with convective and mesoscale processes. Furthermore, there is a need to examine ensemble generation strategies that sample uncertainties associated with the formulations of physical processes using stochastic techniques in generating diversity. These systems combined with real-time data assimilation techniques and hydrological modelling may provide additional guidance in anticipating flash flood situations over the Spanish Mediterranean region. The use of advanced hydrometeorological ensemble prediction systems can be complemented by real-time and reliable QPE-driven hydrologic–hydraulic forecasts. The implementation and application of all these techniques arise as promising future research areas to mitigate catastrophic flash flood impacts in the Spanish Mediterranean region.
Furthermore, the delay in runoff generation might provide an opportunity to expand the automatic observational networks to small basin scales. By incorporating real-time observations from rain and stream gauges located in the headwaters of mountainous catchments, it could become possible to enhance pre-existing alert systems and improve early warning capabilities. For instance, sirens could be installed along the river valley towns and integrated into the alert systems. These alarms could be activated on the basis of monitoring predetermined rainfall threshold exceedance and sudden increases in discharge. The blending of all these approaches could provide the civil protection service with additional tools to implement anticipatory measures on the spatial and temporal scales over which flash floods develop.
It also seems urgent to revise urban planning and the management of flood-prone areas, as well as to enhance social awareness of the danger associated with flash flooding. Considering the severe aftermath of the flash flood, the citizen campaign corroborates the need for the population to improve their perception of the level of risk they may face. The very low streamflow throughout much of the year directly contributes to the limited awareness among local communities regarding the possibility of experiencing catastrophic flash floods. The population may be educated about the dormant state of rivers in arid and semi-arid basins, along with their paroxysmal dynamics to extreme and prolonged rainfall, as well as on how to interpret probabilistic alerts and understand the inherent scales and uncertainties related to weather forecasting. Furthermore, it might become essential to provide further guidance on how to act appropriately when facing different kinds of natural hazards. Initiatives such as awareness campaigns could be carried out in schools, in between prime-time radio and television programmes, and by involving media influencers on various social networks. In addition, text messages could be sent to mobile phones in areas under alert, informing the population about the dangerous weather situation and providing recommendations to follow. All these efforts could help individuals to make informed decisions and take necessary actions to protect themselves from natural hazards.
The main observations from this study are the following.
-
The formation of a slow-moving surface cyclone led to a set of key mesoscale factors that promoted the formation of a convective train. Specifically, the persistent impinging of a south-easterly Mediterranean flow advected warm and moist air towards the Catalonian precoastal topography. Local orography played a paramount role in organizing the mesoscale flow over Catalonia and acted as a convection-triggering mechanism. The continuous latent heat flux from the Mediterranean Sea moistened the low troposphere, enhancing convective instability and increasing rainfall efficiency.
-
Extreme rainfall was markedly influenced by local orography: values in excess of 200 mm focussed on the north-western mountain ridges of the upper Francolí basin, impacting an area of ca. 100 km2. The exceedance drainage areas above a selected set of precipitation thresholds exhibited a robust logarithmic relationship for this particular episode. Recognizing the spatial scales of rainfall organization could serve as a valuable predictive indicator for identifying drainage scales most susceptible to sudden infiltration–excess runoff generation. This behaviour was also observed for 10 min rainfall rates exceeding 20 or 50 mm h−1 over drainage scales smaller than 100 km2.
-
The very dry initial soil conditions had a significant impact on the catchment response, mitigating both the flood peak and runoff volume with respect to the rainfall amount. The substantial soil moisture deficit promoted a marked nonlinearity in basin response to precipitation rates and amounts. The antecedent precipitation before the most intense rainfall period was also instrumental: while it did not result in runoff, it did moisten the topsoil and decrease infiltration rates, favouring the exceedance of runoff thresholds. The subsequent extreme precipitation intensities and amounts led to acute infiltration–excess runoff rates: rainfall variability modulated the very flashy and short-lived extreme basin response.
-
The relative delay in runoff onset resulted in hydrological responses that were comparatively long for basin scales up to 100 km2: lag times were well above the envelope curve characterizing the minimum lag times typically observed for flash floods in Europe. The threshold-type hydrological behaviour resulted in a delayed but subsequently sudden and substantial runoff production. The ensuing flood bore routed very quickly, carrying a large amount of woody and vegetation debris. The interaction of debris with several bridges along the river strongly impacted the flood velocity. As consequence, a stark transition in lag time occurred for basin scales larger than 350 km2, lying on the lower bound of the envelope curve.
-
The institutional cycle of organization, protection, and prevention developed at the spatial and temporal scales typically dominated by meteorological factors. The SMC issued a risk warning for heavy rainfall at the county scale up to 30 h before the tragic flash flood occurred. Concurrently, the civil protection service activated the INUNCAT plan and issued a warning with a set of recommendations for the population. Continuous updates to the warnings for municipalities at very high risk of heavy rainfall were disseminated through traditional media channels and social networks.
-
The citizen science campaign confirms the effectiveness of the warnings disseminated by the SMC and civil protection service in reaching a significant portion of the population. However, one-third of the respondents expressed a lack of adequate information, and more than half were unfamiliar with the meanings associated with the different warning levels. Furthermore, two-thirds of the participants did not perceive any threat to their homes, premises, or properties, and none of them felt their lives were at risk. Given the severe consequences of the flash flood, this information corroborates the need for the population to improve their perception of the level of risk they may face before extreme flash flooding.
The primary data used in this study (stream-gauge, rain-gauge, and weather radar data) can be obtained upon request to the Catalan Water Agency, the Catalan Meteorological Service, and the Spanish State Meteorological Agency. Post-event data and modelling results can be obtained upon request to the authors.
AA, RR, and MCL designed the research. AA drafted the paper. AA, RR, MCL, AH, and MLB performed the formal analysis and wrote, edited, and revised the paper. AA, RR, AH, and MLB created the figures.
At least one of the (co-)authors is a member of the editorial board of Natural Hazards and Earth System Sciences. The peer-review process was guided by an independent editor, and the authors also have no other competing interests to declare.
Publisher’s note: Copernicus Publications remains neutral with regard to jurisdictional claims made in the text, published maps, institutional affiliations, or any other geographical representation in this paper. While Copernicus Publications makes every effort to include appropriate place names, the final responsibility lies with the authors.
Mario Parise, a scientific editor of NHESS, and three anonymous reviewers are sincerely acknowledged for their time and valuable comments, which contributed to enhancing the quality of this paper. The authors are grateful to AEMET, especially to Ramón Pascual and Gabriela Cuevas, for providing technical documentation and different meteorological observations related to this flash flood event. The authors are also grateful to Eduard Marimon from Meteoprades for supplying rainfall observations. The ACA and SMC are acknowledged for providing other necessary data for conducting this research.
This work has been sponsored by the Agencia Estatal de Investigación of the Ministerio de Ciencia, Innovación y Universidades through the TRAMPAS (grant no. PID2020-113036RB-I00/AEI/10.13039/501100011033) and C3RiskMed (grant no. PID2020-113638RB-C22/MICIN-AEI/10.13039/501100011033) research projects. The citizen campaign was supported by the AGORA project, funded by the ACA of the Generalitat de Catalunya, with significant support from the Museu de la Vida Rural de l'Espluga de Francolí.
This paper was edited by Mario Parise and reviewed by three anonymous referees.
Alpert, P. and Sholokhman, T. (Eds.): Factor Separation in the atmosphere: applications and future prospects, Cambridge University Press, ISBN 978-0521191739, 2011.
Amengual, A.: Hydrometeorological analysis of the 12 and 13 September 2019 widespread flash flooding in eastern Spain, Nat. Hazards Earth Syst. Sci., 22, 1159–1179, https://doi.org/10.5194/nhess-22-1159-2022, 2022.
Amengual, A., Romero, R., Gómez, M., Martín, A., and Alonso, S.: A hydrometeorological modeling study of a flash-flood event over Catalonia, Spain, J. Hydrometeorol., 8, 282–303, 2007.
Amengual, A., Homar, V., and Jaume, O.: Potential of a probabilistic hydrometeorological forecasting approach for the 28 September 2012 extreme flash flood in Murcia, Spain, Atmos. Res., 166, 10–23, 2015.
Amengual, A., Carrió, D. S., Ravazzani, G., and Homar, V.: A comparison of ensemble strategies for flash flood forecasting: The 12 october 2007 case study in Valencia, Spain, J. Hydrometeorol., 18, 1143–1166, 2017.
Arrufat, J. T.: Estudio hidrogeológico de la cuenca del Francolí. Cronología de las aguas subterráneas, Acta Geológica Hispánica, 7, 138–142, 1972.
Bailly-Comte, V., Jourde, H., and Pistre, S.: Conceptualization and classification of groundwater–surface water hydrodynamic interactions in karst watersheds, J. Hydrol. 376, 456–462, 2009.
Barettino, D. and Pujadas, J.: Programa I+D en Geología Ambiental. Estudio de avenidas en la cuenca alta del río Francolí (Tarragona), Mapas de peligrosidad por inundación, ITGE y Servei Geològic de Catalunya, 74 pp., https://info.igme.es/SidPDF%5C067000%5C056%5C67056_0001.pdf (last access: 25 June 2024), 1992.
Bodoque, J. M., Amérigo, M., Díez-Herrero, A., García, J. A., Cortés, B., Ballesteros-Cánovas, J. A., and Olcina, J.: Improvement of resilience of urban areas by integrating social perception in flash-flood risk management, J. Hydrol., 541, 665–676, 2016.
Beniston, M.: Trends in joint quantiles of temperature and precipitation in Europe since 1901 and projected for 2100, Geophys. Res. Lett., 36, L07707, https://doi.org/10.1029/2008GL037119, 2009.
Borga, M., Boscolo, P., Zanon, F., and Sangati, M.: Hydrometeorological analysis of the 29 August 2003 flash flood in the Eastern Italian Alps, J. Hydrometeorol., 8, 1049–1067, https://doi.org/10.1175/JHM593.1, 2007.
Bouilloud, L., Delrieu, G., Boudevillain, B., Borga, M., and Zanon, F.: Radar rainfall estimation for the post-event analysis of a Slovenian flash-flood case: application of the Mountain Reference Technique at C-band frequency, Hydrol. Earth Syst. Sci., 13, 1349–1360, https://doi.org/10.5194/hess-13-1349-2009, 2009.
Camarasa-Belmonte, A. M. and Beltrán Segura, F.: Flood events in Mediterranean ephemeral streams (ramblas) in Valencia region, Spain, Catena, 45, 229–249, https://doi.org/10.1016/S0341-8162(01)00146-1, 2001.
Castillo, V. M., Gomez-Plaza, A., and Martínez-Mena, M.: The role of antecedent soil water content in the runoff response of semiarid catchments: a simulation approach, J. Hydrol., 284, 114–130, 2003.
Chazarra-Bernabé, A., Flórez-García, E., Peraza-Sánchez, B., Tohá-Rebull, T., Lorenzo-Mariño, B., Criado-Pinto, E., Moreno- García, J. V., Romero-Fresneda, R., and Botery-Fullat, R.: Mapas climáticos de España (1981–2010) y ETo (1996–2016), Ministerio de Transición Ecológica, Agencia Estatal de Meteorología, Madrid, Spain, http://www.aemet.es/ (last access: 10 January 2024), 2018.
Cloke, H. L. and Pappenberger, F.: Ensemble flood forecasting: A review, J. Hydrol., 375, 613–626, 2009.
Cole, S. and R. Moore: Hydrological modelling using rain-gauge and radar-based estimators of areal rainfall, J. Hydrol., 358, 159–181, https://doi.org/10.1016/j.jhydrol.2008.05.025, 2008.
Cramer, W., Guiot, J., Fader, M., Garrabou, J., Gattuso, J.-P., Iglesias, A., Lange, M. A., Lionello, P., Llasat, M. C., Paz, S., Peñuelas, J., Snoussi, M., Toreti, A., Tsimplis, M. N., and Xoplaki, E.: Climate change and interconnected risks to sustainable development in the Mediterranean, Nat. Clim. Change, 8, 972–980, https://doi.org/10.1038/s41558-018-0299-2, 2018.
Creutin, J. D., Borga, M., Lutoff, C., Scolobig, A., Ruin, I., and Créton-Cazanave, L.: Catchment dynamics and social response during flash floods: the potential of radar rainfall monitoring for warning procedures, Meteorol. Appl., 16, 115–125, 2009.
Da Ros, D. and Borga, M.: Use of digital elevation model data for the derivation of the geomorphological instantaneous unit hydrograph, Hydrol. Process., 11, 13–33, https://doi.org/10.1002/(SICI)1099-1085(199701)11:1<13::AID-HYP400>3.0.CO;2-M, 1997.
De Waele, J., Martina, M. L. V., Sanna, L., Cabras, S., and Cossu, Q. A.: Flash flood hydrology in karstic terrain: Flumineddu Canyon, central-east Sardinia, Geomorphology, 120, 162–173, 2010.
Delrieu, G., Nicol, J., Yates, E., Kirstetter, P.-E., Creutin, J.-D., Anquetin, S., Obled, C., Saulnier, G.-M., Ducrocq, V., Gaume, E., Payrastre, O., Andrieu, H., Ayral, P.-A., Bouvier, C., Neppel, L., Livet, M., Lang, M., du-Châtelet, J.-P., Walpersdorf, A., and Wobrock, W.: The catastrophic flash-flood event of 8–9 September 2002 in the Gard Region, France: a first case study for the Cévennes–Vivarais Mediterranean Hydrometeorological Observatory, J. Hydrometeorol., 6, 34–52, 2005.
Doswell III, C. A., Brooks H., and Maddox, R.: Flash flood forecasting: An ingredient-based methodology, Weather Forecast., 11, 560–581, 1996.
Doswell III, C. A., Ramis, C., Romero, R., and Alonso, S.: A diagnostic study of three heavy precipitation episodes in the western Mediterranean region, Weather Forecast., 13, 102–124, 1998.
Diffenbaugh, N. S. and Giorgi, F.: Climate change hotspots in the CMIP5 global climate model ensemble, Climatic Change, 114, 813–822, https://doi.org/10.1007/s10584-012-0570-x, 2012.
Dudhia, J.: A non-hydrostatic version of the Penn State/NCAR mesoscale model: validation tests and simulation of an Atlantic cyclone and cold front, Mon. Weather Rev., 121, 1493–1513, 1993.
EEA: Corine Land Cover (CLC) 2018, Version 20b2, European Environment Agency, https://land.copernicus.eu/pan-european/corine-land-cover/clc2018 (last access: 25 June 2024), 2018.
Fulton, R., Breidenbach J., Seo D., Miller D., and O'Bannon T.: The WSR-88D rainfall algorithm, Weather Forecast., 13, 377–395, https://doi.org/10.1175/1520-0434(1998)013<0377:TWRA>2.0.CO;2, 1998.
Gaume, E., Livet, M., and Desbordes, M.: Study of the hydrological processes during the Avene river extraordinary flood (south of France): 6–7 October 1997, Phys. Chem. Earth, 28, 263–267, 2003.
Gaume, E., Livet, M., Desbordes, M., and Villeneuve, J. P.: Hydrological analysis of the river Aude, France, flash flood on 12 and 13 November 1999. J. Hydrol., 286, 135–154, 2004.
García-Herrera, R., Barropedro, D., Hernández, E., Paredes, D., Correoso, J. F., and Prieto, L.: The 2001 mesoscale convective systems over iberia and the Balearic Islands, Meteor. Atmos. Phys., 90, 225–243, https://doi.org/10.1007/s00703-005-0114-2, 2005.
Georgakakos, K. P.: On the design of national, real-time warning systems with capability for site-specific, flash-flood forecasts, B. Am. Meteorol. Soc., 67, 1233–1239, 1986.
Giannoni, F., Smith, J. A., Zhang, Y., and Roth, G.: Hydrologic modeling of extreme floods using radar rainfall estimates, Adv. Water Resour., 26, 195–203, https://doi.org/10.1016/S0309-1708(02)00091-X, 2003.
Gochis, D., Schumacher, R., Friedrich, K., Doesken, N., Kelsch, M., Sun, J., Ikeda, K., Lindsey, D., Wood, A., Dolan, B., Matrosov, S., Newman, A., Mahoney, K., Rutledge, S., Johnson, R., Kucera, P., Kennedy, P., Sempere-Torres, D., Steiner, M., Roberts, R., Wilson, J., Yu, W., Chandrasekar, V., Rasmussen, R., Anderson, A., and Brown, B.: The great Colorado flood of September 2013, B. Am. Meteorol. Soc., 96, 1461–1487, https://doi.org/10.1175/BAMS-D-13-00241.1, 2015.
Groisman, P. Y., Knight, R. W., Easterling, D. R., Karl, T. R., Hegerl, G. C., and Razuvaev, V. N.: Trends in intense precipitation in the climate record, J. Climate, 18, 1326–1350, 2005.
Grell, G., Dudhia J., and Stauffer, D. R.: A description of the fifth-generation of the Penn State/NCARmesoscalemodel (MM5), NCAR Tech.NCAR/TN-398+STR, https://doi.org/10.5065/D60Z716B, 1995.
Hapuarachchi, H. A. P., Wang, Q. J., and Pagano, T. C.: A review of advances in flash flood forecasting, Hydrol. Process., 25, 2771–2784, 2011.
Herman, H. K., Toran, L., and White, W. B.: Threshold events in spring discharge: evidence from sediment and continuous water level measurement, J. Hydrol., 351, 98–106, 2008.
Gunn, J.: Contributory area definition for groundwater source protection and hazard mitigation in carbonate aquifers, in: Natural and Anthropogenic Hazards in Karst Areas: Recognition, Analysis, and Mitigation, edited by: Parise, M. and Gunn, J. Geol. Soc. London, 279, 97–109, https://doi.org/10.1144/SP279.9, 2007.
Gutiérrez, F., Parise, M., De Waele, J., and Jourde, H.: A review on natural and human-induced geohazards and impacts in karst, Earth-Sci. Rev., 138, 61–88, 2014.
Hermoso, A., Homar, V., and Amengual, A.: The sequence of heavy precipitation and flash flooding of 12 and 13 September 2019 in eastern Spain. Part I: Mesoscale diagnostic and sensitivity analysis of precipitation, J. Hydrometeorol., 22, 1117–1138, 2021.
Hunter, S.: WSR-88D radar rainfall estimation: Capabilities, limitations and potential improvements, Natl. Wea. Dig., 20, 26–36, 1996.
Huntington, T. G.: Evidence for intensification of the global water cycle: review and synthesis, J. Hydrol., 319, 83–95, 2006.
IGME: Mapa geológico de la Península Ibérica, Baleares y Canarias a escala 1:1.000.000, Instituto Geológico y Minero de España, Instituto Tecnológico Geominero de España, http://info.igme.es/cartografiadigital/geologica/Geologicos1MMapa.aspx? Id5Geologico1000_(1994)#mapas (last access: 25 June 2024), 2010.
Javier, J. R. N., Smith, J. A., Meierdiercks, K. L., Baeck, M. L., and Miller, A. J.: Flash flood forecasting for small urban watersheds in the Baltimore metropolitan region, Weather Forecast., 22, 1331–1344, 2007.
Jourde, H., Lafare, A., Mazzilli, N., Belaud, G., Neppel, L., Doerfliger, N., and Cernesson, F.: Flash flood mitigation as a positive consequence of anthropogenic forcings on the groundwater resource in a karst catchment, Environ. Earth Sci., 71, 573–583, 2014.
Leveque, R. J.: Finite volume methods for hyperbolic problems, Cambridge University Press, 558 pp., https://doi.org/10.1017/CBO9780511791253, 2002.
Llasat, M. D. C., Rigo, T., and Barriendos, M.: The “Montserrat-2000” flash-flood event: a comparison with the floods that have occurred in the northeastern Iberian Peninsula since the 14th century, Int. J. Climatol., 23, 453–469, 2003.
Llasat, M. C., Llasat-Botija, M., Prat, M. A., Porcú, F., Price, C., Mugnai, A., Lagouvardos, K., Kotroni, V., Katsanos, D., Michaelides, S., Yair, S., Savvidou, K., and Nicolaides, K.: High impact floods and flash floods in Mediterranean countries: the flash preliminary database, Adv. Geosci., 23, 1–9, 2010.
Llasat-Botija, M., Llasat, M. C., Ruiz Navarro, S., and Fernández Lopez, C.: FLOOD-UP FRANCOLÍ, Retorn d'experiència collectiu de les inundacions d'octubre de 2019, VI Jornades sobre el Bosc de Poblet i Muntanyes de Prades, https://agora.ub.edu/wp-content/uploads/2022/07/Dossier1_AreaParticipacio_Floodup_Francoli.pdf (last access: 25 June 2024), 2022.
Lorenzo-Lacruz, J., Amengual, A., Garcia, C., Morán-Tejeda, E., Homar, V., Maimó-Far, A., Hermoso, A., Ramis, C., and Romero, R.: Hydro-meteorological reconstruction and geomorphological impact assessment of the October 2018 catastrophic flash flood at Sant Llorenç, Mallorca (Spain), Nat. Hazards Earth Syst. Sci., 19, 2597–2617, https://doi.org/10.5194/nhess-19-2597-2019, 2019.
Maidment, D. R.: Handbook of hydrology, Vol. 9780070, McGraw-Hill, New York, p. 397323, ISBN 0070397325, 1993.
Markowski, P. and Richardson, Y.: Mesoscale meteorology in midlatitudes, Wiley-Blackwell, 407 pp., https://doi.org/10.1002/9780470682104, 2010.
Marchi, L., Borga, M., Preciso, E., and Gaume, E.: Characterisation of selected extreme flash floods in Europe and implications for flood risk management, J. Hydrol., 394, 118–133, 2010.
Martín-Vide, J. P. and Llasat, M. C.: The 1962 flash flood in the Rubí stream (Barcelona, Spain), J. Hydrol., 566, 441–454, 2018.
Marquès, M., Bangash, R. F., Kumar, V., Sharp, R., and Schuhmacher, M.: The impact of climate change on water provision under a low flow regime: A case study of the ecosystems services in the Francoli river basin, J. Hazard. Mater., 263, 224–232, 2013.
Martín, A., Romero, R., Homar, V., De Luque, A., Alonso, S., Rigo, T., and Llasat, M. C.: Sensitivities of a flash flood event over Catalonia: a numerical analysis, Mon. Weather Rev., 135, 651–669, 2007.
Martín-Vide, J. P., Nierola, D., Bateman, A., Navarro, A., and Velasco, E.: Runoff and sediment transport in a torrential ephemeral stream of the Mediterranean coast, J. Hydrol., 225, 118–129, 1999.
Martín-Vide, J. P., Bateman, A., Berenguer, M. Ferrer-Boix, C., Amengual, A., Campillo, M., Corral, C., Llasat, M. C., Llasat-Botija, M., Gómez, S., Marín-Esteve, B., Prats-Puntí, A., Ruiz-Carulla, R., and Sosa-Pérez, R.: A flash flood with large woody debris clogged bridges. The 2019 event of Francolí River (NE Iberian Peninsula), J. Hydrol.-Regional Studies, 47, 101348, https://doi.org/10.1016/j.ejrh.2023.101348, 2023.
Martinotti, M. E., Pisano, L., Marchesini, I., Rossi, M., Peruccacci, S., Brunetti, M. T., Melillo, M., Amoruso, G., Loiacono, P., Vennari, C., Vessia, G., Trabace, M., Parise, M., and Guzzetti, F.: Landslides, floods and sinkholes in a karst environment: the 1–6 September 2014 Gargano event, southern Italy, Nat. Hazards Earth Syst. Sci., 17, 467–480, https://doi.org/10.5194/nhess-17-467-2017, 2017.
Morss, R. E., Mulder, K. J., Lazo, J. K., and Demuth, J. L.: How do people perceive, understand, and anticipate responding to flash flood risks and warnings? Results from a public survey in Boulder, Colorado, USA, J. Hydrol., 541, 649–664, 2016.
Moore, R. J. and Bell, V. A.: Incorporation of groundwater losses and well level data in rainfall-runoff models illustrated using the PDM, Hydrol. Earth Syst. Sci., 6, 25–38, https://doi.org/10.5194/hess-6-25-2002, 2002.
Nash, J. E. and Sutcliffe, J. V.: River flow forecasting through conceptual models. Part I: A discussion of principles, J. Hydrol., 10, 282–290, 1970.
Paeth, H., Vogt, G., Paxian, A., Hertig, E., Seubert, S., and Jacobeit, J.: Quantifying the evidence of climate change in the light of uncertainty exemplified by the Mediterranean hot spot region, Global Planet. Change, 151, 144–151, https://doi.org/10.1016/j.gloplacha.2016.03.003, 2017.
Pastor, F., Gómez, I., and Estrela, M. J.: Numerical study of the October 2007 flash flood in the Valencia region (Eastern Spain): the role of orography, Nat. Hazards Earth Syst. Sci., 10, 1331–1345, https://doi.org/10.5194/nhess-10-1331-2010, 2010.
Pellarin, T., Delrieu, G., Saulnier, G., Andrieu, H., Vignal, B., and Creutin, J.: Hydrologic visibility of weather radar systems operating in mountainous regions: Case study for the Ardèche Catchment (France), J. Hydrometeorol., 3, 539–555, https://doi.org/10.1175/1525-7541(2002)003<0539:HVOWRS>2.0.CO;2, 2002.
Petrucci, O., Aceto, L., Bianchi, C., Bigot, V., Brázdil, R., Pereira, S., Kahraman, A., Kılıç, O., Kotroni, V., Llasat, M.C., Llasat-Botija, M., Papagiannaki, K., Pasqua, A. A., Řehoř, J., Rossello Geli, J., Salvati, P., Vinet, F., and Zêzere, J. L.: Flood fatalities in Europe, 1980–2018: Variability, features, and lessons to learn, Water, 11, 1682, https://doi.org/10.3390/w11081682, 2019.
Pilgrim, D. H.: Travel times and nonlinearity of flood runoff from tracer measurements on a small watershed, Water Resour. Res., 12, 487–496, 1976.
Postigo, C., de Alda, M. J. L., Barceló, D., Ginebreda, A., Garrido, T., and Fraile, J.: Analysis and occurrence of selected medium to highly polar pesticides in groundwater of Catalonia (NE Spain): An approach based on on-line solid phase extraction–liquid chromatography–electrospray-tandem mass spectrometry detection, J. Hydrol., 383, 83–92, 2010.
Pujadas, J.: Mapa de riscos d'inundació i riscos associats a la Riba, Riu Francolí, Cartografia de Riscos d'Inundació, Campanya 1994, http://hdl.handle.net/2445/170580 (last access: 25 June 2024), 1994.
Roca, M., Martín-Vide, J. P., and Moreta, P. J. M.: Modelling a torrential event in a river confluence, J. Hydrol., 364, 207–215, 2009.
Romero, R.: TRAM: A new nonhydrostatic fully compressible numerical model suited for all kinds of regional atmospheric predictions, Q. J. Roy. Meteor. Soc., 150, 1124–1156, https://doi.org/10.1002/qj.4639, 2023.
Romero, R., Sumner, G., Ramis, C., and Genovés, A.: A classification of the atmospheric circulation patterns producing significant daily rainfall in the Spanish Mediterranean area, Int. J. Climatol., 19, 765–785, 1999.
Romero, R., Doswell III, C. A., and Ramis, C.: Mesoscale numerical study of two cases of long-lived quasistationary convective systems over eastern Spain, Mon. Weather Rev., 128, 3731–3751, 2000.
Romero, R., Vich, M., and Ramis, C.: A pragmatic approach for the numerical prediction of meteotsunamis in Ciutadella harbour (Balearic Islands), Ocean Model., 142, 101441, https://doi.org/10.1016/j.ocemod.2019.101441, 2019.
Ruin, I., Creutin, J. D., Anquetin, S., and Lutoff, C.: Human exposure to flash floods – Relation between flood parameters and human vulnerability during a storm of September 2002 in Southern France, J. Hydrol., 361, 199–213, 2008.
Sangati, M. and Borga, M.: Influence of rainfall spatial resolution on flash flood modelling, Nat. Hazards Earth Syst. Sci., 9, 575–584, https://doi.org/10.5194/nhess-9-575-2009, 2009.
Schumann, M. R. and Roebber, P. J.: The influence of upper-tropospheric potential vorticity on convective morphology, Mon. Weather Rev., 138, 463–474, 2010.
Sendròs, A., Diaz, Y., Himi, M., Tapias, J. C., Rivero, L., Font, X., and Casas, A.: An evaluation of aquifer vulnerability in two nitrate sensitive areas of Catalonia (NE Spain) based on electrical resistivity methods, Environ. Earth Sci., 71, 77–84, 2014.
Servei Meteorològic de Catalunya (SMC): Butlletí climàtic mensual. Setembre del 2019, Departament de Territori i Sostenibilitat, Generalitat de Catalunya, Barcelona, 41 pp., https://www.meteo.cat/wpweb/climatologia/butlletins-i-episodis-meteorologics/butlleti-mensual/ (last access: 25 June 2024), 2019a.
Servei Meteorològic de Catalunya (SMC): Butlletí climàtic mensual. Octubre del 2019, Departament de Territori i Sostenibilitat, Generalitat de Catalunya, Barcelona, 41 pp., https://www.meteo.cat/wpweb/climatologia/butlletins-i-episodis-meteorologics/butlleti-mensual/ (last access: 25 June 2024), 2019b.
Smith, J. A., Baeck, M. L., Steiner, M., and Miller, A. J.: Catastrophic rainfall from an up-slope thunderstorm in the central Appalachians: The Rapidan storm of June 27, 1995, Water Res., 32, 3099–3113, 1996.
Smith, J. A., Baeck, M. L., Morrison, J. E., and Sturdevant-Rees, P.: Catastrophic rainfall and flooding in Texas, J. Hydrometeorol., 1, 5–25, 2000.
Smith, J. A., Baeck, M. L., Morrison, J. E., Sturdevant-Rees, P., Turner-Gillespie, D. F., and Bates, P. D.: The regional hydrology of extreme floods in an urbanizing drainage basin, J. Hydrometeorol., 3, 267–282, https://doi.org/10.1175/1525-7541(2002)003,0267:TRHOEF.2.0.CO;2, 2002.
Smith, J. A., Baeck, M. L., Yang, L., Signell, J., Morin, E., and Goodrich, D. C.: The paroxysmal precipitation of the desert: Flash floods in the Southwestern United States, Water Resour. Res., 55, 10218–10247, 2019.
Špitalar, M., Gourley, J. J., Lutoff, C., Kirstetter, P. E., Brilly, M., and Carr, N.: Analysis of flash flood parameters and human impacts in the US from 2006 to 2012, J. Hydrol., 519, 863–870, 2014.
ten Veldhuis, M.-C., Zhou, Z., Yang, L., Liu, S., and Smith, J.: The role of storm scale, position and movement in controlling urban flood response, Hydrol. Earth Syst. Sci., 22, 417–436, https://doi.org/10.5194/hess-22-417-2018, 2018.
Tuel, A. and Eltahir, E. A.: Why is the Mediterranean a climate change hot spot?, J. Climate, 33, 5829–5843, https://doi.org/10.1175/JCLI-D-19-0910.1, 2020.
USDA: Urban hydrology for small watersheds, USDA TR-55, 164 pp., https://www.nrc.gov/docs/ML1421/ML14219A437.pdf (last access: 25 June 2024), 1986.
Vennari, C., Parise, M., Santangelo, N., and Santo, A.: A database on flash flood events in Campania, southern Italy, with an evaluation of their spatial and temporal distribution, Nat. Hazards Earth Syst. Sci., 16, 2485–2500, https://doi.org/10.5194/nhess-16-2485-2016, 2016.
Wicker, L. J. and Skamarock, W. C.: A time-splitting scheme for the elastic equations incorporating second-order Runge-Kutta time differencing, Mon. Weather Rev., 126, 1992-1999, 1998.
Woods, R. A. and Sivapalan, M.: A synthesis of space–time variability in storm response: rainfall, runoff generation and routing, Water Resour. Res. 35, 2469–2485, 1999.
Wu, W., Emerton, R., Duan, Q., Wood, A. W., Wetterhall, F., and Robertson, D. E.: Ensemble flood forecasting: Current status and future opportunities, Wiley Interdisciplinary Reviews-Water, 7, e1432, https://doi.org/10.1002/wat2.1432, 2020.
Zanon, F., Borga, M., Zoccatelli, D., Marchi, L., Gaume, E., Bonnifait, L., and Delrieu, G.: Hydrological analysis of a flash flood across a climatic and geologic gradient: The September 18, 2007 event in Western Slovenia, J. Hydrol., 394, 182–197, 2010.
Zhang, Y., Smith, J. A., and Baeck, M. L.: The hydrology and hydrometeorology of extreme floods in the Great Plains of eastern Nebraska, Adv. Water Resour., 24, 1037–1050, 2001.