the Creative Commons Attribution 4.0 License.
the Creative Commons Attribution 4.0 License.
 | 01 Jul 2024
The impact of long-term changes in ocean waves and storm surge on coastal shoreline change: a case study of Bass Strait and south-east Australia
Mandana Ghanavati
Ebru Kirezci
Numerous studies have demonstrated that significant global changes in wave and storm surge conditions have occurred over recent decades and are expected to continue out to at least 2100. This raises the question of whether the observed and projected changes in waves and storm surges will impact coastlines in the future. Previous global-scale analyses of these issues have been inconclusive. This study investigates the south-east coast of Australia over a period of 26 years (1988–2013). Over this period, this area has experienced some of the largest changes in wave climate of any coastal region globally. The analysis uses high-resolution hindcast data of waves and storm surge together with satellite observations of shoreline change. All datasets have been previously extensively validated against in situ measurements. The data are analysed to determine trends in each of these quantities over this period. The coastline is partitioned into regions and spatial consistency between trends in each of the quantities investigated. The results show that beaches along this region appear to have responded to the increases in wave energy flux and changes in wave direction. This has enhanced non-equilibrium longshore drift. Long sections of the coastline show small but measurable recession before sediment transported along the coast is intercepted by prominent headlands. The recession is largest where there are strong trends in increasing wave energy flux and/or changes in wave direction, with recession rates of up to 1 m yr−1. Although this is a regional study, this finding has global implications for shoreline stability in a changing climate.
- Article
(7371 KB) - Full-text XML
-
Supplement
(3396 KB) - BibTeX
- EndNote


Sandy coastlines are dynamic systems responding to changes in waves, storm surge, sea level, available coastal sediment supply, and human activities (e.g. coastal structures or beach nourishment; Komar, 1998; Masselink et al., 2016). These changes occur on a variety of spatial and temporal scales. Spatially, changes in beach alignment and the presence of coastal shoreline features (headlands and bays) impact both the wave climate of individual beaches and the characteristics of longshore drift. At temporal scales of days, beach erosion results from individual storms (Komar, 1998; Harley et al., 2017; Masselink et al., 2016). At timescales of 2 to 10 years, changes in storminess associated with climate indices (e.g. El Niño; Ranasinghe et al., 2004; Harley et al., 2011; Barnard et al., 2015; Vos et al., 2023) can result in sustained impacts on beach systems. Longer-term changes in mean sea level as a result of climate change are also predicted to result in coastal recession (Hinkel et al., 2013; Ranasinghe, 2016; Vousdoukas et al., 2020; Ranasinghe et al., 2021; Vitousek et al., 2023). It should be noted that throughout this paper we refer to shorter-term changes in beach location due to storms or a series of storms as erosion or accretion. Longer-term changes such as those due to climate change are referred to as recession or progradation.
Waves and storm surges are generated by environmental variables (wind and sea level pressure gradients). It has been shown that these environmental variables are impacted by climate change, and hence long-term historical changes (trends) in waves (Wang and Swail, 2001; Wang et al., 2012; Hemer, 2010; Young et al., 2011; Aydoğan and Ayat, 2018; Zheng and Li, 2017; Young and Ribal, 2019; Takbash and Young, 2020; Reguero et al., 2019; Cao et al., 2021; Young and Ribal, 2022; Liu et al., 2022a; Morim et al., 2022; Erikson et al., 2022) and storm surges (Paprotny, 2014; Androulidakis et al., 2015; Cid et al., 2016; Muis et al., 2016; Kim et al., 2017; Feng et al., 2018; Ghanavati et al., 2023) have been observed. A number of studies have also projected continued global increases (positive trends) in wave height over the 21st century, particularly in the Southern Hemisphere, under plausible climate change scenarios (Hemer et al., 2013; Meucci et al., 2020, 2023a; Hochet et al., 2021; Liu et al., 2022b, 2023b; Morim et al., 2023).
If sandy coasts are impacted by changes in wave and storm surge conditions, the potential for continued increases in the values of these variables in the future raises the question of what impact this may have on sandy coastlines and associated communities. As a means of determining potential future impacts, the obvious precursor is to assess the impacts that historical changes in long-term wave and storm surge conditions have had on coastlines. In the first study of its type, Ghanavati et al. (2023) investigated this issue at the global scale using long-term modelled wave and storm surge data together with satellite observations of beach recession/progradation over the last 30 years. They found, noting the relatively small trends in wave and storm surge conditions over this period, the accuracy of the available data, and other unrelated impacts on shoreline response (e.g. availability of sediment or human impacts), that no clear relationship was evident.
In order to address the limitations of the Ghanavati et al. (2023) work, the present study examines the south-east coastline of Australia in much finer detail. This is an area where long-term trends in wave conditions are some of the largest in the world, responding to changes in wave climate in the Southern Ocean (Liu et al., 2022b). Therefore, if there is a causal link between changes in long-term wave and storm surge climate and shoreline response, one would expect clear signs in this region. As a regional area is considered, it is possible to use higher-resolution data (both model and satellite), removing uncertainties such as were present in the global-scale Ghanavati et al. (2023) study. In addition, the regional-scale study enables an analysis of the role beach compartments play in defining sediment transport. As such, one can investigate changes in longshore drift due to changes in wave climate and the characteristic signature of such non-equilibrium transport with eroding beaches and deposition of sediment behind peninsulas.
Although the present study is regional, the area being studied is a proxy for the potential impacts one may see in other regions of the world, as changes in wave and storm surge climate are projected to continue in the future. Hence, the findings of the study have global implications for shoreline response in the future. This study is unique in that it was possible to combine high-resolution datasets for waves, storm surge, and shoreline response and addresses a previously unexplored area of shoreline response in a changing climate.
The structure of the paper is as follows. Section 2 outlines the study area, datasets, and analysis techniques used in the study. Results are given in Sect. 3, including the observed relationships between changes in wave and storm surge quantities and beach recession/progradation. Discussion and conclusions are provided in Sect. 4.
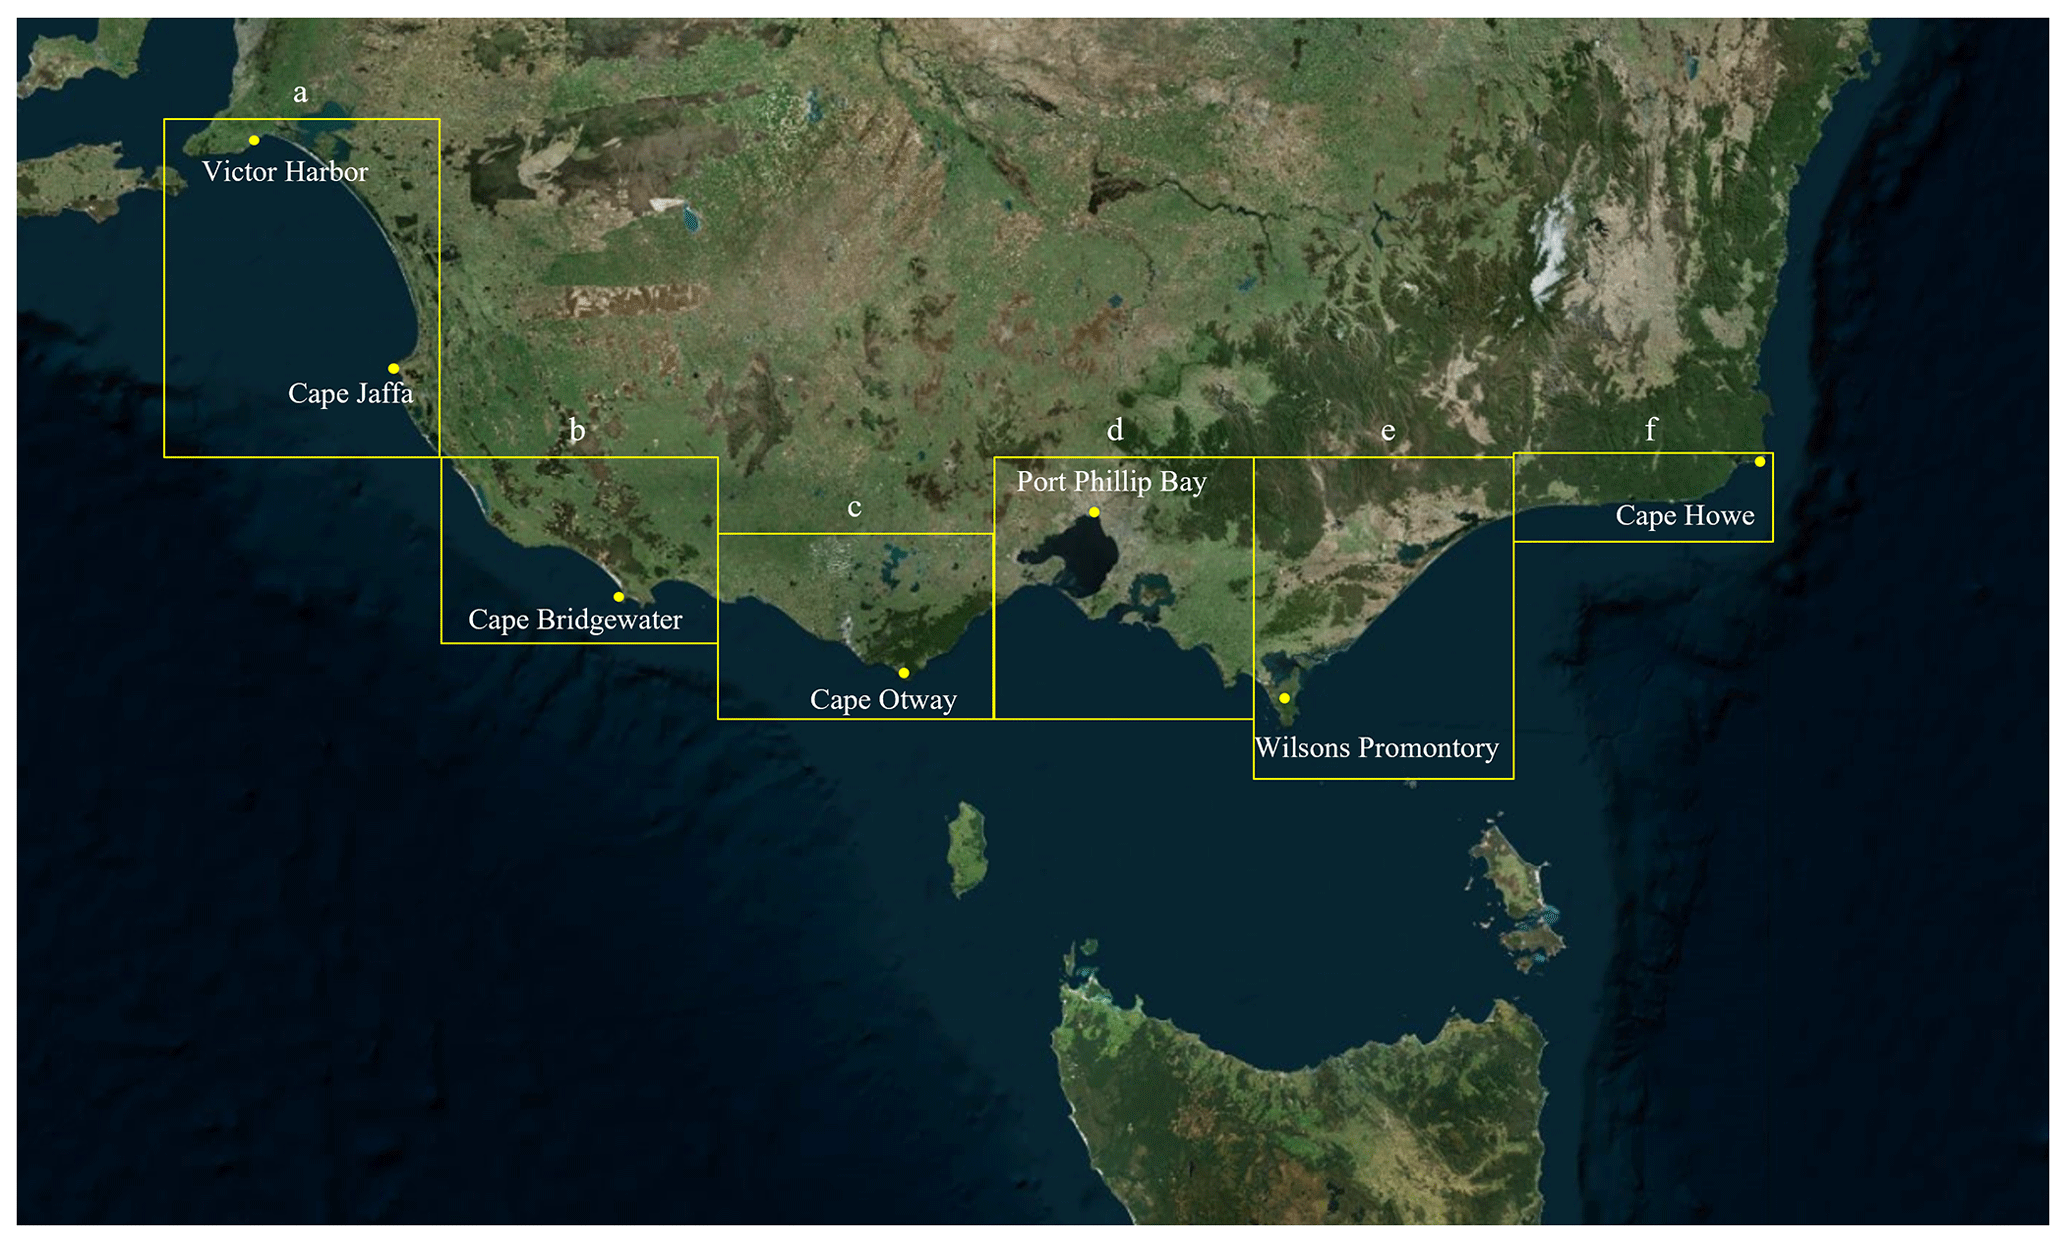
Figure 1The coastal region of south-east Australia comprising the study area. For analysis purposes, the region is divided into six sections from west to east: (a) 138–140°, (b) 140–142°, (c) 142–144°, (d) 144–146°, (e) 146–148°, and (f) 148–150°. The island of Tasmania is to the south of this coastline (© Google Maps).
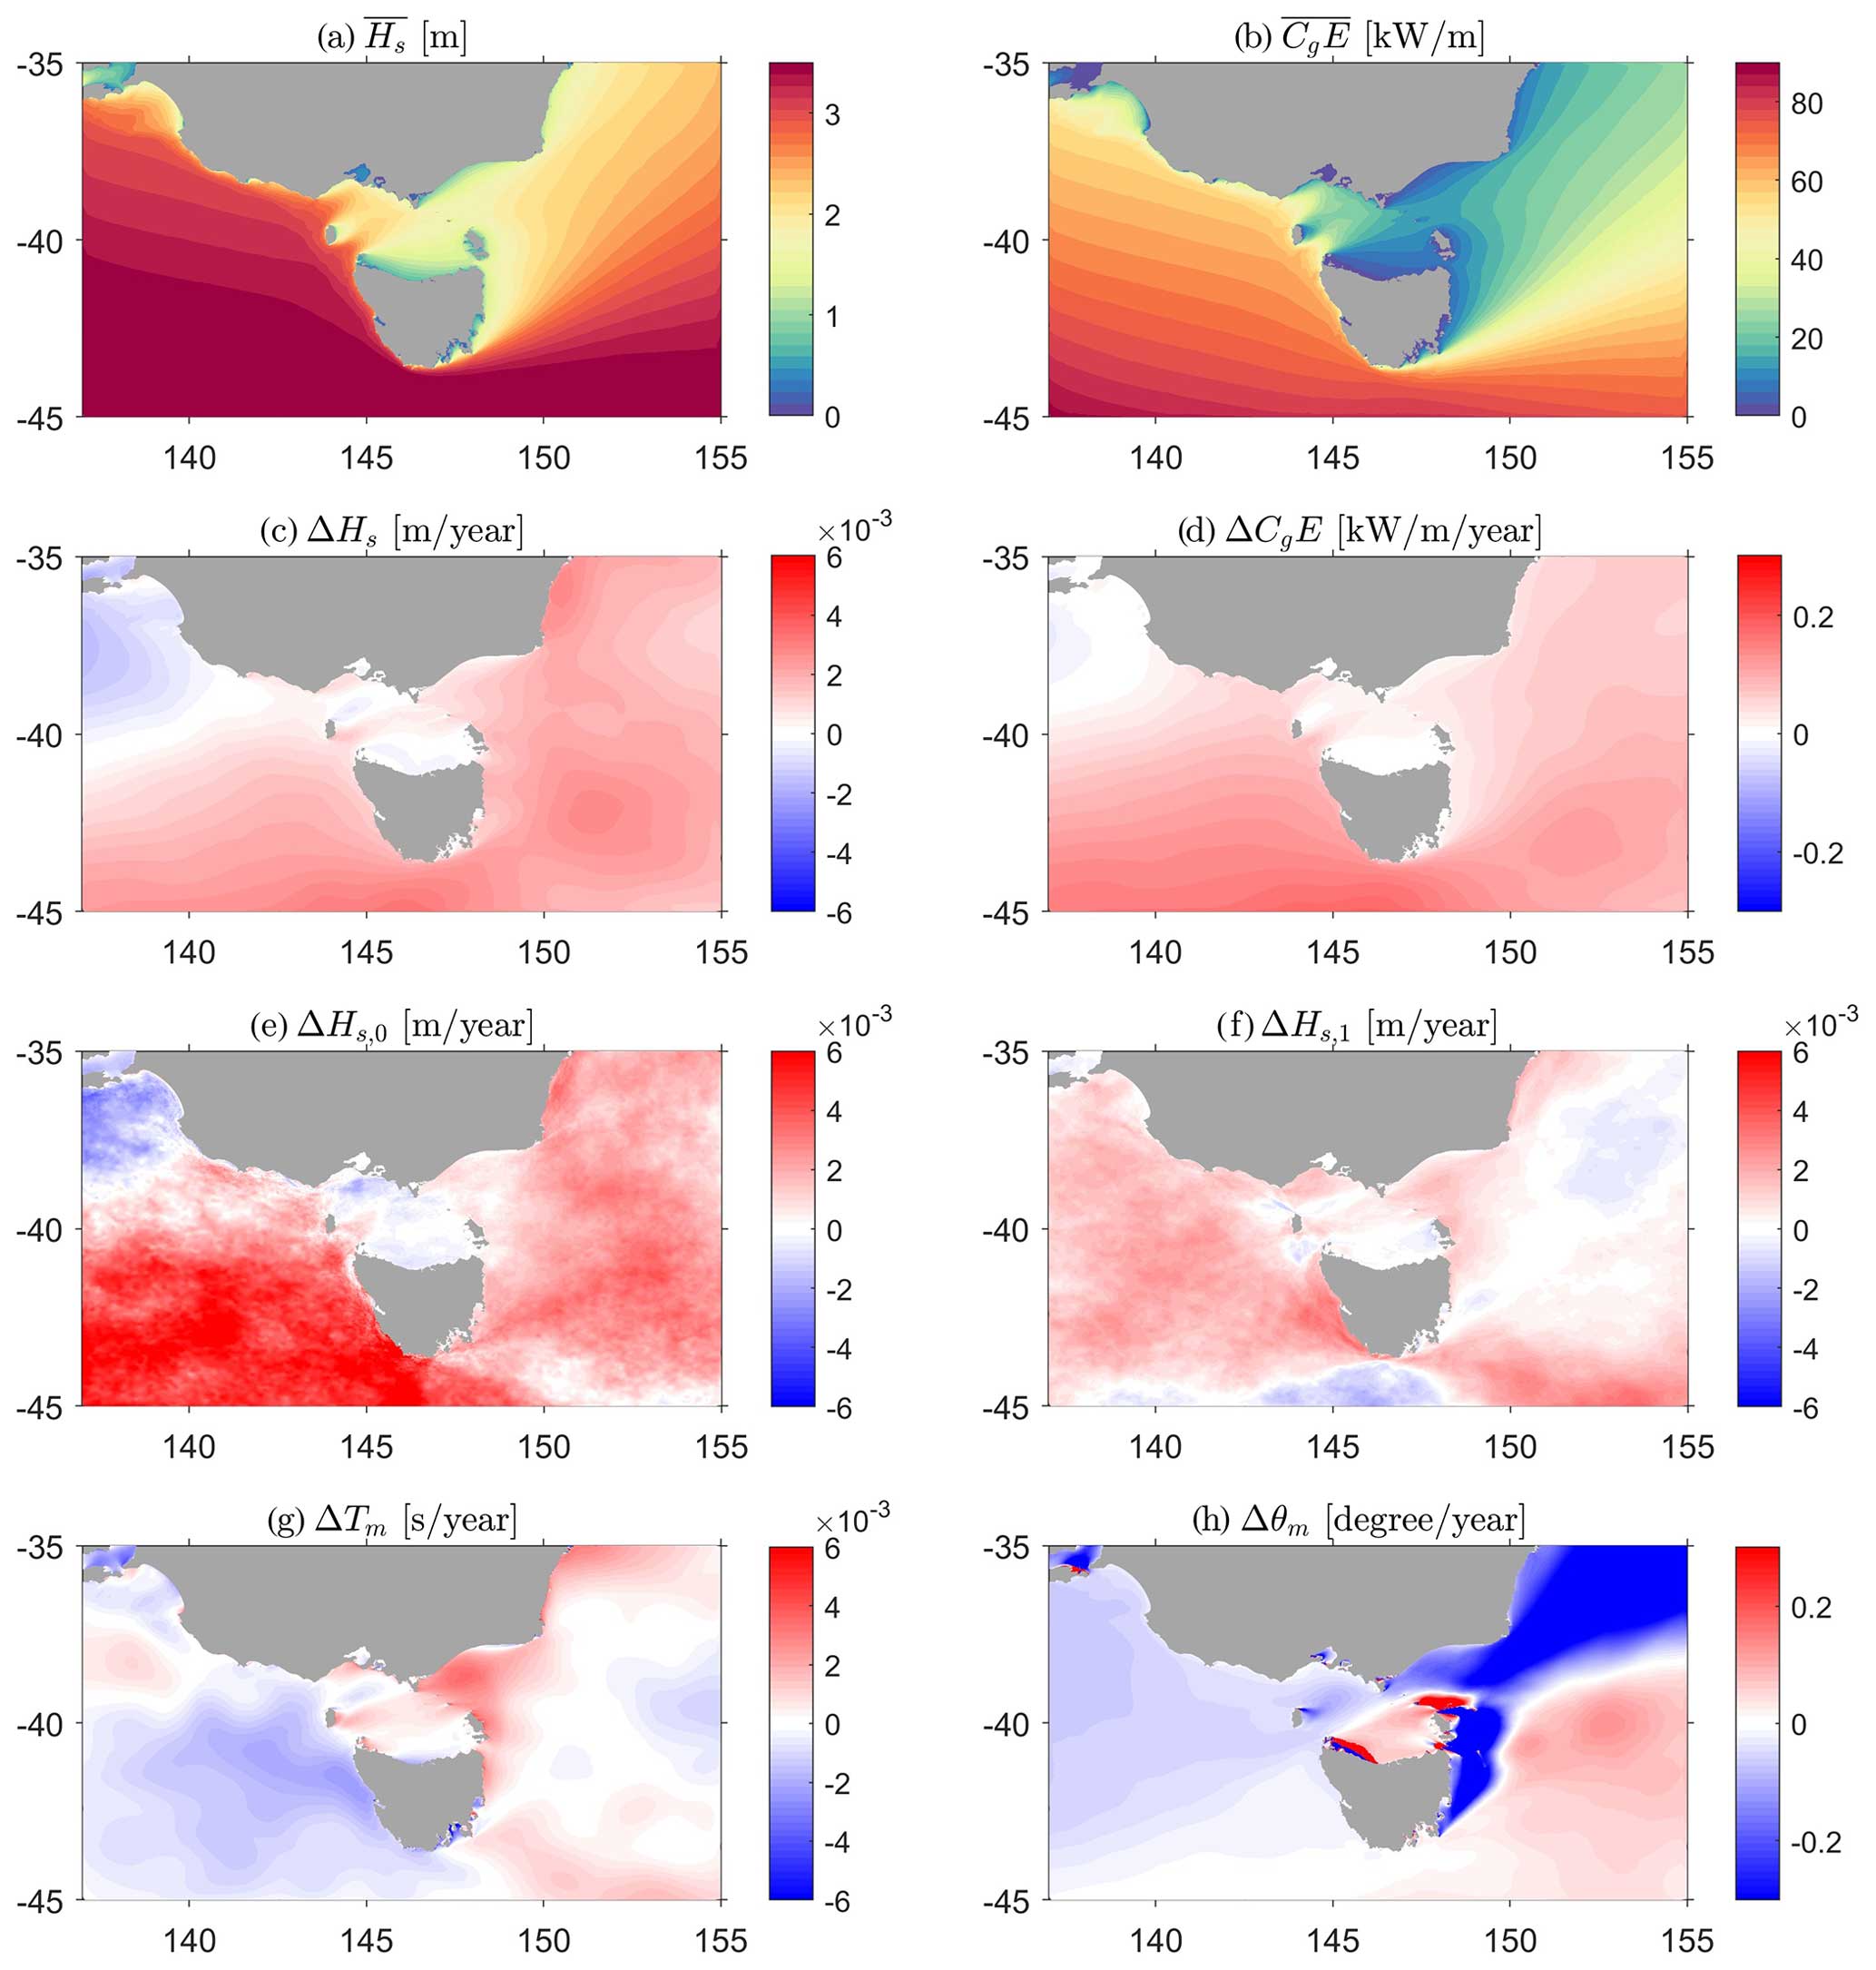
Figure 2Wave climate and trends in the study region of south-east Australia over the period 1988 to 2013 from the data of the Liu et al. (2022a) regional wave model. (a) Mean significant wave height, (b) mean wave energy flux, (c) trend in significant wave height, (d) trend in wave energy flux, (e) trend in wind–wave portion of the spectrum, (f) trend in swell portion of the spectrum, (g) trend in mean wave period, and (h) trend in mean wave direction.
2.1 Study area
The study region is shown in Figs. 1 and 2 and covers an area of 35–45° S, 137–155° E. Three Australian coastal states span this domain: Victoria, southern New South Wales, and the island of Tasmania in the south of the domain. The south-eastern coast of the mainland of Australia (Victoria), the coastal area of the study, is separated from Tasmania by the relatively shallow Bass Strait. The area is exposed to a particularly complex wave climate (Liu et al., 2022a). To the west, the coast is exposed to the Southern Ocean and hence experiences a very energetic wave climate with recorded significant wave height as high as 10 m (Meucci et al., 2023b). The wave climate of this region is dominated by south-westerly Southern Ocean swell. Central regions of the study domain are protected by the island of Tasmania and have a mixed wave climate with swell from both the south-west and south-east and locally generated wind sea. To the east, the wave climate is more heavily dependent on the local wind sea but with south-easterly swell still playing a role (Liu et al., 2022a).
Both observational data from satellite altimeters (Young et al., 2011; Young and Ribal, 2019; Timmermans et al., 2020) and model hindcasts (and reanalyses; Cao et al., 2021; Young and Ribal, 2022) show that over the last 35 years, there has been a small global increase in mean significant wave height. This increase is largest in the Southern Ocean (approximately 3 mm yr−1 or an increase of 3 % over the last 30 years), which results in impacts across the Indian, South Pacific, and South Atlantic oceans due to radiating swell. Therefore, the study area is a location where relatively large changes in significant wave height have occurred over the period.
2.2 Datasets
This study uses regional datasets of waves, storm surge, and coastal change from which the historical trend magnitudes of the various quantities were calculated. The datasets under consideration cover different periods of time, and thus to ensure consistency across analyses, a common time period from 1988 to 2013 was selected. A description of each dataset used in the study is provided below.
The Liu et al. (2022a) regional wave hindcast is a high-resolution regional wave hindcast dataset based on a WAVEWATCH III model with an ST6 physics package (Liu et al., 2021). The regional model covers the domain shown in Fig. 2 using an unstructured grid with a coastal resolution as small as 500 m and a coarser deep-water resolution as large as 10 km. The regional model is nested within a global model using the same ST6 physics (Liu et al., 2021). Both the regional and global models are forced with ERA5 winds (Hersbach et al., 2020). The regional wave model dataset has been extensively validated (Liu et al., 2022a, 2023a) against both a network of coastal buoys and satellite altimeter data. Wave data were available from the hindcast with a temporal resolution of 1 h. The period of the hindcast was from 1981 to 2020. The dataset's high resolution is particularly important for studying coastal regions, where wave conditions can vary significantly over short distances. Additionally, the long period of coverage allows us to identify and analyse trends in the wave climate over several decades, providing insight into the possible effects of historical climate change on the region.
The Colberg et al. (2018) Australian water level hindcast is a dataset of sea level simulations for the Australian coastline. The dataset was generated using the Regional Ocean Modelling System (ROMS; Shchepetkin and McWilliams, 2005), which was run in a depth-integrated form on a 5 km resolution grid for the Australian region. Tidal currents and heights at open boundaries were specified from the TPXO7.2 global model (Egbert and Erofeeva, 2002). TPXO7.2 best fits (in a least-squares sense) the Laplace tidal equations and runs along with track-averaged data from TOPEX/Poseidon and Jason altimetry data. The ROMS model was run for the period 1981–2013 and was forced with NCEP Climate Forecast System Reanalysis (CFSR; Saha et al., 2010) wind and surface pressure data. The model has been validated at 14 tide gauge locations around the Australian coastline (Colberg et al., 2018). Again, the output was available on an hourly basis.
The Bishop-Taylor et al. (2021) Geoscience Australia beach dataset is a high-resolution regional dataset of the shoreline change rate for the coast of Australia. The dataset utilizes a combination of satellite visual data and tidal modelling to map shoreline change, with an along-coast resolution of 30 m for non-rocky (sandy or muddy) areas. The dataset provides annual values of the shoreline position over the period 1988 to 2019. The dataset has been extensively validated using in situ measurements, comprising 330 validation transects each spanning more than 10 years of coastal monitoring data. The mean absolute error (MAE) in the trend across these validation points was 0.35 m yr−1 (Bishop-Taylor et al., 2021).
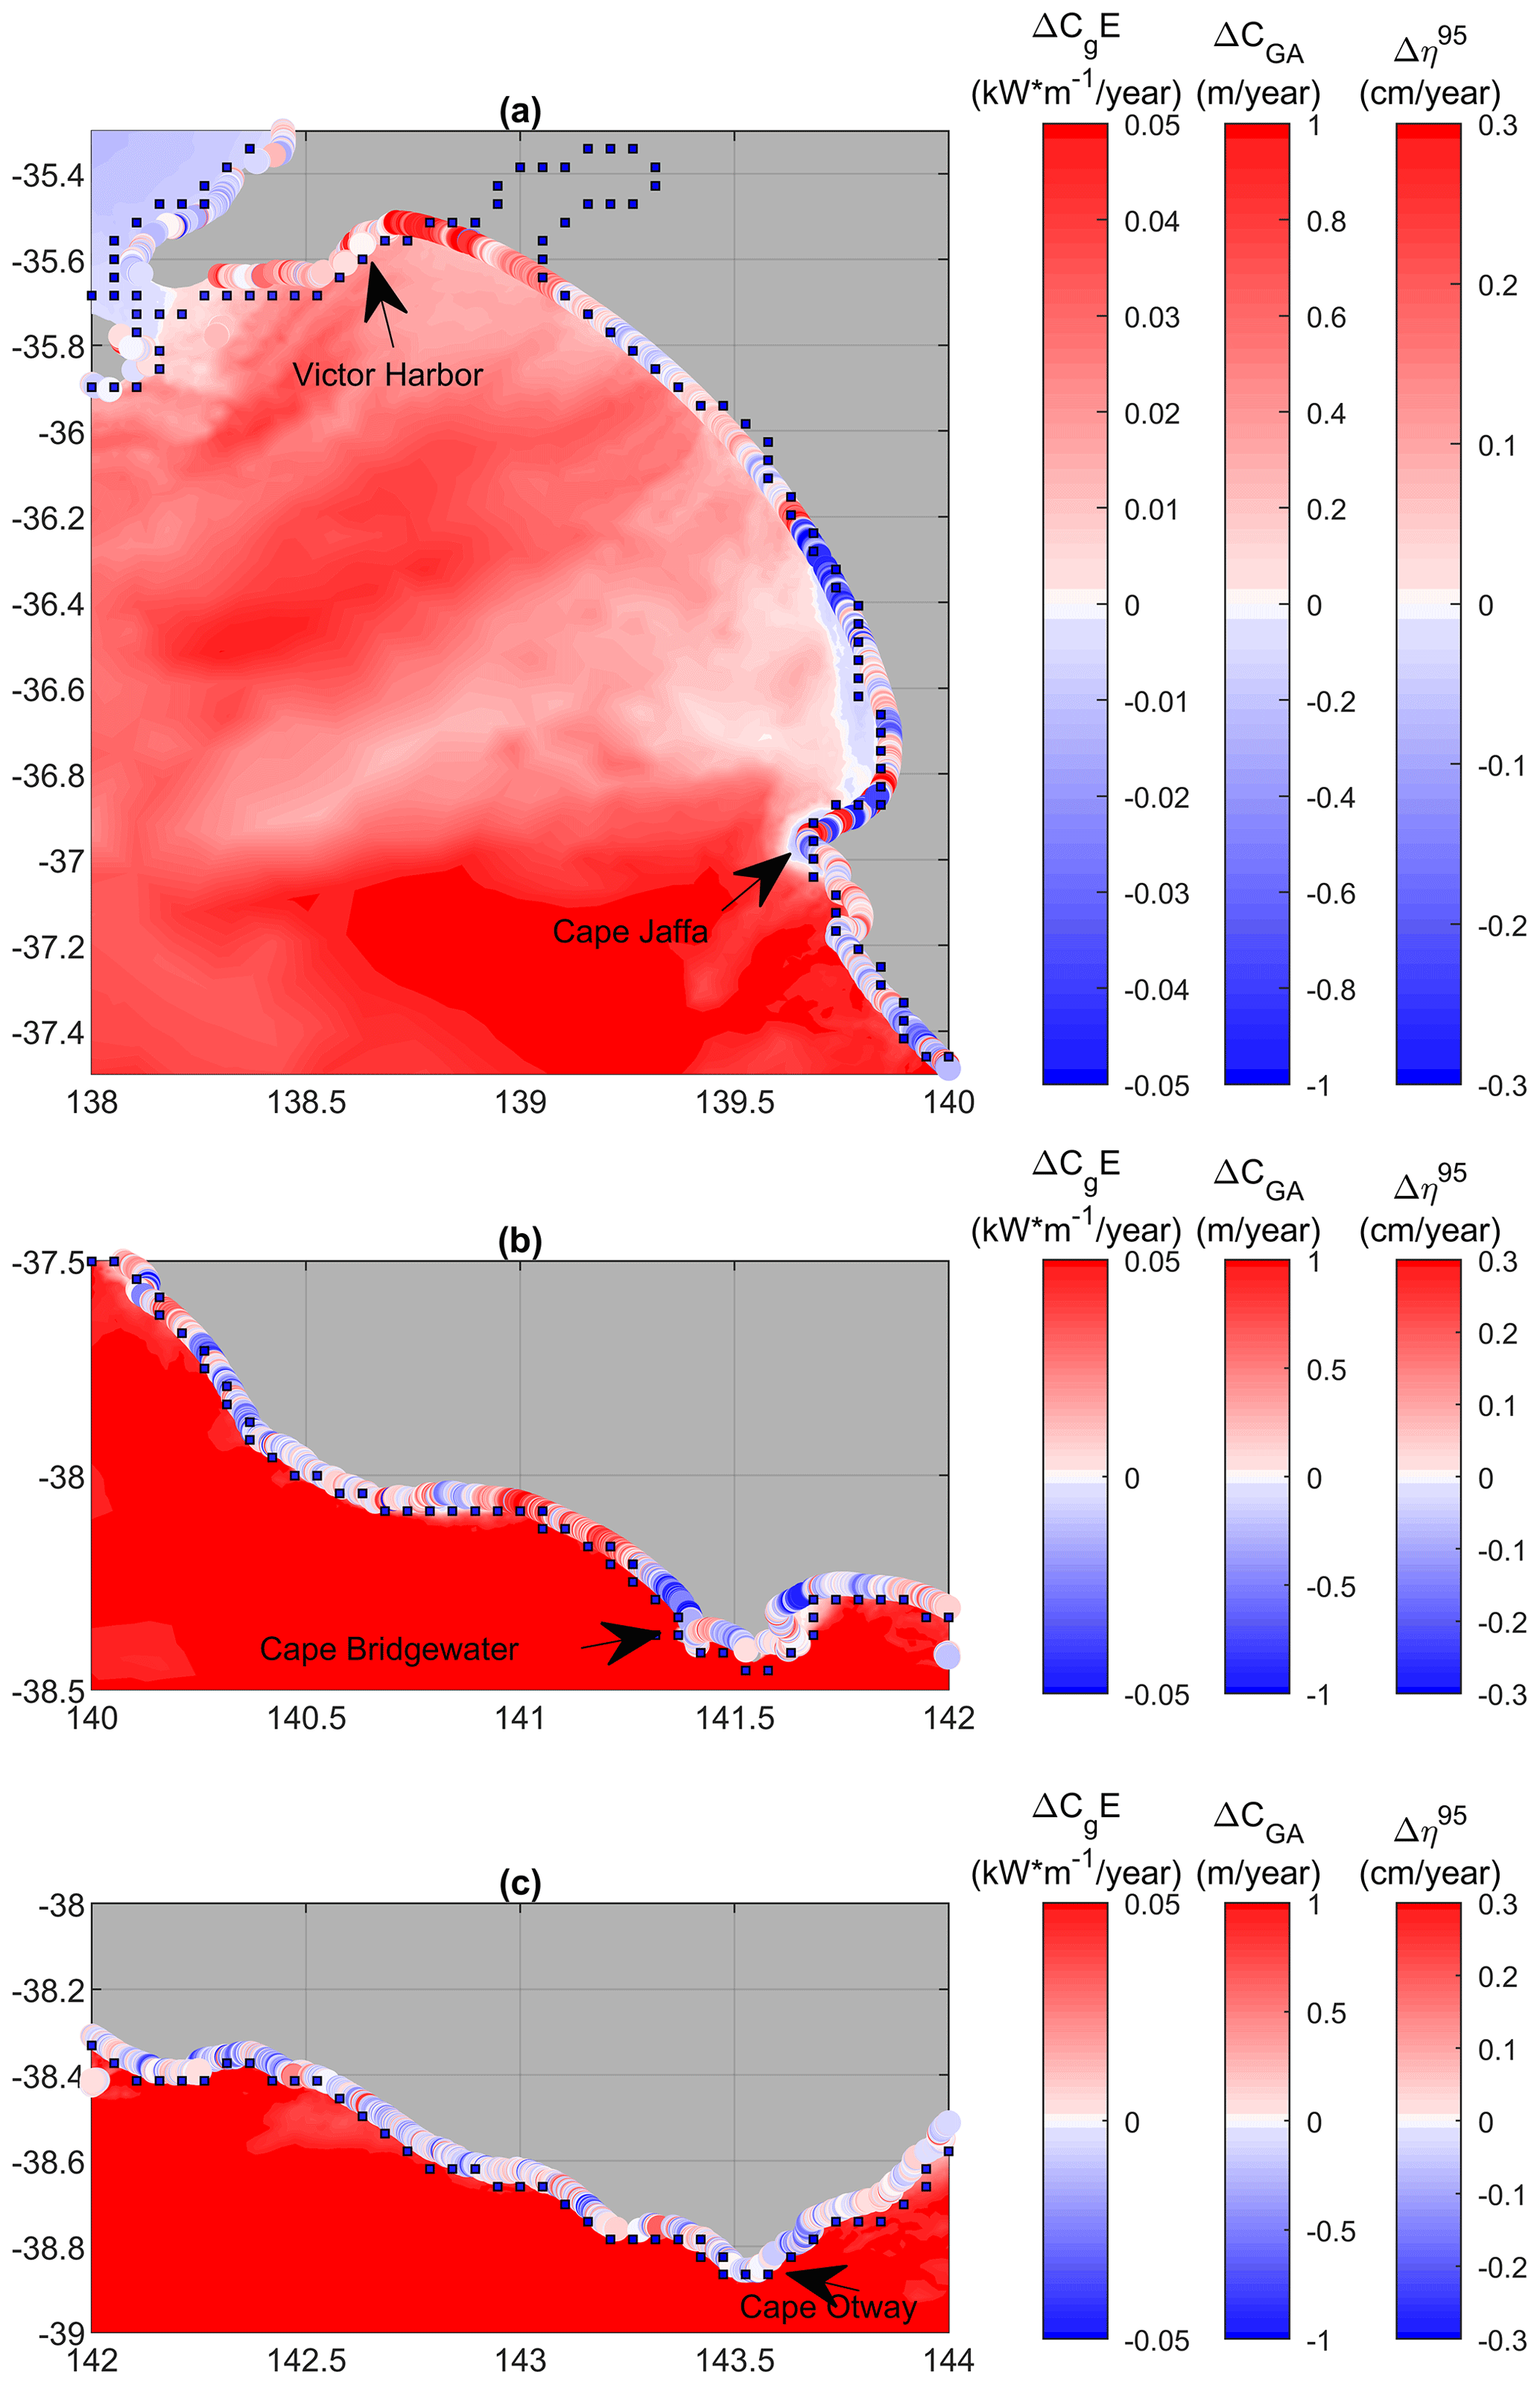
Figure 3Trends in wave energy flux, ΔCgE, shown as colour-shaded values over the domain; storm surge, Δη95, shown as colour-shaded squares at coastal model locations; and shoreline progradation/recession, ΔCGA, shown as colour-shaded circles at beach locations. Results shown for sections (a) 138–140° E, (b) 140–142° E, and (c) 142–144° E of Fig. 1.
2.3 Trend calculation
Each of the datasets (waves, storm surge, and shoreline location) are defined at different resolutions and in different manners (structured and unstructured grids or specific shoreline positions); therefore none of these quantities are co-located. As shown by Ghanavati et al. (2023) and subsequently confirmed in Figs. 3 to 7, trends in both wave height and storm surge quantities generally vary smoothly along extended coastal regions (hundreds of kilometres). The shoreline recession/progradation rate can, however, vary rapidly in magnitude and sign over relatively short spatial scales (tens of kilometres; Luijendijk et al., 2018; Ghanavati et al., 2023). That is, one beach can be receding whilst the next is prograding. As such, simple scatter plots of rates of change in wave and storm surge quantities versus recession/progradation rates are not meaningful. Rather, one needs to consider relationships over spatial regions of the coastline. To achieve such an analysis, we divide the study domain in Fig. 1 into six regions, each spanning 2° in longitude from west to east – (a) 138–140° E, (b) 140–142° E, (c) 142–144° E, (d) 144–146° E, (e) 146–148° E, and (f) 148–150° E. These regions span the differing wave climates of the study domain (see Fig. 2 and subsequent discussion). For analysis purposes, we present the data as follows. Wave quantities are presented as both colour-shaded plots and shoreline locations corresponding to ocean points defined by the unstructured WAVEWATCH III computational grid. Storm surge quantities are shown at the locations corresponding to the ocean points nearest the land/sea transition of the ROMS 5 km computational grid. Coastal change points are as defined at coastal locations in the Bishop-Taylor et al. (2021) dataset, which has an along-cost resolution of 30 m.
Each of the three datasets used in the study covers a different period of time: wave hindcast – 1981 to 2020; storm surge data – 1981 to 2013; and shoreline change data – 1988 to 2019. To ensure a consistent evaluation of the trends and variability in the oceanic parameters, a common analysis period of 1988 to 2013 was selected for the study.
For each of the datasets, a range of quantities to be investigated was calculated. These include (for the wave datasets) mean significant wave height (Hs), 95th-percentile significant wave height (), mean wave energy flux (CgE), mean wave period (Tm) and mean wave direction (θm), where Cg is the group velocity of waves and is the wave energy. The hourly data from the regional wave model were used to calculate annual values of each of these quantities.
As noted above, various datasets have different temporal and spatial resolutions, and hence slightly different approaches were used to evaluate the variability in and extremes of oceanic parameters. The wave and surge time series were collected at a temporal resolution of 1 h, while the shoreline dataset provided annual shoreline change with reference to the shoreline location in 2019. Therefore, annual mean values of wave parameters, including significant wave height, wave energy flux, wave direction, and wave period, were calculated. Furthermore, the extremes were determined by calculating annual higher percentiles (95th, 98th, and 99th) for significant wave height and surge level. These metrics provide a consistent basis for evaluating the variability in and extremes of the oceanic parameters across different datasets. As the various percentile thresholds gave similar results, extreme events were determined as occasions on which the time series exceeded the 95th percentile but with such events separated by a minimum of 48 h. The number of such events in each year was defined as . In a similar fashion, storm surges were defined as occasions when the water surface elevation, η, exceeded the 95th percentile (η95), and the number of such events was defined as . Again, annual values of these quantities were determined. The annual values of shoreline position from the Bishop-Taylor et al. (2021) data were defined in a similar manner and were represented as CGA.
The annual values of each quantity were then used to determine linear trends over the period 1988–2013. Both linear regression and the non-parametric Tiel–Sen estimator (Sen, 1968) were used for this purpose. As the resulting values were very similar, the Sen slope estimates are used in the subsequent analysis. The resulting trend values are represented as ΔHs, , ΔCgE, Δθm, , Δη95, , and ΔCGA.
3.1 Wave climate
Figure 2 shows the mean wave climate of the study area and how it has changed over the period 1988 to 2013, as indicated by the Liu et al. (2022a) hindcast. Figure 2a and b shows the mean significant wave height, , and wave energy flux, ), respectively. As noted above, the significant wave height and wave energy flux vary significantly across the study area. In the west, the coastline is exposed to energetic Southern Ocean swell with a mean Hs of approximately 3 m. In the eastern regions of the study area, where there is protection provided by the island of Tasmania, mean Hs decreases significantly to less than 1.5 m, a decrease by a factor of approximately 2. The wave energy flux shows an even more significant change, with mean values varying from approximately 60 kW m−2 in the west to 15 kW m−2 in the east, a difference of a factor of 4. The substantial reduction in wave energy flux is attributed to the protection provided by the island of Tasmania, which leads to a decrease in both Hs and Tm. As shown by Liu et al. (2022a), the mean/peak wave direction also changes significantly across the domain. In the west, the dominant wave direction is defined by an energetic south-westerly swell. In the east, the protection provided by the island of Tasmania means that the swell entering the area is predominately from the south-east.
The changes in wave climate over the study period are also significant across this region. As noted above, a range of studies has shown that the Southern Ocean wave climate has increased over the past 35 years (Young et al., 2011; Young and Ribal, 2019; Cao et al., 2021; Young and Ribal, 2022). The swell from the Southern Ocean dominates the western areas of the study region, and hence there have been significant changes in the wave climate, as shown by Fig. 2c–h. In the west, Hs has increased by approximately 5 % (Fig. 2c) over the study period and CgE by approximately 14 % (Fig. 2d). In contrast, in the east, where the wave climate is not as exposed to Southern Ocean swell, these values decrease to approximately zero (no change). Figure 2e and f clearly shows that the positive trends in Hs are due to changes in both swell and local wind waves. Figure 2g also shows that there have been only small changes in Tm across the domain.
The most dramatic changes in wave climate concern the mean wave direction, θm. Over the western regions of the study domain, there has been a small anticlockwise rotation of the mean wave direction (less than 1.5°). This is a result of the gradual southward movement of Southern Ocean low-pressure systems over recent decades (Morim et al., 2022). This small change in deep-water wave direction significantly impacts the shadow region in the lee of Tasmania and hence the wave direction, resulting in much larger anticlockwise rotations of approximately 5° (Fig. 2h). These values reduce towards the coast of mainland Australia (the eastern area of the study region) but are still larger than 3°.
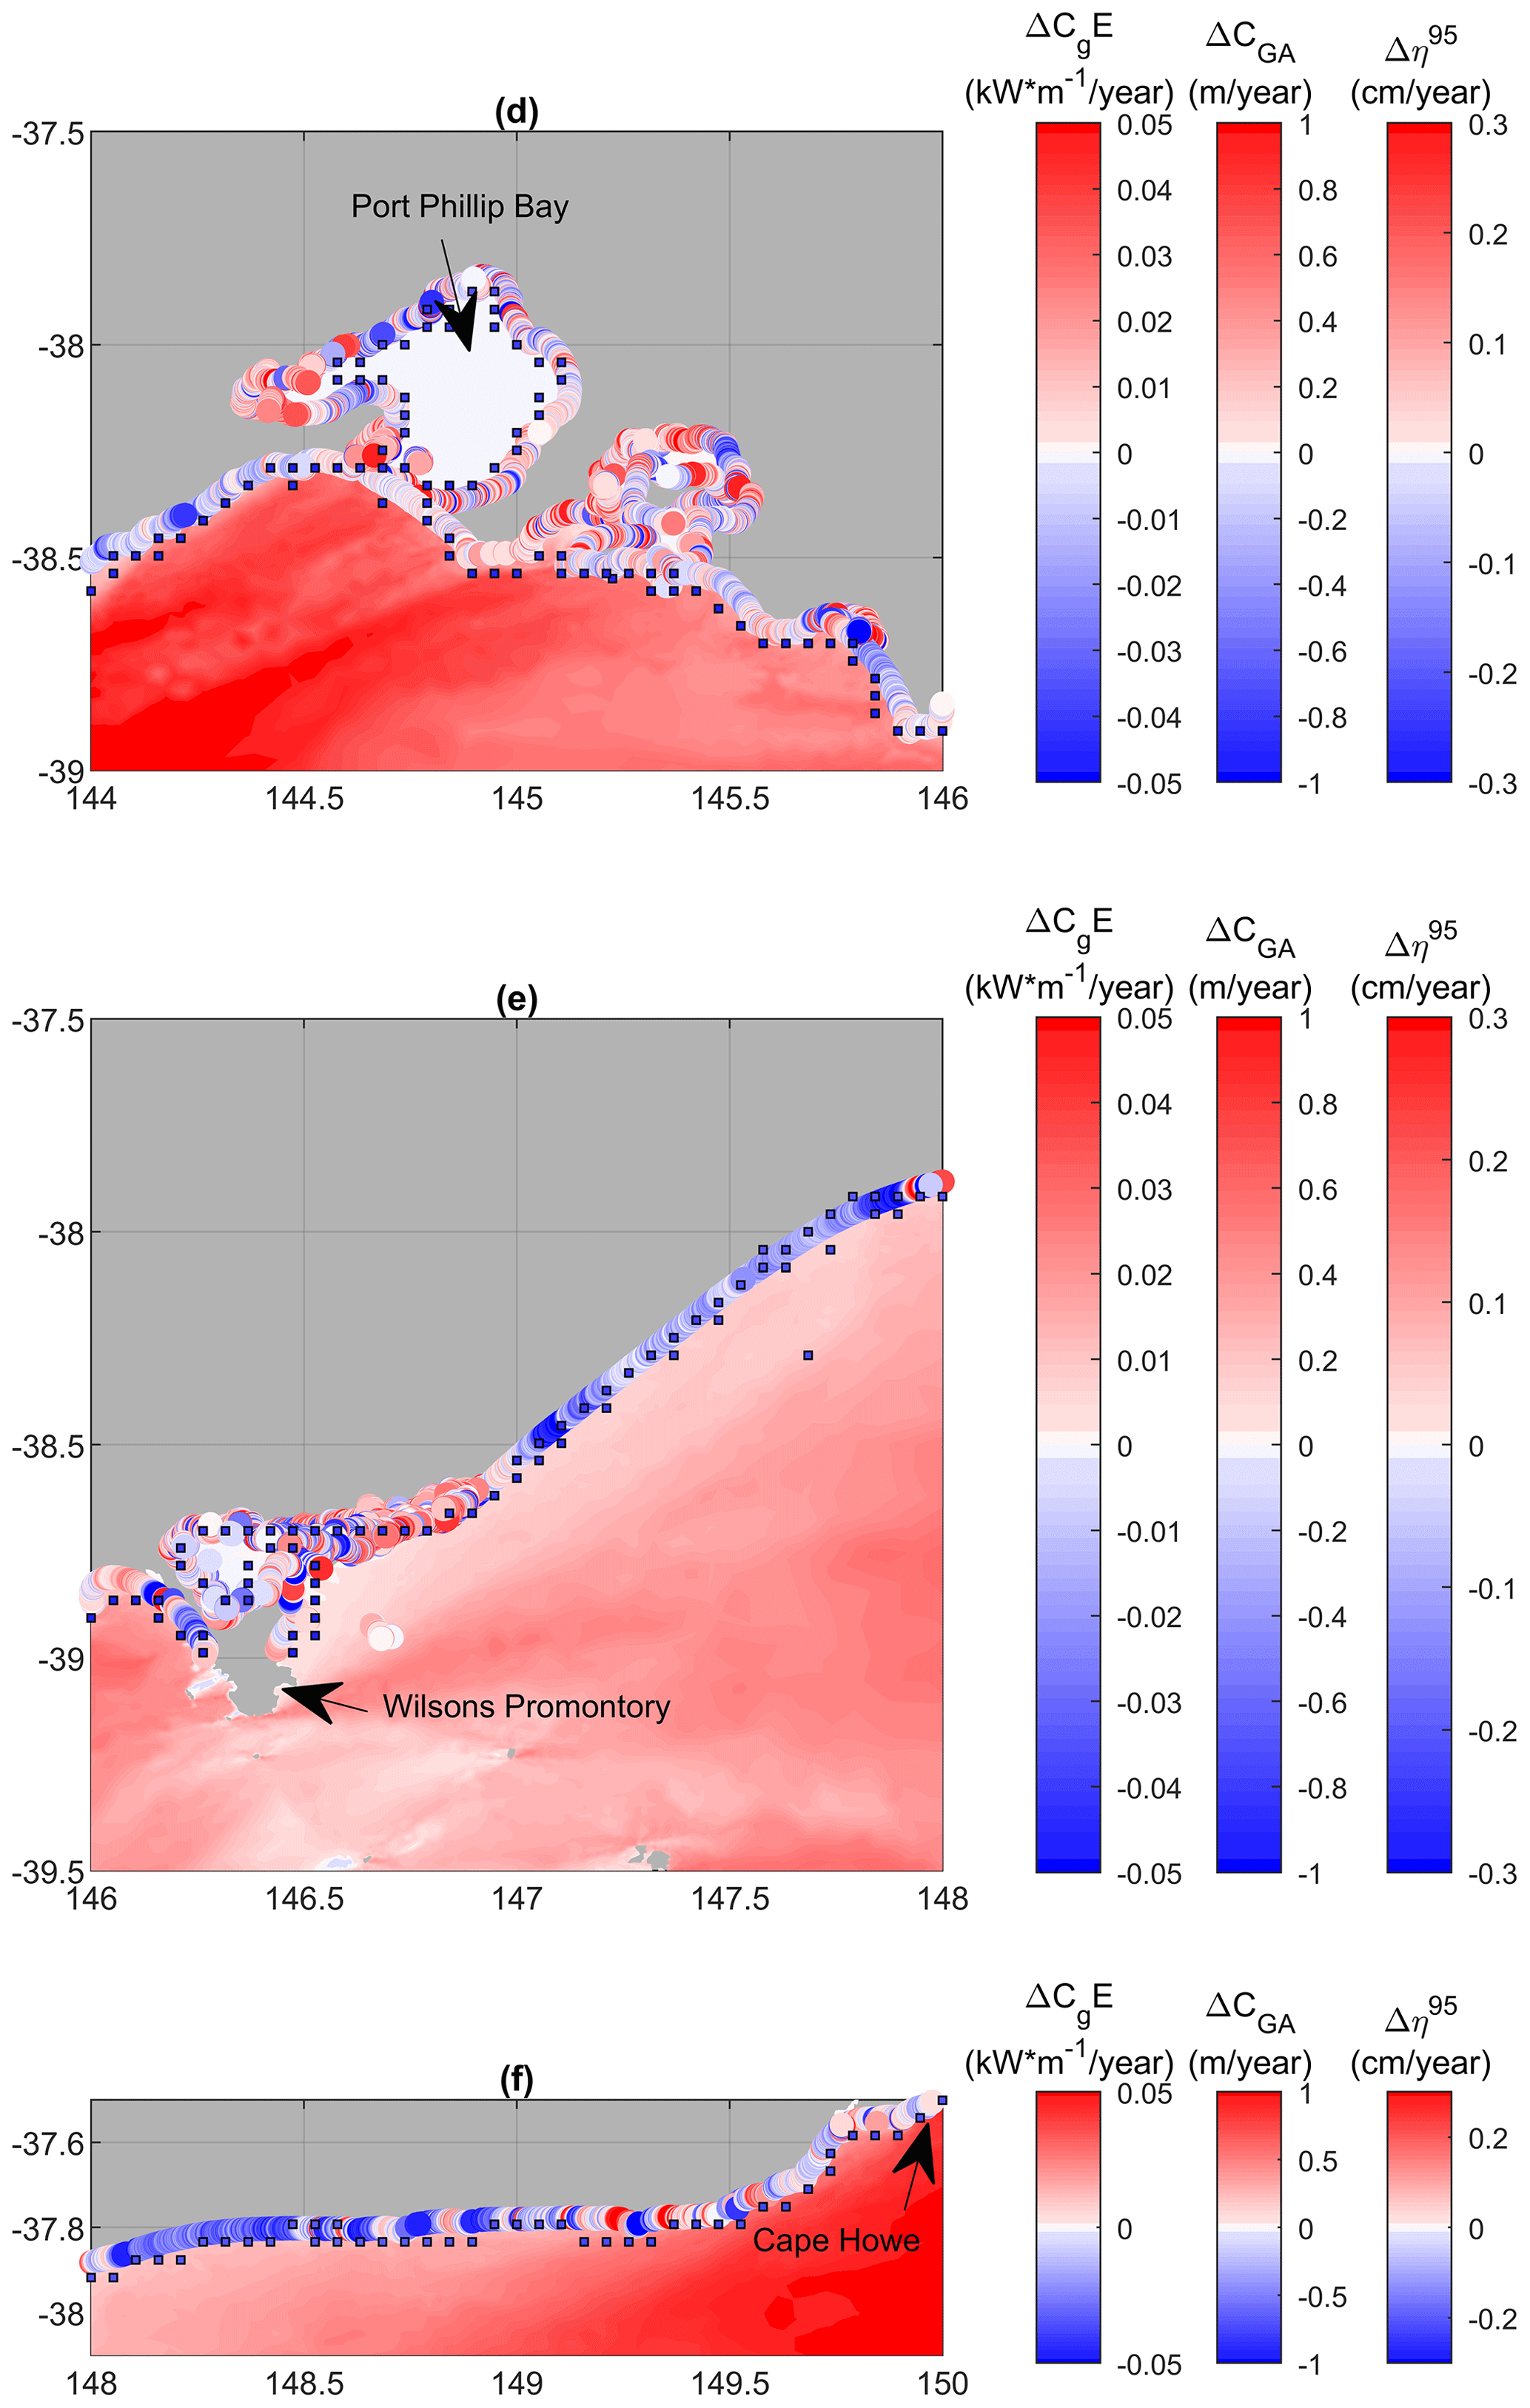
Figure 4Trends in wave energy flux, ΔCgE, shown as colour-shaded values over the domain; storm surge, Δη95, shown as colour-shaded squares at coastal model locations; and shoreline progradation/recession, ΔCGA, shown as colour-shaded circles at beach locations. Results shown for sections (d) 144–146° E, (e) 146–148° E, and (f) 148–150° E of Fig. 1.
3.2 Storm surge climate
As noted above, storm surges were defined as events where the water surface elevation exceeded the 95th percentile value, η95. Figures 3 to 6 show plots for each of the sub-regions referenced in Fig. 1. These figures show colour-contoured values of ΔCgE (Figs. 3 and 4) and Δθm (Figs. 5 and 6) and coastal values of Δη95 and ΔCGA. In contrast to the wave climate, changes in storm surge, Δη95, are very consistent along the coastline of the study area. Values of Δη95 are negative along the entire coastline, decreasing in magnitude from approximately −0.3 cm yr−1 in the west to −0.2 cm yr−1 in the east. The fact that the magnitude of storm surges has been decreasing over this period is consistent with the observations of Liu et al. (2023b) that as Southern Ocean low-pressure systems move south, they increase the mean atmospheric pressure and reduce the pressure gradient over southern Australia. As surface pressure (and wind) drives storm surge, this results in a tendency toward a reduction in the magnitude of storm surges.
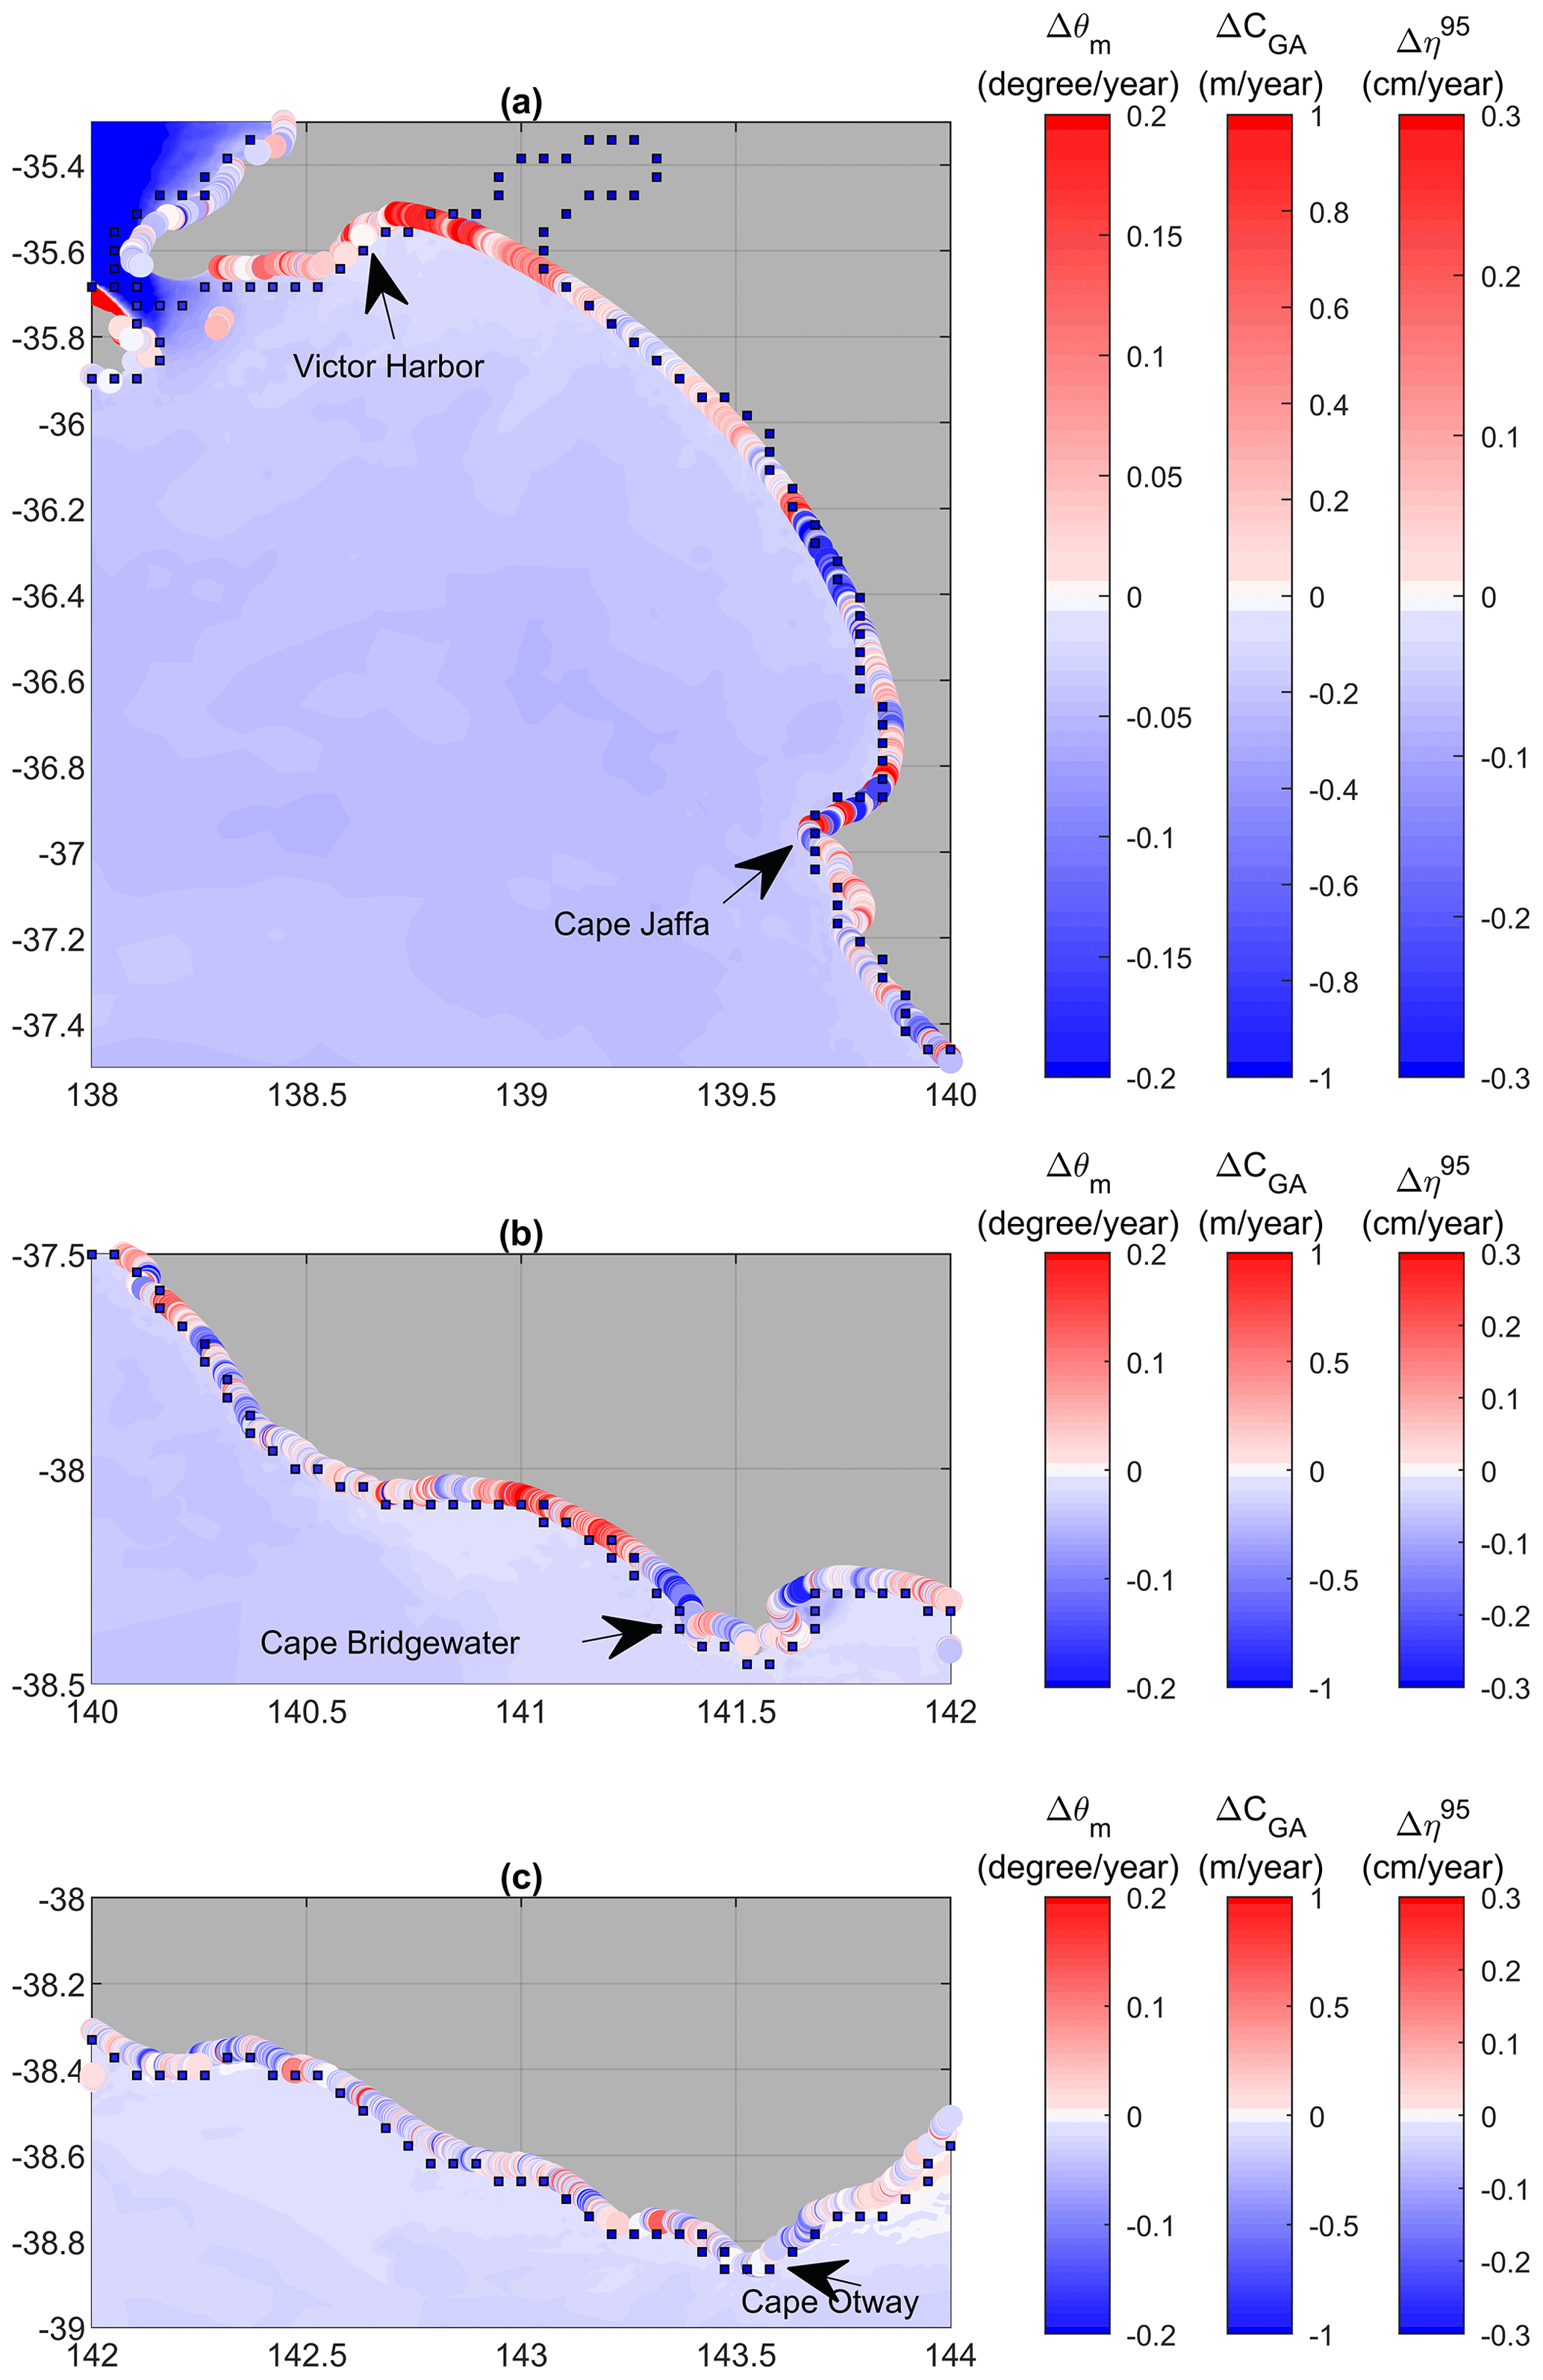
Figure 5Trends in mean wave direction, Δθm, shown as colour-shaded values over the domain; storm surge, Δη95, shown as colour-shaded squares at coastal model locations; and shoreline progradation/recession, ΔCGA, shown as colour-shaded circles at beach locations. Results shown for sections (a) 138–140° E, (b) 140–142° E, and (c) 142–144° E of Fig. 1.
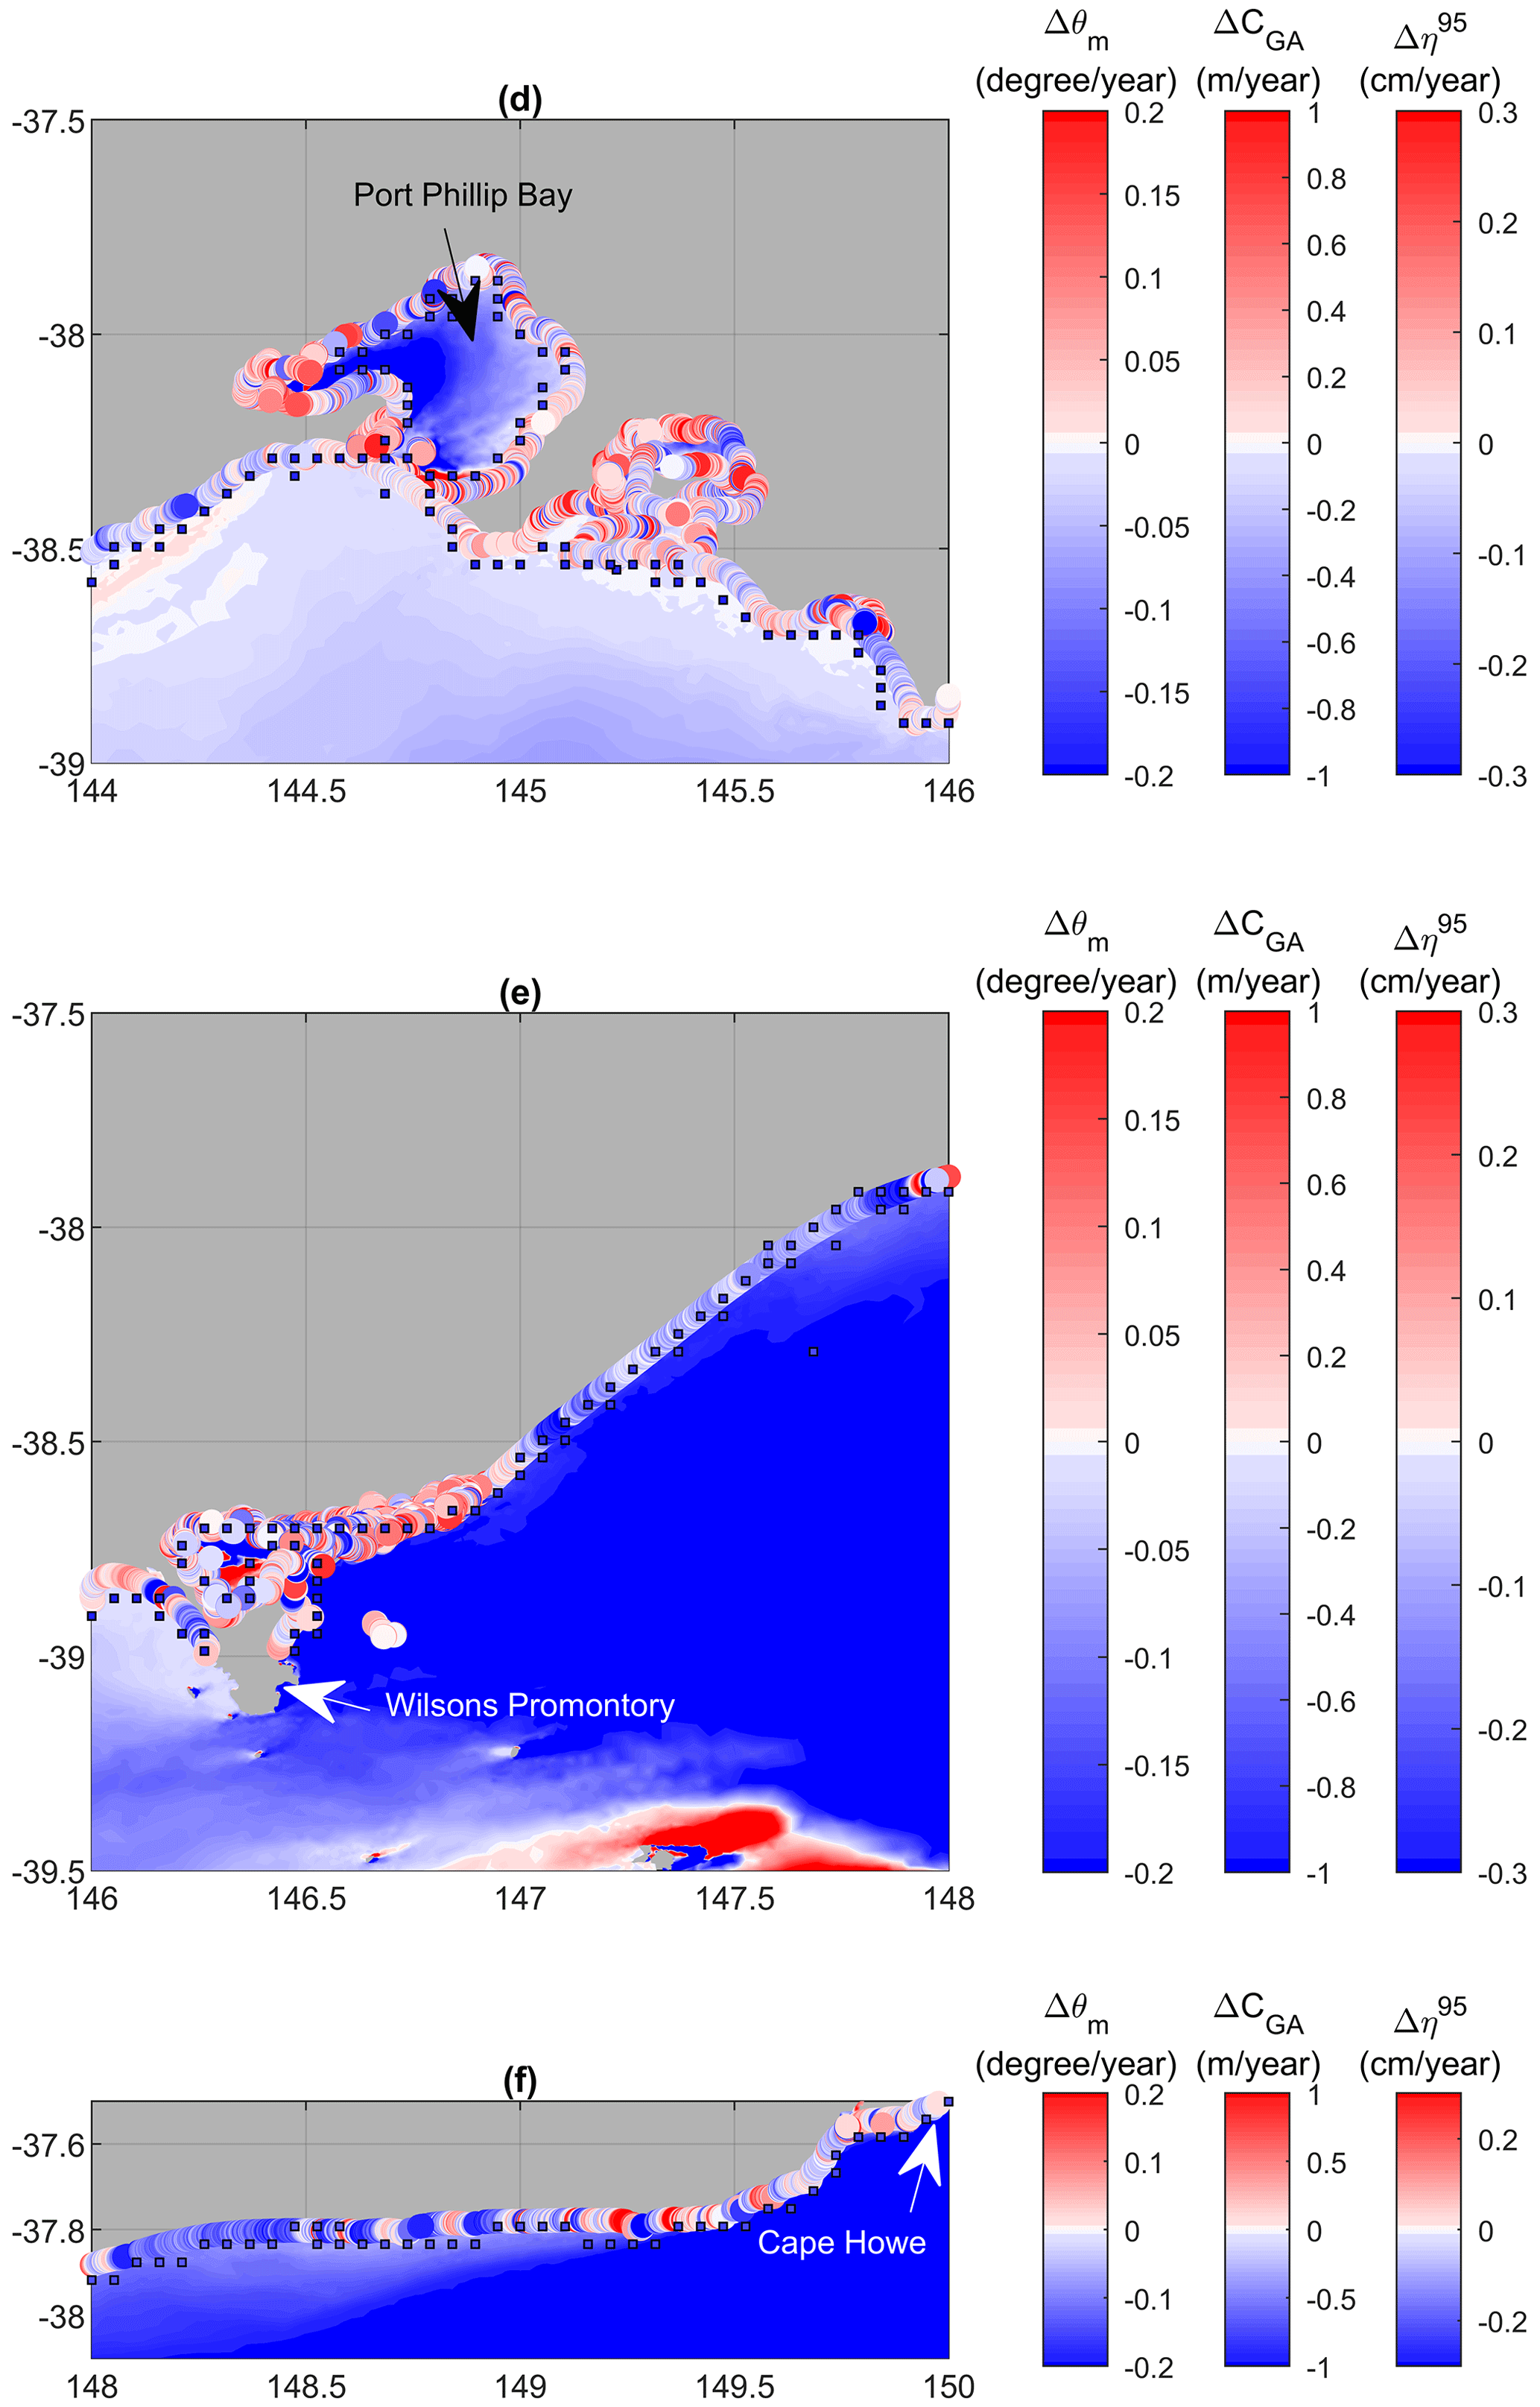
Figure 6Trends in mean wave direction, Δθm, shown as colour-shaded values over the domain; storm surge, Δη95, shown as colour-shaded squares at coastal model locations; and shoreline progradation/recession, ΔCGA, shown as colour-shaded circles at beach locations. Results shown for sections (d) 144–146° E, (e) 146–148° E, and (f) 148–150° E of Fig. 1.
3.3 Relationship between waves, storm surge, and shoreline change
As previously shown at the global scale by Luijendijk et al. (2018) and Ghanavati et al. (2023), recession/progradation rates vary in magnitude and sign on relatively small spatial scales. This is because sediment transport can be offshore/onshore as well as longshore. In the case of non-equilibrium longshore transport of sediment, one would expect some beaches to recede, whilst others receive sediment from these beaches and hence prograde. Ghanavati et al. (2023) speculated that coastlines that show such non-equilibrium behaviour may be responding to long-term changes in the environmental forcing provided by trends in waves and storm surge. A causal relationship is, however, complicated by other variables that may have a larger impact on beach position. These additional factors include the availability of sediment supplied to beach compartments from fluvial sources and the impacts of human-induced interventions such as coastal structures and beach nourishment (Ranasinghe, 2016). Ghanavati et al. (2023) limited recession/progradation data to values in the range ± 1 m yr−1 to confine the datasets to changes that may be a result of long-term processes rather than fluvial and human-induced influences, which tend to be much larger in magnitude (Luijendijk et al., 2018).
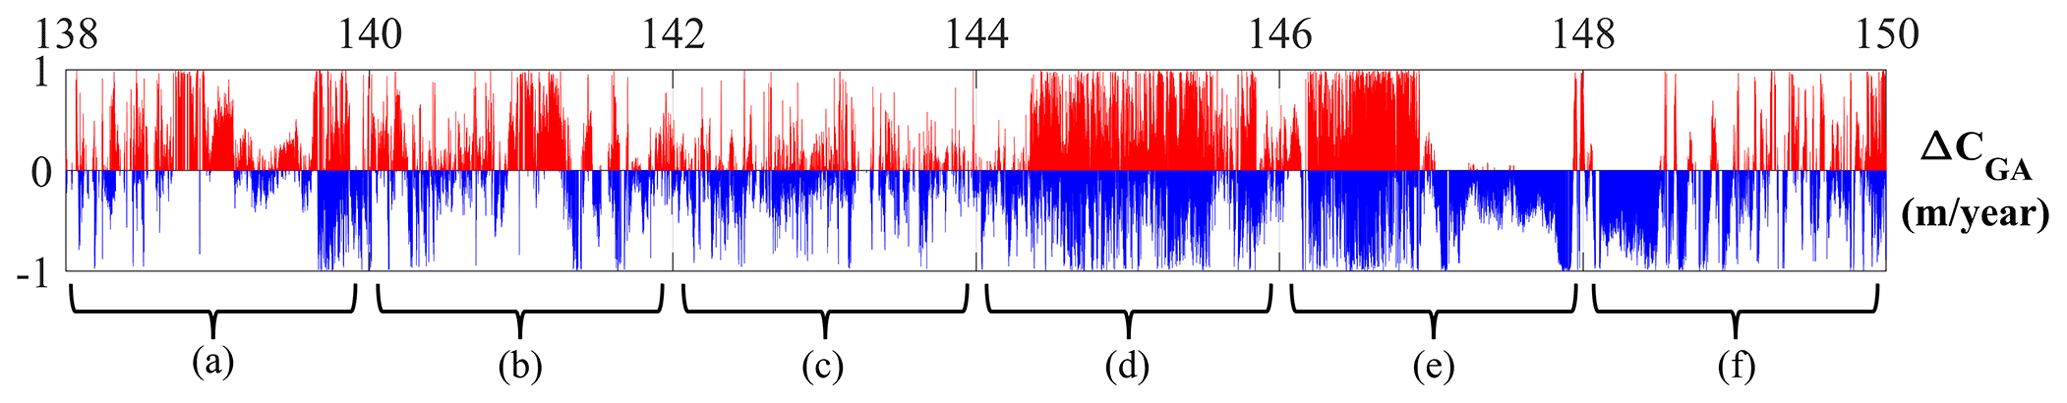
Figure 7Bar chart showing values of progradation (red) and recession (blue) ΔCGA at each coastal location of the Bishop-Taylor et al. (2021) dataset. Values are shown as a function of the longitude (horizonal axis) and units are m yr−1. The regions shown in Fig. 1 are labelled (a) to (f).
Table 1Percentage of coastal locations defined by the Bishop-Taylor et al. (2021) dataset as receding (−0.05 to −1.00 m yr−1), prograding (+0.05 to +1.00 m yr−1), or stable (± 0.05 m yr−1) over the period 1988 to 2013.
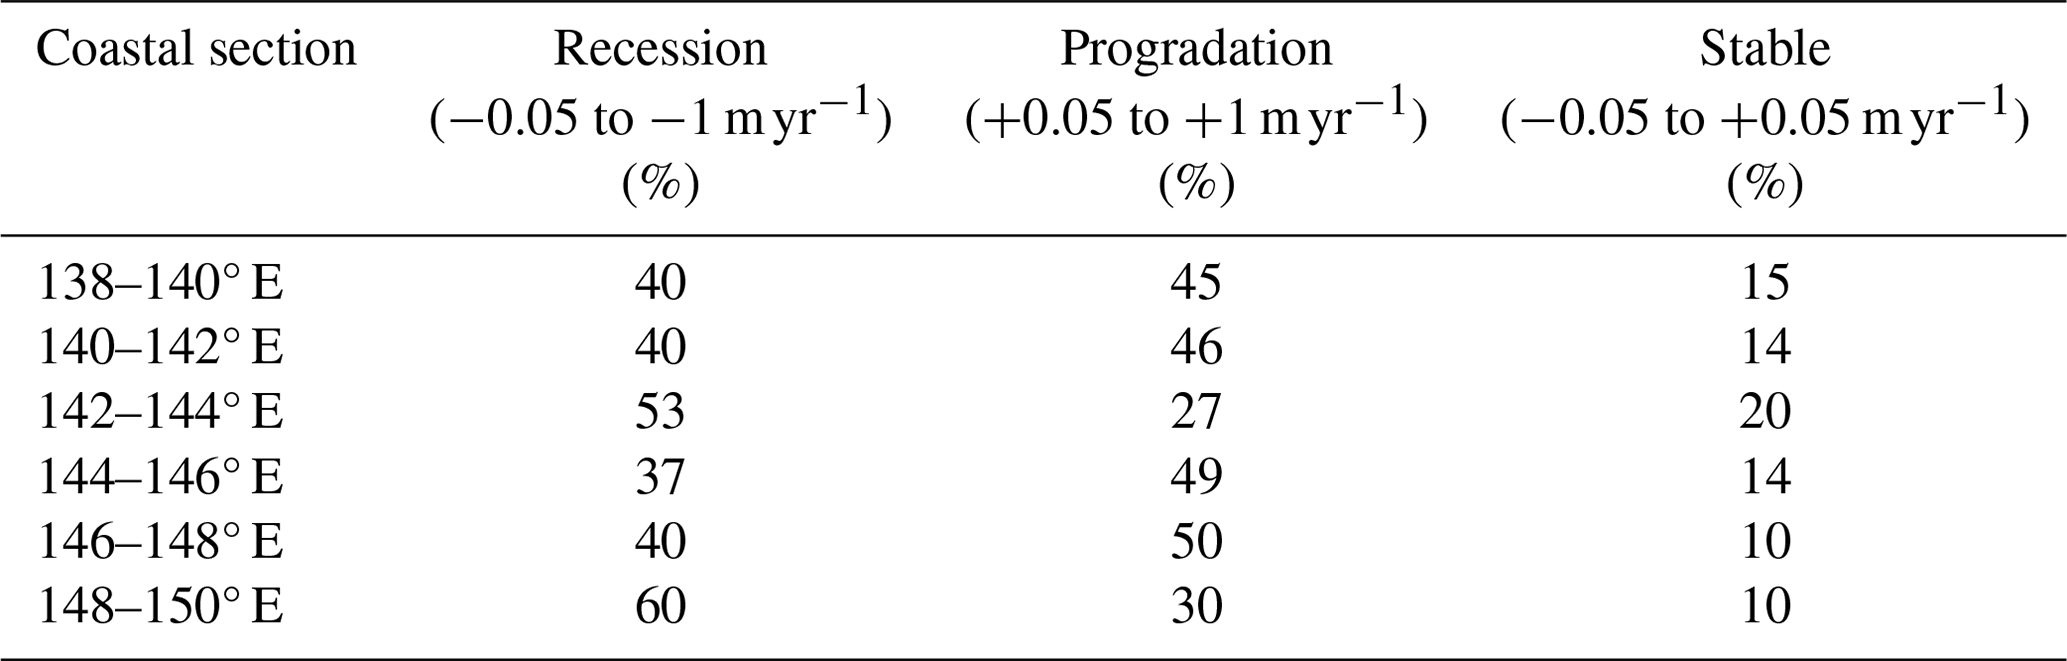
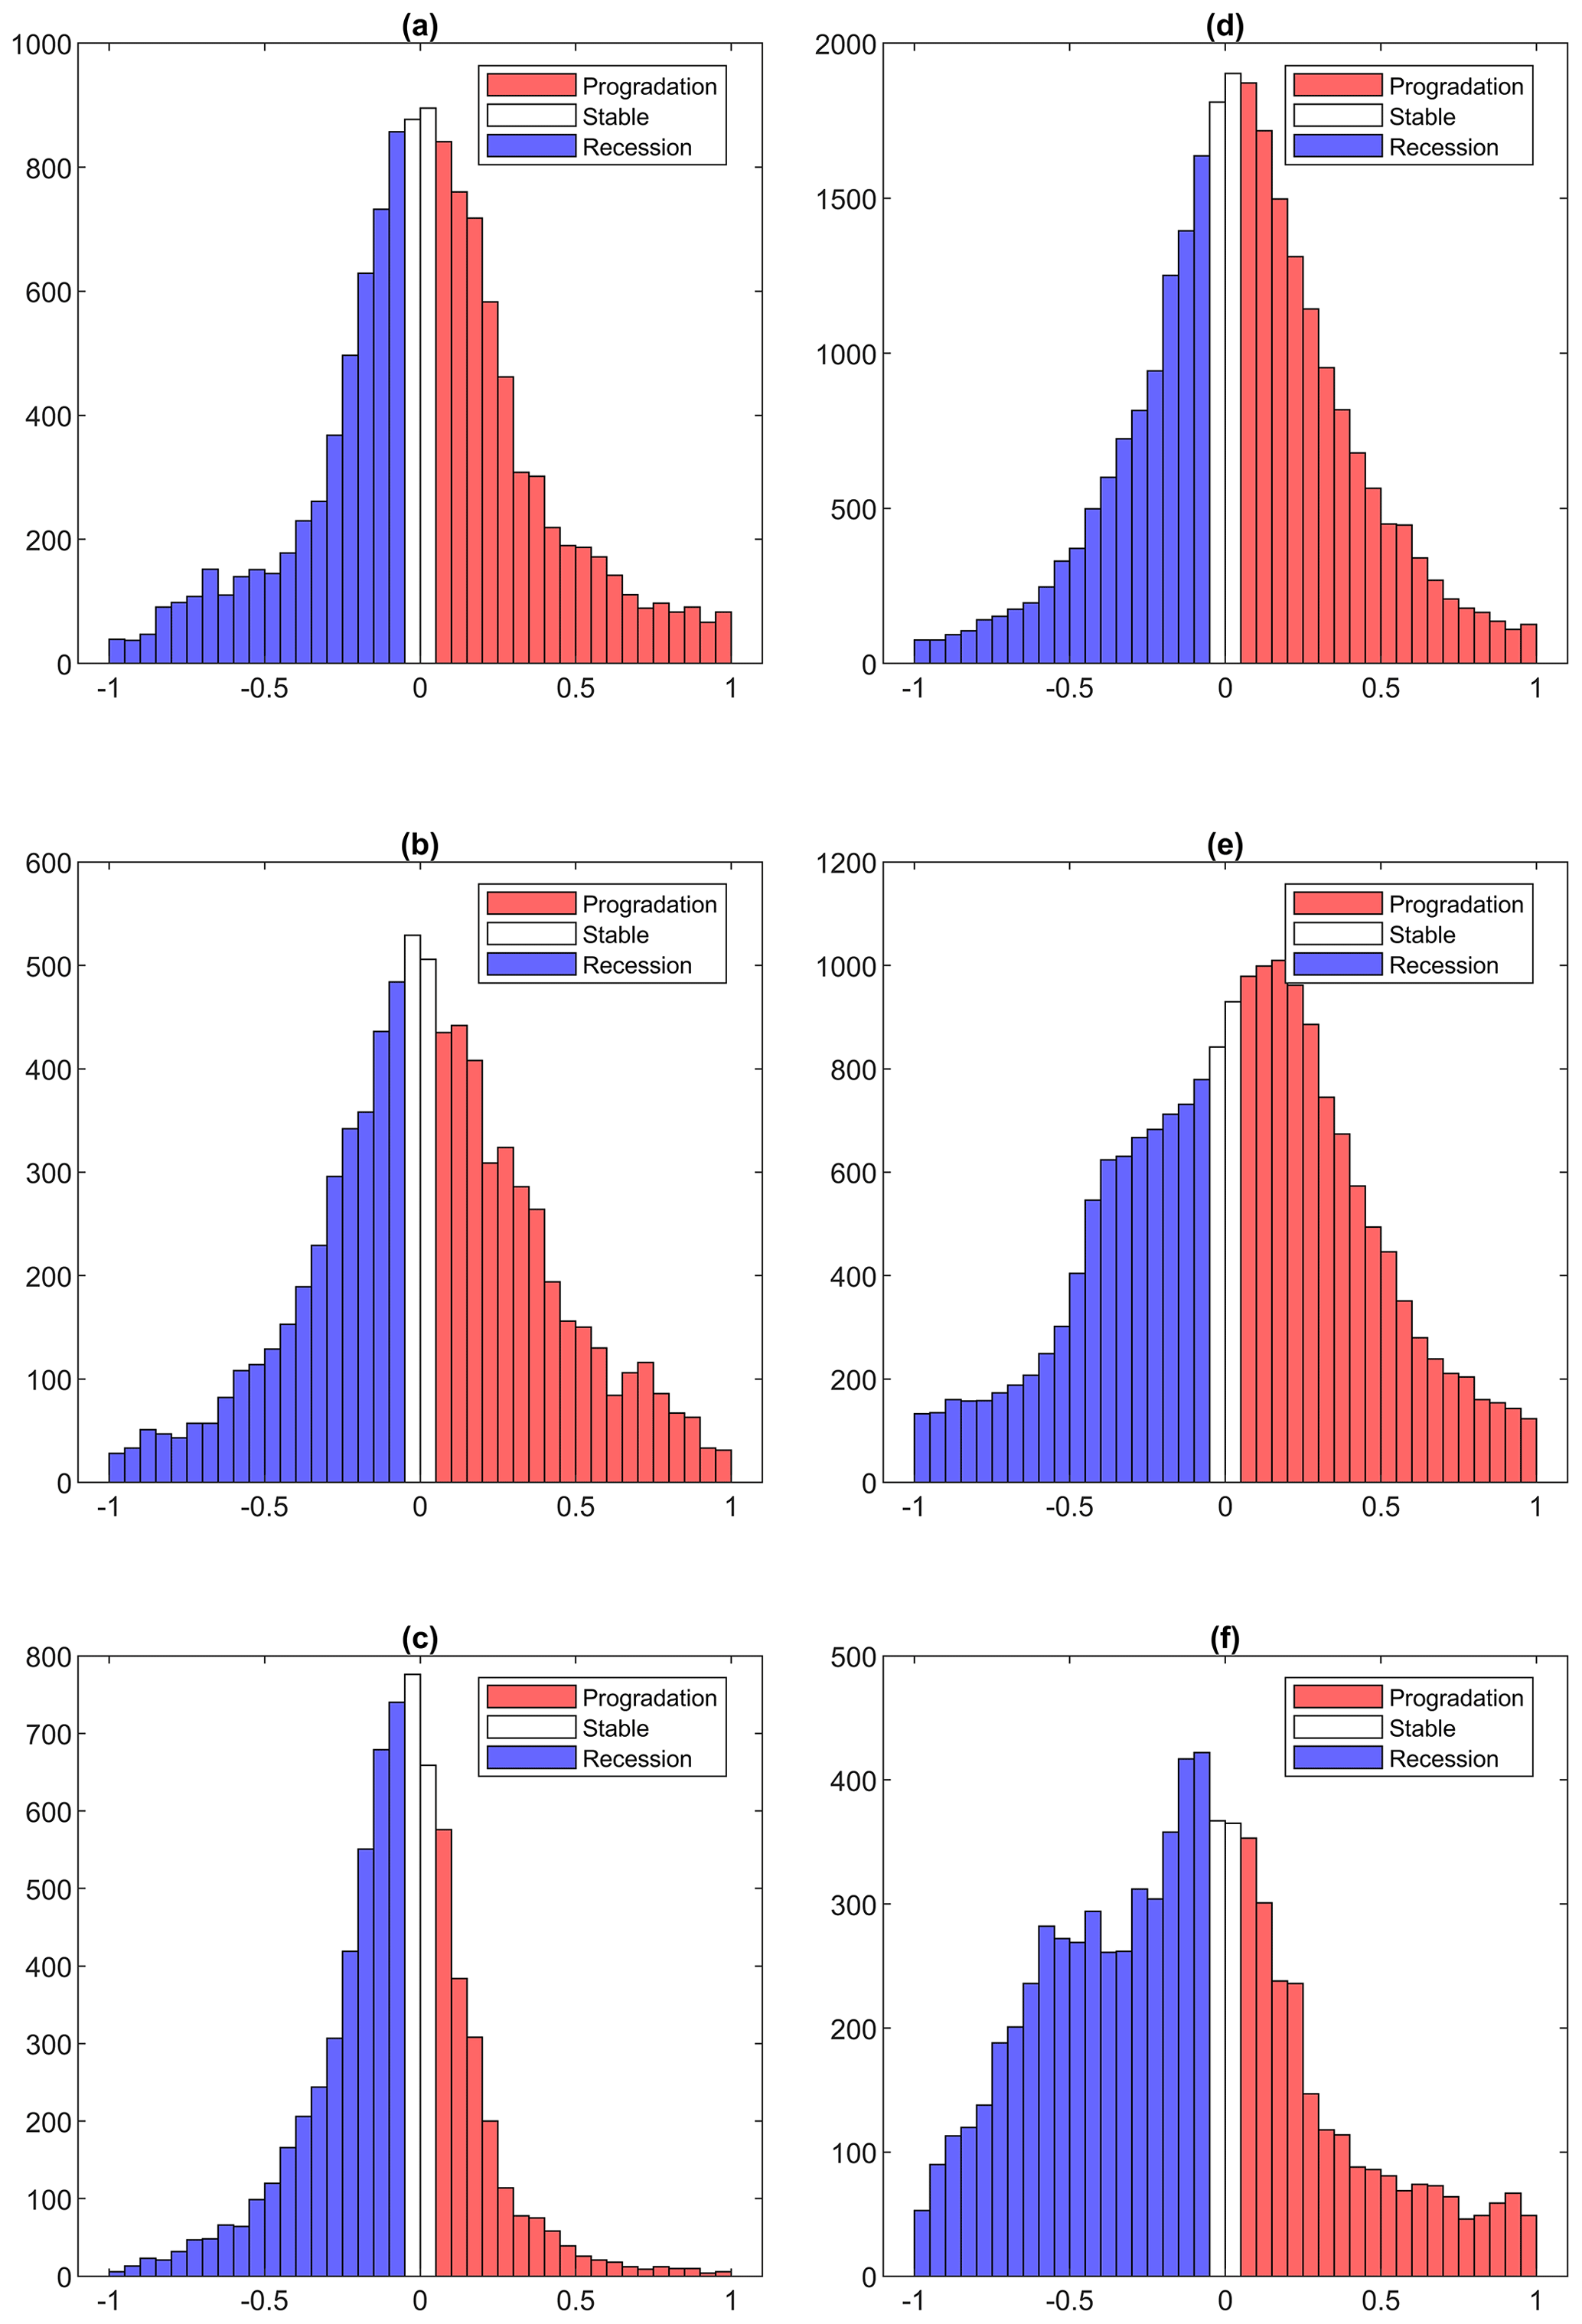
Figure 8Histograms of progradation/recession rates for each of the coastal sections over the period 1988 to 2013. From west to east: (a) 138–140° E, (b) 140–142° E, (c) 142–144° E, (d) 144–146° E, (e) 146–148° E, and (f) 148–150° E.
Therefore, following these precedents, in Figs. 3–6 the quantity ΔCGA has been filtered to retain only values in the range ± 1 m yr−1. Figure 7 shows values of ΔCGA (in the range ± 1 m yr−1) as a bar chart along the coastline from 138 to 150° E. Each of the 2° regions shown in Figs. 1 and 3–6 is marked along the longitude axis. As expected, values of ΔCGA in Figs. 3–7 show both positive (progradation) and negative (recession) values. To quantify recession/progradation, values of ΔCGA in the range −0.05 to −1.00 m yr−1 are classified as recession, values in the range +0.05 to +1.00 m yr−1 as progradation, and values in the range ± 0.05 m yr−1 as representing stable coastlines. Table 1 shows the percentage of coastal locations classified as receding, prograding, or stable under these criteria. In addition, Fig. 8 shows histograms of the distribution of the magnitudes of the values of ΔCGA.
Table 1 and Fig. 8 show that the sections (c) 142–144° E and (f) 148–150° E are predominately receding. Segment (d) 144–146° E shows quite large values of both recession and progradation (see Fig. 7) but with more locations prograding than receding. However, this region is complicated by the presence of Port Phillip Bay. The other sections (Fig. 8a, b and e) show no clear difference between the percentage of receding and prograding locations.
To understand the results shown in Table 1, we consider each of the 2° sections shown in Figs. 3–7. In these figures, values of the trend in wave energy flux, ΔCgE (Figs. 3 and 4), or wave direction, Δθm (Figs. 5 and 6), are shown as colour-shaded contours over the regions. The trend in storm surge (always negative) is shown as colour-coded squares at 5 km intervals along the shoreline, at the resolution of the water level model. The satellite-derived values of trend in shoreline location at each beach location (Bishop-Taylor et al., 2021) are shown as colour-coded filled circles, at the 30 m along-coast resolution.
Figures 3a and 5a show the region from 138° E to 140° E (section a, Victor Harbour to Cape Jaffa). This region shows relatively small positive values of ΔCgE (approximately 0.01 ) and a small anticlockwise rotation of the mean wave direction (approximately −0.02 deg yr−1 or 0.6° over 30 years). In response to these small changes in wave properties, there are no consistent changes in shoreline. In the western regions (138.6–139.2° E) the shoreline is prograding. However, this may be associated with fluvial sediments, as this region is the ocean entrance of Lake Alexandrina and the mouth of the Murray River. These results are consistent with the bar chart in Fig. 7 and the results in Table 1 and Fig. 8a that show no clear difference between recession and progradation for section (a).
Moving east to section (b), values of ΔCgE increase (Fig. 3b), and the region shows small receding shorelines (139.6–141.0° E). This changes to progradation between 141.0 and 141.2° E, west of Cape Bridgewater. This behaviour is consistent with sediment being moved along the shoreline west to east from 139.6 to 141° E by the increasing wave energy flux and the prevailing wave direction from the south-west. This sediment transport is interrupted by Cape Bridgewater, resulting in the progradation between 140.8–141.2° E. The overall balance between these regions results in no clear difference between locations receding and prograding, as seen in Table 1 and Fig. 8b.
The strong positive trend in wave energy flux is maintained east of Cape Bridgewater (section c, Fig. 3c) with a small anticlockwise rotation of the mean wave direction (Fig. 5c). Along this extended region of the coast to Cape Otway (141.6–143.6° E), the coastline shows a small recession (approximately −0.1 m yr−1 – 3 m over the measurement period of 30 years). East of Cape Otway, the magnitude of the recession decreases and the shoreline shows little net change in location. This behaviour is consistent with the reduced impact of south-westerly swell east of Cape Otway, which provides some shelter from such waves. Table 1 and Fig. 8c show that summed across the full section (c), a total of 53 % of locations are receding and only 27 % prograding.
East of Cape Otway, the wave energy flux climate near the coast decreases (Fig. 2b), as Cape Otway provides protection from the south-westerly swell, and ΔCgE also decreases as the protection provided by Tasmania becomes important (Fig. 4d). The shoreline trends, ΔCGA, are complicated by the presence of Port Phillip Bay (Figs. 4d and 6d). From Cape Otway to Inverloch (143.6–145.8° E), there is relatively little change in ΔCGA. The relatively small region from Inverloch to Wilson's Promontory (145.8–146.4° E) shows a receding shoreline, previously noted in studies of the area (Leach et al., 2023). As a result, there are no clear overall differences between recession and progradation for this section (Table 1 and Fig. 8d). However, if one considers just the ocean beaches (excluding Port Phillip Bay in Figs. 4d and 6d), then there is a small recession along the entire coastline of section (d).
East of Wilsons Promontory, the coastline is characterized by very long beaches and barrier islands (Ninety Mile Beach). This region from 147 to 149.6° E (Wilsons Promontory to Cape Howe; Figs. 4e, f and 6e, f) is characterized by a large anticlockwise rotation of the mean wave direction. The region immediately east of Wilsons Promontory (146.5–147° E) shows strong progradation. The remainder of this extended coastline, however, shows a consistent recession of approximately −0.5 m yr−1 (15 m over the measurement period), particularly in section (f). This section shows the strongest recession of any extended section, with Table 1 showing 60 % of locations receding and only 30 % prograding. As noted above, the dominant swell in this region is from the south-east, and although the changes in wave energy flux are small, there has been a significant anticlockwise rotation of the wave direction over the study period. This results in the wave direction gradually becoming more shore parallel. Therefore, the shoreline change noted above is consistent with an increase in longshore drift (east to west), with sediment being accumulated to the east of Wilsons Promontory. We should also note that this area east of Wilsons Promontory is one of the few estuarine environments along the entire Victorian coast, and hence some of the observed progradation may be due to fluvial deposits and ebb-tide delta formation (Konlechner et al., 2020).
The results above use the percentage of coastal locations prograding or receding as the measure of whether the beach is responding to long-term changes in waves and/or storm surge. As such, it does not consider the magnitudes of the progradation or recession. Figure 8 shows histograms of the magnitudes of the progradation/recession rates for each coastal section. The figure confirms the results above, showing that sections (c) 142–144° E and (f) 148–150° E are clearly receding with other sections less clear, as explained for each section above.
In the above analysis, we speculate that changes in wave energy flux, ΔCgE, and mean wave direction, Δθ, are the primary drivers of the observed changes in shoreline. The observed data support this speculation. The Supplementary material shows plots similar to Figs. 3–6 for changes in the other related quantities: significant wave height, ΔHs (Fig. S1a–c and d–f in the Supplement), extreme significant wave height, (Fig. S2a–c and d–f in the Supplement), mean wave period, ΔTm (Fig. S3a–c and d–f in the Supplement), and number of extreme wave events, (Fig. S4a–c and d–f).
Ghanavati et al. (2023) found that at the global scale, they could not distinguish a clear relationship between modelled (and observed) changes in wave energy flux and storm surge and changes in shoreline position over the last 30 years. The present dataset considers these relationships at a higher resolution for the region of south-east Australia. This region is important in that it is an area with major spatial variations in wave energy flux climate (mean conditions) and some of the largest coastal trends in wave energy flux and mean wave direction globally in the last 30 years. In addition, both high-resolution coastal wave and storm surge hindcasts are available, as well as high-resolution observations of shoreline changes. As such, this is a unique region to determine if observable changes in shoreline position are evident as a consequence of long-term changes in wave (and/or storm surge) climate.
The results show clear changes in shoreline position that are consistent with positive trends in wave energy flux and changes in mean wave direction. In the western regions of the domain, the mean wave direction is from the south-west, and there have been positive trends in wave energy flux, ΔCgE, of approximately 14 % (6/43 kW m−2). This appears to have resulted in non-stationary longshore drift from west to east and shoreline changes of approximately 3 m over the 30 year study period.
In the central regions of the study domain, the mean wave energy flux and trends in wave energy flux both decrease, as the island of Tasmania provides protection from the south-westerly swell. In this region there are no consistent trends in shoreline position, with a similar number of coastal locations receding and prograding. However, ocean beaches do show a small amount of recession.
To the eastern end of the study domain, the protection provided by Tasmania and the deep-water anticlockwise rotation of the mean wave climate mean that the wave shadow of Tasmania results in a relatively large anticlockwise rotation of the mean wave direction (up to 6° over the last 30 years). These changes in mean wave direction appear to be driving the non-stationary behaviour of the beach systems in the region, with the coastline from 146 to 149° (approximately 300 km) receding by up to 30 m over the 30-year study period.
The results presented in this analysis are consistent with a study of this same region by Konlechner et al. (2020) using lower-resolution shoreline change data (Luijendijk et al., 2018). The shoreline change “hot-spots” of that study are consistent with the present results. The results of the present study are also consistent with the global findings of Ghanavati et al. (2023). Here, we find that long-term changes in wave climate can apparently drive long-term changes in beach location but that relatively large changes in wave energy flux and/or direction are required to produce measurable changes in beach position. As noted, the study region has both a very energetic wave climate and some of the largest trends in this climate of any coastline. However, even in a region such as this where long-term changes in wave energy flux are relatively large, the resulting changes in beach location are only approximately 1.0 m yr−1 or 30 m over the study period.
In the present analysis, we speculate that the observed changes in shoreline position in the western section of the domain are driven by non-stationary longshore drift from west to east with sediment transport being intercepted by Cape Bridgewater. Such behaviour is consistent with the observed increases in wave energy flux and the predominately south-westerly swell. In the eastern sections of the domain, we speculate that there is sediment transport from east to west, intercepted by Wilsons Promontory. This speculation is consistent with the predominately south-easterly swell in the region and the observed anticlockwise change in mean wave direction over the study period.
Although such speculation is consistent with the datasets, other processes may also have an impact on shoreline change. The most obvious such change is sea level rise, which could be expected to cause shoreline recession. Observations (Watson et al., 2015; Nerem et al., 2018) indicate that in recent years, sea level rise in the Australia region has been approximately 3 mm yr−1. The bed slope along the south-eastern coast of Australia is on average approximately 1:100 (Athanasiou et al., 2019). Therefore, application of Bruun's rule (Bruun, 1962) would suggest a uniform recession of approximately 0.3 m yr−1. Such a value is smaller than but comparable to the observed recession in the western and eastern portions of the study domain. Recession due to sea level rise, however, would not account for the observed progradation west of Cape Bridgewater or east of Wilsons Promontory. In addition, Bishop-Taylor et al. (2021) indicate that over their full dataset for Australia, approximately the same number of beaches are receding (11.1 %) as prograding (11.0 %). Table 1 indicates that for the present study region this is also the case. Sea level rise would be expected to result in a net recession of beaches. In contrast, non-equilibrium longshore drift driven by changes in wave climate will cause some beaches to recede whilst other prograde.
Therefore, we conclude that the present results are more consistent with the impacts of changes in wave climate rather than those of sea level rise.
Although the present study is regional, it has global implications for the magnitude of changes in shoreline response, which may occur in other regions of the world under future projections of changes in wave climate. The present study clearly shows that impacts of changing wave climate will have strong regional characteristics and that it is important to consider the unique nature of each region in determining potential impacts. The response to individual coastal compartments will differ in terms of the magnitude of the response and even the sign (recession versus progradation).
As noted, the present analysis provides the first evidence of a causal relationship between long-term climate trends in waves and shoreline change. It does, however, have a number of limitations that should be addressed in future research. These future studies could include the following points.
-
Detailed sediment transport modelling to assess whether the observed changes in wave energy flux and wave direction would be expected to result in non-stationary longshore drift on the magnitude observed in the recorded shoreline position.
-
The extraction of shoreline position from relatively low-resolution satellite images is computationally challenging. The Bishop-Taylor et al. (2021) dataset represents a significant advance in resolution and accuracy. Further developments in the use of artificial intelligence approaches to determining shoreline position are expected to further reduce errors in such data.
-
The present analysis is limited to south-east Australia, as there were high-resolution datasets of long-term changes in waves, storm-surge, and shoreline position available for this region. Dedicated projects modelling specific areas for the purpose of better determining the relationships between changes in these quantities would better quantify the likely impacts of future changes on vulnerable shoreline.
All data used in the paper and code for the analysis are available from the authors upon request.
The supplement related to this article is available online at: https://doi.org/10.5194/nhess-24-2175-2024-supplement.
MG: data curation, investigation, writing – original draft, and writing – review and editing. IY: conceptualization, investigation, supervision, writing – original draft, and writing – review and editing. EK: writing – review and editing. JL: writing – review and editing.
The contact author has declared that none of the authors has any competing interests.
Publisher's note: Copernicus Publications remains neutral with regard to jurisdictional claims made in the text, published maps, institutional affiliations, or any other geographical representation in this paper. While Copernicus Publications makes every effort to include appropriate place names, the final responsibility lies with the authors.
This paper was edited by Animesh Gain and reviewed by two anonymous referees.
Androulidakis, Y. S., Kombiadou, K. D., Makris, C. V., Baltikas, V. N., and Krestenitis, Y. N.: Storm surges in the Mediterranean Sea: variability and trends under future climatic conditions, Dynam. Atmos. Oceans, 71, 56–82, 2015.
Athanasiou, P., van Dongeren, A., Giardino, A., Vousdoukas, M., Gaytan-Aguilar, S., and Ranasinghe, R.: Global distribution of nearshore slopes with implications for coastal retreat, Earth Syst. Sci. Data, 11, 1515–1529, https://doi.org/10.5194/essd-11-1515-2019, 2019.
Aydoğan, B. and Ayat, B.: Spatial variability of long-term trends of significant wave heights in the Black Sea, Appl. Ocean Res., 79, 20–35, 2018.
Barnard, P., Short, A. D., Harley, M. D., Splinter, K. D., Vitousek, S., Turner, I. L., Allan, J., Banno, M., Bryan, K. R., Doria, A., Hansen, J. E., and Kato, S.: Coastal vulnerability across the Pacific dominated by El Niño/Southern Oscillation, Nat. Geosci., 8, 801–807, 2015.
Bishop-Taylor, R., Nanson, R., Sagar, S., and Lymburner, L.: Mapping Australia's dynamic coastline at mean sea level using three decades of Landsat imagery, Remote Sens. Environ., 267, 112734, https://doi.org/10.1016/j.rse.2021.112734, 2021.
Bruun, P.: Sea-Level Rise as a Cause of Shore Erosion, Proc. American Society of Civil Engineers, https://doi.org/10.1061/JWHEAU.0000252, 1962.
Cao, Y., Dong, C., Young, I., and Yang, Y.: Global wave height slowdown trend during a recent global warming slowdown, Remote Sens.-Basel, 13, 4096, https://doi.org/10.3390/rs13204096, 2021.
Cid, A., Menéndez, M., Castanedo, S., Abascal, A. J., Méndez, F. J., and Medina, R.: Long-term changes in the frequency, intensity and duration of extreme storm surge events in southern Europe, Clim. Dynam., 46(5), 1503–1516, 2016.
Colberg, F., McInnes, K., O'Grady, J., and Hoeke, R.: CSIRO Australia Coastal Sealevel Simulations. v1, CSIRO Data Collection, https://doi.org/10.4225/08/5a7280a3a0d2a, 2018.
Egbert, G. D. and Erofeeva, S. Y.: Efficient inverse modeling of barotropic ocean tides, J. Atmos. Ocean. Tech., 19, 183–204, 2002.
Erikson, L., Morim, J., Hemer, M., Young, I., Wang, X. L., Mentaschi, L., Mori, N., Semedo, A., Stopa, J., and Grigorieva, V.: Global ocean wave fields show consistent regional trends between 1980 and 2014 in a multi-product ensemble, Commun. Earth Environ., 3, 320 https://doi.org/10.1038/s43247-022-00654-9, 2022.
Feng, J., Li, D., Li, Y., Liu, Q., and Wang, A.: Storm surge variation along the coast of the Bohai Sea, Sci. Rep.-UK, 8, 1–10, 2018.
Ghanavati, M., Young, I., Kirezci, E., Ranasinghe, R., Duong, T. M., and Luijendijk, A. P.: An assessment of whether long-term global changes in waves and storm surges have impacted global coastlines, Sci. Rep.-UK, 13, 11549, https://doi.org/10.1038/s41598-023-38729-y, 2023.
Harley, M., Turner, I., Short, A., and Ranasinghe, R.: A re-evaluation of coastal embayment rotation: The dominance of cross-shore versus alongshore sediment transport processes, Collaroy-Narrabeen Beach, southeast Australia, J. Geophys. Res.-Earth, 116, F04033, https://doi.org/10.1029/2011JF001989, 2011.
Harley, M. D., Turner, I. L., Kinsela, M. A., Middleton, J. H., Mumford, P. J., Splinter, K. D., and Phillips, M. S.: Extreme coastal erosion enhanced by anomalous extratropical storm wave direction, Sci. Rep.-UK, 7, 6033, https://doi.org/10.1038/s41598-017-05792-1, 2017.
Hemer, M.: Historical trends in Southern Ocean storminess: Long-term variability of extreme wave heights at Cape Sorell, Tasmania, Geophys. Res. Lett., 37, L18601, https://doi.org/10.1029/2010GL044595, 2010.
Hemer, M., Fan, Y., Mori, N., Semedo, A., and Wang, X. L.: Projected changes in wave climate from a multi-model ensemble, Nat. Clim. Change, 3, 471–476, 2013.
Hersbach, H., Bell, B., Berrisford, P., Hirahara, S., Horányi, A., Muñoz-Sabater, J., Nicolas, J., Peubey, C., and Radu, R.: The ERA5 global reanalysis, Q. J. Roy. Meteor. Soc., 146, 1999–2049, 2020.
Hinkel, J., Nicholls, R. J., Tol, R. S. J., Wang, Z. B., Hamilton, J. M., Boot, G., and Vafeidis, A. T.: A global analysis of erosion of sandy beaches and sea-level rise: An application of DIVA, Global Planet. Change, 111, 150–158, 2013.
Hochet, A., Dodet, G., Ardhuin, F., Hemer, M., and Young, I. R.: Sea state decadal variability in the North Atlantic: a review, Climate, 9, 173, https://doi.org/10.3390/cli9120173, 2021.
Kim, D. Y., Park, S. H., Woo, S. B., Jeong, K. Y., and Lee, E. I.: Sea Level Rise and Storm Surge around the Southeastern Coast of Korea, J. Coastal Res., 79, 239–243, https://doi.org/10.2112/SI79-049.1, 2017.
Komar, P.: Beach Processes and Sedimentation, Prentice Hall, 544 pp., 1998.
Konlechner, T., Kennedy, D. M., O'Grady, J. J., Leach, C., Ranasinghe, R., Carvalho, R. C., Luijendijk, A. P., and McInnes, K. L.: Mapping spatial variability in shoreline change hotspots from satellite data; a case study in southeast Australia, Estuar. Coast. Shelf S., 246, 107018, https://doi.org/10.1016/j.ecss.2020.107018, 2020.
Leach, C., Kennedy, D., Pucino, N., Doumtsis, S., Sorrell, K., Allan, B., Carvalho, R., Liu, J., and Ierodiaconou, D.: Measuring drivers of shoreline and subaerial beach change using limited datasets in a temperate, wave-dominated sandy system: Inverloch, Australia, Ocean Coast. Manage., 240, 106641, https://doi.org/10.1016/j.ocecoaman.2023.106641, 2023.
Liu, J., Meucci, A., Liu, Q., Babanin, A. V., Ierodiaconou, D., and Young, I. R.: The wave climate of Bass Strait and south-east Australia, Ocean Model., 172, 101980, https://doi.org/10.1016/j.ocemod.2022.101980, 2022a.
Liu, J., Meucci, A., and Young, I.: Projected wave climate of Bass Strait and south-east Australia by the end of the twenty-first century, Clim. Dynam., 60, 393–407, https://doi.org/10.1007/s00382-022-06310-4, 2022b.
Liu, J., Meucci, A., Liu, Q., Babanin, A. V., Ierodiaconou, D., Xu, X., and Young, I. R.: A high-resolution wave energy assessment of south-east Australia based on a 40-year hindcast, Renew. Energ., 215, 118943, https://doi.org/10.1016/j.renene.2023.118943, 2023a.
Liu, J., Meucci, A., and Young, I.: Projected 21st Century Wind-Wave Climate of Bass Strait and South-East Australia: Comparison of EC-Earth3 and ACCESS-CM2 Climate Model Forcing, J. Geophys. Res., 128, e2022JC018996, https://doi.org/10.1029/2022JC018996, 2023b.
Liu, Q., Babanin, A., Rogers, E., and Zieger, S.: Forty years of global wave hindcasts using the observation-based source terms: validation and geophysical applications, EGU General Assembly 2020, Online, 4–8 May 2020, EGU2020-22643, https://doi.org/10.5194/egusphere-egu2020-22643, 2020.
Luijendijk, A., Hagenaars, G., Ranasinghe, R., Baart, F., Donchyts, G., and Aarninkhof, S.: The state of the world's beaches, Sci. Rep.-UK, 8, 1–11, 2018.
Masselink, G., Castelle, B., Scott, T., Dodet, G., Suanez, S., Jackson, D., and Floch, F.: Extreme wave activity during 2013/2014 winter and morphological impacts along the Atlantic coast of Europe, Geophys. Res. Lett., 43, 2135–2143, 2016.
Meucci, A., Young, I., Hemer, Kirezci, E., and Ranasinghe, R.: Projected 21st century changes in extreme wind-wave events, Science Advances, 6, eaaz7295, https://doi.org/10.1126/sciadv.aaz7295, 2020.
Meucci, A., Young, I. R., Hemer, M., Trenham, C., and Watterson, I. G.: 140 Years of Global Ocean Wind-Wave Climate Derived from CMIP6 ACCESS-CM2 and EC-Earth3 GCMs: Global Trends, Regional Changes, and Future Projections, J. Climate, 36, 1605–1631, 2023a.
Meucci, A., Young, I. R., Pepler, A., Rudeva, I., Ribal, A., Bidlot, J.-R., and Babanin, A. V.: Evaluation of spectral wave model physics as applied to a 100-year Southern Hemisphere extra tropical-cyclone sea state, J. Geophys. Res.-Oceans, 128, e2022JC018996, https://doi.org/10.1029/2023JC019751, 2023b.
Morim, J., Erikson, L. H., Hemer, M., Young, I., Wang, X., Mori, N., and Shimura, T.: A global ensemble of ocean wave climate statistics from contemporary wave reanalysis and hindcasts, Sci. Data, 9, 358, https://doi.org/10.1038/s41597-022-01459-3, 2022.
Morim, J., Wahl, T., Vitousek, S., Santamaria-Aguilar, S., Young, I., and Hemer, M.: Understanding uncertainties in contemporary and future extreme wave events for broad-scale impact and adaptation planning, Science Advances, 9, eade3170, https://doi.org/10.1126/sciadv.ade3170, 2023.
Muis, S., Verlaan, M., Winsemius, H. C., Aerts, J. C., and Ward, P. J.: A global reanalysis of storm surges and extreme sea levels, Nat. Commun., 7, 11969, https://doi.org/10.1038/ncomms11969, 2016.
Nerem, R., Beckley, B. D., Fasullo, J. T., Hamlington, B. D., Masters, D., and Mitchum, G. T.: Climate-change–driven accelerated sea-level rise detected in the altimeter era, P. Natl. Acad. Sci. USA, 115, 2022–2025, 2018.
Paprotny, D.: Trends in storm surge probability of occurrence along the Polish Baltic Sea coast, arXiv [preprint], https://doi.org/10.48550/arXiv.1410.2547, 2014.
Ranasinghe, R.: Assessing climate change impacts on open sandy coasts: A review, Earth-Sci. Rev., 160, 320–332, 2016.
Ranasinghe, R., McLoughlin, A., Short, A., and Symonds, G.: The Southern Oscillation Index, Wave Climate, and Beach Rotation, Mar. Geol., 204, 273–287, https://doi.org/10.1016/S0025-3227(04)00002-7, 2004.
Ranasinghe, R., Ruane, A. C., Vautard, R., Arnell, N., Coppola, E., Cruz, F. A., Dessai, S., Saiful-Islam, A. K. M., Rahimi, M., and Carrascal, D. R.: Climate change information for regional impact and for risk assessment, in: Climate Change 2021: The Physical Science Basis, Contribution of Working Group 1 to the Sixth Assessment Report of the Intergovernmental Panel on Climate Change, Cambridge University Press, Cambridge, 1767–1926, 2021.
Reguero, B. G., Losada, I. J., and Méndez., F. J.: A recent increase in global wave power as a consequence of oceanic warming, Nat. Commun., 10, 205, https://doi.org/10.1038/s41467-018-08066-0, 2019.
Saha, S., Moorthi, S., Pan, H., Wu, X., Wang, J., Nadiga, S., Tripp, P., Kistler, R., and Woollen, J.: The NCEP Climate Forecast System Reanalysis, B. Am. Meteorol. Soc., 91, 1015–1057, 2010.
Sen, P.: Estimates of the regression coefficient based on Kendals TAU, J. Am. Stat. Assoc., 63, 1379–1389, 1968.
Shchepetkin, A. F. and McWilliams, J. C.: The regional oceanic modeling system (ROMS): a split-explicit, free-surface, topography-following-coordinate oceanic model, Ocean Model, 9, 347–404, 2005.
Takbash, A. and Young, I.: Long-term and seasonal trends in global wave height extremes derived from ERA-5 reanalysis data, J. Mar. Sci. Eng., 8, 1015, https://doi.org/10.3390/jmse8121015, 2020.
Timmermans, B., Gommenginger, C., Dodet, G., and Bidlot, J.-R.: Global Wave Height Trends and Variability from New Multimission Satellite Altimeter Products, Reanalyses, and Wave Buoys, Geophys. Res. Lett., 47, e2019GL086880, https://doi.org/10.1029/2019GL086880, 2020.
Vitousek, S., Vos, K., Splinter, K. D., Erikson, L., and Barnard, P. L.: A model integrating satellite-derived shoreline observations for predicting fine-scale shoreline response to waves and sea-level rise across large coastal regions, J. Geophys. Res.-Earth, 128, e2022JF006936, https://doi.org/10.1029/2022JF006936, 2023.
Vos, K., Harley, M., Turner, I., and Splinter, K.: Pacific shoreline erosion and accretion patterns controlled by El Niño/Southern Oscillation, Nat. Geosci., 16, 140–146, 2023.
Vousdoukas, M., Mentaschi, L., Hinkel, J., Ward, P. J., Mongelli, I., Ciscar, J.-C., and Feyen, L.: Economic motivation for raising coastal flood defenses in Europe, Nat. Commun., 11, 2119, https://doi.org/10.1038/s41467-020-15665-3, 2020.
Wang, X. L. and Swail, V. R.: Changes of Extreme Wave Heights in Northern Hemisphere Oceans and Related Atmospheric Circulation Regimes, J. Climate, 2204–2221, 2001.
Wang, X. L., Swail, V. R., Zwiers, W. F., Zhang, X., and Feng, Y.: Detection of external influence on trends of atmospheric storminess and northern oceans wave heights, Clim. Dynam., 32, 189–203, 2012.
Watson, C., White, N. J., Church, J. A., King, M. A., Burgette, R. J., and Legresy, B.: Unabated global mean sea-level rise over the satellite altimeter era, Nat. Clim. Change, 5, 565–568, 2015.
Young, I. and Ribal, A.: Multi-platform evaluation of global trends in wind speed and wave height, Science, 364, 548–552, 2019.
Young, I. and Ribal, A.: Can multi-mission altimeter datasets accurately measure long-term trends in wave height, Remote Sens.-Basel, 14, 974, https://doi.org/10.3390/rs14040974, 2022.
Young, I., Zieger, S., and Babanin, A.: Global trends in wind speed and wave height, Science, 332, 451–455, 2011.
Zheng, C. W. and Li, C. Y.: Analysis of temporal and spatial characteristics of waves in the Indian Ocean based on ERA-40 wave reanalysis, Appl. Ocean Res., 63, 217–228, 2017.