the Creative Commons Attribution 4.0 License.
the Creative Commons Attribution 4.0 License.
 | 01 Jul 2024
Brief communication: Lessons learned and experiences gained from building up a global survey on societal resilience to changing droughts
Marina Batalini de Macedo
Marcos Roberto Benso
Karina Simone Sass
Eduardo Mario Mendiondo
Greicelene Jesus da Silva
Pedro Gustavo Câmara da Silva
Elisabeth Shrimpton
Tanaya Sarmah
Da Huo
Michael Jacobson
Abdullah Konak
Nazmiye Balta-Ozkan
Adelaide Cassia Nardocci
This paper describes the process of creating a global survey of experts to evaluate drought resilience indicators. The lessons learned include five main points: (1) the heterogeneity in the conceptual background should be minimized before the construction of the survey; (2) large numbers of indicators decrease the engagement of respondents through the survey, and ways to apportion indicators whilst maintaining reliability should be considered; (3) it is necessary to design the survey to balance response rate and accuracy; (4) the survey questions should have clear statements with a logical and flowing structure; and (5) reaching experts with different domain experience and representing different regions is difficult but crucial to minimize biased results.
- Article
(523 KB) - Full-text XML
-
Supplement
(2738 KB) - BibTeX
- EndNote


The formulation of a global survey is a complex process that poses several challenges in both the preparation (a priori) and the evaluation of results (a posteriori) phases. In general, studies focusing on surveys and expert elicitation address a posteriori challenges, such as the data analysis tools used for samples of different sizes and compositions. However, a priori challenges are rarely addressed and represent an important and defining step in the process. For example, Baker et al. (2014) state that “while there is a rich literature on expert elicitation approaches and protocols, there is less information available on the specifics of how an elicitation is carried out”.
Harzing et al. (2013) have reviewed the issues faced in global surveys and identified cultural and language differences, which may lead to different interpretations of questions or loss of meaning, and varying response rates between countries as significant sources of bias in global surveys. ProductLab (2023) also discusses the difficulties of global surveys and provides best practices for their formulation. They also mention the challenges due to cultural and language differences and finally recommend appropriate survey timing for all countries. However, both studies focus on business and product development.
Therefore, our main motivation for writing this brief communication is due to the scarcity of papers and other materials discussing the challenges of creating global surveys on complex subjects where we face conceptual and definitional divergences – such as resilience. We believe that the challenges and problems faced during the survey-building process are often not discussed by the researchers, as doing so may weaken confidence in their final results. However, it is important to face these concerns and openly share difficulties encountered, as this sharing of such experiences can also lead to valuable new knowledge and insights gained.
In this study, we used a global survey to elicit experts' opinions on drought resilience indicators. These indicators are increasingly being used in decision support systems (DSSs) to reflect different socioeconomic, ecological, and technological conditions (WMO and GWP, 2016; Meza et al., 2019; Blauhut, 2020). Although numerous indicators of drought resilience are found in the literature, certain aspects may make them unfeasible for comparative analysis across global regions (Bachmair et al., 2016; Blauhut, 2020). The absence of spatial and temporal data, variability of measurements in different regions, and difficulty in understanding indicators can make it hard to select indicators to compose a global drought resilience index (Blauhut, 2020). However, these aspects are usually overlooked when rating the relevance of the indicators during surveys. For instance, Meza et al. (2019) have not included these critical dimensions in their comprehensive international survey of drought vulnerability indicators. Therefore, there is a need for a more in-depth analysis of the drought resilience indicators to ensure their suitability for cross-regional comparisons.
Our focus was on agricultural drought resilience linked to systems of small-scale farming for food production. By following the Sendai Framework for Disaster Risk Reduction (DRR) 2015–2030 (UNDDR, 2015), we listed and screened indicators proposed in the scientific literature for drought resilience related to food systems. The initial screening of indicators provided the basis for the expert global survey to assess the relevance, the data availability, and stakeholders' perception and understanding of these indicators in different contexts.
Due to the challenges presented in this brief communication, constructing the survey took about a year. It is important to discuss the process of formulating the survey study to prevent other researchers from encountering the same problems and improve the use and interpretation of this method. Elangovan and Sundaravel (2021) have also discussed the importance of preparing a global expert survey for any generic field. We hope to complement studies and suggestions for works in the resilience field.
Mukherjee et al. (2018) identify six strategies that are best suited to the various stages of the decision-making process and for eliciting different judgments: interviews, focus group discussions (FGDs), nominal group techniques (NGTs), Q methodology (Q), the Delphi technique, and multi-criteria decision analysis (MCDA). An interview consists of an information exchange between two or more individuals in which one of them aims to obtain information, opinions, or beliefs from the other person. The FGD is a technique in which a researcher gathers a group of people to discuss a given issue. Aside from the FGD, which aims to draw on the participants' complex personal experiences, actions, beliefs, perceptions, and attitudes, the NGT is an interactive group decision-making process primarily focused on reaching a consensus. The Delphi technique is traditionally aimed at reaching consensus through a group-based, anonymous, and iterative method. The Q, on the other hand, is a tool for understanding the primary viewpoints or opinions on an issue among a group of significant players, in which respondents are asked to rank a set of items. Finally, the MCDA assists decision-making by considering the benefits and disadvantages of several possibilities for achieving a specific objective.
Each methodological approach has advantages and disadvantages. The interview, for example, may be challenging to perform due to geographical proximity to the desired sample group (Mukherjee et al., 2017). Another example of a challenge is that FGD is dependent on participant engagement, giving researchers less control. There may be time restrictions for the Q and NGT due to participant interpretation difficulties and insufficient time to reach a consensus.
We chose the Delphi technique because it is a tool that can gather and assimilate a set of experts' opinions across geographically diverse time zones on potentially complex matters. The Delphi method has been applied to develop indices for desertification (Hai et al., 2016) and water supply (Crispim et al., 2022) and has previously been used in global surveys (Rastandeh et al., 2018). Nonetheless, the process of developing and conducting a global survey based on the Delphi method at a global scale needs to be better documented for users and requires further discussion.
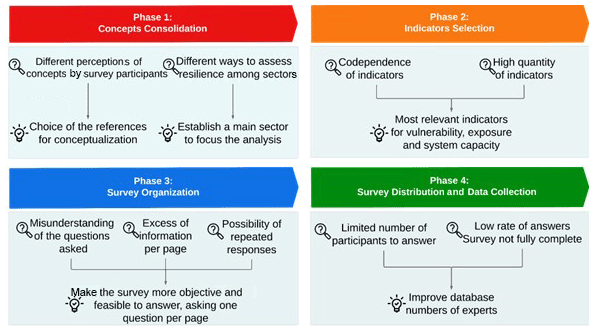
The elaboration and consolidation process of the global survey was carried out in four main phases: conceptualization (concept consolidation), indicators' selection, survey layout organization, and distribution and data collection in survey execution (Fig. 1). This section discusses the challenges encountered in each phase and how the research team addressed them using a collaborative approach. The four phases lasted 11 months, making it the most time-consuming part of the research so far. Additionally, it was a crucial part of the research since the quality of the outcomes depended on the questions and the engagement of the responders.
3.1 Phase 1: concept consolidation
The first challenge was related to the consolidation of the concepts frequently associated with drought resilience. We targeted experts from different fields, such as geophysics, engineering, economics, and social sciences, who work and live in different countries. Thus, the concepts used in the Sendai Framework, such as drought, DRR, resilience, vulnerability, system capacity, and adaptation, can be analyzed and perceived differently among participants.
The goal of disaster risk management is to increase and strengthen resilience. The UNDDR (2015) defines resilience as “the ability of a system or community to anticipate, resist, prepare, respond to and recover from an event with multiple risks, with the least possible harm to social, economic, and environmental well-being”. Several indices have been proposed over the years to represent the level of resilience of a given system to a disruptive event. In general, resilience assessment requires the identification of the risks in the system due to disruptive events and the adoption of risk management policies to prevent their occurrence or reduce their impacts along the system's chain; therefore it can be represented by a function between risk and risk management (Eq. 1).
The risk can be represented by a function that correlates the probability of occurrence of the disruptive event (H), the vulnerability of the system's different components (V), and their exposure to risk (E) so that vulnerability and exposure represent the potential impacts on the system (Merz et al., 2014) (Eq. 2). Within the disaster risk management and risk-oriented decision-making approach, the risk analysis stage is of fundamental importance and a precursor to the decision-making process.
To evaluate the risk management stage, it is important to understand the type of the proposed risk mitigation action, its temporal component, and the magnitude of the impacts if the proposed action fails. According to these components, the actions can be correlated with the different system capacities that help reduce the disaster risk and further impacts, improving resilience, such as adaptive capacity (AC), coping capacity (CC), and transformative capacity (TC) (Eq. 3).
3.2 Phase 2: indicator selection
Droughts can have significant impacts on different economic and social sectors, and likewise, economic and social features will impact how drought is experienced. However, assessing the drought resilience of each sector can be different. Initially, we focused on agriculture, but we realized that system capacity and vulnerability to droughts can vary significantly within this sector. Small farms produce a significant part of the world's food production (Lowder et al., 2021), and they are more susceptible to climate change and extreme events than commercial farms (Morton, 2007). Therefore, we prioritized the selection of indicators related to small farms' drought system capacity and vulnerability. We observed that prioritizing indicators specific to small farmers' drought system capacity and vulnerability allows for tailored insights and interventions to address their unique needs. However, such a specificity comes at the cost of broader applicability and requires more intensive data collection and analysis. These observations highlighted a trade-off between the targeted application effectiveness and the generalizability of a risk management index, which is overlooked in the literature.
We compiled the list of indicators to be evaluated in the global survey through a structured literature review. At the beginning of the process, we identified over 136 indicators that are frequently used in the literature (Sect. S1 in the Supplement). We observed that indicators related to the hazard component of the agricultural drought risk were already well established and could also be easily obtained from global open databases or even remote sensing satellite data through geoprocessing. For example, the Global Drought Observatory (https://edo.jrc.ec.europa.eu/gdo/php/index.php?id=2000, last access: 18 June 2024) already monitors hazard indicators globally. Therefore, our focus in this survey was to identify indicators related to risk impacts (vulnerability and exposure) and risk management actions to increase resilience (adaptive, coping, and transformative capacity).
There is a myriad of indicators for evaluating drought and its impact on agriculture. Two issues were raised from this initial list. (1) There were too many correlated indicators (e.g., Gini index and poverty rate). Including the codependent indicators would affect the final index by unintentionally attributing a higher weight to this factor. (2) Including all 136 indicators would make the survey too extensive and exhaustive, which could affect the response rate.
Therefore, narrowing the selection of the final list of indicators was made through three steps. The first step was to remove hazard indicators, as previously discussed. In this step, 31 hazard-related indicators were removed. In the second step, we removed codependent indicators from the list, keeping the ones with more availability and easy-to-access data. For example, from the Gini index and poverty rate, we opted for the poverty rate since it is a more direct measurement and easier to obtain in different contexts. This process involved interactively eliminating 28 codependent indicators through group discussion sessions with members of our research team. The third step was reducing the total number of indicators to avoid the survey becoming too extensive and exhaustive to answer. In this stage, each member of the research team independently rated the relevance of the indicators through a form available only to the group, based on the seven questions given by WMO and GWP (2016). After a group discussion, we selected 33 indicators considering the independent ratings of the research team.
In the next stage, we sought independent expert opinions concerning the indicators chosen and the overall structure of the survey. External experts recommended three additional indicators after the first pilot run of the survey. In the end, we had a list of 36 indicators (Table 1).
Table 1List of indicators evaluated in the survey.
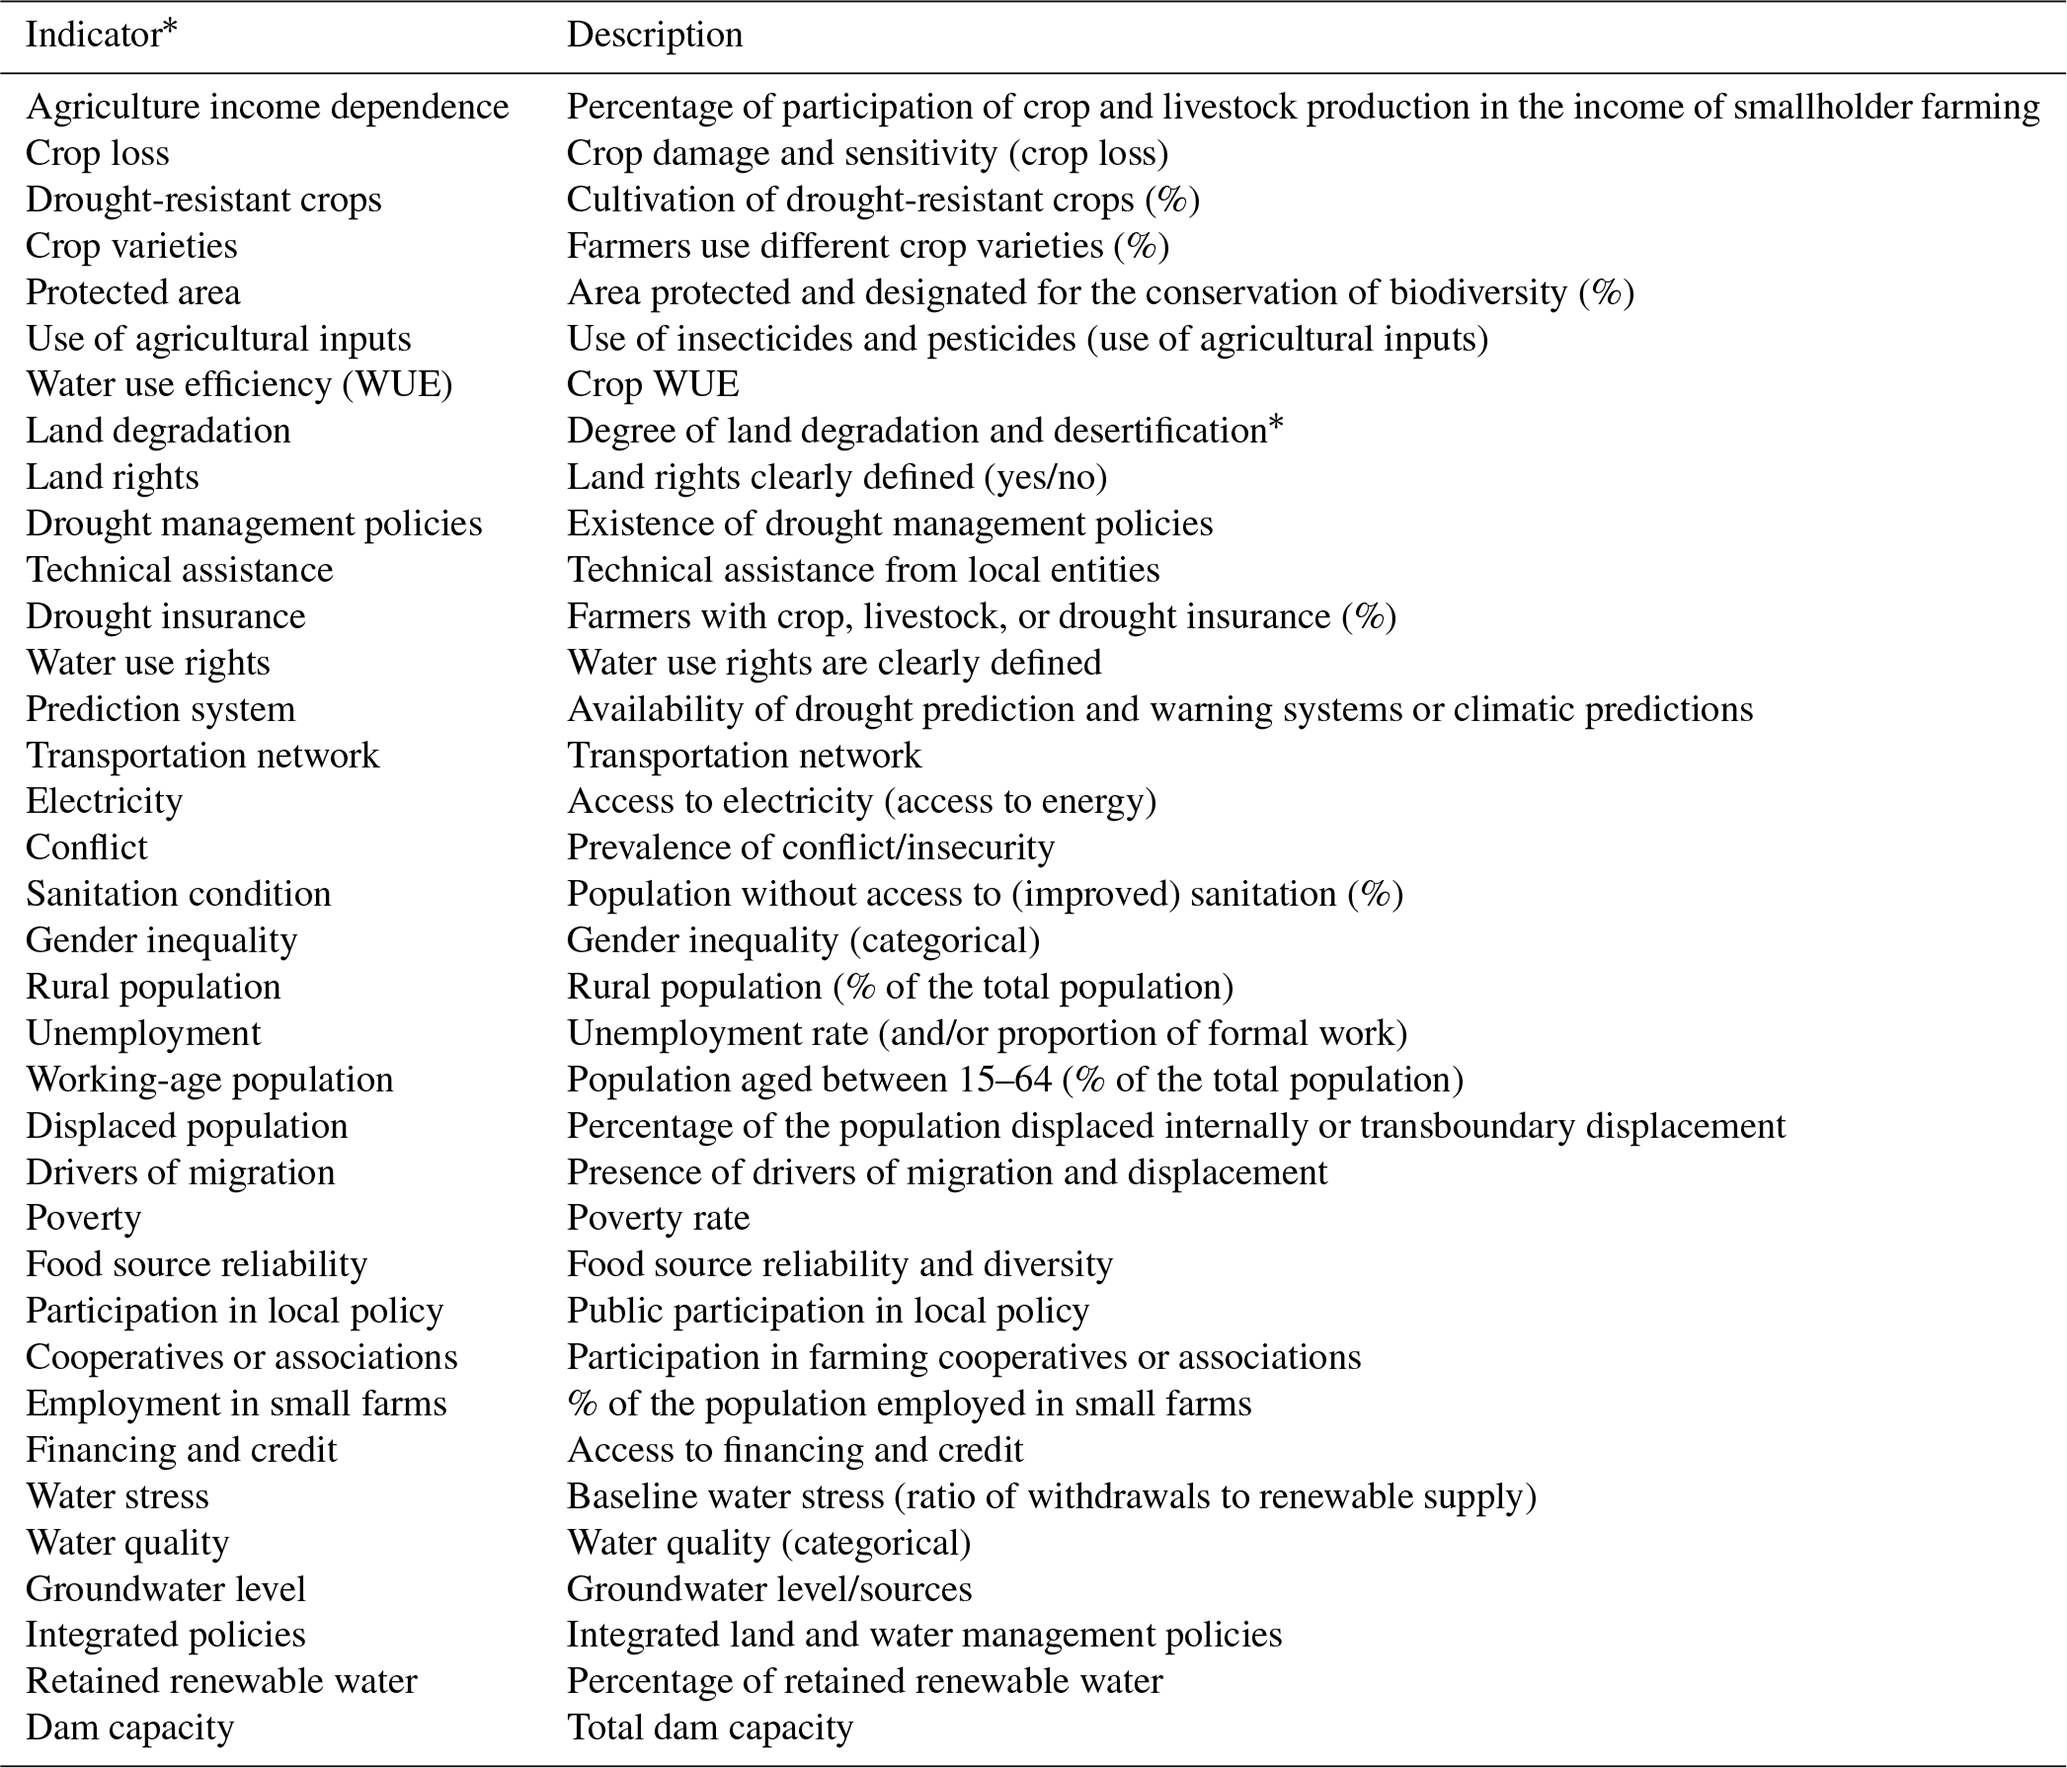
* The reference to each indicator is provided in Sect. S1 – Table S1.
Additionally, during our internal group discussion sessions, one of the concerns was that some indicators are very interesting and relevant, but they are challenging to obtain. In this sense, we identified critical complementary questions on data quality that are usually not asked in surveys (where all the relevant data are assumed to be equally accessible and understandable). We asked the experts to rate the usability of indicators in terms of relevancy, ease of understanding, accessibility, and objectivity (we included a definition of each one at the beginning of the formulary).
The choice of these specific metrics came from Sweya et al. (2021), who identified five essential attributes for the social resilience indicators of water supply systems: affordability, availability, reliability, simplicity, and transparency. They found that data availability, reliability, and affordability were the most limiting factors when selecting indicators in Tanzania. In this sense, as the focus of the project was the Global South, our group selected the three metrics adapted from Sweya et al. (2021) to be complementary to the relevancy: (1) understanding – to represent the simplicity, (2) accessibility – a single attribute to account for affordability and availability, and (3) objectivity – an additional attribute that we chose to evaluate how objective the final measure is (since some of our social indicators are political measurements and may be subjective).
3.3 Phase 3: survey organization
Another challenge was presenting the indicators and relevant information effectively in an online survey instrument to make viewing, understanding, and comparing the indicators as straightforward as possible. The survey design was made based on guidelines for operationalizing the Delphi method (Hasson et al., 2000) and the suggestions made by Elangovan and Sundaravel (2021). The latter provided a template to validate the survey instrument. However, they presented a generic document, and we still needed help related to the resilience field study. Therefore, we have improved our survey design based on the evaluation of different literature that used the Delphi method to access resilience indicators (e.g., Alshehri et al., 2015; Ogah et al., 2021).
During the process of identifying the best layout, we tested different survey question designs. We created several prototype surveys that varied in terms of question layout, types of questions (such as Likert scales versus ranking), number of scales, and how the definitions of concepts were presented. To evaluate each prototype, we considered the ease of understanding, cognitive load, and the time required to complete the survey. These survey prototypes were modified and combined based on the user experience. After the first consolidation of the survey design to be used, a pilot pre-test was carried out with a small external group of experts who were asked for their opinions on the final design and indicators. We used the same process to design the second stage of the survey, using the Delphi method.
In the final selected design, each page of the survey refers to one specific attribute and rates of importance that should be given to each indicator. This format was chosen because it allows for a comparison between the indicators when answering, reducing the possibility of repeated responses for all indicators and allowing a hierarchy between them and greater fluidity in conducting the survey.
Each indicator could be rated on a three-point scale: “low”, “medium”, and “high”. The definition of this point scale changes according to the metric that is being evaluated. The category “don't know” was included to filter pseudo-opinions. On the last page of the survey, we asked for some demographic information, like area of expertise, years of experience, region of analysis, etc. The final format of the survey (Sect. S2) was consolidated after all members of the group and the piloting phase group answered the survey and did not provide any new inputs or suggestions. For the second stage of the survey, we used the same layout, but we included the percentage of the first-phase responders at each level of the scale for each indicator and each metric.
3.4 Phase 4: survey distribution and data collection
The final challenge involved identifying and recruiting the experts to send the survey. To obtain the opinions of experts from different backgrounds and socioeconomic contexts, a list of experts was created from recently published papers on droughts in the Web of Science and Scopus databases. The group members also shared the survey in their networks. As a result of the disproportionate amount of research conducted in countries and regions in the Global North due to economic factors, scientific databases have a bias toward the Global North in terms of institutional affiliation. Therefore, it is important to address and remedy this issue in the recruitment process. After this initial data collection, a distribution analysis was carried out about continents and countries to assess whether there was a need to complement any specific region.
Despite attempts to assemble the greatest diversity of experts' backgrounds on drought resilience analysis, the study had a limitation in that it had a large concentration of responses coming from academic experts (approximately 80 %). This was due to the difficulty in accessing the information of other practitioners and stakeholders since there is no unified database, as is the case with Scopus and Web of Science for researchers. For future surveys, we recommend trying to reach out to existing policy and practitioner networks focused on drought to reach other types of stakeholders.
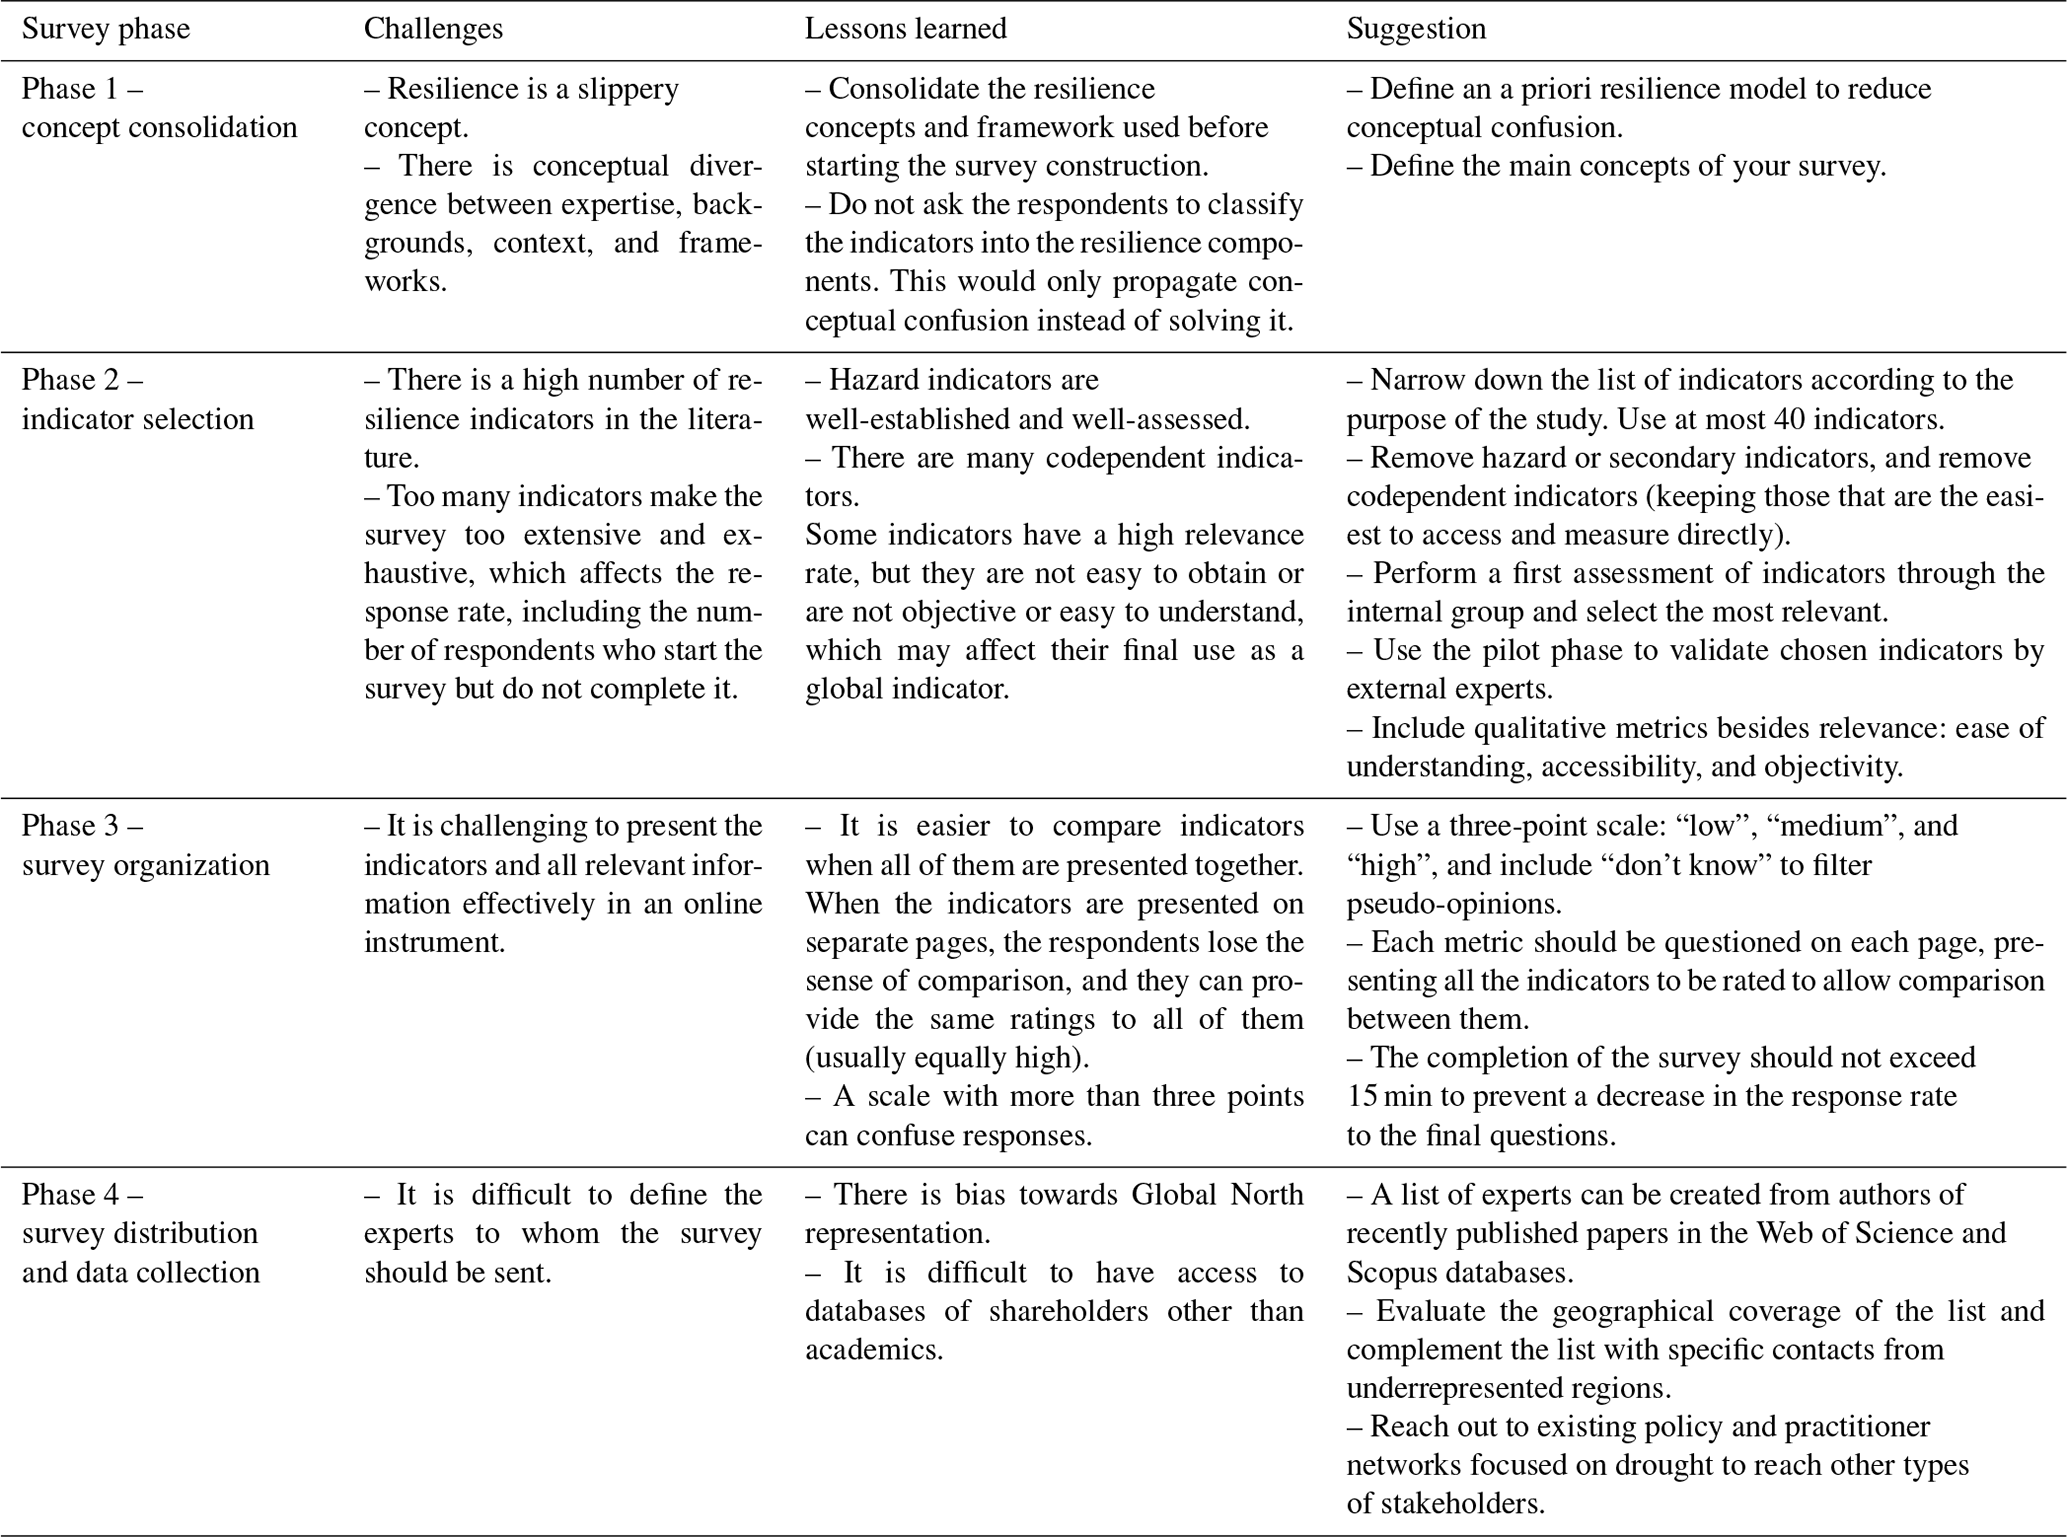
Table 2Summary of challenges, lessons, and recommendations for building a global survey.
The survey was approved by the Institutional Review Board (IRB) of Penn State University for human subject protection (IRB no. STUDY00021208), and a consent form was provided to all the participants before starting the survey. We customized the research consent form to align with the legal and ethical standards of the participant's country as much as possible. For example, the survey presented a different consent form that accurately reflects the customized considerations of the European Union. After the survey concluded, we received responses from 326 experts from 46 countries, with 120 complete responses. The data obtained from the survey and their a posteriori analysis are presented in Sass et al. (2023). For the second stage of the survey (as required by the Delphi method), we obtained 32 respondents from 21 countries.
In this study, a great effort was made to understand how to equalize regional issues during the construction of an international survey aiming at identifying indicators to compose a global index to evaluate resilience to agricultural droughts in the context of small farms for food production. The challenges encountered a priori in the application of the method (e.g., construction of questions and engagement of participants in the process) are not explained and discussed in length in the academic literature despite being crucial for the quality of the data obtained. In Table 2, we summarize our processes for designing such a survey, highlight the main challenges, and present suggestions for working around them.
Next, we present and discuss the five main points to be considered when conducting reliable and representative research on a global scale.
-
There are different concepts related to resilience, especially concerning vulnerability and system capacity, which can be very context dependent.
To deal with this challenge in the construction of a global indicator, we suggest choosing an internationally relevant and well-consolidated resilience framework (in this case, the Sendai Framework due to its relevance in public policies), rigidly adopting the presented settings. Additionally, to account for differences in local contexts, in addition to the relevance of each indicator, we utilized complementary attributes, such as ease of understanding, accessibility, objectivity, and temporal consistency.
-
There are many indicators in the literature. Surveys containing all the indicators become tiresome to answer, decreasing the engagement, response rate, and quality of the answers obtained.
In our experience, including more than 40 indicators already significantly reduced engagement and consistency in responses. Thus, the choice of the final and reduced list of indicators should be based on the objective of the research and the system evaluated, with only the priority indicators chosen for representativeness in different local contexts of risks.
-
It is important to identify the best survey design that clarifies questions and definitions to reduce misunderstanding and divergent answers across different contexts (expertise and region-wise).
Before making the survey available to the experts and practitioners, it was essential to study its face and conceptual validity by our internal research team and externally by a smaller group of experts during a pilot phase. Face validation refers to whether the participants can interpret the survey items according to their intended meaning. The conceptual validity ensures that survey items accurately represent the theoretical concept that they are intended to represent. These validation processes will help to identify and correct poorly prepared items and ill-defined concepts to ensure the quality of the survey responses. Providing conceptual definitions of the scales can improve the face validity of surveys.
-
The survey design must be clean and flow well between questions.
Respondent engagement from the beginning to the end of the survey is crucial for maintaining consistent results for all questions. Therefore, the format of the applied survey is important. The survey should facilitate a quick and clear comparison of the main components being evaluated – in this case, the indicators. To minimize cognitive load, questions regarding different attributes should be organized into separate sections. Response time should be 15 min.
-
It can be difficult to list participants from different areas of knowledge, professional experience, and regions/countries. The small number of respondents for each area affects the significance of the analysis a posteriori.
There is a lack of databases for practitioners and stakeholders other than experts, which makes it difficult to gather names of other actors usually involved in decision-making processes. Suggestions to obtain a more diverse participant base, including public and private sectors and international organizations, include creating their buy-in and support to share the survey with their members and employees. Developing collaborations with international agencies involved in dealing with disasters, especially droughts (e.g., IDMP, UNCCD, WMO, FAO) may help with their engagement and participation in the survey. Moreover, even in academic databases, there is still a great bias for international research to be centered on countries of the Global North, in terms of institutional affiliation. Since the countries of the Global South are generally the ones with the greatest difficulty in coping with the risks of droughts, studies of indicators benefit a lot by taking into account their perspectives.
By sharing our experience in the process of constructing a global survey, we hope to help other researchers by pointing out the key difficulties one may encounter and the measures we followed to address them.
The data regarding the full survey are available in Sect. S2 in the Supplement.
The supplement related to this article is available online at: https://doi.org/10.5194/nhess-24-2165-2024-supplement.
All authors contributed to the development and execution of the global survey, which is part of the Management of Disaster Risk and Societal Resilience (MADIS) project, funded by the Belmont Forum. MBdM, MRB, KSS, and ACN contributed to the writing, reading, and reviewing of the paper. AK, NBO, EMM, GJdS, PGCdS, and MJ contributed to the paper revision and reading.
The contact author has declared that none of the authors has any competing interests.
Any opinions and findings expressed in this material are of the authors and do not necessarily reflect the views of the NSF.
Publisher’s note: Copernicus Publications remains neutral with regard to jurisdictional claims made in the text, published maps, institutional affiliations, or any other geographical representation in this paper. While Copernicus Publications makes every effort to include appropriate place names, the final responsibility lies with the authors.
This article is part of the special issue “Drought, society, and ecosystems (NHESS/BG/GC/HESS inter-journal SI)”. It is not associated with a conference.
This study was funded by the São Paulo Research Foundation (FAPESP) under grant nos. 2019/23393-4 and 2022/15054-8. The work of the US authors is sponsored by the National Science Foundation (NSF) (grant no. 2039506). The work of the UK authors is funded by the Engineering and Physical Sciences Research Council (EPSRC; grant no. EP/V006592/1, UK). The study was further funded by FAPESP projects 22/07521-5 (Global changes and sustainable development with water-energy viability and economic solvency) and 22/08468-0 (Flash drought event evolution characteristics and the response mechanism to climate change).
This paper was edited by Elena Toth and reviewed by Riccardo Biella and one anonymous referee.
Alshehri, S. A., Rezgui, Y., and Li, H: Delphi-based consensus study into a framework of community resilience to disaster, Nat. Hazards, 75, 2221–2245, https://doi.org/10.1007/s11069-014-1423-x, 2015.
Bachmair, S., Stahl, K., Collins, K., Hannaford, J., Acreman, M., Svoboda, M., Knutson, C., Smith, K. H., Wall, N., Fuchs, B., Crossman, N. D., and Overton, I. C: Drought indicators revisited: the need for a wider consideration of environment and society, Wiley Interdisciplinary Reviews Water, 3, 516–536, https://doi.org/10.1002/wat2.1154, 2016.
Baker, E., Bosetti, V., Jenni, K. E., and Ricci, E. C.: Facing the experts: Survey mode and expert elicitation, FEEM Working Paper No. 1, https://doi.org/10.2139/ssrn.2384487, 2014.
Blauhut, V.: The triple complexity of drought risk analysis and its visualisation via mapping: a review across scales and sectors, Earth-Sci. Rev., 210, 103345, https://doi.org/10.1016/j.earscirev.2020.103345, 2020.
Crispim, D. L., Progênio, M. F., and Fernandes, L. L: Proposal for a tool for assessing access to water in rural communities: a case study in the brazilian semi-arid, Environ. Manage., 69, 529–542, https://doi.org/10.1007/s00267-022-01600-3, 2022.
Elangovan, N. and Sundaravel, E.: Method of preparing a document for survey instrument validation by experts, MethodsX, 8, 101326, https://doi.org/10.1016/j.mex.2021.101326, 2021.
Hai, L. T., Gobin, A., and Hens, L.: Select indicators and prioritize solutions for desertification and drought in Binh Thuan, Vietnam, Chi. J. Pop. Res. Env., 14, 123–132, https://doi.org/10.1080/10042857.2016.1177315, 2016.
Harzing, A. W., Reiche, B. S., and Pudelko, M.: Challenges in international survey research: A review with illustrations and suggested solutions for best practice, E. J. Int. Manag., 7, 112–134, https://doi.org/10.1504/EJIM.2013.052090, 2013.
Hasson, F., Keeney, S., and McKenna, H.: Research guidelines for the Delphi survey technique, J. Adv. Nurs., 32, 1008–1015, https://doi.org/10.1046/j.1365-2648.2000.t01-1-01567.x, 2000.
Lowder, S. K., Sánchez, M. V, and Bertini, R.: Which farms feed the world and has farmland become more concentrated?, World Dev., 142, 105455, https://doi.org/10.1016/j.worlddev.2021.105455, 2021.
Merz, B., Aerts, J., Arnbjerg-Nielsen, K., Baldi, M., Becker, A., Bichet, A., Blöschl, G., Bouwer, L. M., Brauer, A., Cioffi, F., Delgado, J. M., Gocht, M., Guzzetti, F., Harrigan, S., Hirschboeck, K., Kilsby, C., Kron, W., Kwon, H.-H., Lall, U., Merz, R., Nissen, K., Salvatti, P., Swierczynski, T., Ulbrich, U., Viglione, A., Ward, P. J., Weiler, M., Wilhelm, B., and Nied, M.: Floods and climate: emerging perspectives for flood risk assessment and management, Nat. Hazards Earth Syst. Sci., 14, 1921–1942, https://doi.org/10.5194/nhess-14-1921-2014, 2014.
Meza, I., Hagenlocher, M., Naumann, G., and Frischen, J.: Drought vulnerability indicators for global-scale drought risk assessments, JRC Technical Reports, Publications Office of the European Union, https://doi.org/10.2760/73844, 2019.
Morton, J. F.: The impact of climate change on smallholder and subsistence agriculture, P. Natl. Acad. Sci. USA, 104, 19680–19685, https://doi.org/10.1073/pnas.0701855104, 2007.
Mukherjee, N., Zabala, A., Huge, J., Nyumba, T. O., Esmail, B. A., and Sutherland, W. J.: Comparison of techniques for eliciting views and judgments in decision-making, Methods Ecol. Evol., 9, 54–63, https://doi.org/10.1111/2041-210X.12940, 2018.
Ogah, A., Crosbie, T., and Ralebitso-Senior, T. K. Operationalising Community Resilience to Climate Change in Developing Countries: A Grounded Delphi Method (GDM) Approach, Research Square [preprint], https://doi.org/10.21203/rs.3.rs-844800/v1, 2021.
ProductLab: Global Surveys: Challenges, Considerations, and Tips for Success, https://app.productlab.ai/blog/global-surveys-challenges-considerations/#:~:text=Nevertheless%2C%20there%20are%20three%20major,cultural%20differences%2C%20and%20data%20accuracy, last access: 16 May 2024. 2023.
Rastandeh, A., Pedersen Zari, M., and Brown, D. K.: Components of landscape pattern and urban biodiversity in an era of climate change: a global survey of expert knowledge, Urb. Ecos., 21, 903–920, https://doi.org/10.1007/s11252-018-0777-3, 2018.
Sass, K. S., Konak, A. K., Macedo, M. B., Benso, M. R., Nardocci, A. C., Shrimpton, E., Ozkan-Balta, N., Sarmah, T., Mendiondo, E. M., Silva, G, J., Silva, P. G. C., and Jacobson, M. G.: Enhancing Drought Resilience and Vulnerability Assessment in Small Farms: A Global Expert Survey on Multidimensional Indicators, SSRN [preprint], https://doi.org/10.2139/ssrn.4547491, 2023.
Sweya, L. N., Wilkinson, S., and Kassenga, G.: A social resilience measurement tool for Tanzania’s water supply systems, Int. J. Disast. Risk Re., 65, 102558, https://doi.org/10.1016/j.ijdrr.2021.102558, 2021.
UNDRR (United Nations Office for Disaster Risk Reduction): Sendai Framework for Disaster Risk Reduction 2015–2030, https://www.undrr.org/publication/sendai-framework-disaster -risk-reduction-2015-2030 (last access: 18 June 2024), 2015.
WMO and GWP: Handbook of Drought Indicators and Indices, https://www.droughtmanagement.info/literature/GWP_Handbook_of_Drought_Indicators_and_Indices_2016.pdf (last accesss: 16 May 2024), 2016.