the Creative Commons Attribution 4.0 License.
the Creative Commons Attribution 4.0 License.
 | 27 Jun 2024
The risk of synoptic-scale Arctic cyclones to shipping
Alexander Frank Vessey
Kevin I. Hodges
Len C. Shaffrey
Jonathan J. Day
The risk posed by Arctic cyclones to ships has seldom been quantified due to the lack of publicly available historical Arctic ship track data. This study investigates Arctic ship tracks derived from automatic identification system (AIS) transponders from September 2009 to December 2016. These are analysed with historical synoptic-scale cyclone tracks derived from ERA-5 reanalysis data and reports of past Arctic shipping incidents. We determine the number of ship tracks that intersected with intense Arctic cyclones tracks and how many of these intersections resulted in a reported shipping incident.
The number of ships operating in the Arctic has increased year-on-year from 2010 to 2016. The highest density of ships occurs year-round in the Barents Sea. Trans-Arctic shipping transits via the Northern Sea Route and the Northwest Passage are limited to summer and autumn months, when sea ice extent has retreated sufficiently from the coastlines. Ship track density along these trans-Arctic routes is far less than the thousands of ships travelling in the Barents Sea year-round. Between 2010 and 2016, 158 Arctic shipping incidents were reported, but only 6 % of these reported incidents occurred following the passage of an intense Arctic cyclone. Arctic cyclones with significant wave heights greater than 6 m are found to frequently intersect ships, but only 0.1 % of these intersections resulted in a reported shipping incident. Results from this study indicate that ships are frequently impacted by Arctic cyclones, but cyclones were not a dominant cause of reported Arctic shipping incidents between 2010 and 2016. This suggests that ships are resilient to the rough sea conditions that past Arctic cyclones have caused, therefore mitigating and reducing risk.
- Article
(11240 KB) - Full-text XML
-
Supplement
(6375 KB) - BibTeX
- EndNote


As a consequence of global warming, the Arctic Ocean is becoming increasingly accessible to ships as Arctic sea ice continues to decline (Stroeve et al., 2007, 2012, 2014). Annual mean Arctic sea ice extent has declined from 12.3×10⁶ km2 in 1979 to 10.5×10⁶ km2 in 2022, a decline of 15 % (Fetterer and Windnagel, 2017). The fastest decline in Arctic sea ice extent occurred in September: from 7.1×10⁶ km2 in 1979 to 4.4×10⁶ km2 in 2022, a decline of 38 % (Fetterer and Windnagel, 2017). Arctic sea ice is projected to decline further in the future as global surface temperatures are projected to increase further (Stroeve et al., 2012; Wei et al., 2020).
This reduction in Arctic sea ice extent could have detrimental consequences for the Arctic (Serreze and Barry, 2011) and for mid-latitude climate systems (Coumou et al., 2018), which may include larger and more frequent Siberian wildfires, stress on local wildlife and ecosystems, and the enhanced release of greenhouse gases into the atmosphere through melting permafrost. However, reduced Arctic sea ice extent does also provide beneficial opportunities for industries such as shipping, oil exploration, and tourism, which could include shorter journeys between ports in North America, Europe, and Asia (Smith and Stephenson, 2013; Melia et al., 2016, Table 1); access to previously inaccessible natural resources (Harsem et al., 2015); and new destinations for tourism (Maher, 2017). These benefits may lead to greater shipping traffic in the Arctic Ocean over the coming decades, consequently increasing the number of ships exposed to extreme weather and other Arctic hazards (Browse et al., 2013; Lasserre, 2014; Melia et al., 2016; Lasserre, 2019).
Table 1Approximate distances between major ports in Europe and North America to major ports in Asia using Arctic routes (the Northern Sea Route between Europe and Asia or the Northwest Passage between North America and Asia) or mid-latitude routes (the Suez Canal route between Europe and Asia and the Panama Canal route between North America and Asia). The distances have been measured on Google Earth, 2023, and are given to the nearest 100 nautical miles (nm).
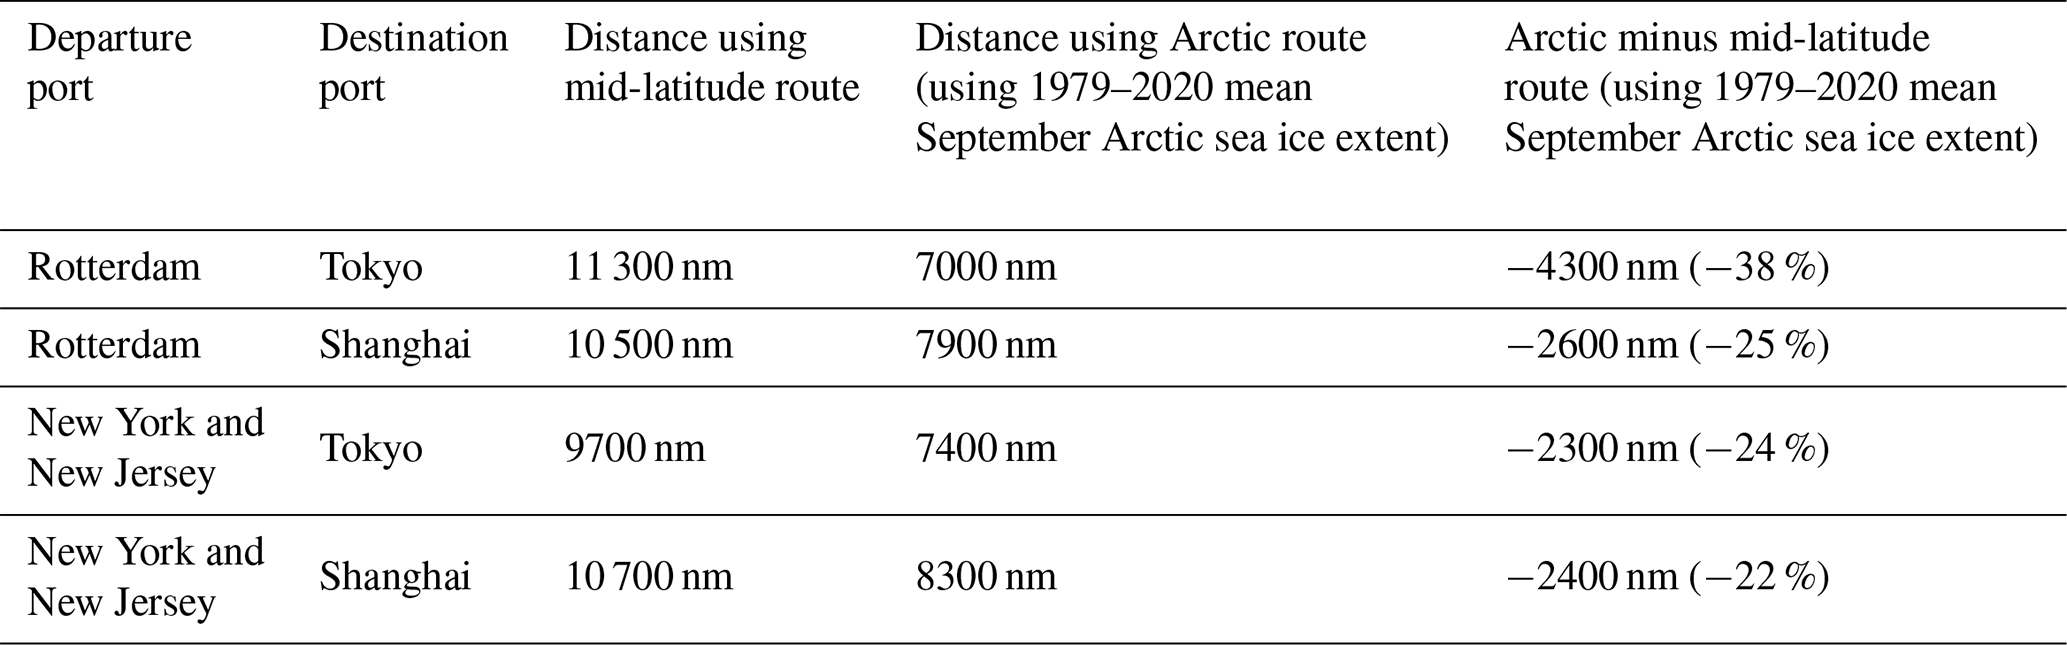
The shipping routes of the Northern Sea Route (NSR) and Northwest Passage (NWP) are much shorter than traditional tropical shipping routes. Transits between major ports in Asia, Europe, and North America could be shortened by as much as approximately 38 % if these trans-Arctic routes are used rather than the more traditional mid-latitude routes such as those travelling through the Suez and Panama canals (Table 1). When Arctic sea ice has sufficiently retreated northward from the Eurasian and Canadian coastlines, the NSR running north of the Eurasian coastline can connect Europe and Asia, whilst the NWP running through the Canadian Arctic Archipelago can connect North America with Asia. These trans-Arctic shipping routes are becoming increasingly ice-free and feasible for shipping for longer periods in summer and autumn months (Melia et al., 2016) as Arctic sea ice extent has continued to decline (National Snow & Ice Data Centre, 2023).
However, the Arctic is a challenging and hazardous environment for such human activity. Cold temperatures can make working conditions difficult and can cause equipment failure (Larsen et al., 2016), and sea ice can force ships to travel through the shallow and perilous coastlines around the boundaries of the Arctic Ocean (Arctic Monitoring & Assessment Programme: Working Group of the Arctic Council, 2020). Conditions can be made even more dangerous by the passage of a cyclone or a polar low, which can cause rough sea conditions due to high winds and high ocean waves (Thomson and Rogers, 2014; Liu et al., 2016; Waseda et al., 2018, 2021). Such conditions could endanger a ship's crew, potentially capsize the ship with its cargo, or cause delays in transit. Arctic cyclones can also enhance the breakup of sea ice (Simmonds and Keay, 2009; Asplin et al., 2012; Parkinson and Comiso, 2013; Peng et al., 2021), which can drive the ice into shipping lanes where it becomes an additional hazard for ships to navigate. Given the numerous hazards in the Arctic, it is important to assess their relative threat to human activity to inform decision-makers and the public and to ultimately increase the awareness of and resilience to the most threatening Arctic hazards.
Some recent Arctic shipping disasters highlight how perilous the Arctic can be for shipping. On 23 March 2019, the MV Viking Sky cruise ship with 1373 people on board lost power whilst trying to contend with extremely high wind and ocean waves caused by the passage of an Arctic cyclone (Ibrion et al., 2021). Ocean waves were reported to be in excess of 15 m in height as the cruise ship started to drift toward the shallow coastline of Norway. After a full evacuation, the cruise ship was salvaged, but some damage had to be repaired and subsequent trips were consequently cancelled. Other Arctic cruise ship incidents unrelated to the passage of a cyclone have been documented, such as the MV Akademik Ioffe running aground on 24 August 2018 and spilling 80 L of fuel (Transportation Safety Board of Canada, 2018; Johannsdottir et al., 2021) and the MV Clipper Adventurer being damaged whilst running aground on 27 August 2010 (Johannsdottir et al., 2021). Understanding these shipping incidents and whether they were driven by a particular natural hazard that could be mitigated is fundamental to direct research to understand and ultimately reduce the risks to shipping.
The spatial distribution and intensity of Arctic cyclones has been found to vary seasonally, with the highest density of winter (DJF) Arctic cyclones typically occurring over the Norwegian, Greenland, and Barents seas, and the highest density of summer (JJA) cyclones typically occurring over the coastline of Eurasia and the Arctic Ocean (Reed and Kunkel, 1960; Serreze et al., 2001; Simmonds et al., 2008; Crawford and Serreze, 2016; Vessey et al., 2020). Vessey et al. (2022) showed that this seasonal spatial distribution is also seen in the maximum intensity locations of the most intense winter and summer Arctic cyclones. Arctic cyclones in winter are also generally more intense than summer Arctic cyclones (Zhang et al., 2004; Sorteberg and Walsh, 2008; Simmonds et al., 2008; Vessey et al., 2020, 2022). Although synoptic-scale Arctic cyclones have been the focus of many studies in the past, the exposure of ships to intense Arctic cyclones has seldom been reported on.
In December 2004, it became mandatory for all large ships with a gross tonnage greater than 300 t and all passenger ships regardless of size to have automatic identification system (AIS) transponders, which transmit the ships’ locations to satellites in real time (International Maritime Organization, 2020). This regulation was established by the International Maritime Organization to increase the safety of ships in often-busy shipping lanes. Due to their safety benefits, AIS transponders have increasingly been fitted to smaller vessels (U.K. Gov., 2014). This has allowed for the monitoring of ships and recording of past ship tracks. However, archived historical ship track data are often privately owned and difficult or costly to obtain publicly.
Consequently, there are few publicly available studies that describe past Arctic shipping activity (e.g. Corbett et al., 2010; Eguiluz et al., 2016; Hreinsson, 2020; Berkman et al., 2020b, 2022; Müller et al., 2023), likely due to the lack of open-source Arctic shipping datasets. These studies show that there is typically a high density of ships in the Barents Sea year-round and that trans-Arctic shipping along the NSR and the NWP is currently limited to months when sea ice is near its minimum extent, typically from August to October. However, these previous studies have not combined the past ship tracks with past Arctic cyclone tracks to assess the risk that Arctic cyclones pose to shipping, nor do they combine these past ship tracks with past shipping incident reports to quantify the number of past shipping incidents and those incidents caused by the passage of Arctic cyclones. It is therefore unclear whether the number of ships and shipping incidents in the Arctic are increasing as the Arctic becomes increasingly more accessible due to declining sea ice extent, how many ships are presently impacted by hazardous weather conditions caused by Arctic cyclones, and how many Arctic shipping incidents have occurred following the passage of a cyclone.
The lack of publicly available historic ship track data has been addressed somewhat by Berkman et al. (2020a), who published an open-source Arctic ship track dataset. This contains the transmitted AIS-derived ship location data of ships that travelled north of the Arctic Circle (north of 66.5° N) but is only available for a limited period, from September 2009 to December 2016. Berkman et al. (2020b, 2022) used this dataset and showed that the number of ships in the Arctic has increased between 2010 and 2016. Arctic shipping incidents from 2005 to 2017 have been collated and made publicly available from the Protection of the Arctic Maritime Environment Agency (2023). This database includes incidents occurring due to various causes (collision, grounding, etc.) and describes the ships impacted (e.g. name and tonnage), the incident itself (e.g. if the ship was lost or only partially damaged), and the consequences of the incident (marine casualty, cargo damage, etc.). Combining past ship tracks and shipping incident reports with past cyclone tracks could provide new insights into quantifying the risk of cyclones to Arctic shipping.
This study aims to describe past Arctic shipping activity and incidents and to quantify the number of Arctic ships that have intersected with intense cyclones using publicly available ship track, ship incident, and weather data. This will be achieved by answering the following research questions.
-
Does the spatial distribution of Arctic shipping vary with the seasonal changes in Arctic sea ice extent?
-
Given recent reductions in Arctic sea ice extent, is there evidence of any trend in the number of ships and shipping incidents in the Arctic?
-
How many Arctic ships have intersected with past intense cyclones, and how many of these intersections led to a reported shipping incident?
The methods used in this study are described in Sect. 2, including a description of the data and storm tracking method used. In Sects. 3 to 8, the results from this study are described, detailing the trends and seasonal spatial distribution of past Arctic ship tracks, past intense Arctic cyclone tracks, and past Arctic shipping incidents. The number of ship tracks that intersected with passing intense Arctic cyclone tracks and the proportion of these intersections that resulted in a reported shipping incident are also quantified and described. Finally, a summary of the main conclusions is given in Sect. 9.
2.1 Arctic shipping data
Berkman et al. (2020a) published Arctic ship location data between September 2009 and December 2016 from AIS transponders over a domain that includes areas north of the Arctic Circle (66.5° N). This dataset includes information such as the timestamp of the AIS transmission, the unique Maritime Mobility Service Identity (MMSI) number of each ship, the draught (vertical distance between the waterline and the bottom of the hull, which can indicate the ship's size and weight), and the coordinates of the transmission in latitude and longitude.
The Berkman et al. (2020a) data need to be transformed into ship tracks per ship (each unique MMSI). Ships are required to transmit their locations at a high temporal resolution (i.e. minutes) to ensure safety within the busy network of mobile ships. This high temporal resolution is reduced from minutes to the point nearest every hour to match the temporal resolution of the atmospheric dataset used in this study, ERA-5. To account for ships having multiple tracks within each month, a new track from each ship is determined if there is a break in the AIS transmission of more than 48 h. This break in transmission may be due to the ship being docked and the engine being switched off, causing no AIS transmission, which signifies the end of the ship's current journey and track.
Past Arctic shipping incident and accident data are documented by the Arctic Council (Protection of the Arctic Maritime Environment Agency, 2023). This database reports Arctic shipping incidents from 2005 to 2017 and includes information on the longitude and latitude coordinates of the incident, time of the incident, and type of incident (marine casualty, cargo damage, etc.). It also indicates whether the vessel was completely lost or only partially damaged following the incident. Incidents south of the Arctic Circle are included, so this dataset can be filtered to retain only shipping incidents that occurred north of 66.5° N between September 2009 to December 2016 to match period of the Berkman et al. (2020a) ship track dataset. Shipping incidents with no location data are omitted.
2.2 Historic atmosphere and ocean data
This study uses atmospheric data from the most recent reanalysis dataset of the European Centre for Medium-Range Weather Forecasts (ECMWF), ERA-5 (Hersbach et al., 2018, 2020). Reanalysis datasets have been developed over recent decades to provide a consistent global perspective on past atmospheric conditions, created by assimilating historical observations from a range of sources into state-of-the-art numerical weather prediction (NWP) models. Although there are multiple reanalysis datasets available from various institutions, ERA-5 was chosen here as it is the most recent and has the highest spatial and temporal resolution of all the reanalysis datasets available (Vessey et al., 2020).
The ERA-5 dataset contains atmospheric data from 1940–present at a 1 h temporal resolution and at an approximately 31 km (TL639) spatial resolution with 137 vertical levels up to 0.01 hPa. Historical observations are assimilated into the ECMWF Integrated Forecasting System (IFS) version CY41R2 using a 4-dimensional variation data assimilation scheme (4D-Var; Hersbach et al., 2020). Prior to 1979, satellite observations were not available, so the reanalysis datasets may be less constrained. So, data from ERA-5 are used from 1979–2021 in this study to identify past Arctic cyclone tracks.
The ERA-5 atmospheric variables used in this study are the 850 hPa relative vorticity and the 10 m u- and v- component winds. The IFS model is also coupled to the ECMWF WAM (WAve Model) and gives information of past ocean states at a lower spatial resolution of 0.5°. The ECMWF WAM can determine past wave heights over the open ocean but cannot capture waves within sea ice. To assess how Arctic cyclones influence the ocean state and cause hazardous rough sea conditions, the ERA-5 ocean field of significant wave height including tide and surge is also used. These ERA-5 variables are used at 1 h intervals each day.
In this study, historic Arctic shipping activity is also related to past Arctic sea ice extent. For this purpose, the Met Office Hadley Centre Sea Ice and Sea Surface Temperature version 2.1 dataset (HadISST2.0; Titchner and Rayner, 2014) is used to indicate past Arctic sea ice extent. This dataset was created by combining various Arctic sea ice records to produce a best estimate of past sea ice extent globally at a 1° horizontal resolution and 6 h time resolution from 1850 to present (Titchner and Rayner, 2014). There are various Arctic sea ice data products available from various institutions, and Berkman et al. (2020a, 2022) had previously only used Arctic sea ice data from the National Snow and Ice Data Center (NSIDC; Fetterer and Windnagel, 2017). However, Comiso et al. (2017) found that the historical Arctic sea ice extent and trends from HadiSST2.0 are very similar to those of other sea ice datasets such as the NSIDC (Fetterer and Windnagel, 2017).
2.3 Storm tracking
Arctic cyclones are identified in 1 h ERA-5 data, which are at a different temporal resolution than the sub-hourly Arctic shipping data and the 6 h Arctic sea ice data, using the storm tracking algorithm developed by Hodges (1994, 1995, 1999, 2021). This storm tracking algorithm has been used in numerous studies to identify past Arctic cyclones in reanalyses (e.g. Day and Hodges, 2018; Day et al., 2018; Gray et al., 2021; Vessey et al., 2022). Vessey et al. (2020) showed that this storm tracking algorithm captures more Arctic cyclones when based on 850 hPa relative vorticity than on mean sea level pressure (MSLP), so in this study 850 hPa relative vorticity is used as the storm tracking variable.
This field is first spectrally truncated to a spectral resolution of T42 and is filtered to remove the planetary scales for total wavenumbers less than or equal to 5. This ensures that synoptic-scale systems that are independent of large-scale forcings are focused on. Cyclone features are then identified at each time step as maxima in the T42 850 hPa relative vorticity field. Feature points between consecutive 1 h time steps within a minimum displacement factor of 2° in all regions north of 30° N are then linked to create cyclone tracks. This is achieved by optimizing a cost function for track smoothness, which is subject to adaptive constraints on displacement and smoothness (Hodges, 1999).
Once all cyclone tracks have been identified between 1979 and 2021, they are then filtered to only retain those that last more than 2 d and travel more than 1000 km. This further ensures that only mobile and synoptic-scale cyclones are focused on, but it means that smaller mesoscale cyclones such as polar lows are not retained. Arctic cyclone tracks are then filtered by those that travel north of the Arctic Circle (66.5° N) at any point during their lifetime. To assess the hazardous weather conditions that may impact ships, the maximum full resolution ERA-5 10 m wind speed and significant wave height (including tide and swell) within a 5° radius of the cyclone's centre are then identified and added to the cyclone tracks.
Ships are typically built to withstand moderately intense weather conditions, and more intense Arctic cyclones are more likely to pose a significant threat to ships operating in the Arctic. The Beaufort wind scale and Douglas sea state scale can be used to gauge the severity of cyclones and whether their intensity can cause hazardous ocean conditions that could threaten a ship and its crew (Simpson, 1906; Schule, 1966; Met Office, 2010). These scales indicate when rough sea conditions are likely to occur depending on surface wind speed or wave height. The thresholds that result in rough sea conditions are marked as 17 m s−1 for surface wind speeds (Beaufort wind scale 8 and higher) and 2.5 m for significant wave heights (Douglas sea state scale 5 and higher). The identified ERA-5-derived Arctic cyclone tracks are then filtered to obtain the cyclone tracks that cause rough sea conditions in the Arctic and have a maximum 10 m wind speed and significant wave heights within the Arctic exceeding these thresholds. Although the exceedance of these intensity thresholds does not guarantee that every ship will be damaged or affected, these thresholds do provide an objective measure to filter out cyclones that may be intense enough to be hazardous for ships.
2.4 Past Arctic ship tracks intersecting with past cyclone tracks
The number of past ship tracks that intersected with an intense cyclone is quantified to determine the number of ship tracks impacted by past cyclones. The highest wind speeds do not occur at the centre of a cyclone but often occur in the southern half of a cyclone due to near-surface air streams (Browning, 2004; Vessey et al., 2022). Vessey et al. (2022) showed that in the composite structure of the 100 most intense winter and summer Arctic cyclones, the maximum 10 m wind speeds within these cyclones occur in an area approximately 5° south of the composite cyclone's centre relative to the direction of propagation (see Vessey et al., 2022, Fig. S3).
High surface wind speeds tend to cause tall ocean waves and high significant wave heights. Tall ocean waves are perhaps more hazardous to ships than high surface wind speeds, as they have a greater ability to make the ship unstable. So, in this study, an intersection between a ship track and a cyclone track occurs if the Arctic ship track longitude and latitude coordinates at the same time step are within 3° (approximately 333 km) of the longitude and latitude coordinates of the cyclone's maximum significant wave height, and the significant wave height at the ship's location is greater than 2.5 m. This ensures that the ship is impacted by extreme wave heights and that the extreme wave height conditions are related to the passage of an Arctic cyclone. This intersection methodology is shown in Fig. 8.
If there are multiple intersections between a ship's coordinates and a particular cyclone, this ship and cyclone intersection is only counted once to avoid double counting ship and cyclone intersections. A similar procedure is followed to connect the time and coordinates of a past reported shipping incident with the passage of a cyclone. To account for a time lag between an intersection occurring and the incident being reported, incident reports within the next 48 h after the passage of an Arctic cyclone are counted as being related to a cyclone. The sensitivity to this 3° (approximately 333 km) distance threshold is also tested, and intersections between the ship track and cyclone and the shipping incident are also determined within a 6° (approximately 666 km) of the longitude and latitude coordinates of the cyclone's maximum significant wave height, and the significant wave height at the ship's location is greater than 2.5 m. For some cases, cyclones may cause less-extreme significant wave heights that are still greater than the 2.5 m threshold outside a 3 and 6° distance radius from the cyclone's maximum significant wave height, so the number of intersections between ship track and cyclone (and shipping incident and cyclone) may be underestimated. However, this approach should identify the ship tracks and shipping incidents impacted by the most extreme significant wave height conditions caused by the passage of a past Arctic cyclone.
Between September 2009 and December 2016, 176 961 ships with a unique identification number (MMSI) travelled north of the Arctic Circle (Fig. 1a). The number of ships that travelled in the Arctic increased year-on-year from 2010 to 2016 (Fig. 1a). This is also shown by Berkman et al. (2020b, 2022). In 2010, 15 666 ships with a unique MMSI transmitted an AIS location in the Arctic, whereas in 2016 the number ships operating in the Arctic was +122 % higher (more than 2 times greater), and approximately 34 780 ships transmitted an AIS location (Fig. 1). This shows that the number of ships operating in the Arctic and transmitting their locations increased between 2010 and 2016.
There was a greater increase in the number of small ships with a draught of less than 4.55 m, from 7261 in 2010 to 12 193 in 2016 (+68 % increase), than the increase in the number of large ships with a draught of more than 4.55 m, from approximately 8611 in 2010 to 10 117 in 2016 (+17 % increase; Figs. 1b and 1c). The draught threshold of 4.55 m represents the mean draught of all ships that travelled in the Arctic between September 2009 and December 2016. Since 2004, when large ships were mandated to be fitted with AIS transponders, such devices have increasingly been fitted to smaller vessels. In May 2012, it became mandatory for all fishing vessels with a length greater than 24 m to have AIS transponders (U.K. Gov., 2014). Such a change in regulation may have artificially increased the number of ships reporting their position when in the Arctic. However, given that the increase in the number of ships shown in Fig. 1 is so great and that there is a strong increase in the number of large ships that were required to have an AIS transponder starting in 2004, it is highly likely that the number of ships operating in the Arctic has increased.
The number of Arctic ships per month varies seasonally with changes in Arctic sea ice extent, which is also shown by Berkman et al. (2020b, 2022). The maximum number of ships in the Arctic per year generally occurs in the late summer and early autumn months when Arctic sea ice is typically at its annual minimum extent (Fig. 1). The minimum number of Arctic ships generally occurs in winter months (Fig. 1). For example, in 2012 Arctic sea ice extent was 15.2×10⁶ km2 in March but had reduced to 3.6×10⁶ km2 in September (National Snow & Ice Data Centre, 2023). So, the number of ships operating in the Arctic appears to be correlated with Arctic sea ice extent, where lower sea ice extent coincides with a higher number of ships operating in the Arctic. This is consistent with Berkman et al. (2020a, 2022).
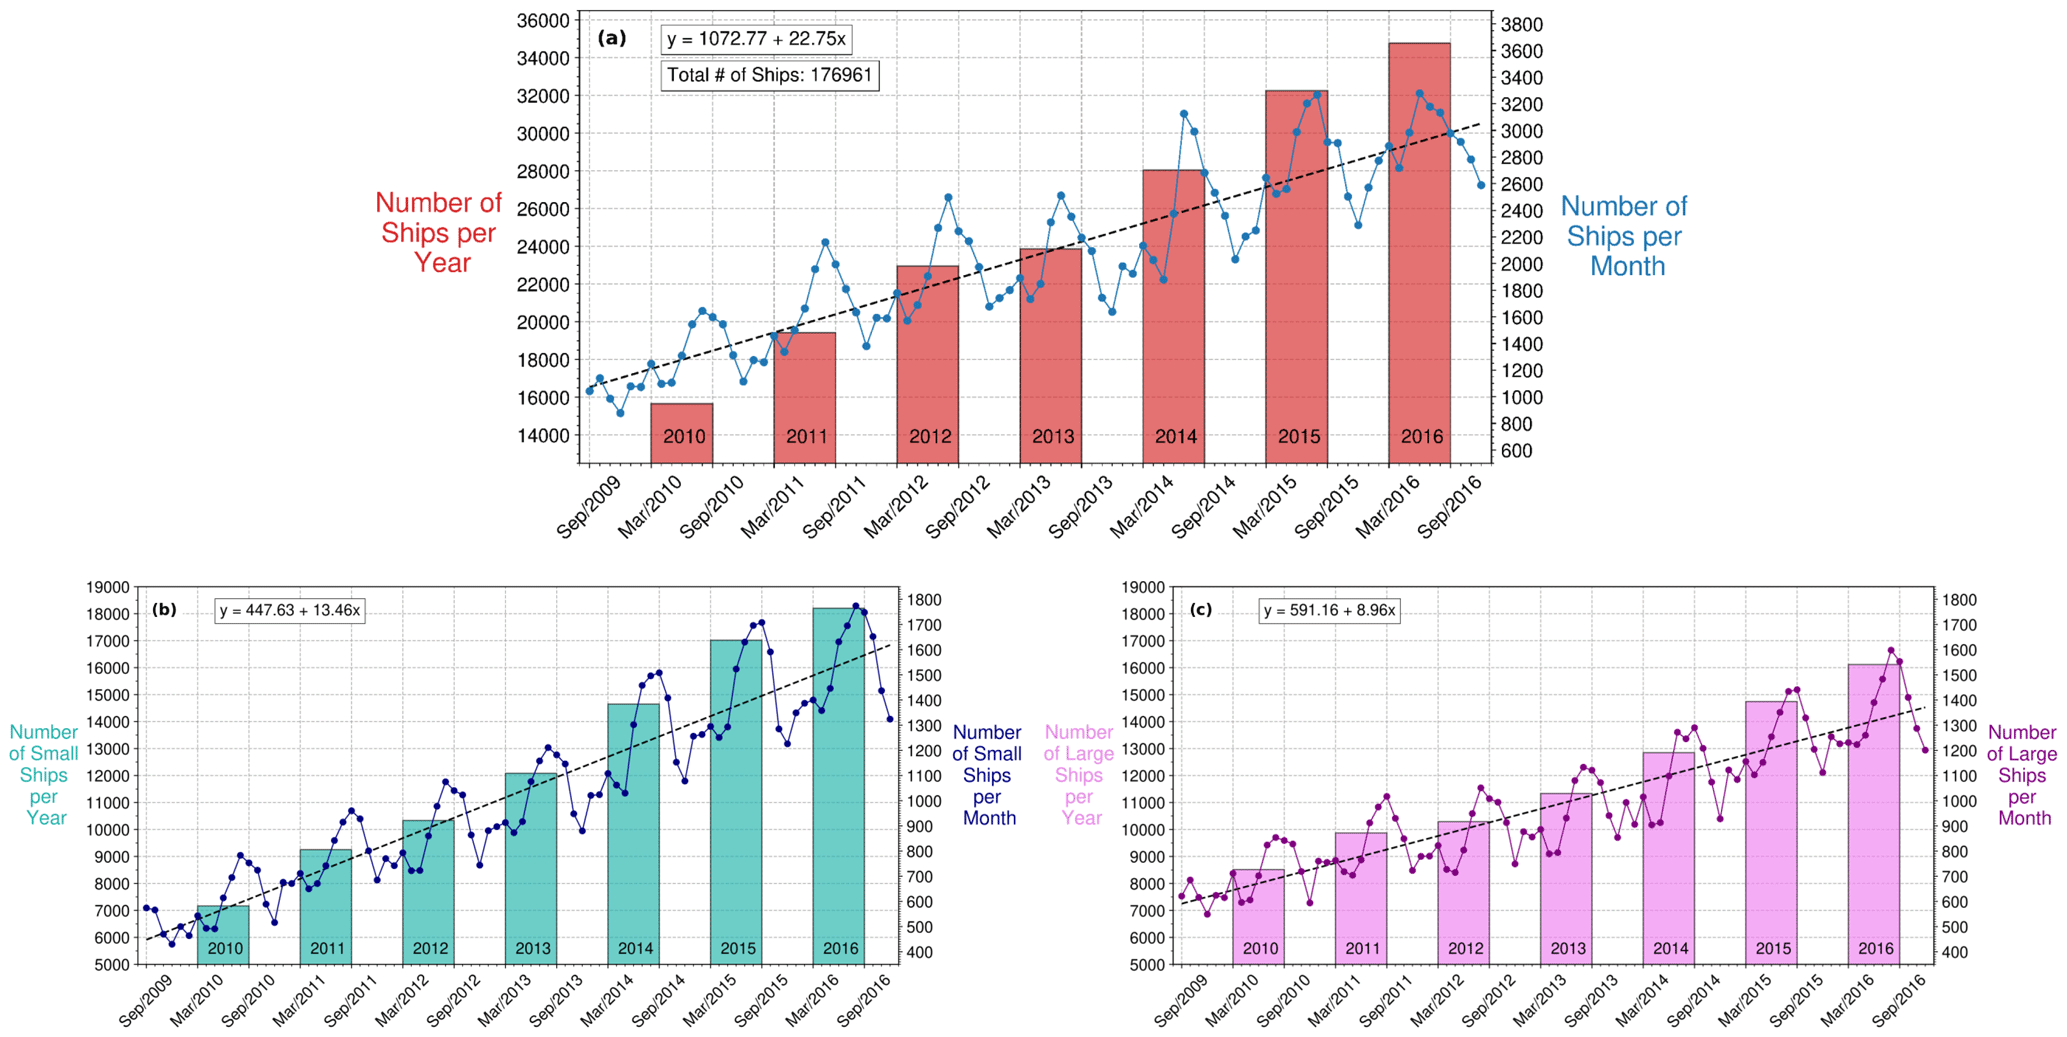
Figure 1Trends per year and per month, from September 2009 to December 2016, in the frequency of (a) all ships with a unique identification number (MMSI) that travelled north of the Arctic Circle (66.5° N), (b) only small ships with a draught less than the mean draught across all ships (4.55 m), and (c) only large ships with a draught more than the mean draught across all ships (4.55 m). Data were taken from the Berkman et al. (2020a) Arctic shipping dataset.
The number of ships operating in the Arctic per year more than doubled between 2010 and 2016 (Fig. 1). However, there is some evidence to suggest that the increasing number of ships in the Arctic slowed between 2017 and 2019 (NOAA, 2022). Although they used a different data source, the NOAA (2022) showed that the maximum number of ships per month travelling in the Arctic in 2018 was similar to 2016, with a maximum of approximately 4000 ships travelling in the Arctic in late summer in both years. So the increase in the number of ships operating in the Arctic between 2010 and 2016 (Fig. 1) may have slowed from 2016 to 2018. However, given the lack of up-to-date publicly available ship track data, there is insufficient evidence to describe shipping behaviour up to the present day.
Since 1979, surface temperatures in the Arctic have warmed approximately 4 times more than the global average (Rantanen et al., 2022), due to Arctic amplification (Smith et al., 2019). Despite this, there are no evident trends in the frequency of intense Arctic cyclones with significant wave heights greater than 2.5 m (Fig. 2). Despite some inter-annual variability leading the annual average of intense Arctic cyclones to vary by approximately 38 %, from a maximum of 219 cyclones to a minimum of 150, an average of 182 Arctic cyclones with significant wave heights higher than 2.5 m occurred each year between 1979 and 2022 (Fig. 2).
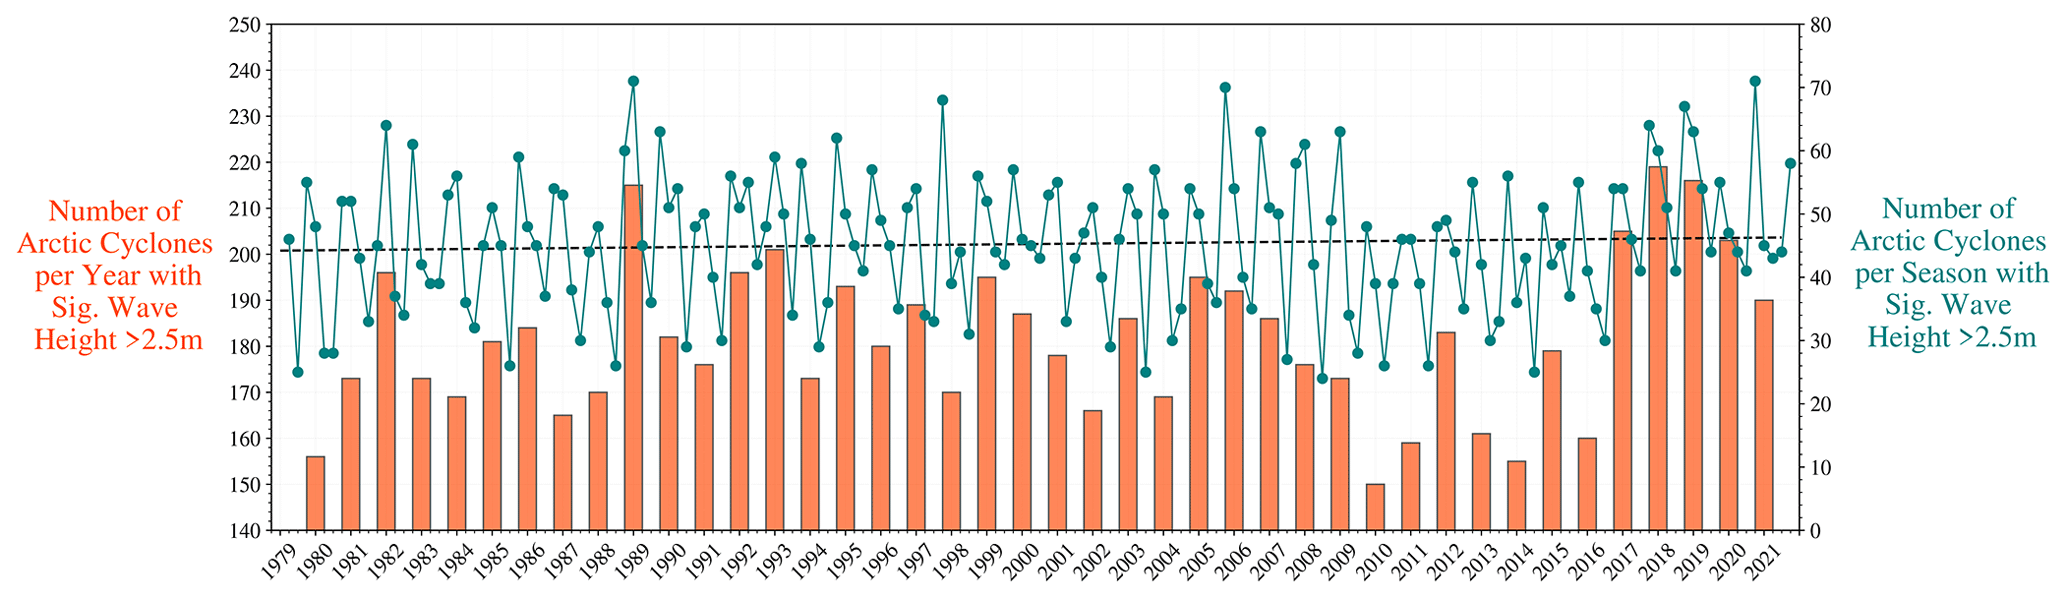
Figure 2The total number of Arctic cyclones per year and per season (winter – DJF, spring – MAM, summer – JJA, and autumn – SON) with significant wave heights greater than 2.5 m from 1979 to 2022 based on ERA-5 reanalysis data.
The frequency of intense Arctic cyclones does appear to vary seasonally, with the frequency of intense Arctic cyclones being highest in winter and lowest in summer (Fig. 2). This seasonality in Arctic cyclone intensity was also shown in Zhang et al. (2004), Sorteberg and Walsh (2008), Simmonds et al. (2008), and Vessey et al. (2020, 2022). Although in this study, the seasonality in Arctic cyclone frequency and intensity is shown in terms of cyclones with extreme significant wave heights.
The number of ship tracks in the Arctic varies per month and is highest in summer months when Arctic sea ice is typically at its minimum extent. Between 2010 and 2016, there were a total of approximately 44 000 Arctic ship tracks in winter (DJF) months and 46 000 in spring (MAM) months (Fig. 3a and b). But in all summer (JJA) and autumn (SON) months between 2010 and 2016, there were more than double the number of Arctic ship tracks compared to in winter and spring months, with approximately 95 000 and 122 000 Arctic ship tracks occurring in all summer and autumn months respectively (Figs. 1c and 3d). This further shows that the number of ships operating in the Arctic is highest when the Arctic sea ice extent is lowest.
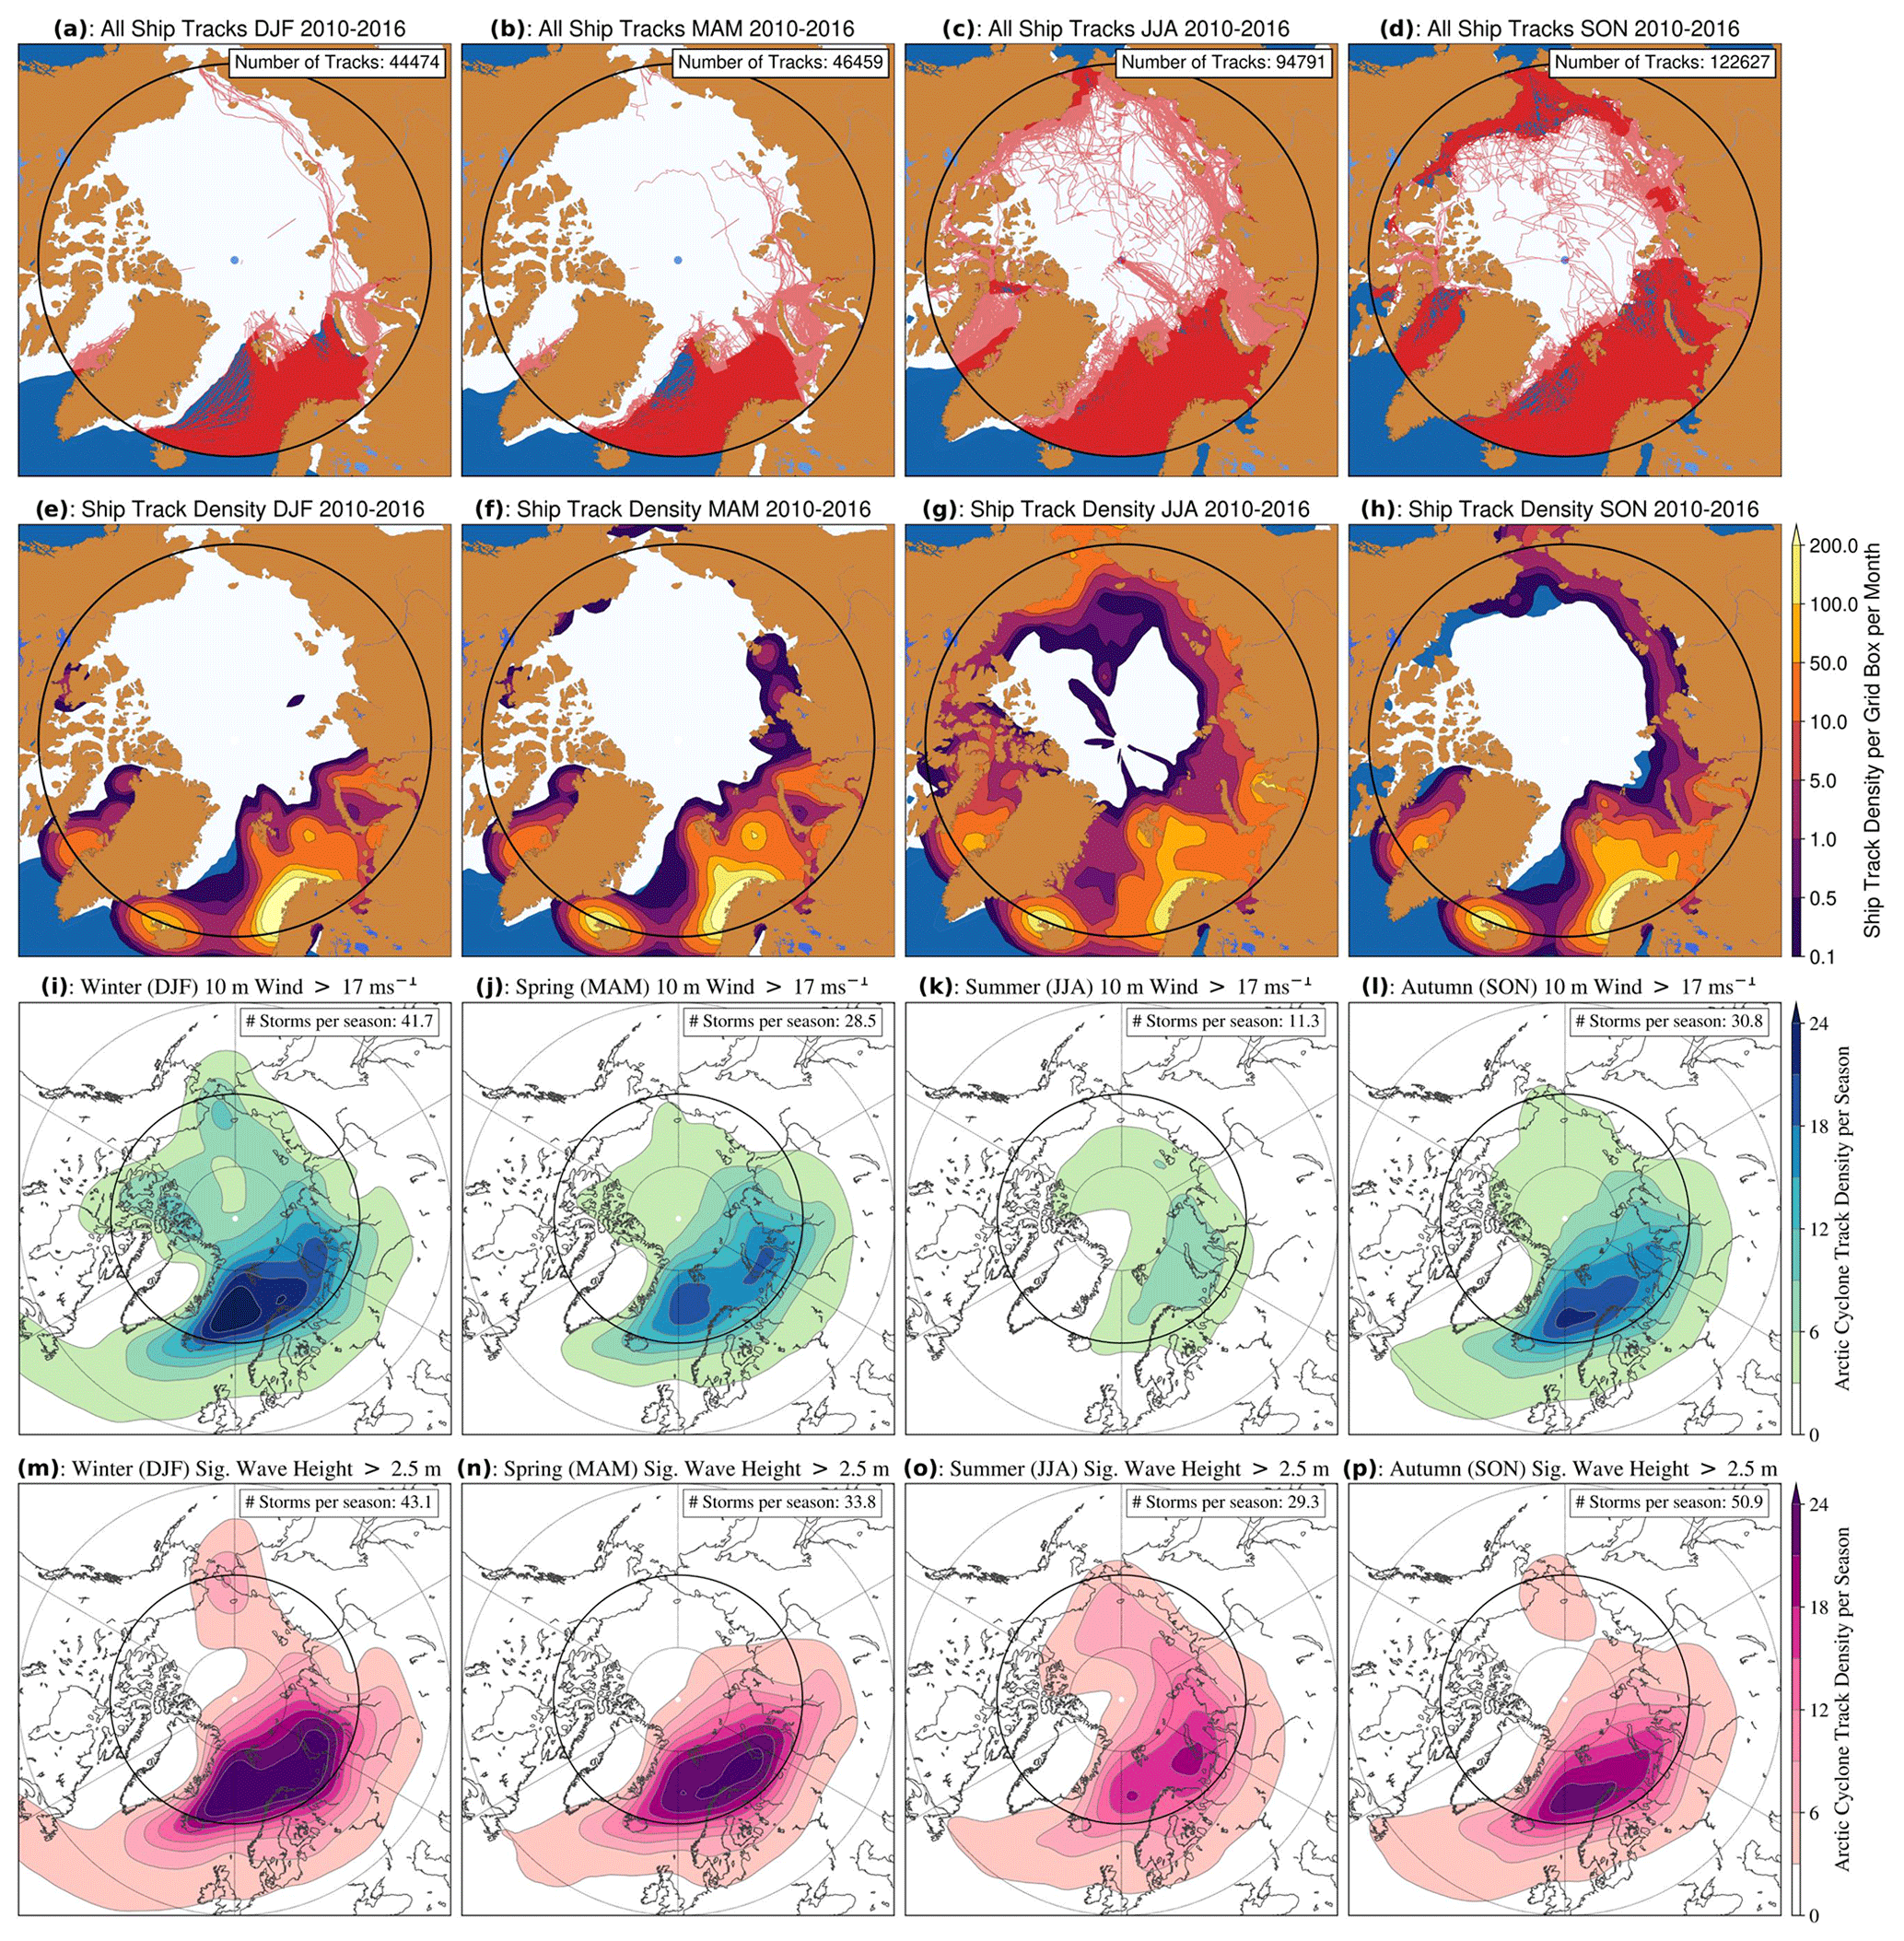
Figure 3(a–d) All ship tracks (red lines) from 2010 to 2016 per season. (e–h) Ship track density from 2010 to 2016 per season per grid box (2.0° N × 5.0° E). (i–l) Arctic cyclone track density from 1979 to 2021 per season per unit area (5° spherical cap) of cyclones with 10 m wind speeds greater than 17 m s−1. Panels (g–h) show the same as (i–l) but for the track density of Arctic cyclones with significant wave heights greater than 2.5 m. Panels (a, e, i, and m) – winter (DJF), panels (b, f, j, and n) – spring (MAM), panels (c, e, k, and o) – summer (JJA), and panels (d, h, l, and p) – autumn (SON). Ship track densities are smoothed using a Gaussian filter equal to 1.0. The mean HadISST2.0 Arctic sea ice extent greater than 15 % over each period is shown in white. The solid black line indicates the Arctic Circle (66.5° N).
The highest density of Arctic ship tracks in all seasons occurs in the Barents Sea and just north of northern Norway in every season, with more than 200 ship tracks in this region in all seasons (Fig. 3e–h). The highest density of ships in the Barents Sea is also shown when examining Arctic ship tracks over annual timescales (Fig. S1 in the Supplement). Other regions of high Arctic ship track density occur around Iceland and in Baffin Bay, where ship track density is approximately 50 to 200 tracks per season (Fig. 3e–f). This result is similar to that of Eguiluz et al. (2016), who also showed that the highest density of ships in the Arctic between 2010 and 2014 was in these areas.
There is also seasonal variation in the spatial distribution of Arctic ship tracks, which shows that in winter and spring, shipping is confined to the Greenland, Norwegian and Barents seas (Fig. 3a–f). However, in summer and autumn, ship tracks are more widespread across the Arctic, and there are many more ships travelling across the trans-Arctic shipping routes of the Northern Sea Route (NSR; along the coastline of Eurasia) and the Northwest Passage (NWP; through the Canadian Arctic Archipelago). Although, when considering the density of Arctic ship tracks, the number of ships in summer and autumn is much greater in the Barents Sea than in these trans-Arctic shipping routes (Fig. 3a–f). This spatial distribution in Arctic ship tracks is consistent with the Arctic ship tracks described by Corbett et al. (2010), Eguiluz et al. (2016), and Hreinsson (2020). So, despite large reductions in Arctic sea ice extent since 1979, trans-Arctic shipping along the NSR and the NWP was limited to summer and autumn, when Arctic sea ice was at its minimum extent. Moreover, the density of trans-Arctic shipping appears much lower than the density of ships in the Barents Sea (Fig. 3a–f).
The highest track density of intense Arctic cyclones with 10 m wind speeds greater than 17 ms−1 and significant wave heights greater than 2.5 m is also in the Barents Sea and around Iceland, the same regions where ship track density is highest (Fig. 3). In summer, the track density per season of intense Arctic cyclones appears to extend from the Barents Sea to over the Kara Sea (Fig. 3i–p), perhaps due to the difference in the spatial distribution of summer Arctic cyclones, which is highest over the Eurasian coastline (Reed and Kunkel, 1960; Serreze et al., 2001; Simmonds et al., 2008; Crawford and Serreze, 2016; Vessey et al., 2020).
Overall, there is higher track density in winter intense Arctic cyclones than in summer intense Arctic cyclones (Fig. 3i–p), with winter Arctic cyclones having significant wave heights as high as 13 m (Fig. S2 in the Supplement). When applying more extreme intensity thresholds of 10 m wind speeds greater than 25 ms−1 and significant wave heights of 4 m, the Barents Sea is still identified as the region with the highest track density of intense Arctic cyclones (Figs. S3 and S4 in the Supplement). So, the highest density of ship tracks is also where there is the highest density of intense Arctic cyclone tracks (Fig. 3).
One benefit of reduced Arctic sea ice extent is that it offers shorter routes between ports in North America, Europe, and Asia than traditional mid-latitude routes through the Suez and Panama canals (see Table 1). The number of ships travelling through the NSR increased significantly from 2010 to 2016 (Fig. 4). In 2010, approximately 150 ships travelled along the NSR between the Kara and Laptev seas and along the coastline of Eurasia (see red box in Fig. 4a), whereas in 2016, approximately 460 ships (+200 % increase) travelled through these seas (Fig. 4b). This increase in ship traffic through the NSR was similarly shown by Müller et al. (2023).
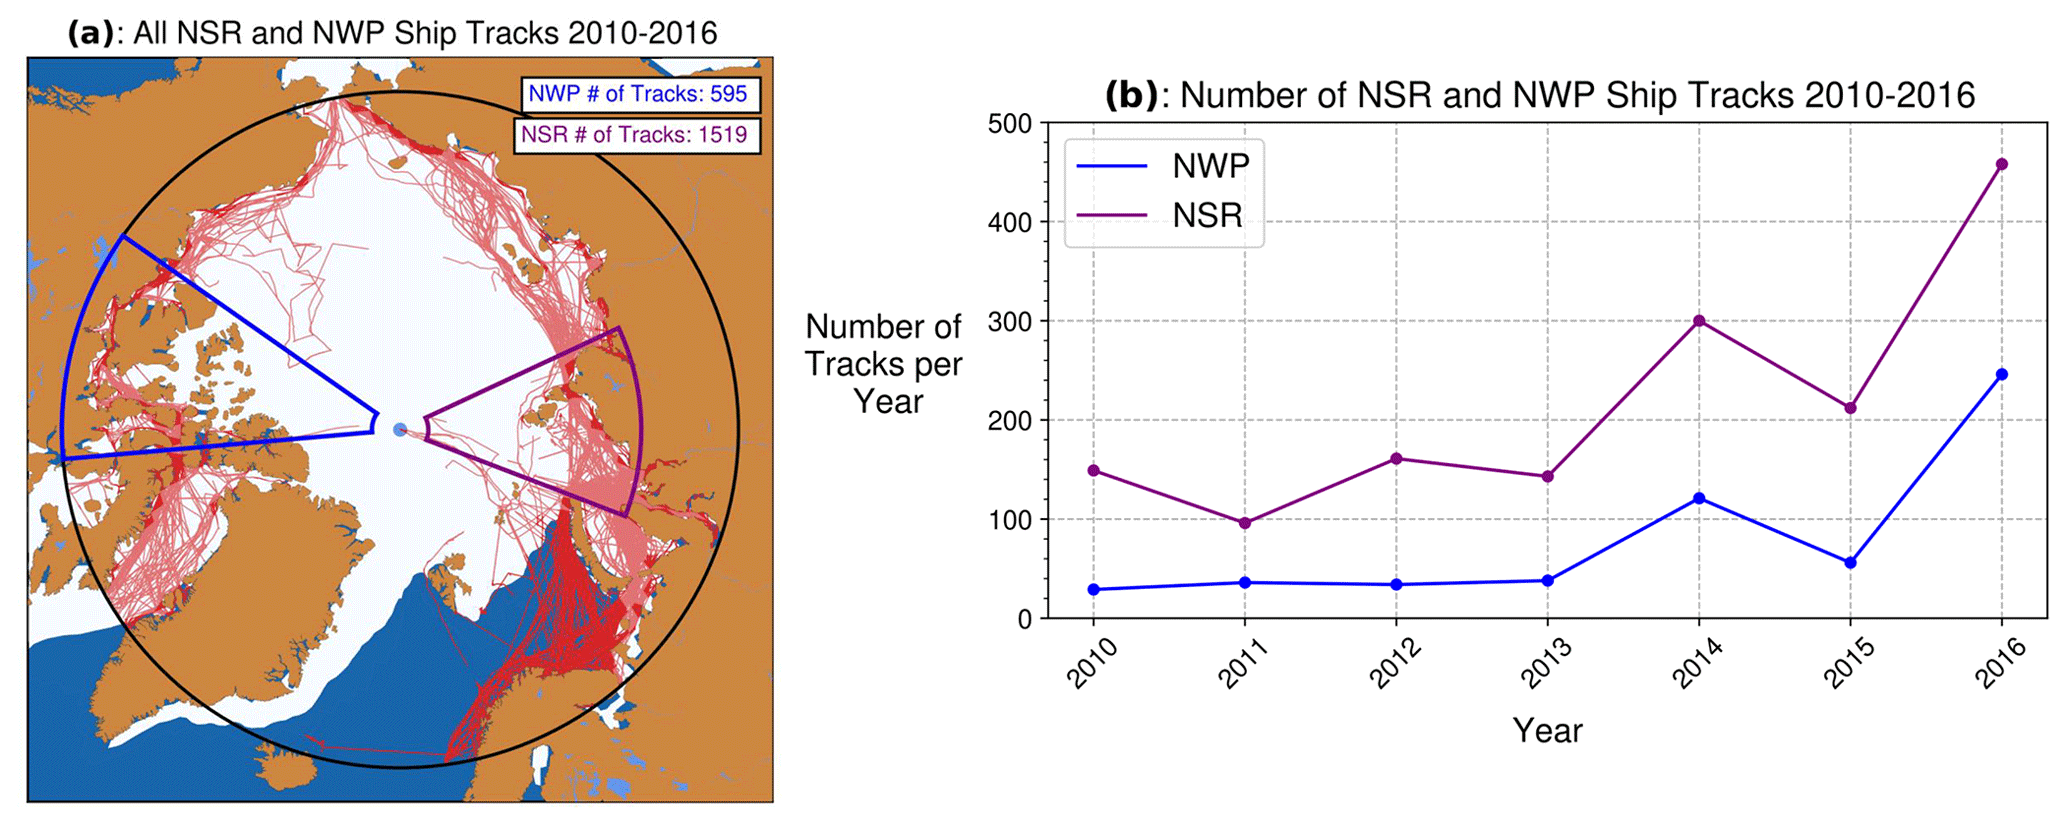
Figure 4(a) All trans-Arctic ship tracks (red lines) that travelled through the Northern Sea Route (NSR; along the coastline of Eurasia and through the purple box) and the ship tracks that travelled through the Northwest Passage (NWP; through the Canadian Arctic Archipelago and through the blue box) from January 2010 to December 2016 from the Berkman et al. (2020a) Arctic shipping dataset. The total number of ship tracks across the NSR and NWP are also indicated. The mean HadISST2.0 Arctic sea ice concentration greater than 15 % is shown in white. The solid black line indicates the Arctic Circle (66.5° N). (b) The annual number of trans-Arctic ship tracks that travelled through the NSR (purple line) and NWP (blue line) from January 2010 to December 2016.
Fewer ships travelled through the NWP (through the Canadian Arctic Archipelago) from 2010 to 2016 than through the NSR (see blue box in Fig. 4a). Fewer than 40 ships travelled through the NWP between 2010 and 2013, but this number was higher in 2014, 2015, and 2016 (Fig. 4b). In 2016, approximately 240 ships travelled through the Canadian Archipelago (+500 % increase; Fig. 4b). However, considering that there were tens of thousands of ship tracks north of the Arctic Circle each year between 2010 and 2016 (Fig. 3), the hundreds of ships travelling through the trans-Arctic shipping routes of the NSR and NWP each year (Fig. 4) were significantly fewer than the thousands, even tens of thousands, of ships travelling in the Barents Sea each year.
Arctic sea ice in the Canadian Arctic Archipelago and in the NWP is much thicker than the sea ice located north of the Eurasian continent and in the NSR (Sallila et al., 2019). Therefore, sea ice in the NSR is more susceptible to melting in summer and autumn months, and the NSR has a greater likelihood than the NWP of being navigable for ships. Hence, there is a higher number of ships in the NSR than in the NWP between 2010 and 2016 (Fig. 4). However, the number of ships travelling through the NSR per year does not show a consistent increase year-on-year, with approximately 300 and 210 ship tracks occurring in 2014 and 2015 respectively (Fig. 4b). So, the annual variation in the minimum Arctic sea ice extent may still influence the number of ships travelling through these trans-Arctic shipping routes.
Between 2005 and 2017, there were a total of 250 reported shipping incidents north of the Arctic Circle (Fig. 5a), with 158 occurring between 2010 and 2016 (Fig. 5b). This is only 0.09 % of all ships (176 961) that travelled north of the Arctic Circle between 2010 and 2016 (Fig. 1). These incidents resulted in damage and disruption to the ship and its crew and include 83 various types of incidents, including capsizing, allision, equipment failure, fire, flooding, grounding, loss of control and/or propulsion, and personnel overboard (Protection of the Arctic Maritime Environment Agency, 2023).
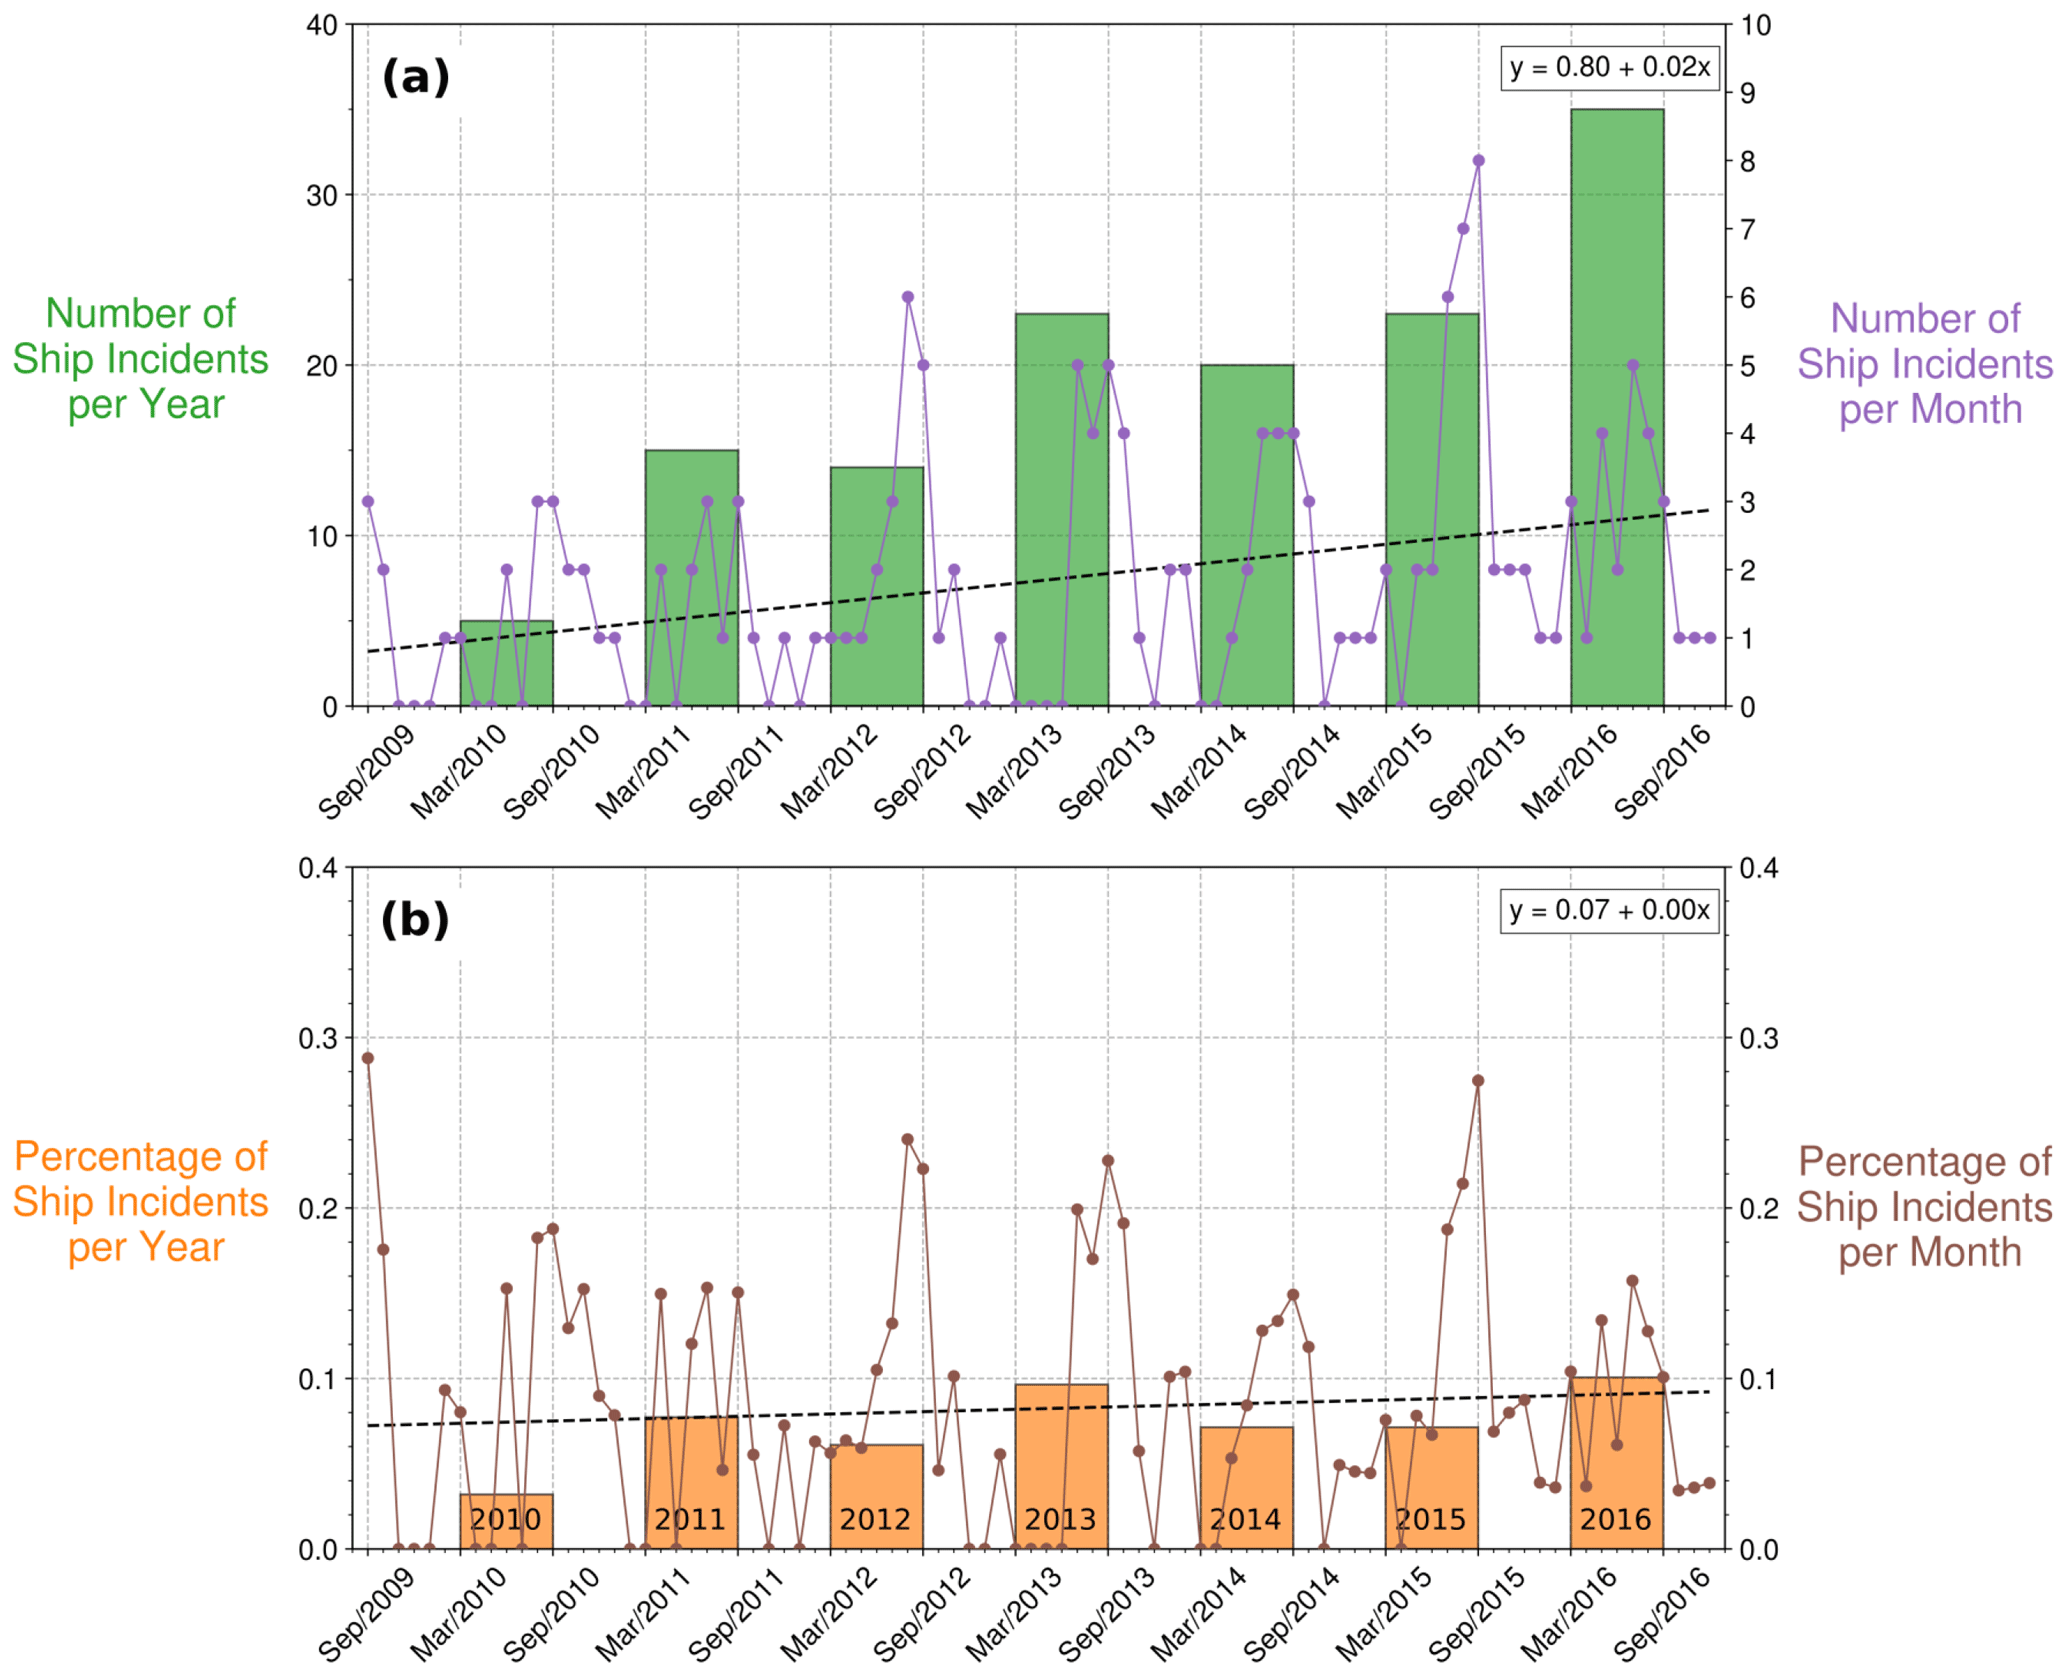
Figure 5(a) The total number of ships that reported an incident north of the Arctic Circle (66.5° N) per month and per year between September 2009 and December 2016 from the Protection of the Arctic Maritime Environment Agency (2023) dataset. (b) The percentage of ships that travelled north of the Arctic Circle (66.5° N) per month and per year between September 2009 and December 2016 that reported a shipping incident.
The ship with the highest tonnage to report an incident north of the Arctic Circle between 2005 and 2017 was the Stride tanker ship on 9 September 2013, the incident pertaining to which occurred in Murmansk, Russia. This ship is a large tanker with a tonnage of 60 325 t and a horizontal size of approximately 240 m. The incident report shows that this ship experienced contact with a fixed object in the Barents Sea (Protection of the Arctic Maritime Environment Agency, 2023). The report of this incident aligns with other media reports (e.g. Shipwreck Log, 2014). Another large oil tanker with a tonnage of 29 844 t, the SKF Enisey/SCF Yenisei, reported an incident on 26 September 2014. The incident report shows that this ship experienced contact with a fixed object in the Kara Sea, consequently leading to marine casualties (Protection of the Arctic Maritime Environment Agency, 2023). The report of this incident aligns with other media reports (e.g. Shipwreck Log, 2014). Most reported Arctic shipping incidents between 2005 and 2017 were from fishing vessels, and those ships have a tonnage less than 1000 t (Fig. S5 in the Supplement). However, the cause of these incidents is not reported, and it is not indicated whether these events occurred due to bad weather such as Arctic cyclones. This requires matching the position and time information with past Arctic cyclone tracks.
The number of Arctic shipping incidents is generally highest in summer months (Fig. 5a), which is when the number of ships operating in the Arctic is generally highest (Fig. 1). Up to 36 Arctic shipping incidents were reported per year, with the maximum occurring in 2016 (Fig. 1). The spatial distribution of reported Arctic shipping incidents also shows that the majority of incidents occur very close to coastlines (Fig. 6). In fact, very few incidents occur in the open Arctic Ocean (Fig. 6).
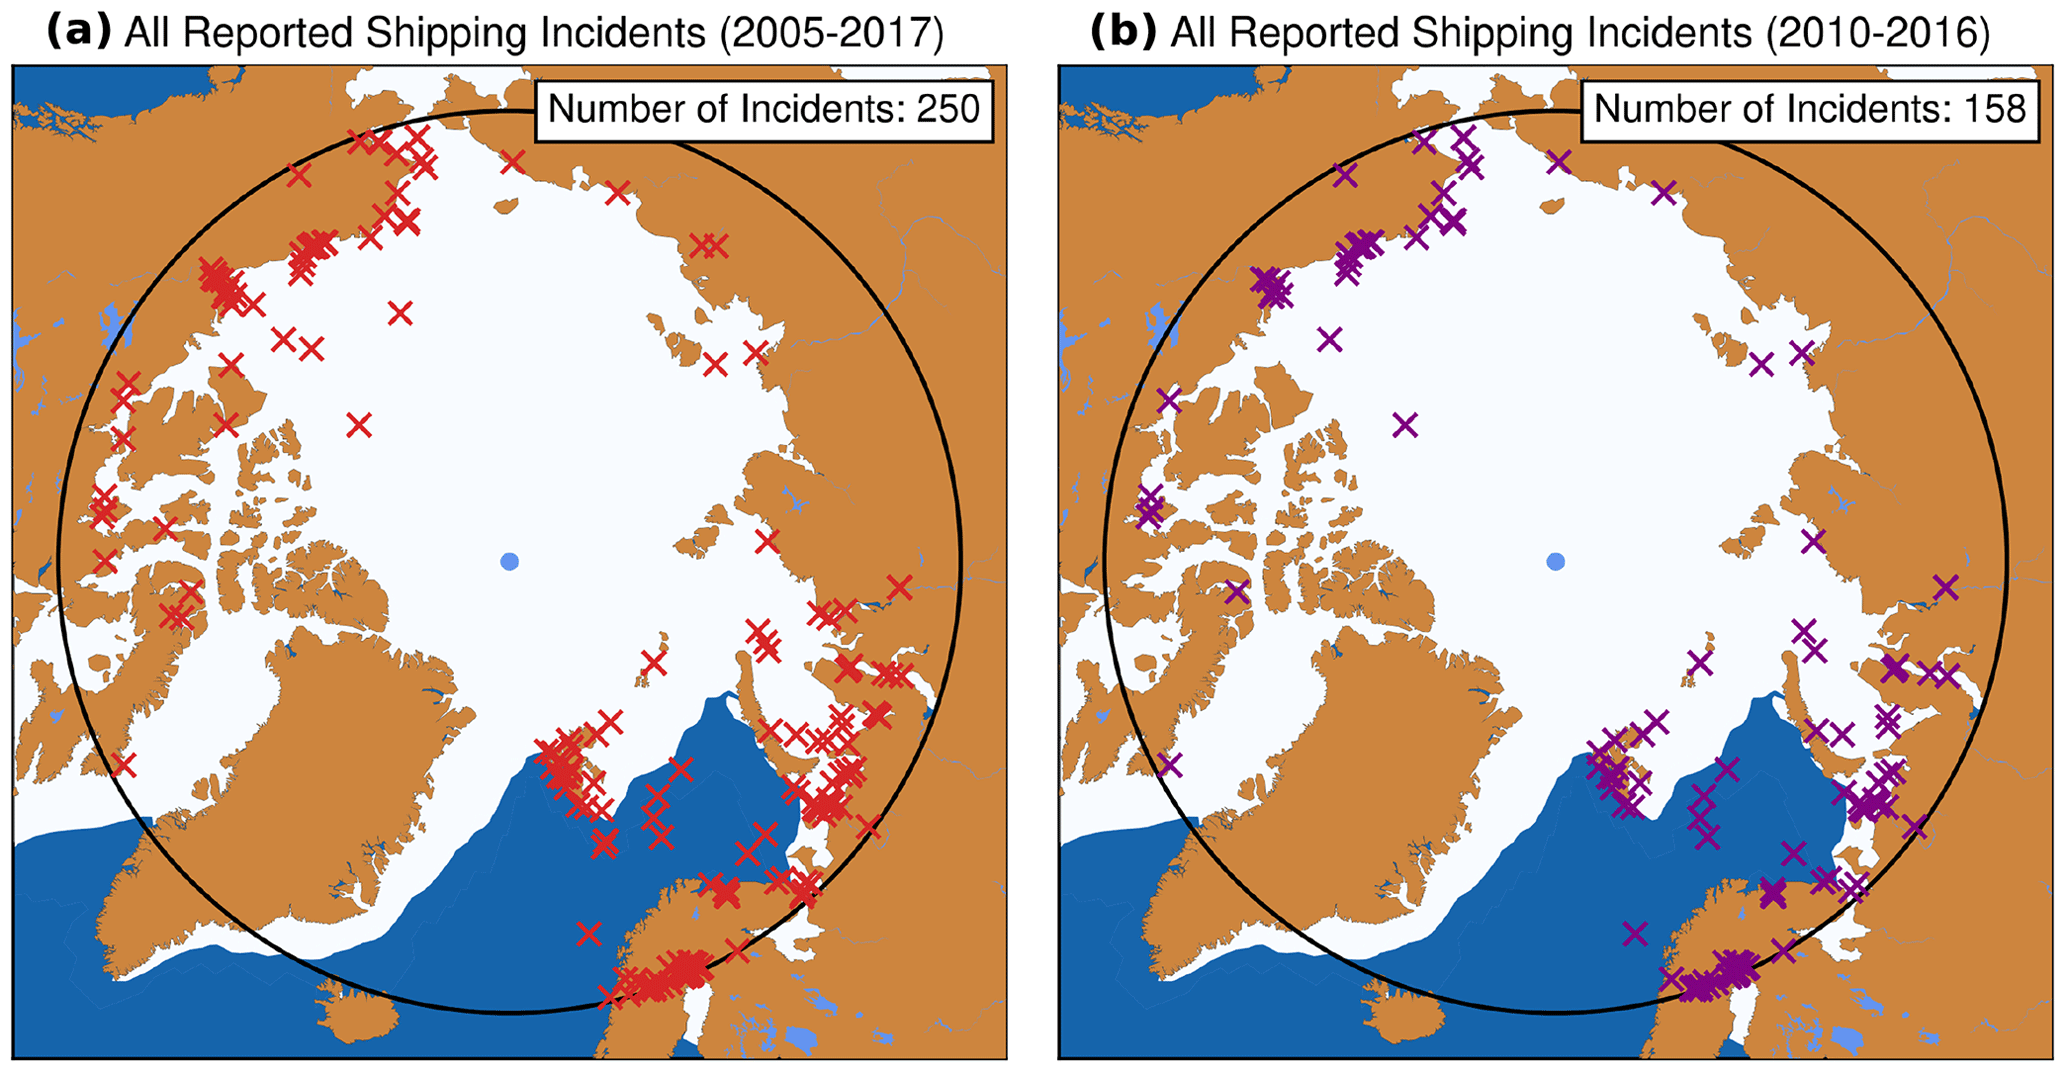
Figure 6The total number of reported shipping incidents in the Arctic (north of 66.5° N) between (a) 2005 and 2017 and between (b) 2010 and 2016 from the Protection of the Arctic Maritime Environment Agency (2023) database.
Although there is an increasing trend in the number of reported shipping incidents in the Arctic, these numbers are far less than the total number of ships travelling in the Arctic per year, which in 2016 was approximately 34 780 ships (Fig. 1). In 2016, of the 34 780 ships that travelled across the Arctic Ocean, only 36 ships (approximately 0.1 %) reported a shipping incident. Similarly in other years, less than approximately 0.1 % of all ships travelling in the Arctic Ocean reported a shipping incident (Fig. 5b). This shows that it is very uncommon for shipping incidents to occur despite the very high number of ships travelling in the Arctic Ocean.
Between 2010 and 2016, a total of 32 103, 15 246, and 4633 ship tracks intersected with an Arctic cyclone, where each ship's longitude and latitude coordinates were within 3° (approximately 333 km) of the longitude and latitude coordinates of a cyclone's maximum significant wave height at the same time step, and the significant wave height at the ship track coordinates was greater than 2.5 m (Fig. 7a), 4.0 m (Fig. 7b), and 6.5 m (Fig. 7c) respectively. These intensity thresholds are typically considered to lead to rough to very rough sea conditions using the Douglas sea state scale. However, between 2010 and 2016 only 9 shipping incidents (0.2 % of all intersections with significant wave height greater than 6.0 m and 6 % of all reported Arctic shipping incidents) were reported within 2 d following the intersection between a ship and an intense Arctic cyclone (Fig. 7d). So ships frequently intersect with and are impacted by intense Arctic cyclones with significant wave heights exceeding 6 m, but only a handful of these intersections resulted in a reported shipping incident.
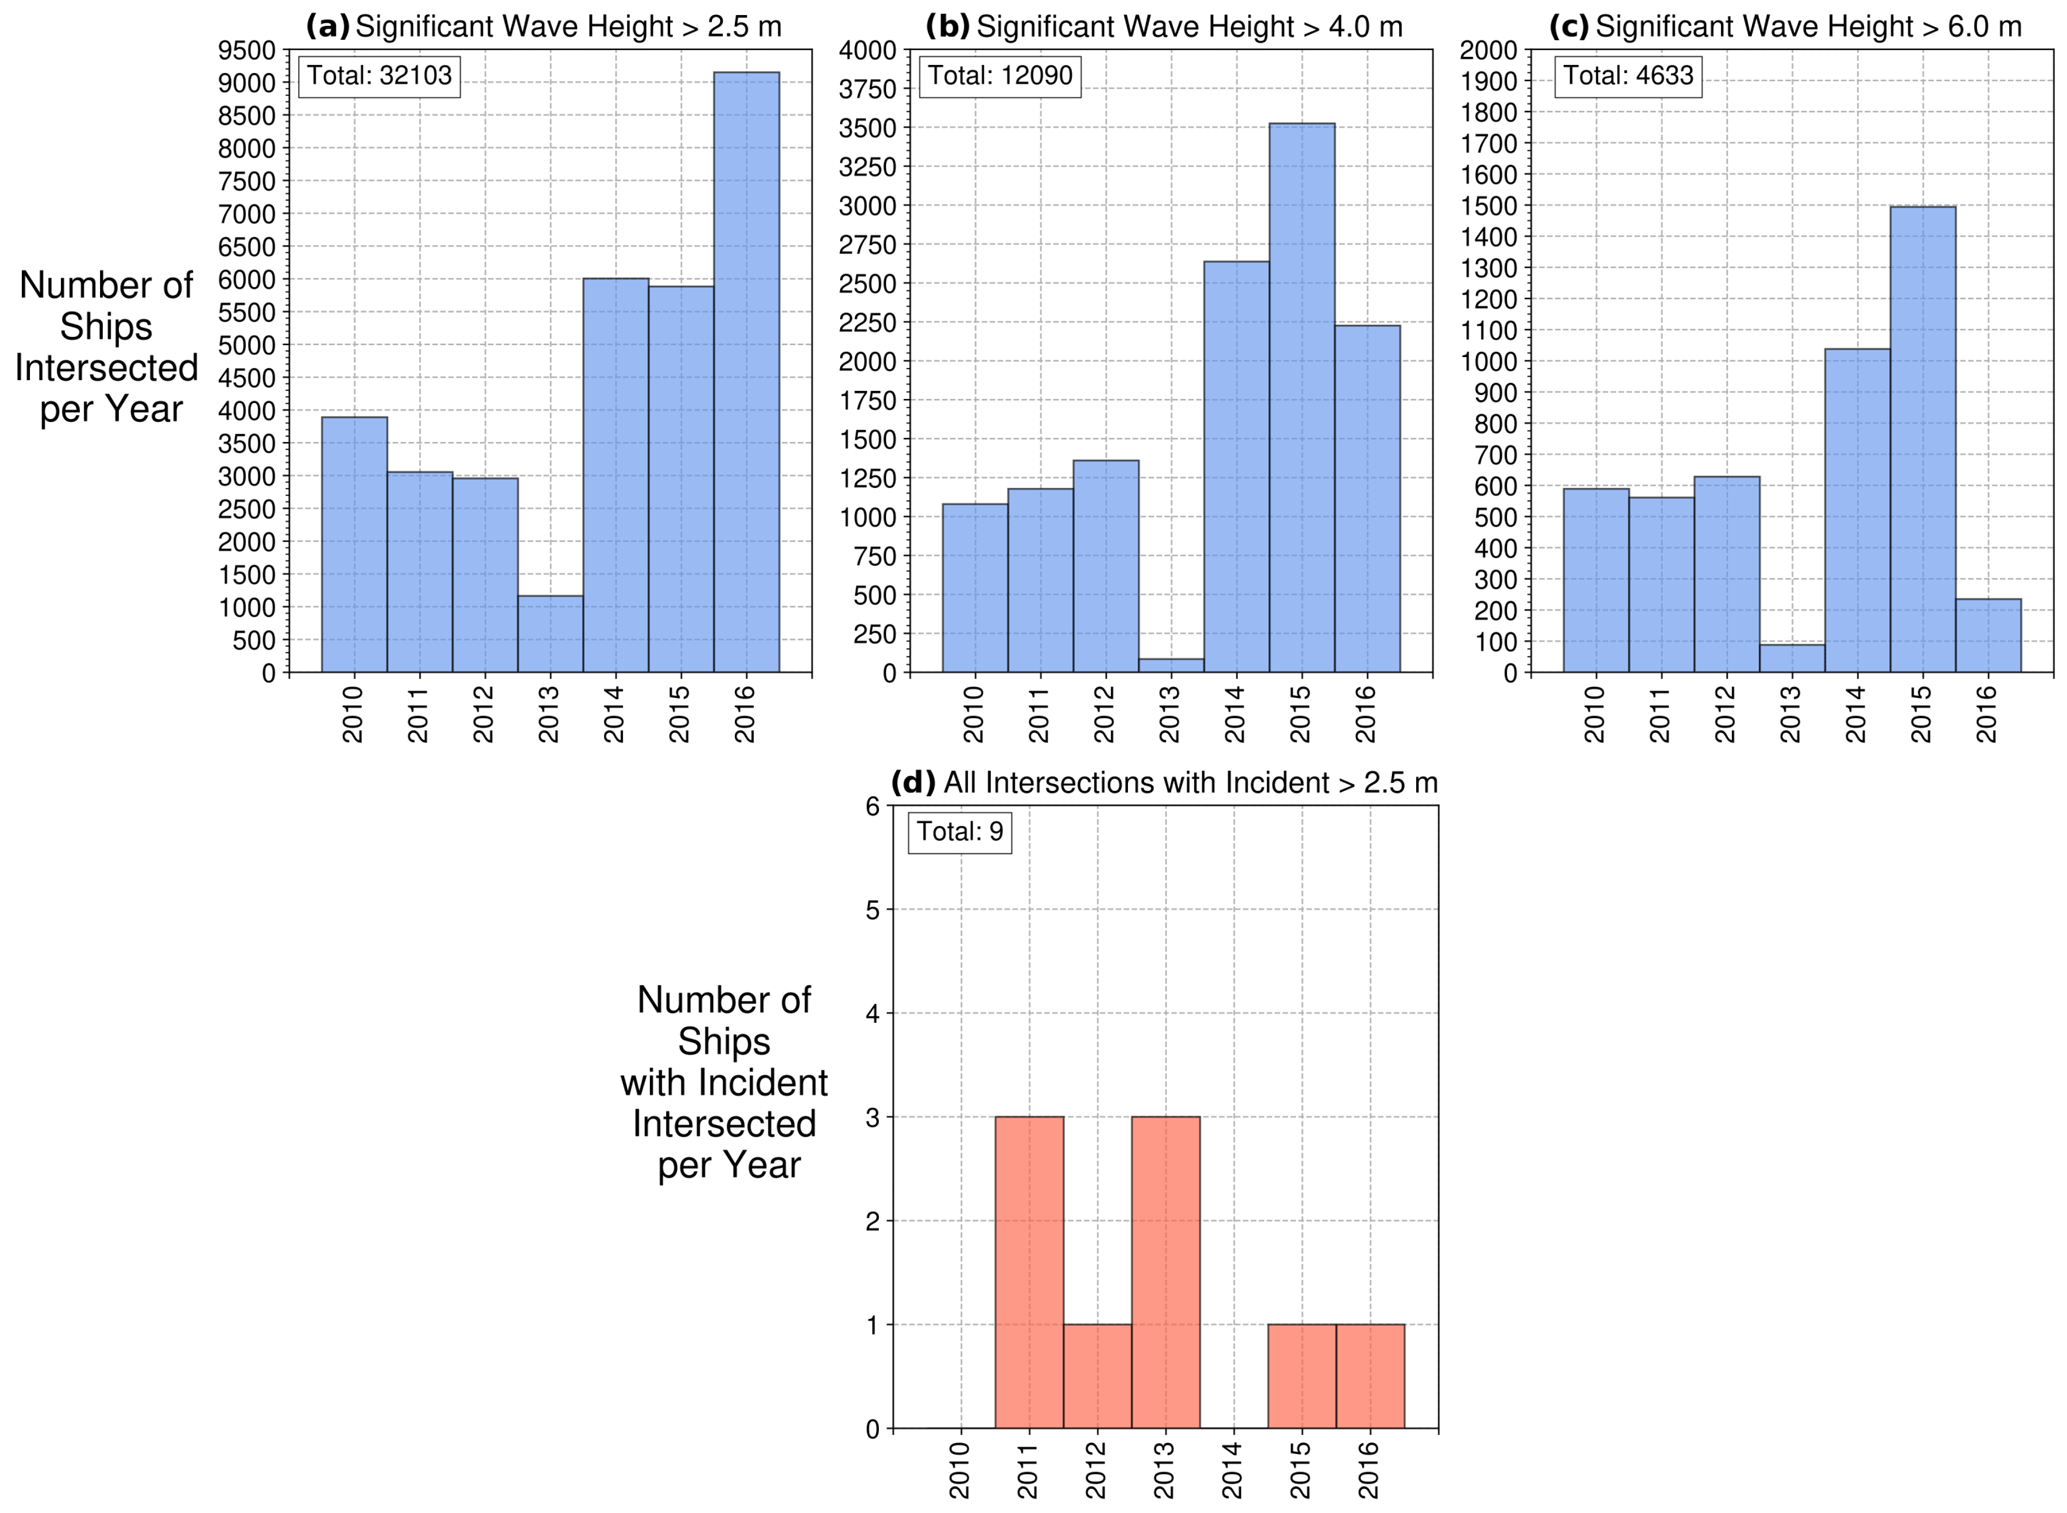
Figure 7The annual number of Arctic ship and cyclone intersections from 2010 to 2016, where a ship's longitude and latitude coordinates are within 3° (approximately 333 km) of the longitude and latitude coordinates of the cyclone's maximum significant wave height at the same time step and where the significant wave height at the ship track coordinates is greater than (a) 2.5 m, (b) 4.0 m, and (c) 6.0 m. (d) The number of intersections that led to a reported shipping incident within 48 h of an Arctic ship and cyclone intersection. Note: multiple intersections between a cyclone and the same ship track are not double counted.
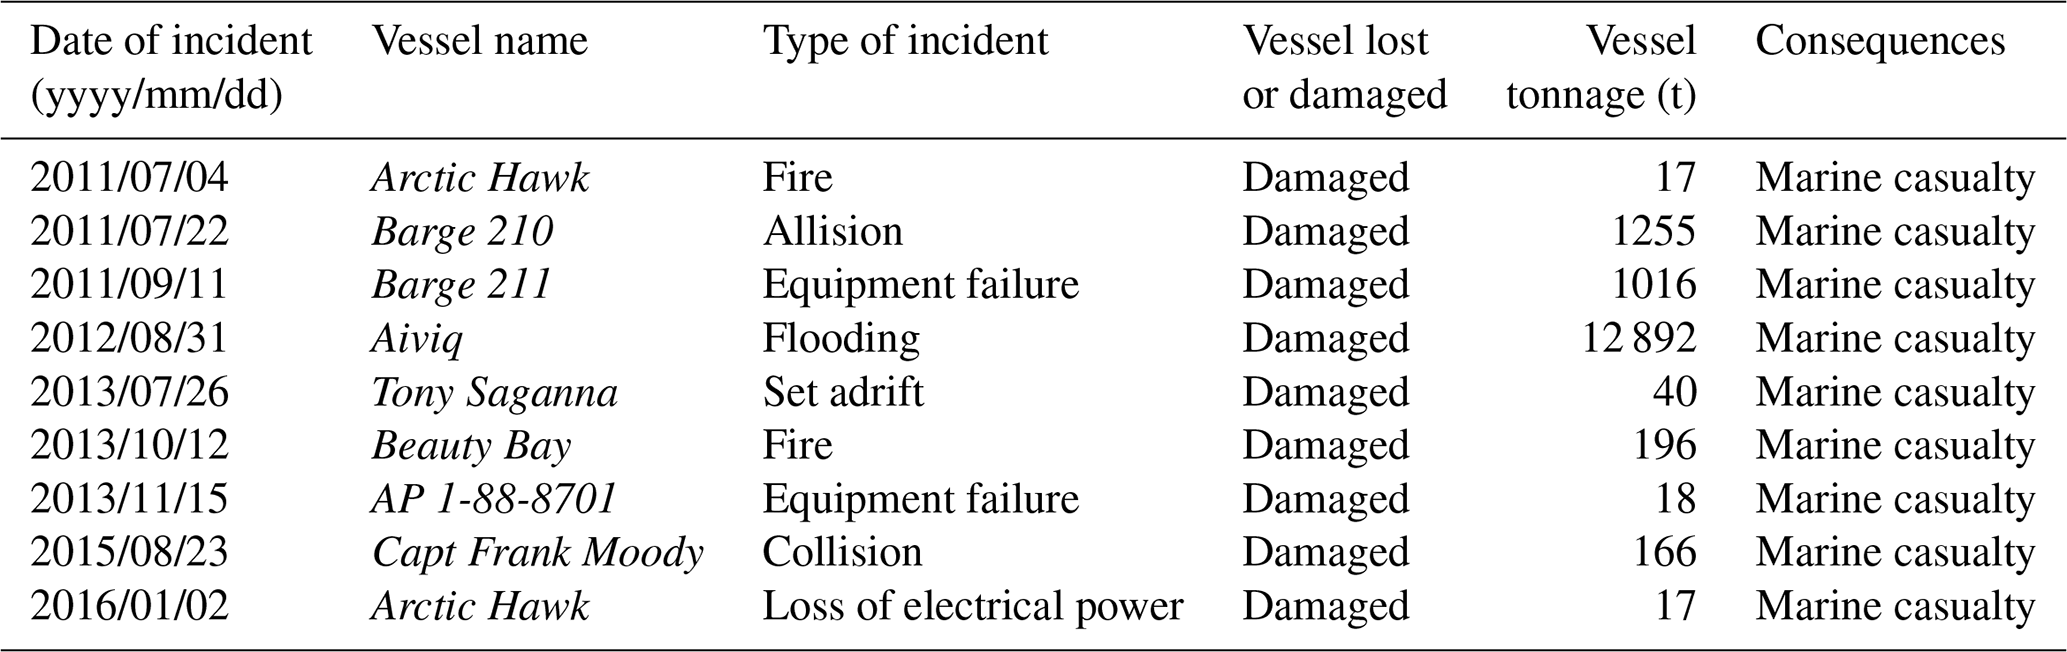
All of the shipping incidents following the intersection of a ship and cyclone are described as causing only partial damage to the ship, and none of these intersections resulted in the ship being lost (Table 2). These shipping incidents included fire, allision and/or collision, equipment failure, loss of electrical power, and loss of control (Table 2). The consequences of these incidents included marine casualties (Table 2). All but one of the ships to report an incident had a tonnage of approximately 1000 t or lower. As larger ships (e.g. cargo ships) often have a tonnage greater than 10 000 t (UNCTAD, 2022), the ships that reported a shipping incident following the passage of an Arctic cyclone were likely smaller ships, e.g. fishing vessels.
Table 2Summary of all reported incidents between 2010 and 2016 following an intersection between a ship track and an Arctic cyclone track, where a ship's longitude and latitude coordinates are within 3° (approximately 333 km) of the longitude and latitude coordinates of the cyclone's maximum significant wave height at the same time step and where the significant wave height at the ship track coordinates is greater than 2.5 m. Shipping incident data are from Protection of the Arctic Maritime Environment Agency (2023).
There are reports of other fishing vessels being impacted by the passage of Arctic cyclones that are not included in the Protection of the Arctic Maritime Environment Agency (2023) shipping incidents database, which is limited to incidents that occurred between 2005 and 2017. For example, the Arctic Rose fishing vessel sank in the Bering Sea in April 2001 after being impacted by high wind and waves that could have resulted from the passage of an Arctic cyclone (Borlase, 2003). Another example includes the Gaul fishing vessel, which sank in 1974 after being impacted by the passage of an intense cyclone (BBC News, 2014).
When searching for shipping incidents within a 6.0° (approximately 666 km) area from the location of an Arctic cyclone's maximum significant wave height, only 10 Arctic shipping incidents were reported within 48 h of the passage of an Arctic cyclone (Fig. S6 in the Supplement). This is still only a very small percentage (less than approximately 0.02 % of all the intersections with significant wave height greater than 6.0 m) of the total number of intersections between ship tracks and Arctic cyclone tracks, as a total of 47 327, 26 530, and 6661 ship tracks were found to intersect within a 6.0° radius of a past Arctic cyclone track, causing significant wave heights at the ships' locations to be greater than 2.5, 4.0, and 6.0 m respectively (Fig. S6 in the Supplement). So, even when altering the ship and cyclone intersection method, intersections between ships and intense Arctic cyclones were found to be very common from 2010 to 2016, with a very low percentage of these intersections resulting in a reported shipping incident.
To gauge how ships respond to the passage of intense Arctic cyclones, the most intense cyclones between 2010 and 2016 that travelled through the busiest cluster of Arctic ships (in the Barents Sea; Fig. 3) were identified within the ERA-5 dataset. According to ERA-5, the five most intense Arctic cyclones that caused the highest and most intense significant wave heights in the Barents Sea between 2009 and 2016 occurred in December 2012, December 2014, February 2015, March 2015, and March 2016, when significant wave heights in the Barents Sea exceeded 10 m (Fig. 8).
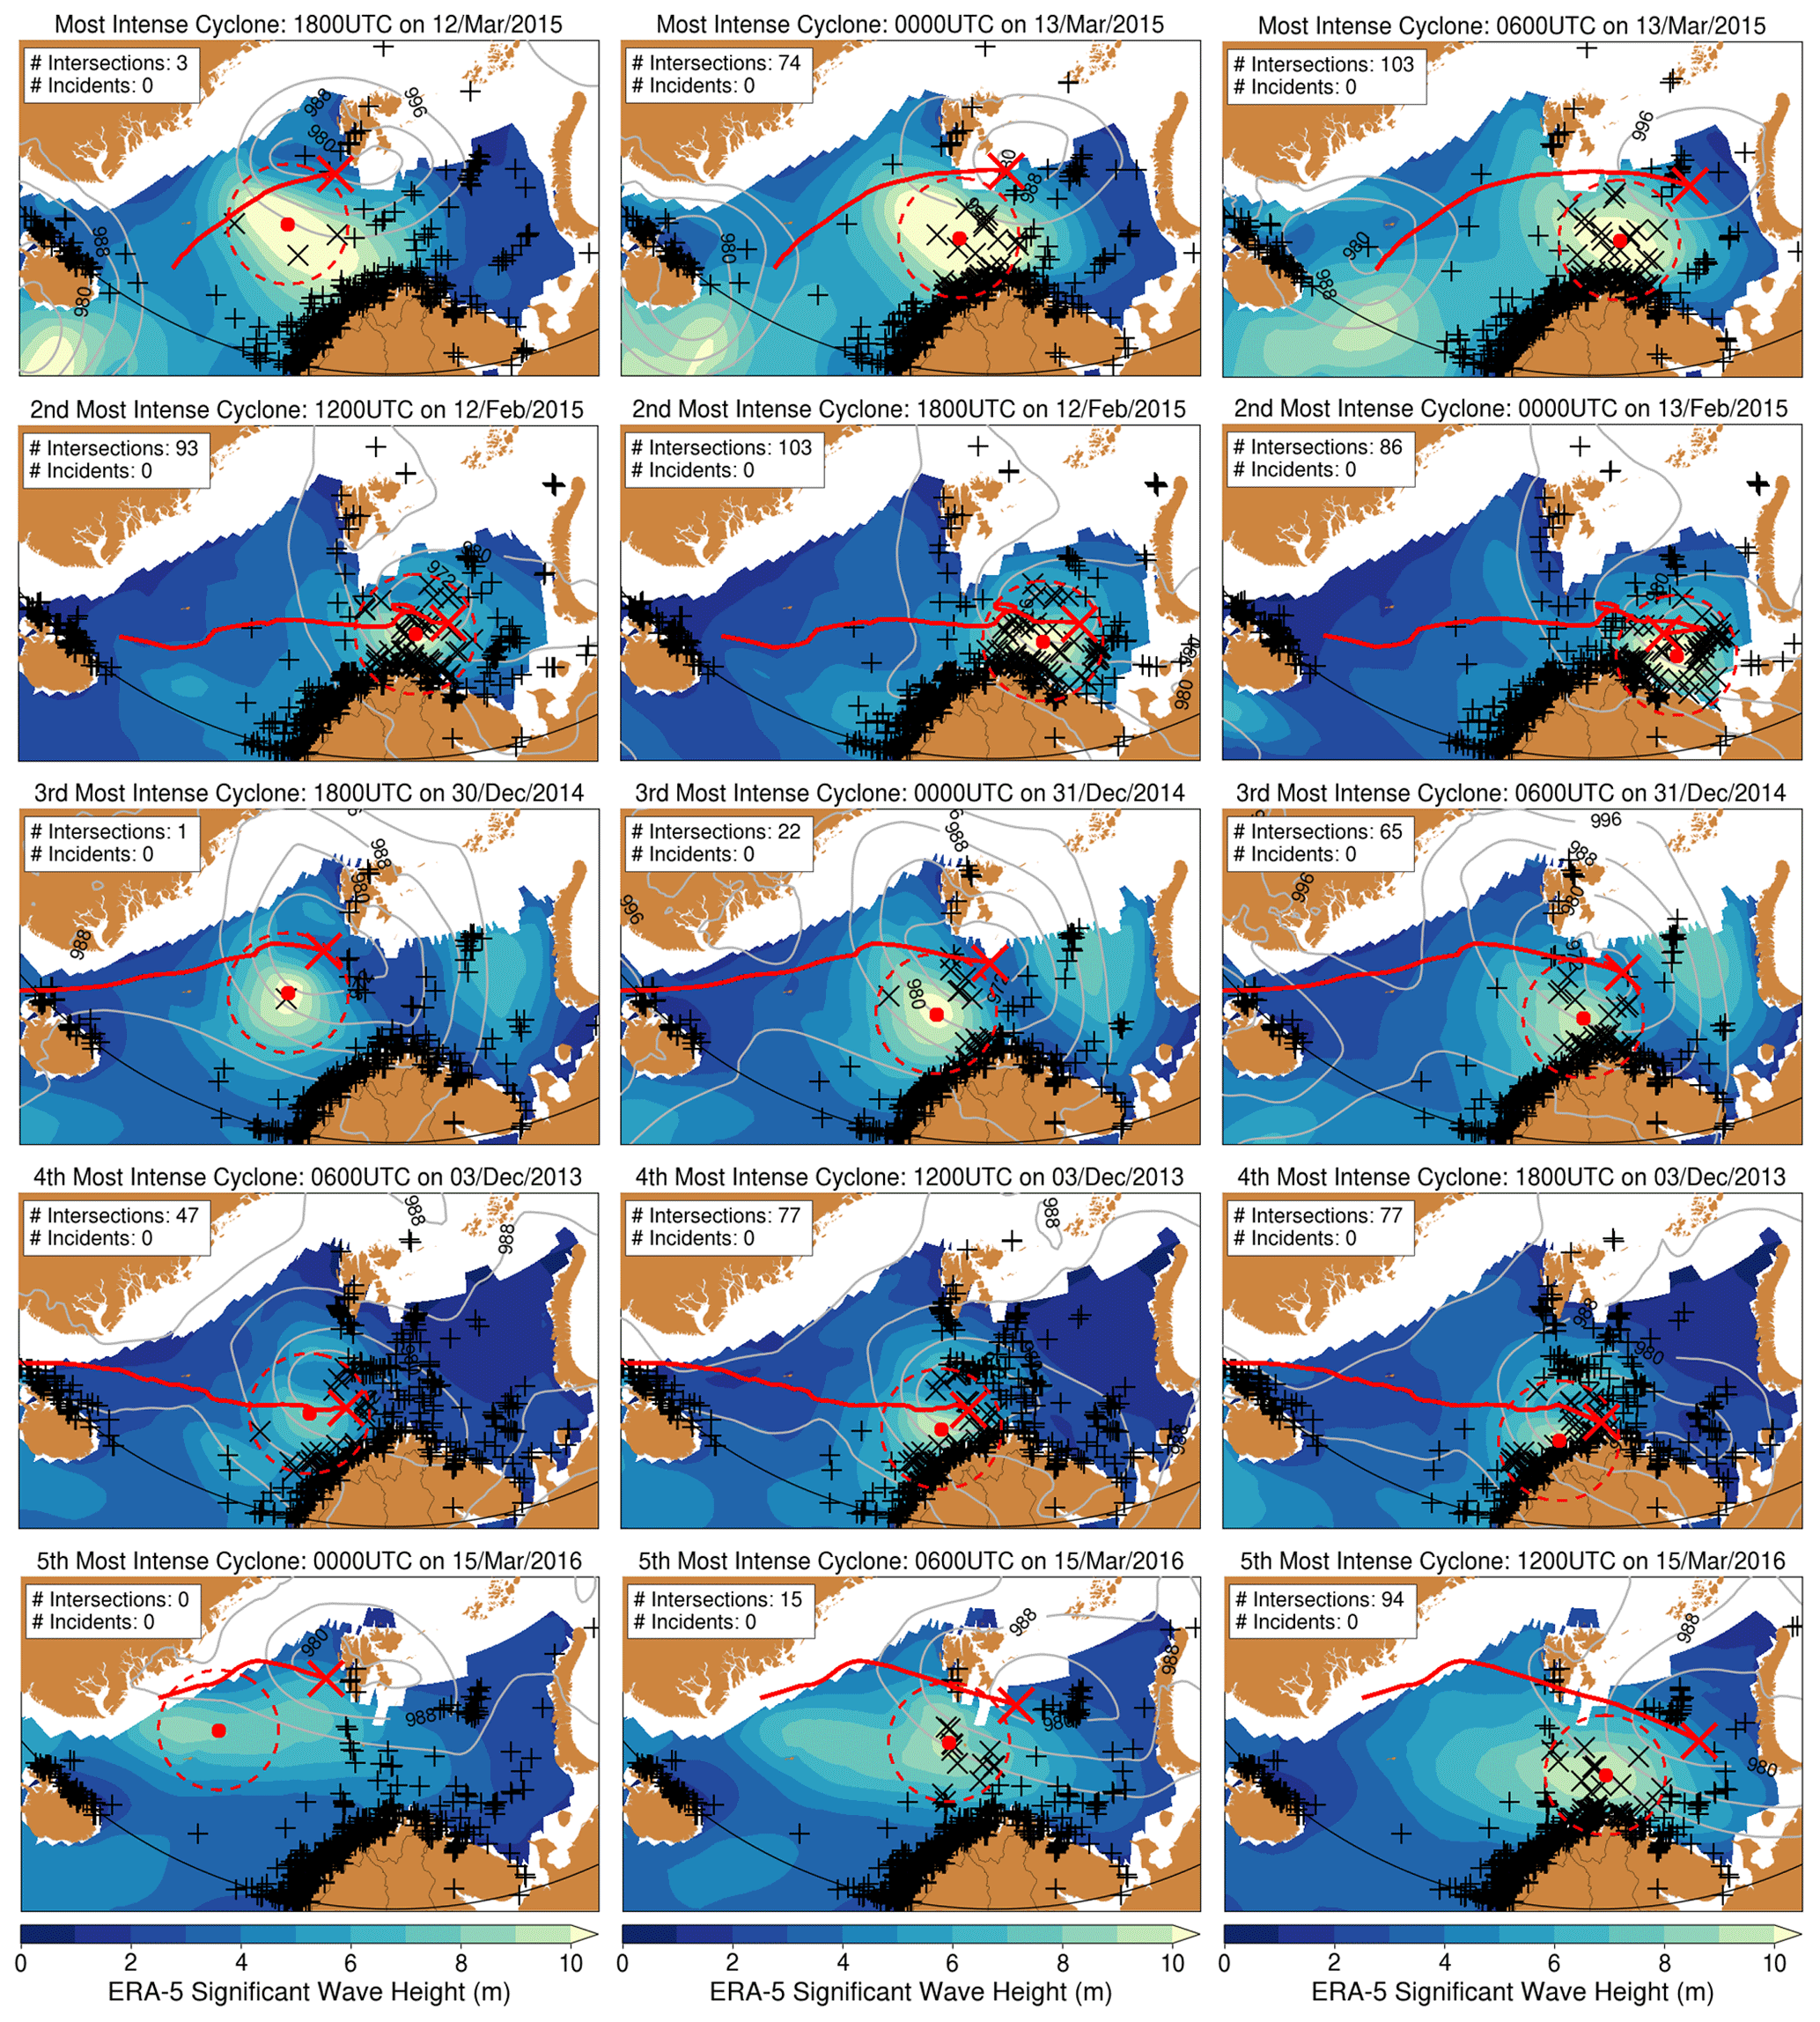
Figure 8Tracks of the five most intense Arctic cyclones with the highest maximum significant wave heights in the Barents Sea (between 20–30° E and 71–77° N) from 2009 to 2016 based on ERA-5 data. The cyclone 850 hPa relative vorticity centre is denoted by the red cross and its track by the solid red line. The location of the cyclone's maximum significant wave height is denoted by the red dot marker, with the 3° radius around this point denoted by the dashed red line. Significant wave height is given by the colour contours, and the sea level pressure is given by the grey contours. Arctic sea ice extent (sea ice concentration > 15 %) is indicated in white. The black “+” markers denote AIS-derived ship coordinates at each time step, with ships that intersected with the cyclone track denoted by the black “x” markers.
We would expect ships to avoid the paths of these most intense Arctic cyclones, given that ships have been provided with weather forecasts. This, however, does not seem to be the case as ship tracks were located within the regions of the tallest waves, even in regions where waves exceeded 10 m (Fig. 8). As many as 103 intersections between these cyclones and ships occurred, but no shipping incidents were reported up to 48 h after these intersections (Fig. 8). Ships appear able to withstand and even travel through the passage of the most intense historical Arctic cyclones. Furthermore, after consulting the shipping incident reports, none of the most intense Arctic cyclones resulted in a reported shipping incident (Table 2).
So perhaps the risk of total loss of the ship and its cargo is low and mitigated by the ship's ability to withstand the roughest sea conditions caused by an intense Arctic cyclone. However, other than direct damage to the ship and its cargo, the ship could experience business interruption due to the passage of intense Arctic cyclones. This could lead to a delay in the ship's transit if the ship has to slow down and prepare for the cyclone's approach. Other damage could occur to port facilities, which is not considered here. So indirect damage could occur following the passage of an intense Arctic cyclone, leading to financial losses.
The risk posed by Arctic cyclones to ships has seldom been quantified due to the lack of publicly available past Arctic ship track data. Such data are often privately owned and difficult and costly to obtain. However, the lack of publicly available historic ship track data has been somewhat reduced by Berkman et al. (2020a), who published Arctic ship track data derived from automatic identification system (AIS) transponders over a limited time period (September 2009–December 2016). This publicly available dataset is used in this study with past shipping incident reports and past cyclone tracks to quantify how many ships were impacted by hazardous weather conditions caused by Arctic cyclones and how many Arctic shipping incidents occurred following the passage of a cyclone.
Overall, the number of ships operating in the Arctic (north of 66.5° N) and exposed to intense Arctic cyclones has greatly increased between 2010 and 2016. Intense Arctic cyclones are found to very frequently intersect Arctic ship tracks, with tens of thousands of intersections occurring each year. But only a very small percentage of these intersections caused a reported shipping incident, suggesting that past Arctic cyclones were not hazardous to ships, and ships are instead able withstand the weather conditions caused by the most hazardous Arctic cyclones.
-
The number of ships operating in the Arctic and transmitting their locations using AIS transponders has more than doubled from 2010 to 2016, and the highest track density of ships and intense cyclones in the Arctic occurs in the Barents and Norwegian seas and around Iceland.
Arctic sea ice extent has declined greatly over the last few decades due to global warming. It is shown in this study that the annual number of ships operating in the Arctic has increased year-on-year from 2010 to 2016, from 15 666 ships in 2010 to 34 780 ships in 2016. Arctic ship track density and intense cyclone track density are greatest year-round in the Barents and Norwegian seas and around Iceland. This is especially the case in winter and spring, when ships are rarely found in trans-Arctic shipping routes and there is a higher density of intense Arctic cyclones in these regions. In summer and autumn, Arctic ship tracks are found more widely across the southern Arctic and also in the trans-Arctic shipping routes of the Northern Sea Route (NSR) and the Northwest Passage (NWP), which run along the coastline of Eurasia and through the Canadian Arctic Archipelago respectively.
The number of ships operating in the Arctic correlates with Arctic sea ice extent, with a higher monthly and seasonal number of ships operating in the Arctic coinciding with lower Arctic sea ice extent in late summer and early autumn months. The number of ships travelling through the NSR and NWP has increased from 2010 to 2016, with the NSR typically having more ship transits than the NWP per year. This is likely due to the NSR being typically more ice-free in summer and autumn months than the NWP, where sea ice tends to be thicker and less susceptible to melting.
-
The number of reported shipping incidents has increased from 2010 to 2016, but the total number of reported shipping incidents is approximately 0.1 % of the total number of ships operating in the Arctic.
Between 2010 and 2016, a total of 176 961 ships travelled in the Arctic, but there were only a total of 158 reported Arctic shipping incidents, which is approximately 0.1 % of the total number of ships. Most ships that reported an incident had a gross tonnage of less than 1000 t, suggesting that smaller vessels, such as fishing vessels, are more prone to incidents than larger ships, such as cargo vessels. Most reported shipping incidents occurred near the coastlines of the Arctic, and fewer incidents were located in the open Arctic Ocean. The increasing number of reported shipping incidents from 2010 to 2016 is likely a consequence of the number of ships travelling in the Arctic increasing year-on-year, but the number of reported incidents remains a very small percentage of all ships operating and travelling in the Arctic.
-
Despite Arctic ships very frequently intersecting with the track of an intense Arctic cyclone, only a handful of these intersections resulted in a reported shipping incident.
Between 2010 and 2016, a total of 32 103, 15 246, and 4633 ship tracks intersected with and were located within 3° (approximately 333 km) of an Arctic cyclone, with the significant wave height at the ship's location being greater than 2.5, 4.0, and 6.5 m respectively. But only 9 reported shipping incidents (0.2 % of the all intersections with significant wave height greater than 6.0 m) were found to have occurred within 2 days of the intersection between an Arctic ship and an intense cyclone. So, the vast majority of past reported shipping incidents appear unrelated to the passage of intense Arctic cyclones.
It is surprising how frequently Arctic ship tracks intersected with an intense Arctic cyclone. The track of an intense Arctic cyclone would likely be communicated through weather forecasts, allowing ships to avoid the forecasted paths of the intense Arctic cyclones. In this study, numerous ships were found to be positioned within and impacted by the tracks of the most intense Arctic cyclones but were able to withstand the severe weather conditions, and no shipping incidents were reported.
This study suggests that cyclones are not a dominant cause of reported Arctic shipping incidents in the present climate, even though ships are frequently impacted by intense Arctic cyclones. However, ships could also experience consequences other than damage to the ship and crew, such as business interruption and delays in transit, and damage could also occur to port facilities. Although we conclude that synoptic-scale cyclones pose a low risk to Arctic shipping, other severe weather phenomena not considered in this study such as polar lows, which have been found to impact normal shipping operations (Rasmussen, 2003) and to have caused the loss of numerous small vessels (Rasmussen, 2003), could threaten shipping in the Arctic.
This study exemplifies the capabilities of open-access risk analysis and quantifies the risk of past Arctic cyclones impacting Arctic shipping and the number of past shipping incidents caused by Arctic cyclones, which could be useful for decision-making institutions, the insurance industry, and the public. This study relies on open-access atmospheric, ship track, and shipping incident data repositories. Whilst there are considerable amounts of freely available atmospheric data from various institutions, open-access social data such as ship tracks and shipping incidents are much less attainable and are often privatized. Consequently, this study was limited to investigating the risk of Arctic cyclones to shipping in a short time period between 2010 and 2016. As global warming continues to change the Arctic rapidly, extensive and up-to-date ship track and incident data need to be more publicly available so that the risks to shipping can be monitored and ultimately mitigated.
The ERA-5 reanalysis data (Hersbach et al., 2020) (https://doi.org/10.1002/qj.3803) were downloaded from the Copernicus Climate Change Service (C3S) Climate Data Store (https://doi.org/10.24381/cds.bd0915c6, Hersbach et al., 2023). The TRACK algorithm is available from the University of Reading’s Git repository (GitLab) at https://gitlab.act.reading.ac.uk/track/track/-/releases (Hodges, 2021).
The supplement related to this article is available online at: https://doi.org/10.5194/nhess-24-2115-2024-supplement.
AFV conducted all of the analyses detailed in this paper and took the responsibility of writing this paper. KIH, LCS, and JJD assisted with the analysis and writing.
The contact author has declared that none of the authors has any competing interests.
The content of the article is the sole responsibility of the author(s) and it does not represent the opinion of the European Commission, and the Commission is not responsible for any use that might be made of information contained.
Publisher’s note: Copernicus Publications remains neutral with regard to jurisdictional claims made in the text, published maps, institutional affiliations, or any other geographical representation in this paper. While Copernicus Publications makes every effort to include appropriate place names, the final responsibility lies with the authors.
The authors were funded and supported by the Scenario NERC Doctoral Training Partnership grant and by the co-sponsor, AXA XL, in the development of this research. The authors would also like to acknowledge the European Centre for Medium-Range Weather Forecasts (ECMWF) for the production of the ERA-5 reanalysis dataset. Finally, we thank Paul Arthur Berkman and the other anonymous reviewer for their constructive comments that helped to improve this paper.
This research has been supported by the Scenario NERC Doctoral Training Partnership Grant (grant no. NE/L002566/1) and the European Union Horizon 2020 Research and Innovation programme (grant no. 727862 APPLICATE).
This paper was edited by Philip Ward and reviewed by Paul Arthur Berkman and one anonymous referee.
Arctic Monitoring & Assessment Programme: Working Group of the Arctic Council: Arctic topography and bathymetry, https://www.amap.no/documents/doc/Arctic--topography--and--bathymetry/570 (last access: 12 February 2023), 2020. a
Asplin, M. G., Galley, R., Barber, D. G., and Prinsenberg, S.: Fracture of summer perennial sea ice by ocean swell as a result of Arctic storms, J. Geophys. Res.-Oceans, 117, 1999–2049, https://doi.org/10.1029/2011JC007221, 2012. a
BBC News: Gaul sunken trawler: Russian bodies not ship's crew, https://www.bbc.com/news/uk-england-humber-29593306 (last access: 15 February 2023), 2014. a
Berkman, P. A., Fiske, G., and Lorenzini, D.: Baseline of Next-Generation Arctic Marine Shipping Assessments – Oldest Continuous Pan-Arctic Satellite Automatic Identification System (AIS) Data Record of Maritime Ship Traffic, 2009–2016, https://doi.org/10.18739/A2TD9N89Z, 2020a. a, b, c, d, e, f, g, h, i
Berkman, P. A., Fiske, G., Røyset, J.-A., Brigham, L. W., and Lorenzini, D.: Next-Generation Arctic marine shipping assessments, in: Governing Arctic Seas: Regional Lessons from the Bering Strait and Barents Sea, Springer, 241–268, https://doi.org/10.1007/978-3-030-25674-6_11, 2020b. a, b, c, d
Berkman, P. A., Fiske, G. J., Lorenzini, D., Young, O. R., Pletnikoff, K., Grebmeier, J. M., Fernandez, L. M., Divine, L. M., Causey, D., Kapsar, K. E., and Jørgensen, L. L.: Satellite record of pan-Arctic maritime ship traffic, NOAA technical report OAR ARC, 22–10, https://doi.org/10.25923/mhrv-gr76, 2022. a, b, c, d, e, f
Borlase, G. A.: Research opportunities identified during the casualty analysis of the fishing vessel Arctic Rose, Mar. Technol. SNAME N., 40, 270–277, 2003. a
Browning, K.: The sting at the end of the tail: Damaging winds associated with extra-tropical cyclones, Q. J. Roy. Meteor. Soc., 130, 375–399, 2004. a
Browse, J., Carslaw, K., Schmidt, A., and Corbett, J.: Impact of future Arctic shipping on high-latitude black carbon deposition, Geophys. Res. Lett., 40, 4459–4463, 2013. a
Comiso, J. C., Meier, W. N., and Gersten, R.: Variability and trends in the Arctic Sea ice cover: Results from different techniques, J. Geophys. Res.-Oceans, 122, 6883–6900, 2017. a
Corbett, J. J., Lack, D. A., Winebrake, J. J., Harder, S., Silberman, J. A., and Gold, M.: Arctic shipping emissions inventories and future scenarios, Atmos. Chem. Phys., 10, 9689–9704, https://doi.org/10.5194/acp-10-9689-2010, 2010. a, b
Coumou, D., Di Capua, G., Vavrus, S., Wang, L., and Wang, S.: The influence of Arctic amplification on mid-latitude summer circulation, Nat. Commun., 9, 2959, https://doi.org/10.1038/s41467-018-05256-8, 2018. a
Crawford, A. D. and Serreze, M. C.: Does the summer Arctic frontal zone influence Arctic Ocean cyclone activity?, J. Climate, 29, 4977–4993, 2016. a, b
Day, J. J. and Hodges, K. I.: Growing land-sea temperature contrast and the intensification of Arctic cyclones, Geophys. Res. Lett., 45, 3673–3681, 2018. a
Day, J. J., Holland, M. M., and Hodges, K. I.: Seasonal differences in the response of Arctic cyclones to climate change in CESM1, Clim. Dynam., 50, 3885–3903, 2018. a
Eguiluz, V. M., Fernández-Gracia, J., Irigoien, X., and Duarte, C. M.: A quantitative assessment of Arctic shipping in 2010–2014, Sci. Rep., 6, 30682, https://doi.org/10.1038/srep30682, 2016. a, b, c
Fetterer, F., Knowles, K., Meier, W. N., Savoie, M., and Windnagel, A. K.: Sea Ice Index, Version 3, Boulder, Colorado USA. National Snow and Ice Data Center [data set], https://doi.org/10.7265/N5K072F8, 2017. a, b, c, d
Google Earth: Google Earth, https://earth.google.com/web/ (last access: 12 May 2023), 2023. a
Gray, S. L., Hodges, K. I., Vautrey, J. L., and Methven, J.: The role of tropopause polar vortices in the intensification of summer Arctic cyclones, Weather Clim. Dynam., 2, 1303–1324, https://doi.org/10.5194/wcd-2-1303-2021, 2021. a
Harsem, Ø., Heen, K., Rodrigues, J. M. P., and Vassdal, T.: Oil exploration and sea ice projections in the Arctic, Polar Rec., 51, 91–106, doi:10.1017/S0032247413000624, 2015. a
Hersbach, H., Bell, B., Berrisford, P., Biavati, G., Horányi, A., Muñoz Sabater, J., Nicolas, J., Peubey, C., Radu, R., Rozum, I., Schepers, D., Simmons, A., Soci, C., Dee, D., and Thépaut, J.-N.: ERA5 hourly data on pressure levels from 1940 to present, Copernicus Climate Change Service (C3S) Climate Data Store (CDS) [data set], https://doi.org/10.24381/cds.bd0915c6, 2023. a
Hersbach, H., Bell, B., Berrisford, P., Hirahara, S., Horányi, A., Muñoz‐Sabater, J., Nicolas, J., Peubey, C., Radu, R., Schepers, D., and Simmons, A.: The ERA5 global reanalysis, Q. J. Roy. Meteor. Soc., 146, 1999–2049, https://doi.org/10.1002/qj.3803, 2020. a, b, c
Hodges, K. I.: A general method for tracking analysis and its application to meteorological data, Mon. Weather Rev., 122, 2573–2586, 1994. a
Hodges, K. I.: Feature tracking on the unit sphere, Mon. Weather Rev., 123, 3458–3465, 1995. a
Hodges, K. I.: Adaptive constraints for feature tracking, Mon. Weather Rev., 127, 1362–1373, 1999. a, b
Hodges, K. I.: TRACK tracking and analysis system for weather, climate and ocean data, Gitlab [code], https://gitlab.act.reading.ac.uk/track/track/-/releases (last access: 9 November 2020), 2021. a, b
Hreinsson, H.: The increase in arctic shipping 2013–2019, Arctic Shipping Status Report (ASSR)# 1, Arctic Council, https://oaarchive.arctic-council.org/items/01ddf449-9048-4d6a-a056-65303831bb63 (last access: 18 March 2023), 2020. a, b
Ibrion, M., Paltrinieri, N., and Nejad, A. R.: Learning from failures in cruise ship industry: The blackout of Viking Sky in Hustadvika, Norway, Eng. Fail. Anal., 125, 105355, https://doi.org/10.1016/j.engfailanal.2021.105355, 2021. a
International Maritime Organization: AIS transponders, https://www.imo.org/en/OurWork/Safety/Pages/AIS.aspx (last access: 17 February 2023), 2020. a
Johannsdottir, L., Cook, D., and Arruda, G. M.: Systemic risk of cruise ship incidents from an Arctic and insurance perspective, Elem. Sci. Anth., 9, 00009, https://doi.org/10.1525/elementa.2020.00009, 2021. a, b
Larsen, L.-H., Kvamstad-Lervold, B., Sagerup, K., Gribkovskaia, V., Bambulyak, A., Rautio, R., and Berg, T. E.: Technological and environmental challenges of Arctic shipping – A case study of a fictional voyage in the Arctic, Polar Res., 35, 27977, https://doi.org/10.3402/polar.v35.27977, 2016. a
Lasserre, F.: Case studies of shipping along Arctic routes. Analysis and profitability perspectives for the container sector, Transport. Res. A-Pol., 66, 144–161, 2014. a
Lasserre, F.: Arctic Shipping: A Contrasted Expansion of a Largely Destinational Market, in: The Global Arctic Handbook, edited by: Finger, M. and Heininen, L., Springer, Cham, https://doi.org/10.1007/978-3-319-91995-9_6, 2019. a
Liu, Q., Babanin, A. V., Zieger, S., Young, I. R., and Guan, C.: Wind and wave climate in the Arctic Ocean as observed by altimeters, J. Climate, 29, 7957–7975, 2016. a
Maher, P. T.: Tourism Futures in the Arctic, in: Springer Polar Sciences, edited by: Latola, K. and Savela, H., The Interconnected Arctic – UArctic Congress 2016, Springer, Cham, https://doi.org/10.1007/978-3-319-57532-2_22, 2017. a
Melia, N., Haines, K., and Hawkins, E.: Sea ice decline and 21st century trans-Arctic shipping routes, Geophys. Res. Lett., 43, 9720–9728, 2016. a, b, c
Met Office: Fact sheet 6 The Beaufort Scale, https://www.metoffice.gov.uk/binaries/content/assets/metofficegovuk/pdf/research/library-and-archive/library/publications/factsheets/factsheet_6-the-beaufort-scale_2023.pdf (last access: 20 May 2021), 2010. a
Müller, M., Knol-Kauffman, M., Jeuring, J., and Palerme, C.: Arctic shipping trends during hazardous weather and sea-ice conditions and the Polar Code’s effectiveness, NPJ Ocean Sustain, 2, 12, https://doi.org/10.1038/s44183-023-00021-x, 2023. a, b
National Snow & Ice Data Centre: Sea Ice Index Animation Tool, https://nsidc.org/data/seaice_index (last access: 15 February 2023), 2023. a, b
NOAA: As sea ice retreats, more ship traffic is entering the Arctic high seas, https://www.climate.gov/news-features/featured-images/sea-ice-retreats-more-ship-traffic-entering-arctic-high-seas (last access: 30 May 2023), 2022. a, b
Parkinson, C. L. and Comiso, J. C.: On the 2012 record low Arctic sea ice cover: Combined impact of preconditioning and an August storm, Geophys. Res. Lett., 40, 1356–1361, 2013. a
Peng, L., Zhang, X., Kim, J.-H., Cho, K.-H., Kim, B.-M., Wang, Z., and Tang, H.: Role of intense Arctic storm in accelerating summer sea ice melt: an in situ observational study, Geophys. Res. Lett., 48, e2021GL092714, https://doi.org/10.1029/2021GL092714, 2021. a
Protection of the Arctic Maritime Environment Agency: Compendium of Arctic Ship Accidents, https://www.pame.is/projects--new/arctic--shipping/pame--shipping--highlights/457--compendium--of--arctic--ship--accidents (last access: 30 May 2023), 2023. a, b, c, d, e, f, g, h, i
Rantanen, M., Karpechko, A. Y., Lipponen, A., Nordling, K., Hyvärinen, O., Ruosteenoja, K., Vihma, T., and Laaksonen, A.: The Arctic has warmed nearly four times faster than the globe since 1979, Commun. Earth Environ., 3, 168, https://doi.org/10.1038/s43247-022-00498-3, 2022. a
Rasmussen, E. A.: Polar lows, in: A Half Century of Progress in Meteorology: A Tribute to Richard Reed, Springer, 61–78, https://doi.org/10.1007/978-1-878220-69-1, 2003. a, b
Reed, R. J. and Kunkel, B. A.: The Arctic circulation in summer, J. Meteorol., 17, 489–506, 1960. a, b
Sallila, H., Farrell, S. L., McCurry, J., and Rinne, E.: Assessment of contemporary satellite sea ice thickness products for Arctic sea ice, The Cryosphere, 13, 1187–1213, https://doi.org/10.5194/tc-13-1187-2019, 2019. a
Schule, J. J.: Sea state, in: The encyclopedia of oceanography, edited by: Fairbridge, R. W., Vol. 1, Van Nostrand Reinhold Company, New York, 786–792, https://doi.org/10.1126/science.157.3793.1162, 1966. a
Serreze, M. C. and Barry, R. G.: Processes and impacts of Arctic amplification: A research synthesis, Global Planet. Change, 77, 85–96, 2011. a
Serreze, M. C., Lynch, A. H., and Clark, M. P.: The Arctic frontal zone as seen in the NCEP-NCAR reanalysis, J. Climate, 14, 1550–1567, 2001. a, b
Shipwreck Log: SCF YENISEI, https://shipwrecklog.com/log/2014/09/scf--yenisei/ (last access: 30 May 2023), 2014. a, b
Simmonds, I. and Keay, K.: Extraordinary September Arctic sea ice reductions and their relationships with storm behavior over 1979–2008, Geophys. Res. Lett., 36, L19715, https://doi.org/10.1029/2009GL039810, 2009. a
Simmonds, I., Burke, C., and Keay, K.: Arctic climate change as manifest in cyclone behavior, J. Climate, 21, 5777–5796, 2008. a, b, c, d
Simpson, C. G.: The Beaufort Scale of Wind-Force Report of the Director of the Meteorological Office, Official No. 180, London, 1906. a
Smith, D. M., Screen, J. A., Deser, C., Cohen, J., Fyfe, J. C., García-Serrano, J., Jung, T., Kattsov, V., Matei, D., Msadek, R., Peings, Y., Sigmond, M., Ukita, J., Yoon, J.-H., and Zhang, X.: The Polar Amplification Model Intercomparison Project (PAMIP) contribution to CMIP6: investigating the causes and consequences of polar amplification, Geosci. Model Dev., 12, 1139–1164, https://doi.org/10.5194/gmd-12-1139-2019, 2019. a
Smith, L. C. and Stephenson, S. R.: New Trans-Arctic shipping routes navigable by midcentury, P. Natl. Acad. Sci. USA, 110, E1191–E1195, 2013. a
Sorteberg, A. and Walsh, J. E.: Seasonal cyclone variability at 70° N and its impact on moisture transport into the Arctic, Tellus, 60, 570–586, 2008. a, b
Stroeve, J., Holland, M. M., Meier, W., Scambos, T., and Serreze, M.: Arctic sea ice decline: Faster than forecast, Geophys. Res. Lett., 34, L09501, https://doi.org/10.1029/2007GL029703, 2007. a
Stroeve, J., Markus, T., Boisvert, L., Miller, J., and Barrett, A.: Changes in Arctic melt season and implications for sea ice loss, Geophys. Res. Lett., 41, 1216–1225, 2014. a
Stroeve, J. C., Kattsov, V., Barrett, A., Serreze, M., Pavlova, T., Holland, M., and Meier, W. N.: Trends in Arctic sea ice extent from CMIP5, CMIP3 and observations, Geophys. Res. Lett., 39, L16502, https://doi.org/10.1029/2012GL052676, 2012. a, b
Thomson, J. and Rogers, W. E.: Swell and sea in the emerging Arctic Ocean, Geophys. Res. Lett., 41, 3136–3140, 2014. a
Titchner, H. A. and Rayner, N. A.: The Met Office Hadley Centre sea ice and sea surface temperature data set, version 2: 1. Sea ice concentrations, J. Geophys. Res.-Atmos., 119, 2864–2889, 2014. a, b
Transportation Safety Board of Canada: Marine transportation safety investigation report M18C0225, https://www.tsb.gc.ca/eng/rapports-reports/marine/index.html, (last access: 30 May 2023), 2018. a
U.K. Gov.: Automatic Identification System (AIS) for fishing vessels, https://www.tsb.gc.ca/eng/enquetes-investigations/marine/2018/m18c0225/m18c0225.html (last access: 30 May 2023), 2014. a, b
UNCTAD: Review of Maritime Transport 2022, https://unctad.org/publication/review-maritime-transport-2022 (last access: 30 May 2023), 2022. a
Vessey, A. F., Hodges, K. I., Shaffrey, L. C., and Day, J. J.: An inter-comparison of Arctic synoptic scale storms between four global reanalysis datasets, Clim. Dynam., 54, 2777–2795, 2020. a, b, c, d, e, f
Vessey, A. F., Hodges, K. I., Shaffrey, L. C., and Day, J. J.: The composite development and structure of intense synoptic-scale Arctic cyclones, Weather Clim. Dynam., 3, 1097–1112, https://doi.org/10.5194/wcd-3-1097-2022, 2022. a, b, c, d, e, f, g
Waseda, T., Webb, A., Sato, K., Inoue, J., Kohout, A., Penrose, B., and Penrose, S.: Correlated increase of high ocean waves and winds in the ice-free waters of the Arctic Ocean, Sci. Rep., 8, 4489, https://doi.org/10.1038/s41598-018-22500-9, 2018. a
Waseda, T., Nose T., Kodaira, T., Sasmal, K., and Webb, A.: Climatic trends of extreme wave events caused by Arctic Cyclones in the western Arctic Ocean, Polar Sci., 27, 100625, https://doi.org/10.1016/j.polar.2020.100625, 2021. a
Wei, T., Yan, Q., Qi, W., Ding, M., and Wang, C.: Projections of Arctic sea ice conditions and shipping routes in the twenty-first century using CMIP6 forcing scenarios, Environ. Res. Lett., 15, 104079, https://doi.org/10.1088/1748-9326/abb2c8, 2020. a
Zhang, X., Walsh, J. E., Zhang, J., Bhatt, U. S., and Ikeda, M.: Climatology and interannual variability of Arctic cyclone activity: 1948–2002, J. Climate, 17, 2300–2317, 2004. a, b
- Abstract
- Introduction
- Methodology
- Trends in Arctic shipping and in Arctic cyclones
- Seasonality in Arctic ship tracks and Arctic cyclone tracks
- Trans-Arctic shipping trends through the Northern Sea Route and Northwest Passage
- Trends in past Arctic shipping incidents
- Number of Arctic ships intersected with and impacted by past intense Arctic cyclones
- How do Arctic ships respond to the passage of an intense Arctic cyclone?
- Conclusions
- Code and data availability
- Author contributions
- Competing interests
- Disclaimer
- Acknowledgements
- Financial support
- Review statement
- References
- Supplement