the Creative Commons Attribution 4.0 License.
the Creative Commons Attribution 4.0 License.
 | 03 Jun 2024
Assessing the impact of climate change on landslides near Vejle, Denmark, using public data
Julian Koch
Marie Keiding
Gregor Luetzenburg
The possibility of increased landslide activity as a result of climate change has often been suggested, but few studies quantify this connection. Here, we present and utilize a workflow for the first time solely using publicly available data to assess the impact of future changes in landslide dynamic conditioning factors on landslide movement. In our case we apply the workflow to three slow-moving coastal landslides near Vejle, presenting the first study of its kind on Danish landslides. We examine modelled water table depth (WTD) as a dynamic conditioning factor using the DK-HIP model (Danish Hydrological Information and Prognosis system) that simulates historic and future WTD. The data show a clear correlation with landslide movement as recorded by the interferometric synthetic aperture radar (InSAR) time series for the period from 2015 to 2019. Movement of up to 84 mm yr−1 occurs during wet winter months when normalized WTD exceeds +0.5 m. During dry winters, no, or very little, seasonal landslide movement is observed. The DK-HIP model predicts an increase of up to 0.7 m in WTD at the study area by 2100 CE under the RCP8.5 (Representative Concentration Pathway) scenario (95 % confidence), which exceeds the levels this area has experienced in recent decades (mean increase of 0.2 m with a standard deviation of 0.25 m). This is likely to result in increased landslide activity and acceleration of movement. In a previous episode of increased landslide activity linked to extreme precipitation in the early 1980s, one of the examined landslides accelerated, causing damage to infrastructure and buildings. Our study clearly shows that these landslides are sensitive to climate change and highlights the potential of utilizing high-quality, publicly available data to address these complex scientific questions. The quality and quantity of such data are ever increasing, and so is the potential of this kind of approach.
- Article
(9061 KB) - Full-text XML
- BibTeX
- EndNote


Landslides can have devastating impacts on infrastructure and human lives in areas with pronounced topography (Froude and Petley, 2018; Mateos et al., 2020). To mitigate these consequences, it is crucial to understand the temporal occurrence and (re-)activation of landslide movement (Pollock and Wartman, 2020). Some studies have shown an increase in landslide activities as a consequence of climate change in landslides preconditioned by elevated WTD (water table depth) and precipitation (Gariano and Guzzetti, 2016; Crozier, 2010), while others show reduced activity (Malet et al., 2005; Coe, 2012; Zieher et al., 2023). However, the topic has never been studied in Denmark, and it has never been studied solely using publicly available data.
Conditioning factors for landslides can be divided into static conditioning factors, which are those that do not change in time, such as lithology and the structural setting, and dynamic conditioning factors, which are those that change the stability of the slope (preparing factors) and control the timing (triggering factors) of slope failures (Hermanns et al., 2006). Long time series of fluctuations in dynamic conditioning factors, coupled with data on landslide movement, are powerful indicators used to examine thresholds in, for example, critical WTD for when slow-moving landslides may accelerate. Dynamic conditioning factors may include measured or modelled fluctuations in precipitation (Coe et al., 2004; Kashyap et al., 2021; Handwerger et al., 2022; Dixon and Brook, 2007), water table depth (WTD; van Asch et al., 2009), permafrost conditions in polar (Svennevig et al., 2022, 2023) and alpine regions (Magnin et al., 2017, 2019; Penna et al., 2023), snowmelt (Moreiras et al., 2012), earthquakes (Saba et al., 2010), landslide toe erosion (Alberti et al., 2022), and changes in land cover (Van Beek and Van Asch, 2004). Movement can be constrained in several ways, based on both ground and in situ measurements (Uhlemann et al., 2016) or based on remote sensing observations (Scaioni et al., 2014). However, the data used in these studies have often been limited in scope and public availability.
Precipitation can be a dynamic conditioning factor for the (re-)activation of landslides when water infiltrates into the ground and raises the groundwater table (Handwerger et al., 2019). A relationship between landslide movements and precipitation and WTD has been observed in several studies where precipitation is the main factor controlling seasonal activity in deeper slow-moving landslides (van Asch and Buma, 1997; van Asch et al., 1999; Iverson, 2000; Corominas et al., 2005; Handwerger et al., 2019; Luna and Korup, 2022). This is due to rainwater infiltrating the ground and raising the WTD (Iverson, 2000). As a result, the effective normal stress is lowered, and the frictional strength of the hillslope is reduced (Terzaghi, 1950). Hydrological drivers of landslide movement are controlled by irregular peak rainfall events and more regular seasonal patterns during wet seasons (Bennett et al., 2016). An increase in temperature due to climate change raises evapotranspiration, leading to an intensification of the hydrological cycle and a more dynamic shallow water table depth (Collison et al., 2000). Future changes in seasonal precipitation regimes raising the groundwater table will lead to more frequent attainment of critical water content during rainfall events (Gariano and Guzzetti, 2016). However, it is difficult to constrain general landslide sensitivity to precipitation due to diverse, site-specific conditioning factors (Handwerger et al., 2022).
The amount of publicly available geodata is ever increasing (Vitousek et al., 2023). In recent years, a spaceborne InSAR (interferometric synthetic aperture radar) time series has proven to be a strong tool for covering large areas with high temporal resolutions, and the European Ground Motion Service (EGMS) has made such data freely available for most of Europe (Costantini et al., 2022). Moreover, forward modelling of dynamic conditioning factors is increasingly being conducted for local sites (Magnin et al., 2017; Peres and Cancelliere, 2018). Nationwide freely available datasets, such as high-resolution water table depth modelling, are also becoming more widely available (Henriksen et al., 2020).
With this increasing availability of new public data in mind, we set out to answer this question: how will large coastal landslides respond to future climate change? And how far can we get towards answering this question using freely and publicly available data?
Compared to many other European countries, relatively little quantitative research has been conducted on landslides in Denmark (Herrera et al., 2018; Mateos et al., 2020; Svennevig and Keiding, 2020; Svennevig et al., 2020). However, a recent study found 3202 landslides in Denmark (Luetzenburg et al., 2022), some of which are near developed areas and may pose a threat to infrastructure and livelihoods (Svennevig et al., 2020). One such area is at Mørkholt, a site in Vejle Municipality in eastern Jutland where three large coastal landslides with houses and infrastructure on top were identified. These landslides have appropriate InSAR reflectors and are covered by the freely available national water resources model of Denmark, which is the DK-HIP model (Danish Hydrological Information and Prognosis system). It is, thus, a good site to address the previously mentioned research questions.
In this study, we, for the first time, quantify the impact of climate change on landslide activity in Danish landslides, focusing on slow-moving coastal landslides in Vejle. We do this by applying a novel workflow, utilizing publicly available data to model the dynamic conditioning factor of water table depth (WTD). The research identifies an empirical threshold for landslide movement, and this is applied to climate projections for 2071–2100 under different Representative Concentration Pathway (RCP) scenarios. The research advances our understanding of the complex relationship between climate change and landslides and offers insights into future risks for these sites while highlighting the potential of utilizing publicly available data for such analyses.
The paper is organized as follows. We first go through the methods and data applied in the paper in Sect. 2. We then present the results on the movement pattern of the landslides and the climate modelling, and the correlation of these, in Sect. 3. This is followed by discussions of the implications and limitations in Sect. 4. The summary of key findings is presented in the Conclusion in Sect. 5.
1.1 Geographic and geological setting
The physiography and near-surface geology of Denmark are shaped by several Quaternary glaciations and interglacial periods. The landscape in eastern Jutland consists of subglacial and proglacial landforms modified by postglacial fluvial and coastal processes as well as human activity.
The detailed subsurface geology at the Mørkholt field site is poorly known. Heilmann-Clausen et al. (1985) and Rasmussen et al. (2010) describe clays of the upper Oligocene–lower Miocene Vejle Fjord Formation from the area. This conforms with the 1:500 000 scale pre-Quaternary bedrock map of Denmark (Håkansson and Pedersen, 1992), which indicates the lower part of the Miocene at Mørkholt (Fig. 1b). In the national drill hole database (Jupiter), a geothermal well (DGUnr 125.2169) has been logged in the central part of the field area (Fig. 1d). This shows a succession of more than 84 m of marly mudstone and 14 m of black clay topped by 2 m of fine silty sand (Jupiter database drill log, 2023).
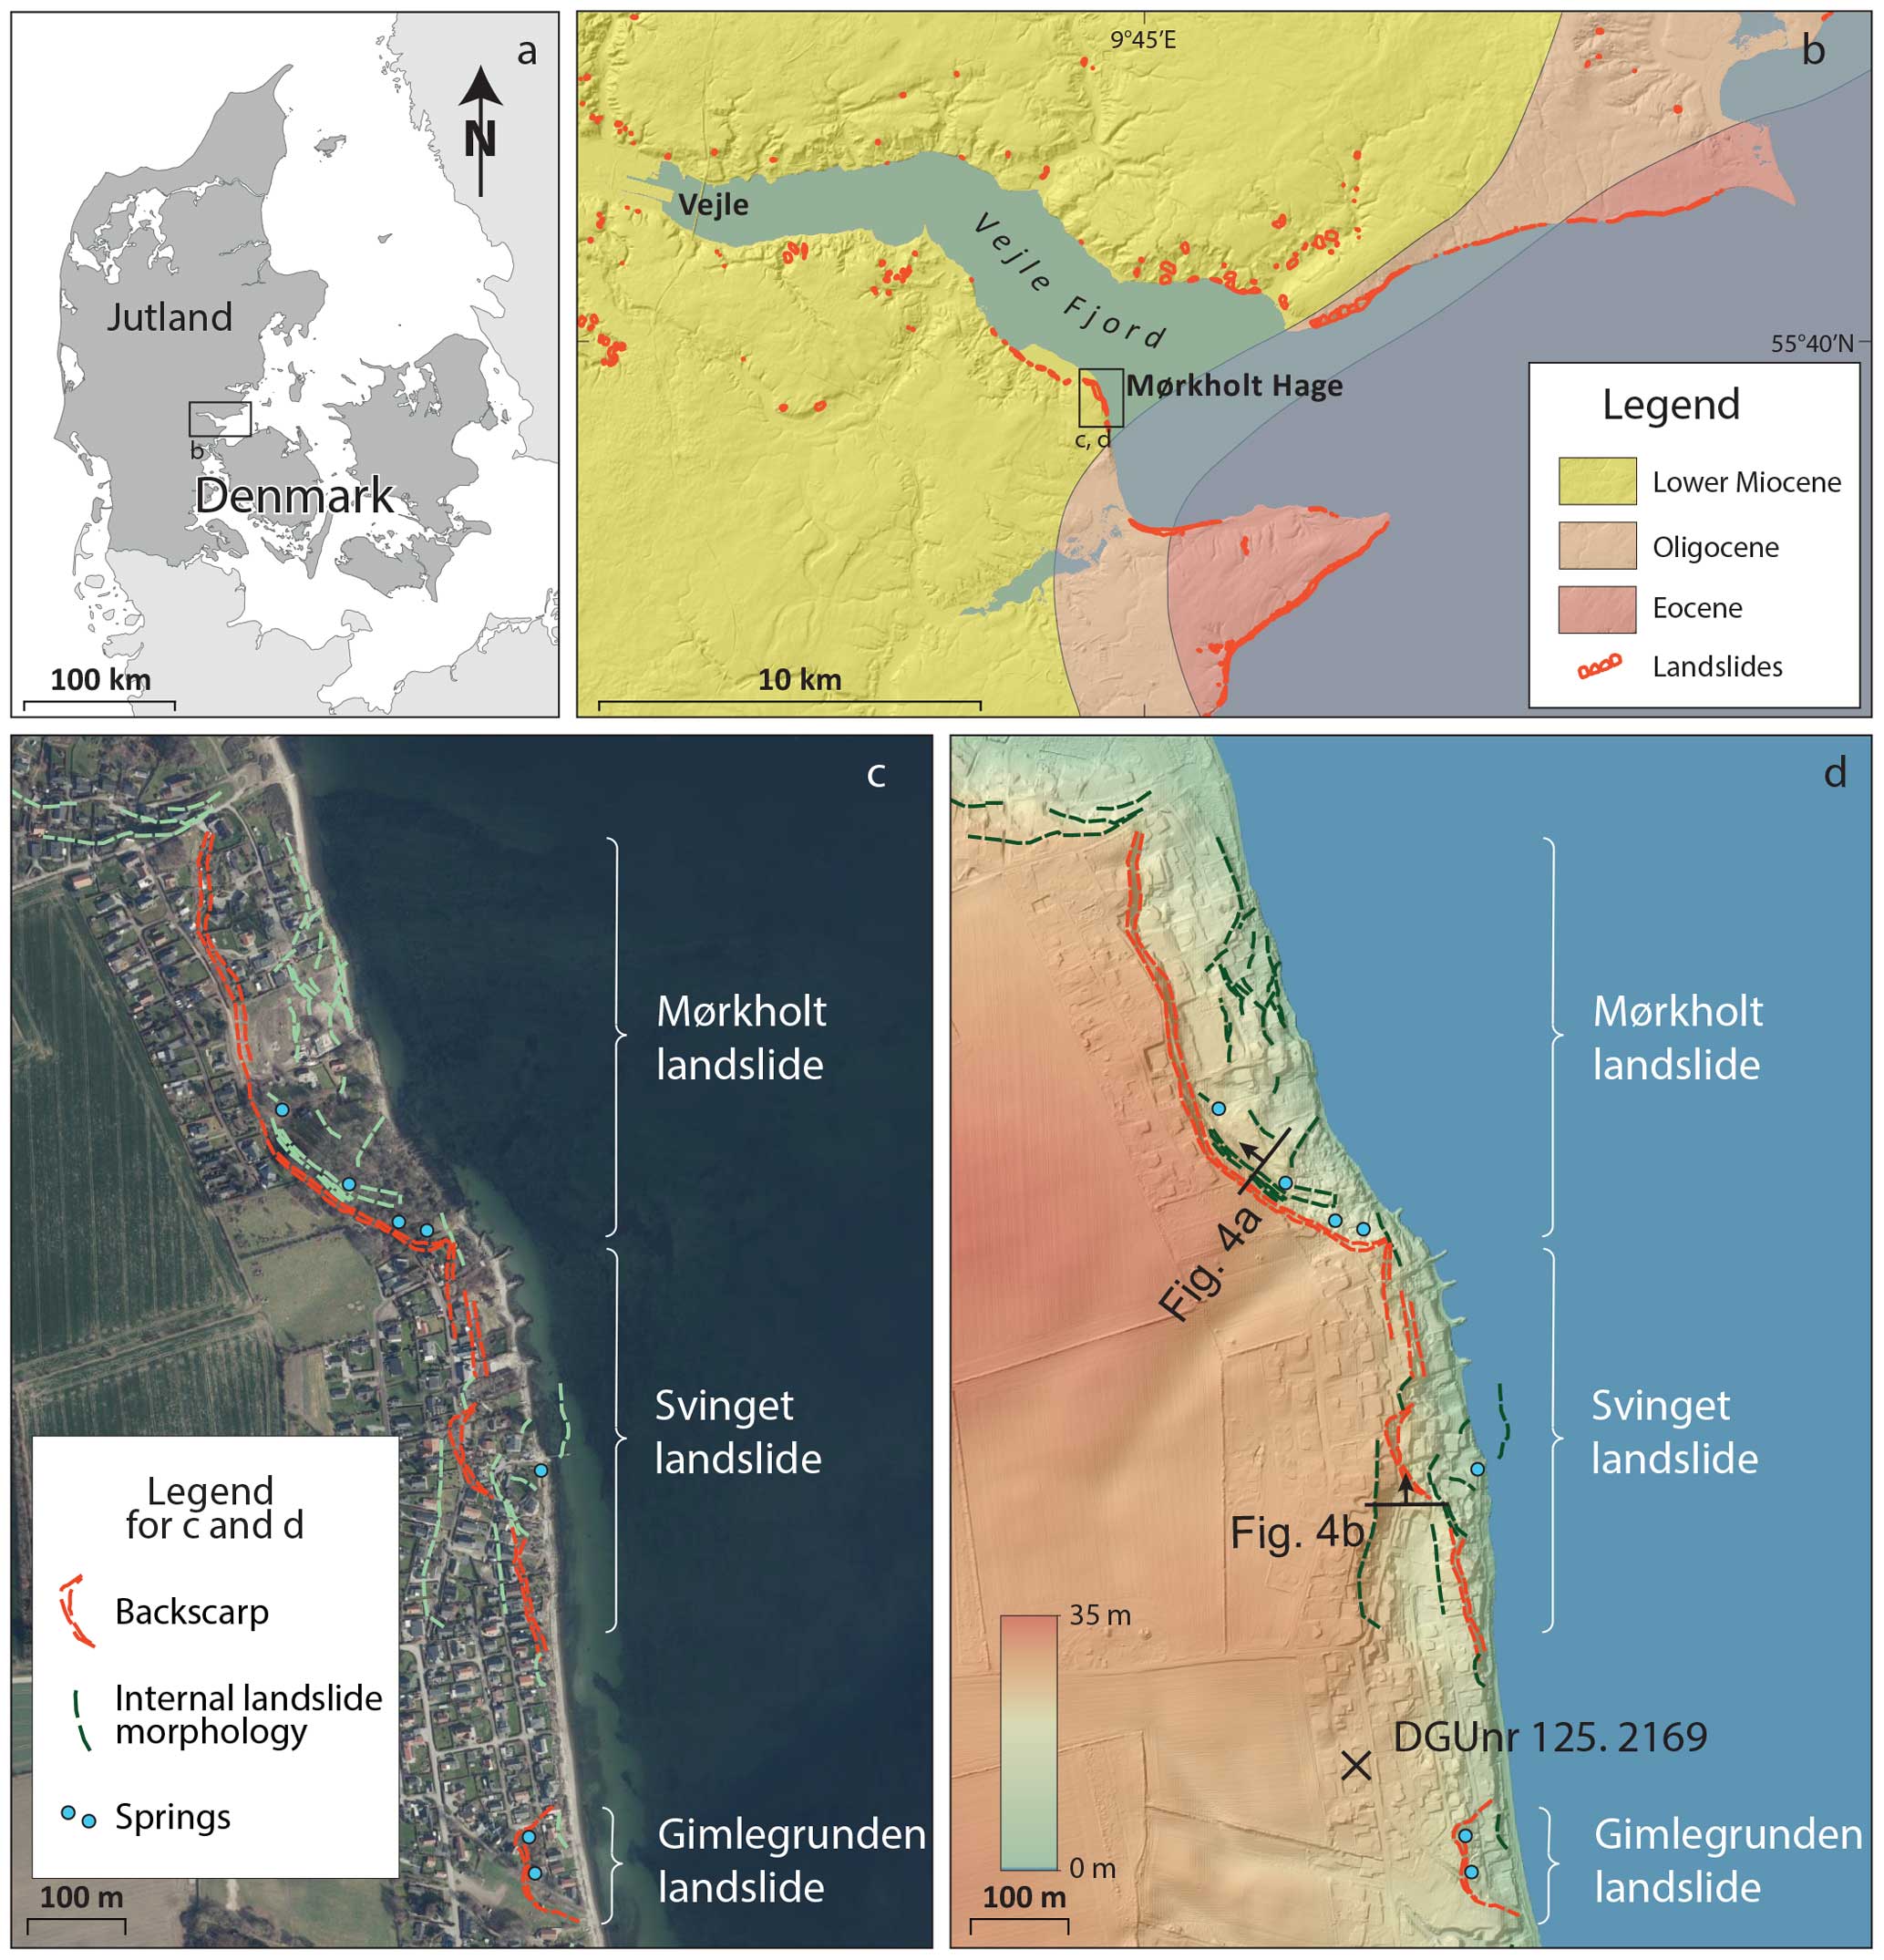
Figure 1(a) Overview map of Denmark showing the position of panel (b). (b) Regional map of the pre-Quaternary geology (Håkansson and Pedersen, 1992) overlain by a shaded digital elevation model (DEM; Geodatastyrelsen, https://dataforsyningen.dk/data/930, last access: June 2023) and mapped landslides from Luetzenburg et al. (2022) showing the position of panels (c) and (d). (c) Orthophoto from 2021 (Geodatastyrelsen, https://dataforsyningen.dk/data/930, last access: June 2023). (d) DEM and hillshade from 2018 of the field area (Geodatastyrelsen, https://dataforsyningen.dk/data/930, last access: June 2023). The dashed line off the coast of the Svinget landslide is a dark lineament on the seabed from uplifted black clay. The positions of the photos in Fig. 4 are indicated in panel (d) along with the positions of the geothermal well DGUnr 125.2169 (marked with X).
Denmark is in the north temperate climate zone, and it has monthly mean temperature ranges between 1 °C in January and February and 17 °C in July (DMI, 2024). The mean annual precipitation in Vejle is 766 mm yr−1, which is distributed across the year. The largest rainfall typically takes place in fall and early winter. Snowfall and snowmelt are sporadic in Denmark and, thereby, do not substantially modulate hydrological processes.
1.2 Landslide setting
Three landslides, with a combined 47 houses on top, have been mapped on the east-facing coastal slope at the Mørkholt field site (Fig. 1c and d): the Mørkholt landslide (27 houses), the Svinget landslide (14 houses) and the Gimlegrunden landslide (6 houses). The overall morphological mapping is based on the identification of steep (35–50°) arcuate backscarps in a digital elevation model (DEM) and derived hillshade from 2018, supplemented with a mapping of internal morphologies and field validation. Additional landslides are mapped in the areas northwest and south of the three landslides we focus on. These are relict landslides with no indication of recent activity, such as smooth morphology, and no observed structural damage and deformed trees.
The Mørkholt landslide is the largest of the three sites: it is 510 m wide (north–south), stretching 130 m inland from the coast and covering 58 000 m2 onshore, with an unknown extent into the sea. The backscarp is clearly defined by an arcuate that is up to 8 m high and a steep 40° inland escarpment. The scarp is highest in the central part and decreases to 5 m to the north and south. The Svinget landslide is morphologically not as well defined as the Mørkholt landslide, and a clear single backscarp cannot be identified. The area of the landslide is constrained by a series of escarpments that are 30–60° steep and up to 6 m high, which extend 470 m from north to south and reach 90 m inland from the shore. It encompasses an onshore area of 22 000 m2. A dark lineament is visible on the seabed 35 m from the shore, which could correspond to the toe of the landslide, giving it a total width of 125 m. The Gimlegrunden landslide is well defined in the hillshade as a 115 m by 55 m arcuate depression in the coastal slope encompassing an onshore area of 6000 m2. It is delimited by a 55° sloping backscarp that is up to 4.5 m high. Based on the descriptions above, we classify the three landslides as rotational clay slides with failure surfaces extending below the adjacent seafloor (“soil slump” sensu Hungr et al., 2014). The morphology of the landslides is visible in the topographic maps of the area from the late nineteenth century. Based on this, and the height of the scarps, it is estimated that the landslides have developed over several hundred years, possibly even longer.
The workflow presented in Fig. 2 enables climate forecasting of landslides based on the publicly available data summarized in Table 1. The workflow diagram shows all the steps from the identification of landslides and assessment of landslide activity (step 1) over the analysis of potential thresholds in dynamic conditioning factors (step 2) to the climate forecasting of landslide activity (step 3). Step 1 is, by now, a relatively standard procedure (Herrera et al., 2018; Luetzenburg et al., 2022), while steps 2 and 3, applied to open data and applied in Denmark, are novel and the focus of this paper. We have used general terms to describe the input data in order to make the flowchart applicable to cases where other types of displacement data and dynamic conditioning factors are at play. The flowchart is thus intended as a blueprint for the near future when publicly available data, applicable for assessing the climatic thresholds for an increase in landslide activity, will increase in quality and quantity.
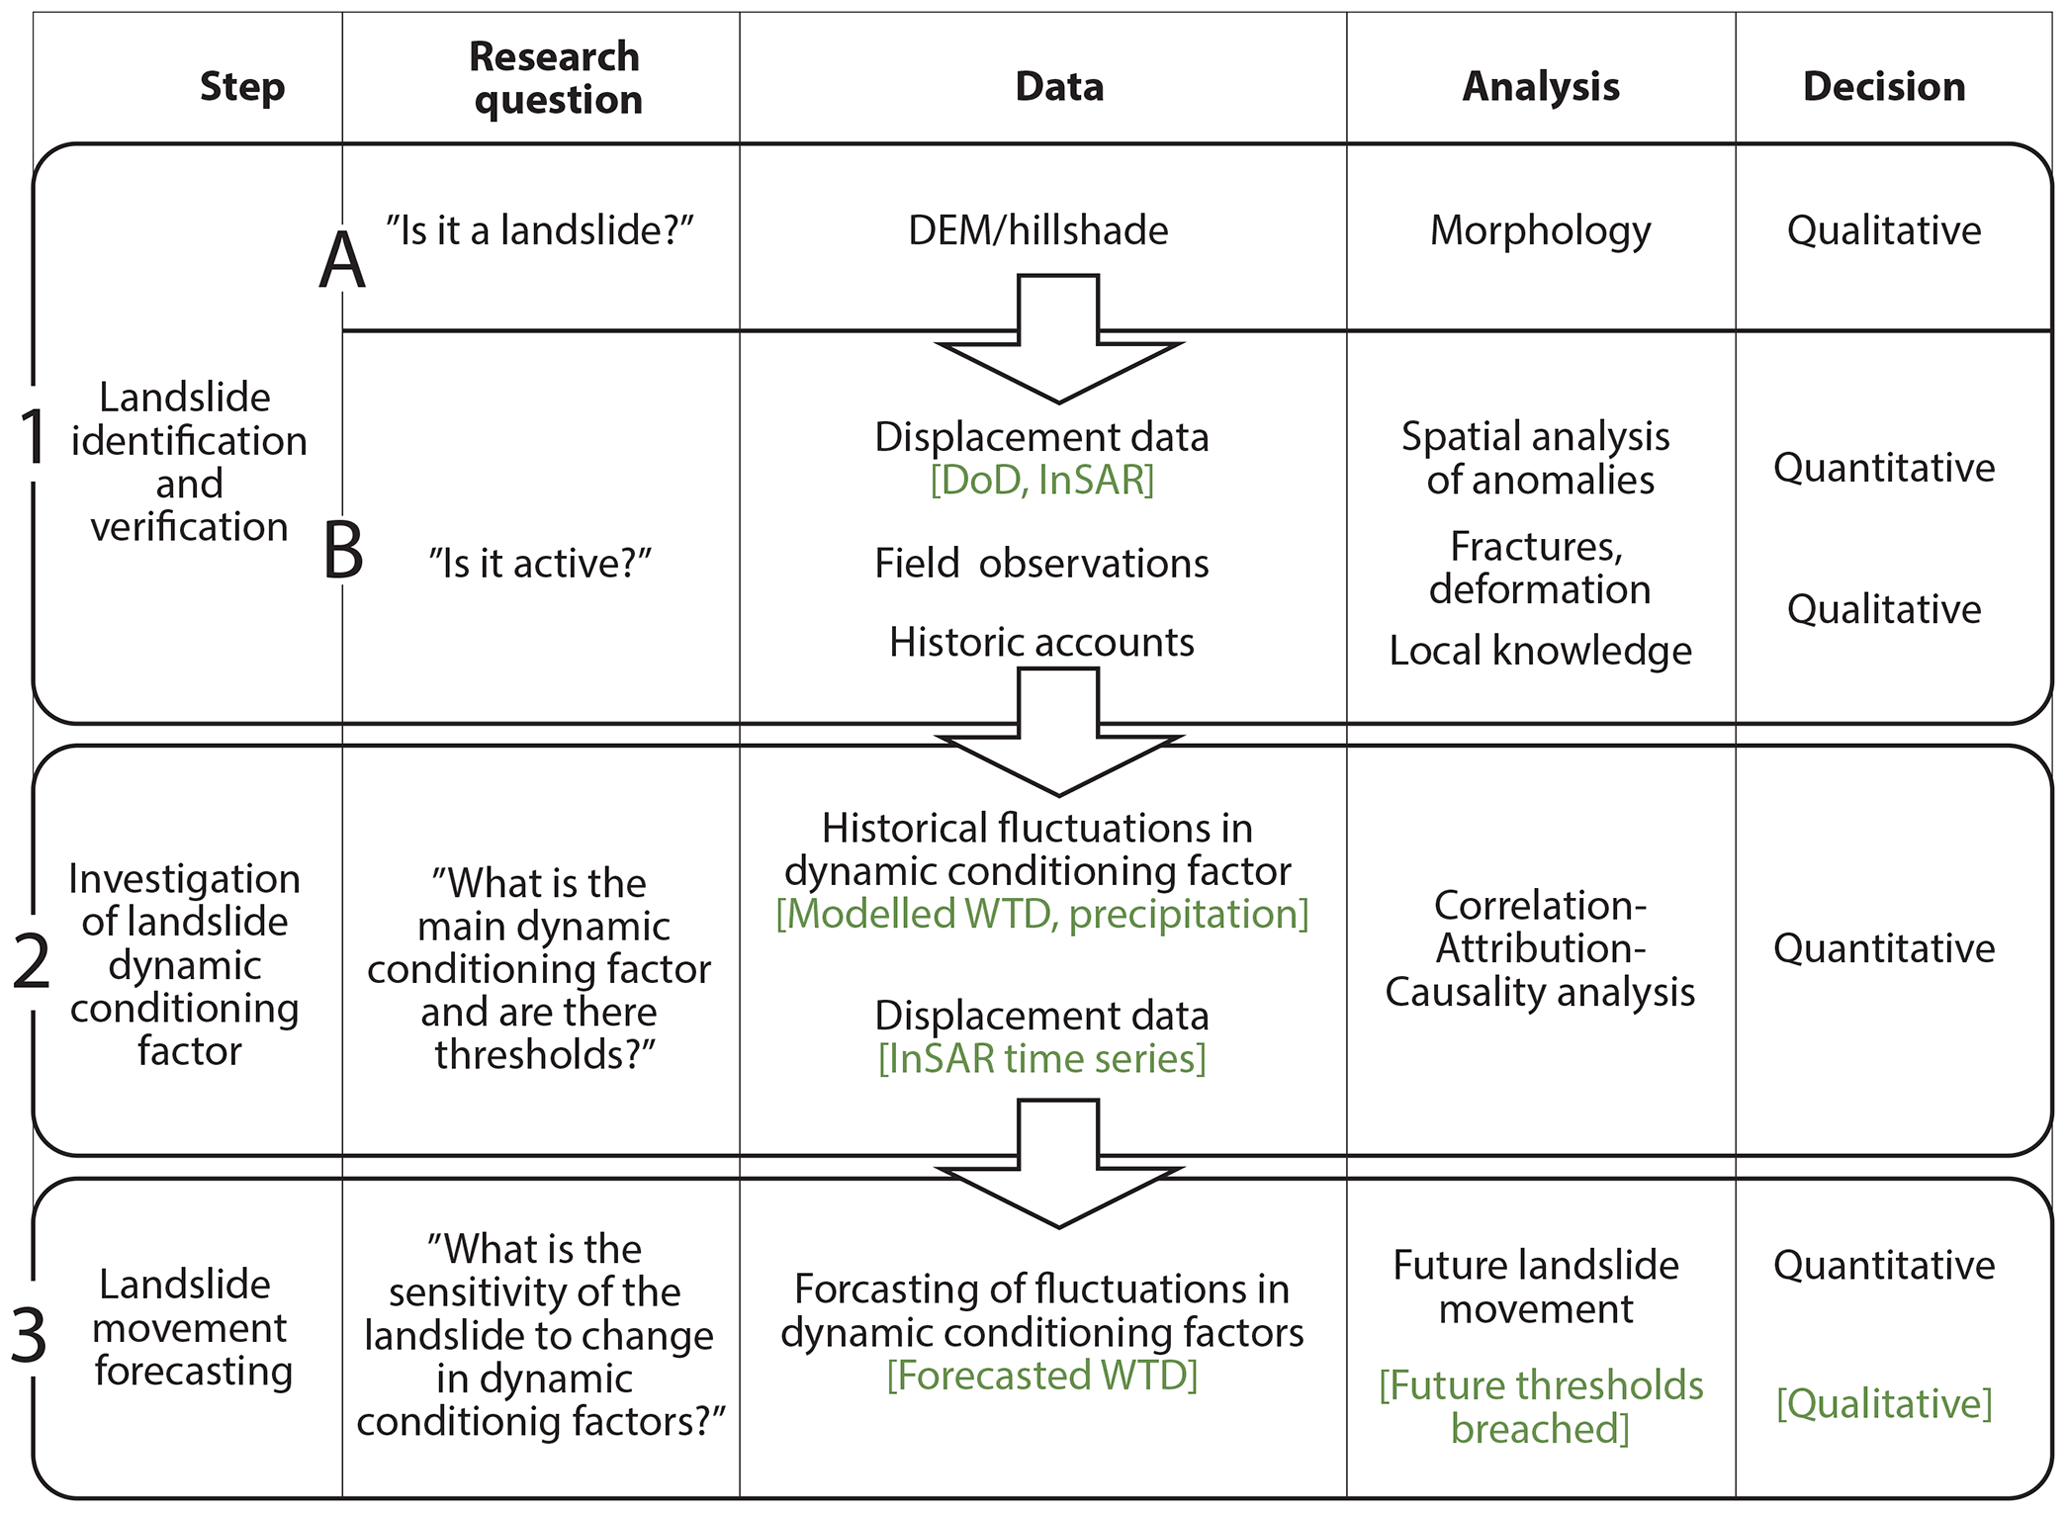
Figure 2Generalized workflow for identifying landslides and estimating climatic thresholds. The focus of this paper is seen in steps 2 and 3. We have used general terms to describe the input data in order to make the flowchart applicable to cases where other types of displacement data and dynamic conditioning factors are at play. The specific data used in the present paper are shown in green brackets and in Table 1. DoD stands for digital elevation model of difference.
Table 1An overview of data used for this study in the workflow is presented in Fig. 2.
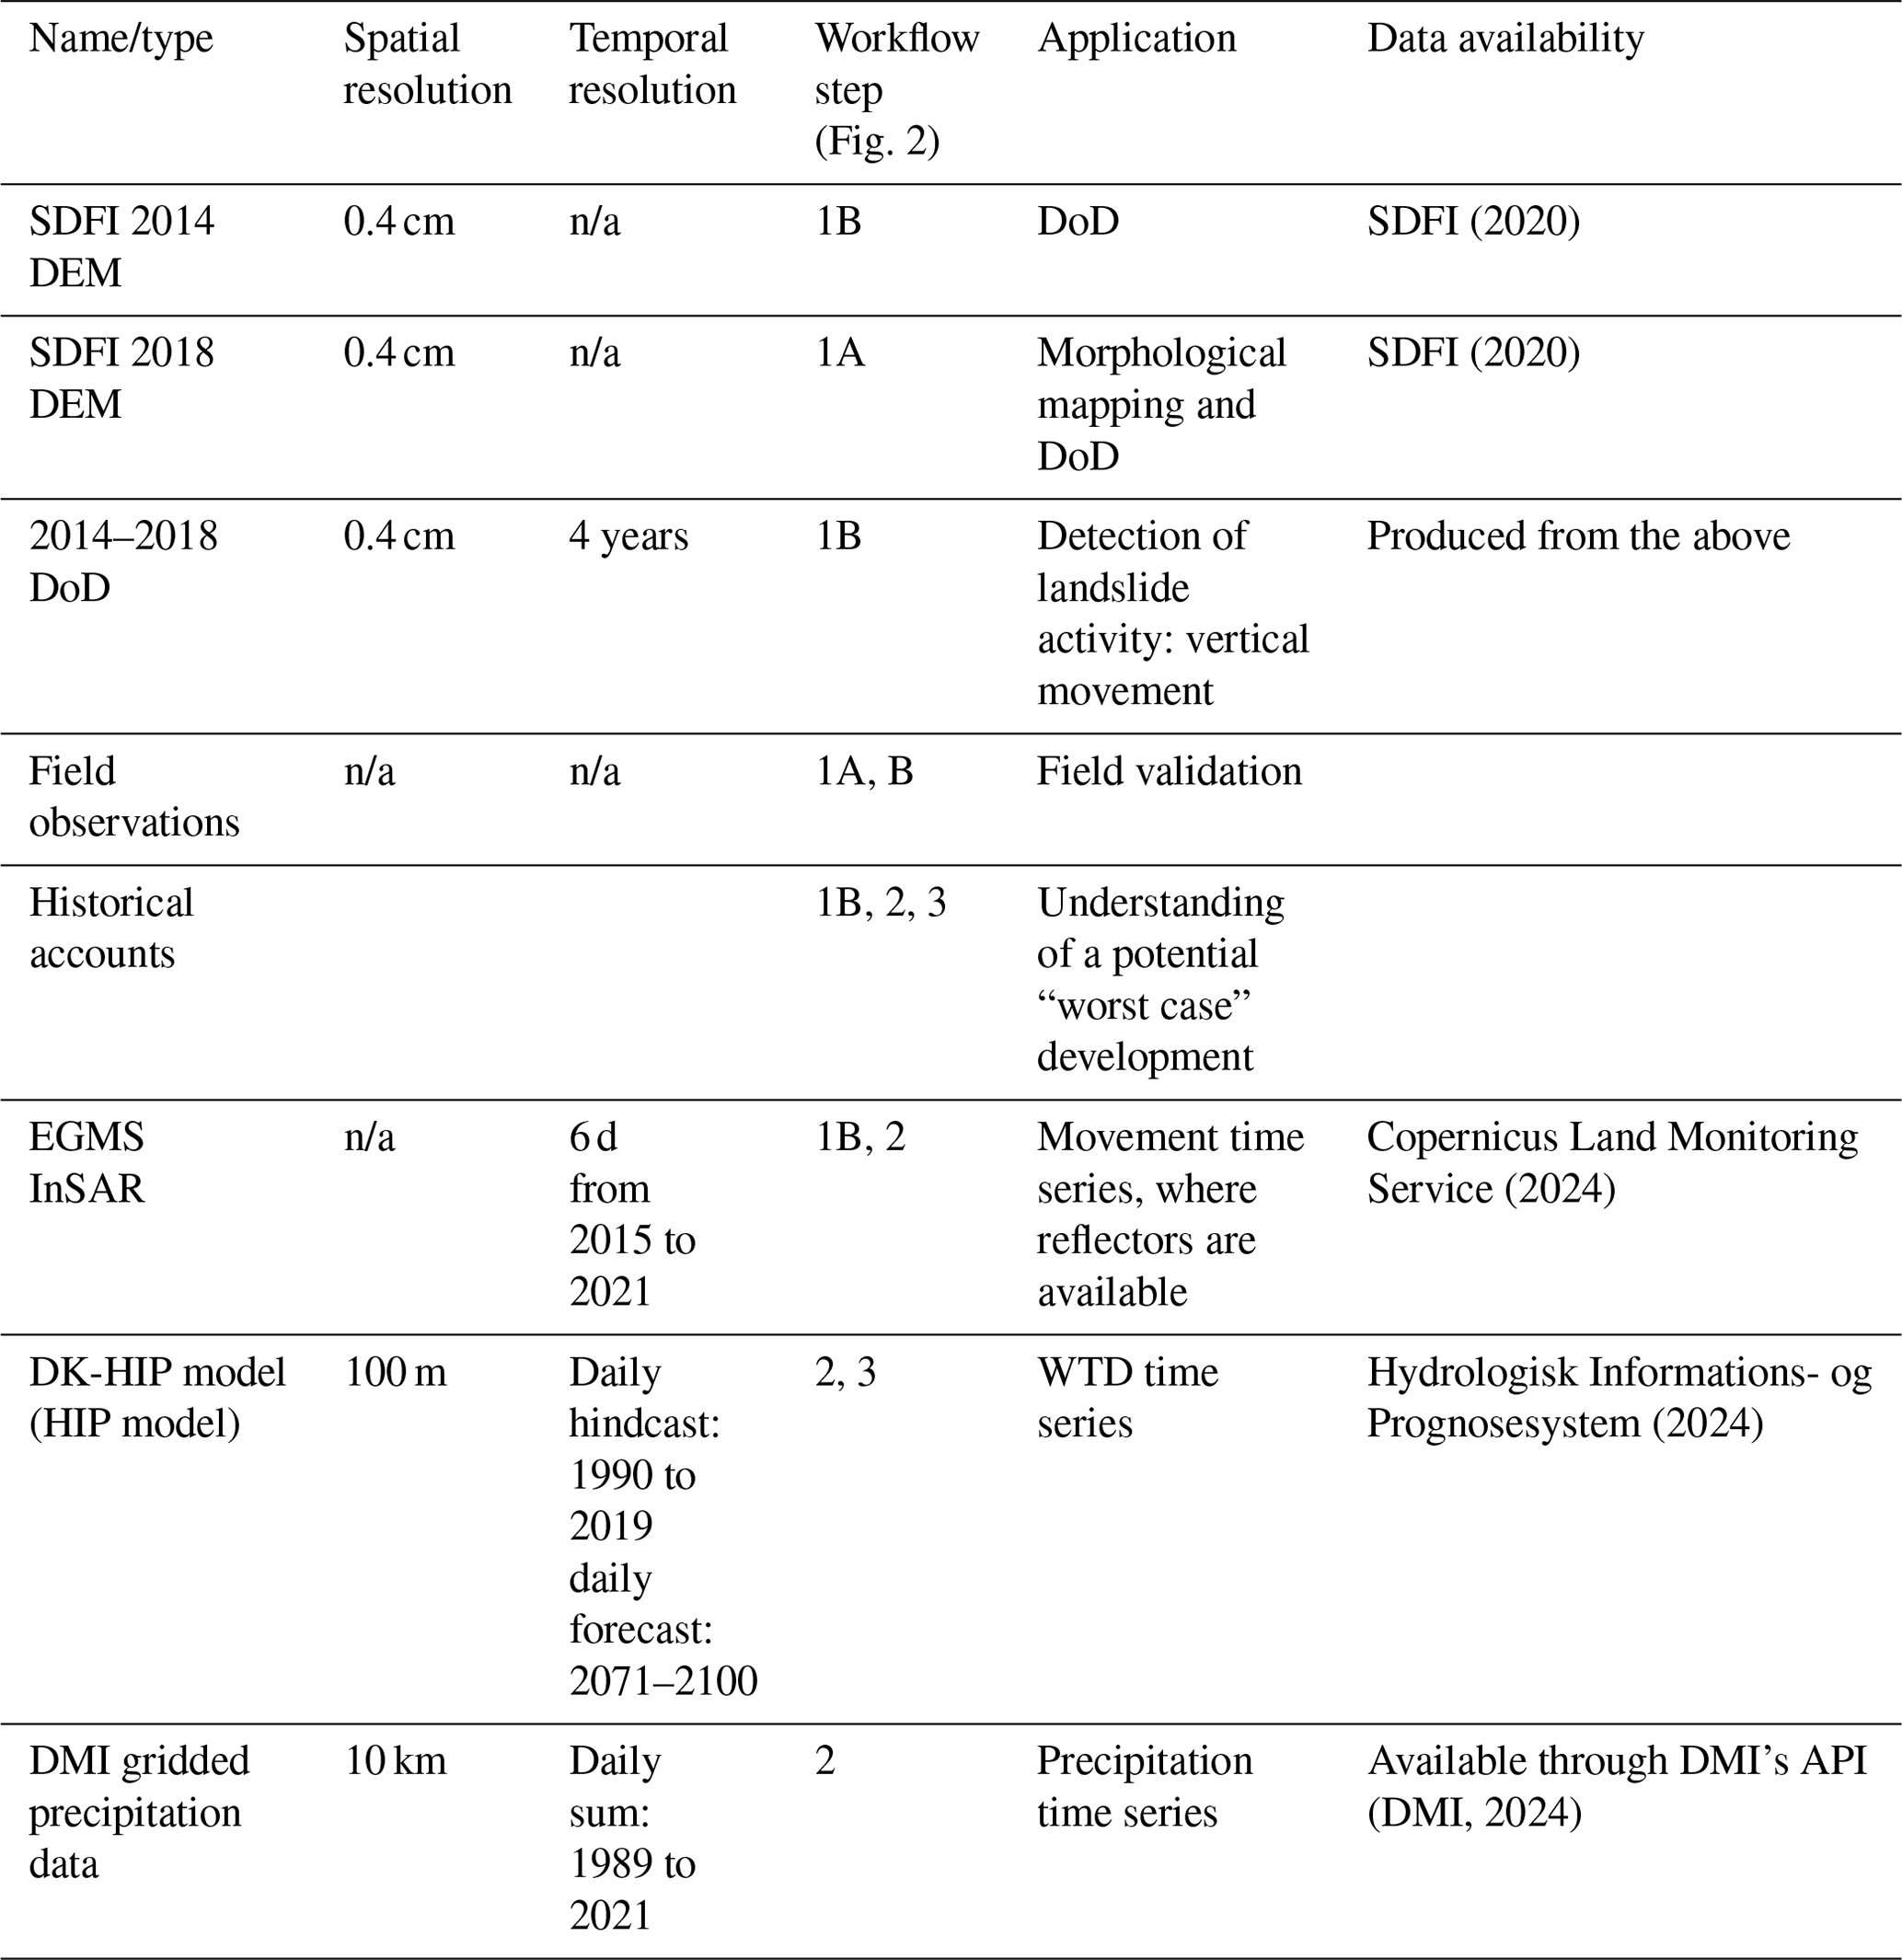
n/a stands for not applicable.
In step 1A, the landslide is identified, usually in a DEM or DTM (Svennevig et al., 2020). In step 1B, it is determined whether the landslide is active or inactive. This is done based on remote displacement data but can also be the objective of an initial field validation. In step 2, time series data of landslide displacement and dynamic preconditioning factors are analysed. In our case, this is based on the InSAR time series and modelled WTD and precipitation. In step 3, future landslide movement is forecasted by applying forecasted WTD models. This is used to examine whether future thresholds for landslide stability may be breached.
2.1 Lidar DEM and DEM of difference (DoD)
The Danish digital elevation model (DEM) is provided by the Danish Agency for Data Supply and Infrastructure (SDFI; Geodatastyrelsen, https://dataforsyningen.dk/data/930, last access: June 2023). The dataset is produced from airborne laser scanning (lidar; SDFI, 2020). For the area around Mørkholt, the data were acquired in April and May 2018. The product used is delivered and processed to a spatial resolution of 40 cm and with vegetation and buildings removed, essentially making it a digital terrain model. The 2018 DEM and a derived hillshade model are the basis for the morphological mapping in step 1A of the workflow (Fig. 2) in order to initially identify the landslides and their extent. This mapping was assisted by orthophotos with a resolution of 12.5 cm, which are also available from the SDFI (Luetzenburg et al., 2022).
A nationwide lidar DEM like the one from 2018 was also produced in 2014 (Table 1). By subtracting the two, a DEM of difference (DoD) was produced, enabling us to evaluate the vertical change in elevation (subsidence, erosion and deposition) between the two acquisitions. The slope-parallel transport in the landslides is thus not resolved by this method. It can, however, be quantified to some degree if the raw laser point files used to produce the DEMs are used (Pfeiffer et al., 2018) or if feature tracking is carried out; however, this is beyond the scope of the present paper. Automatic registering was applied to the two DEMs to account for minor discrepancies between the two datasets (Nuth and Kääb, 2011). Data were processed in the open-source GIS platform QGIS. The result is a 40 cm per pixel DoD that shows the change in elevation down to a vertical accuracy of 1.4 cm between the two acquisition dates. This enables us to effectively detect the spatial extent of vertical changes between the two datasets down to ca. 25 mm yr−1 and, thus, establish landslide activity in the examined period (step 1B in Fig. 2). The spatial resolution is much higher than the persistent scatter (PS) point data obtained from InSAR, and the DoD can thus be used to compare whether the InSAR anomalies (PS points showing consistent movement) indeed represent landslide movement.
2.2 InSAR product
Observations of terrain movement are freely available from the European Ground Motion Service (Copernicus Land Monitoring Service, 2024; Costantini et al., 2022). The EGMS uses freely available raw data from the Sentinel-1 satellites of the European Union's Copernicus Earth observation programme. The satellite emits pulses of radar energy that are scattered and reflected by the Earth's surface and recorded back at the satellite. This means that measurements are only obtained where objects at the Earth's surface provide stable reflections of the radar signal, such as bedrock outcrops, houses and other infrastructure. Vegetated areas or areas with large surface changes typically have few or no stable reflectors. Furthermore, very fast or non-linear terrain movements will prevent the correlation of the reflected radar signal between acquisitions. In practice for our field area at Mørkholt, this means that only houses moving by less than ca. 100 mm yr−1 provide good reflectors. The data are provided as PS points and are initially used to screen for a spatial scan for landslide movement in step 1B of the workflow (Fig. 2). In step 2, the time series stored in each spatial point is used for a correlation analysis with the dynamic conditioning factor (WTD), as can been seen in Sect. 2.6. The terrain movements are calculated using interferometric synthetic aperture radar (InSAR), a technique that uses radar measurements of the Earth's surface from polar-orbiting satellites (Crosetto et al., 2016, 2020; Rosen et al., 2000; Ferretti et al., 2001). For our study area, at the time of writing, it covers the period from 2015 to 2020. The terrain movements are measured in line of sight (LOS) to the satellites; hence, the measurements do not provide the absolute vector of movement but only the part of the movement that projects into the LOS direction. Here, we use data from ascending, i.e. north-going tracks 44 and 117. The ascending satellites look towards ENE, which means that negative movements in LOS indicate movement toward the east and down (Fig. 3). By assuming a movement direction of 70–80° (ENE) and a slope-parallel dip of 30–40°, the LOS records 90 %–100 % of the actual movement of the landslides. Thus, the ascending satellite geometry is suited very well to study landslide movement at the Mørkholt coast, and we can assume that the movement rates obtained from this method are the actual movement. The movement is reported both as a mean LOS velocity (Fig. 3) and a time series of each InSAR data point (e.g. Fig. 6). To reduce the noise of the raw LOS data, and to account for the low-frequency observations, the time series data are smoothed using a rolling median with a window size of 90 d, similar to Handwerger et al. (2022). Data are lacking for Gimlegrunden and Svinget landslides in the winter of 2015/2016 due to an acquisition error observed in all 117A tracks across northern Europe. We have made a linear interpolation across this period, thus providing minimum movement rates in this period.
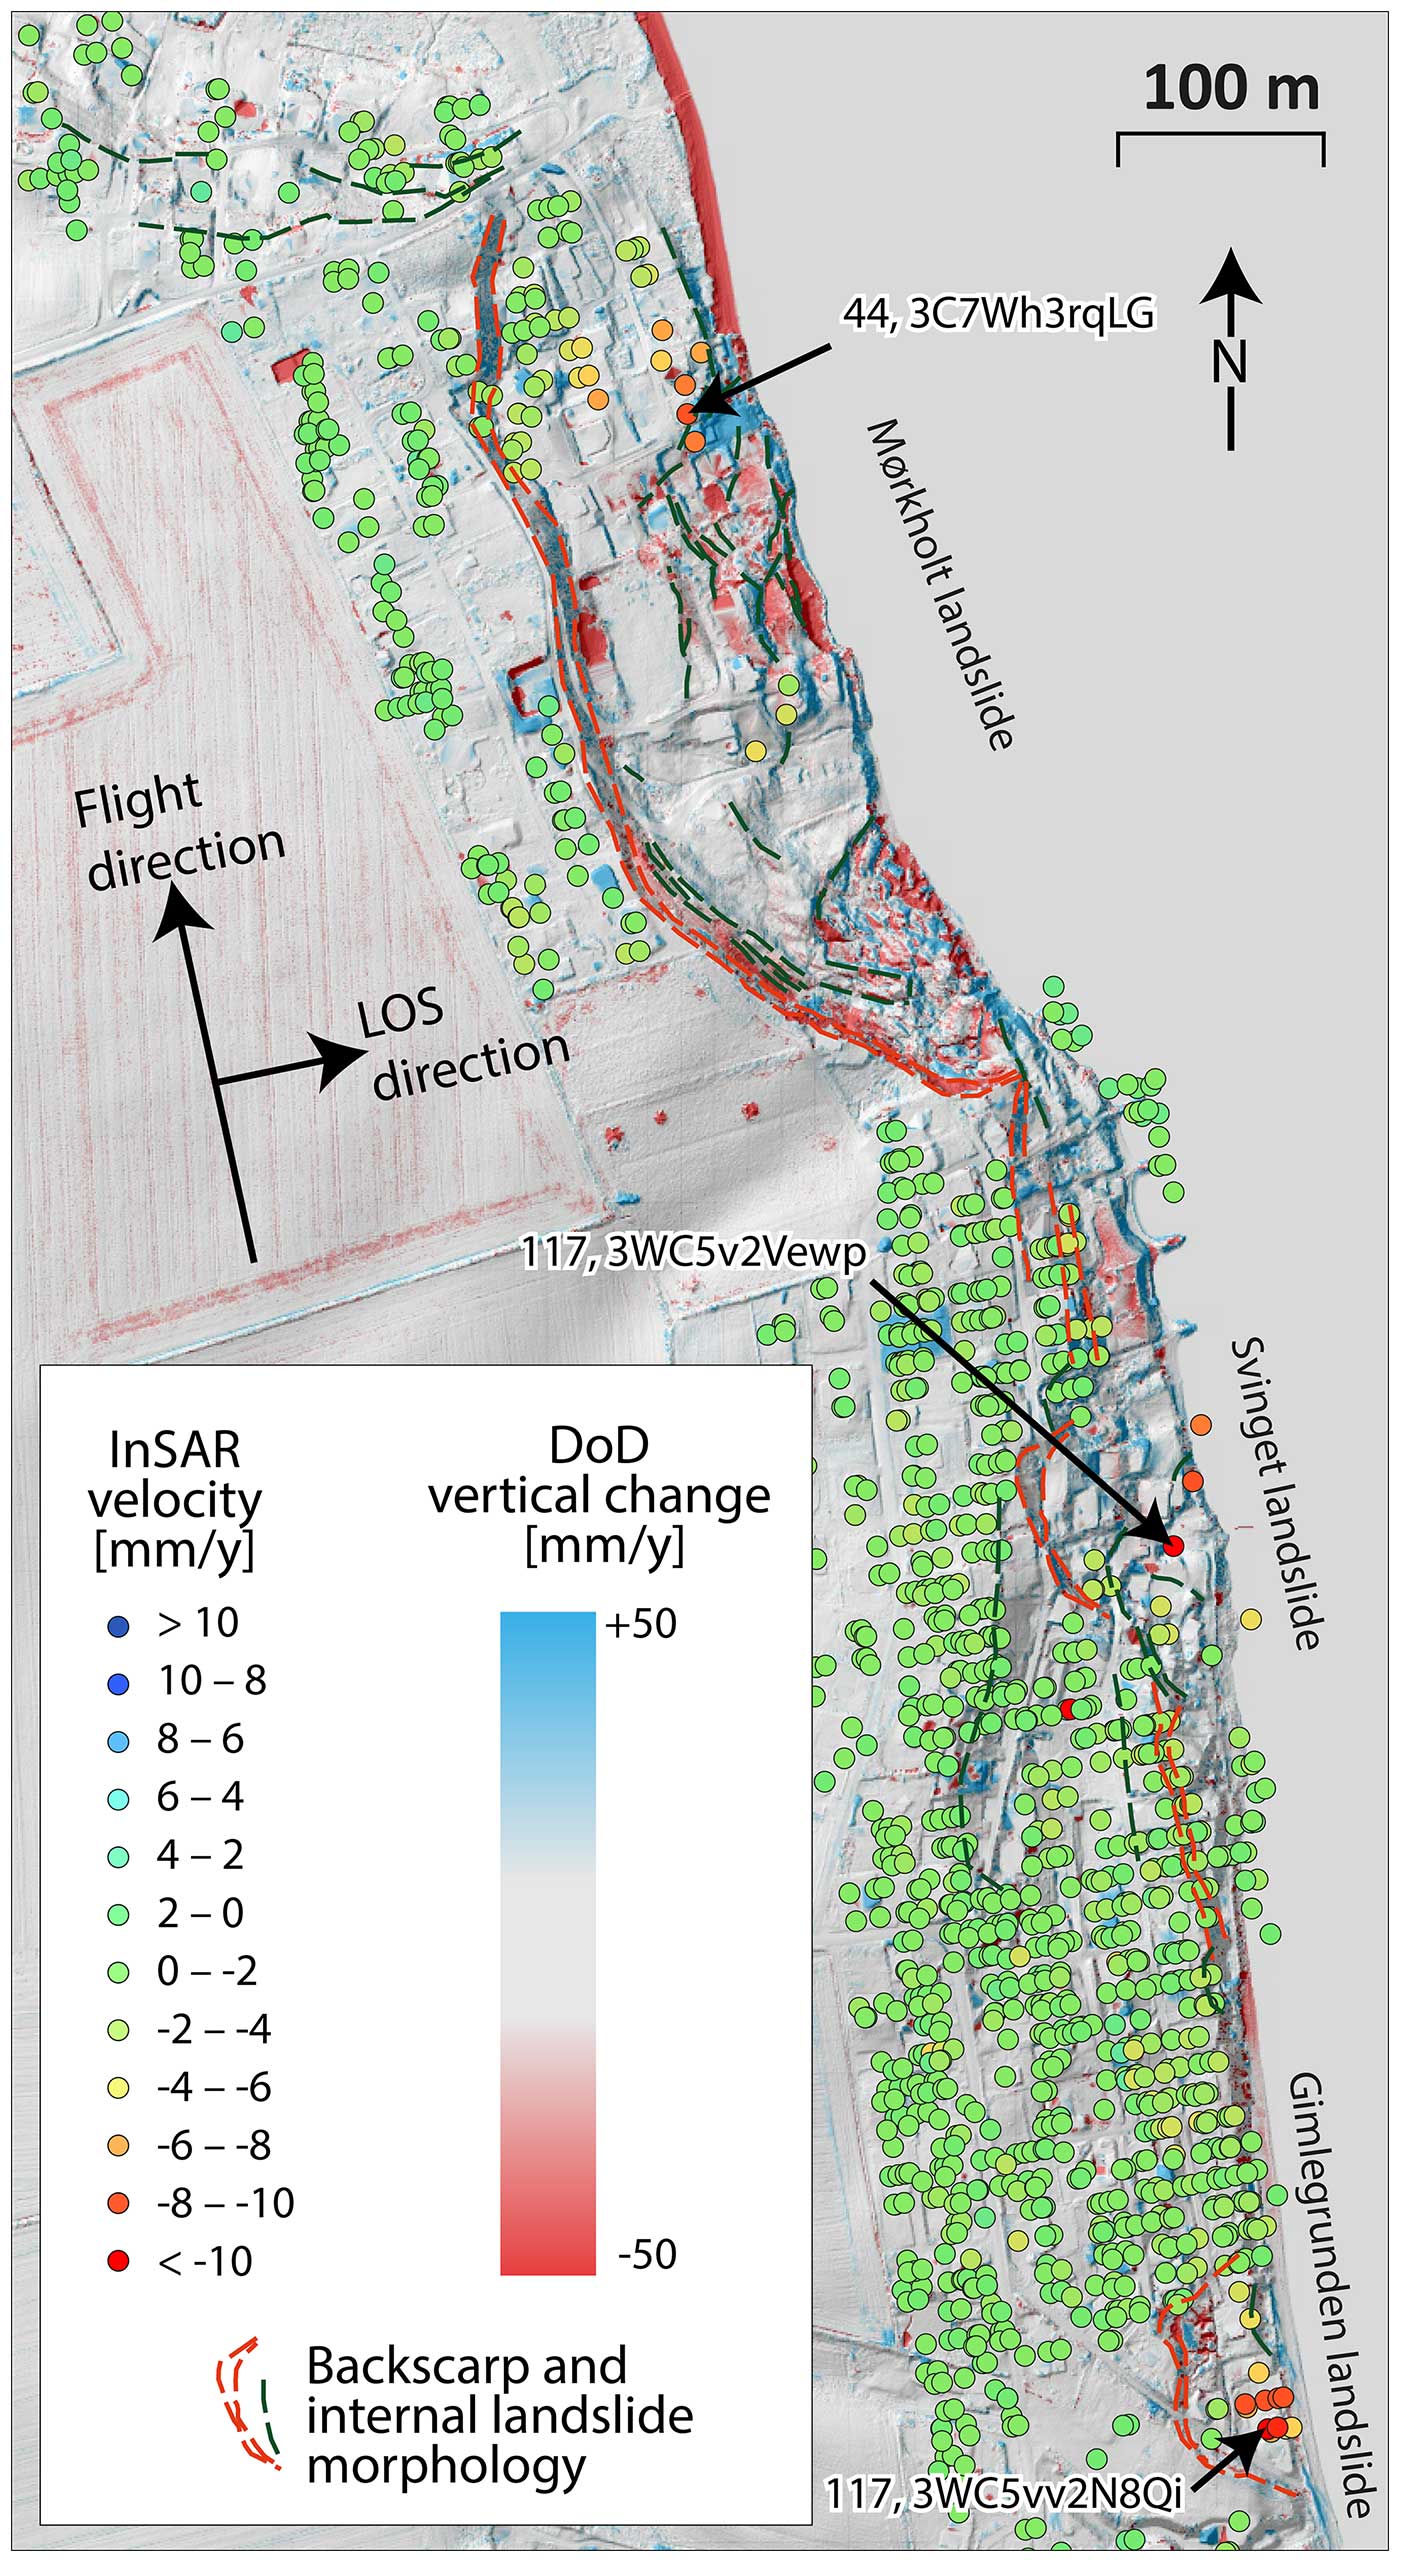
Figure 3Landslide activity at the three landslides. The DoD shows the difference in elevation between 2014 and 2018 overlain with a hillshade model. InSAR points from tracks 44 and 117 are shown as points coloured according to their mean LOS velocities during 2015–2020. The numbered InSAR points marked with arrows refer to the time series shown in Fig. 6. The extent of the map is the same as in Fig. 1c and d.
2.3 Field visits and historical accounts
Field visits were carried out during a 2 d inspection in June 2021 in order to verify remotely sensed observations of the landslide extent and examine potential signs of landslide activity in steps 1A and 1B of the workflow (Fig. 2). These observations are presented in the Results section as photos and descriptions of geomorphological expressions of landslide activity. Accounts from residents and the local history archive have been gathered to constrain an earlier episode of fast landslide development. These include photos, eyewitness accounts and contemporaneous news items.
2.4 Groundwater modelling
Modelled (hindcast) water table depth (WTD) is analysed as a potential dynamic conditioning factor for the landslides by correlation analysis with InSAR movement data (step 2 in Fig. 2). Forecasted WTD is used to examine the climate sensitivity of the landslide in step 3 of the workflow.
In Denmark, the national water resources model of Denmark, the DK-model, has been continuously developed for the past 25 years by the Geological Survey of Denmark and Greenland (Henriksen et al., 2003; Højberg et al., 2013). The model represents physically based descriptions of groundwater flow, surface water dynamics and groundwater–surface water interactions while integrating water demands, e.g. irrigation and domestic (household) use. The model is built using the MIKE SHE model code (Abbott et al., 1986) and it is spatially distributed in a 100 m grid. Our study utilizes the simulation data openly available on the Danish Hydrological Information and Prognosis system (DK-HIP; Henriksen et al., 2020). We are primarily focusing on simulated water table depth (WTD), defined as the depth below the terrain to the uppermost water table. All simulated WTD data presented in this paper are publicly available via the DK-HIP model data portal (Hydrologisk Informations- og Prognosesystem, 2024). The national simulations were subsetted to match the domain of the study area. We have analysed historical and future simulations. The historical WTD simulations are at 100 m resolution at daily time step from 1990 to 2019. The data are used to analyse the temporal WTD dynamics for the study area for the period 2015 to 2019, overlapping with the period of InSAR ground movement. Furthermore, long-term average summer and winter WTD maps at a 10 m resolution (Koch et al., 2021) are used to screen the study site for areas with a distinct WTD seasonality. Climate change impact simulations for WTD are analysed for Representative Concentration Pathway (RCP) 4.5 and RCP8.5 scenarios at a 500 m spatial resolution that quantify the changes in WTD for the end of the twenty-first century. RCP4.5 is the pathway of low to moderate emissions throughout the twenty-first century, as defined by IPCC, while RCP8.5 is the scenario of very high future emissions towards the year 2100, as defined by IPCC.
The WTD simulations, obtained from the DK-HIP model data portal, underwent several processing steps before the final analysis. A single WTD time series at a monthly time step, representing the mean aggregated groundwater dynamics for the entire study area, has been derived from daily WTD simulation results from 16 selected 100 m by 100 m grids (Fig. 5). DK-HIP model simulations are subject to uncertainty, with a mean error below 1 m for the validation dataset. The model was validated against groundwater head data from a period independent of the calibration dataset. The model was not intended to be used at individual 100 m grids but instead at a more aggregated level in order to assess catchment-scale hydrology. To mitigate this, we first normalized the simulation result by mean division and then aggregated it in space and time in order to obtain a robust time series of WTD dynamics for the study area. Simulated WTD can fluctuate and vary sustainably when investigating single grids due to the 3D hydrogeological layer model and boundary conditions which a normalization can take care of. The grids were selected based on two criteria. First, they had to be situated close to the coast in areas collocated with the mapped landslides. Second, the standard deviation of the simulated WTD dynamics may not exceed 2 m, which constrains the analysis to a robust groundwater simulation without drying out of simulation cells, resulting in a water table that jumps between computational layers. The first computational layer has a thickness of 2 m and, in several cases, the WTD jumps from the top layer to deeper computational layers. Further, the 16 WTD time series were normalized grid-wise (division by mean) in order to represent the deviation around the mean to obtain anomaly time series that are comparable with each other. Lastly, the time series were aggregated to a monthly timescale using the mean function, and the monthly variability was calculated by the standard deviation across all grids. The climate change impact was obtained based on simulations at five selected 500 m by 500 m grids (Fig. 5), and the projected change in WTD was calculated as the average across the selected grids every month. The uncertainty associated with the climate change impact simulations was estimated as the mean climate model ensemble standard deviation. The climate change impact was simulated for both RCP4.5 and RCP8.5 for a far-future situation representing 2071–2100. The near-future situation representing 2041 to 2070 is also modelled in the DK-HIP model; however, precipitation increases most severely in the far-future period (Pasten-Zapata et al., 2019), which makes far-future scenarios more relevant to examine concerning landslide impacts and more uncertain. The WTD seasonality, i.e. amplitude representing the difference between dry summer and wet winter, was calculated based on the 10 m summer and winter WTD maps.
2.5 Precipitation data
We use precipitation data as an auxiliary variable in the analysis to investigate linkages between precipitation and landslide movement (step 2 in Fig. 3). The data originate from the 10 km by 10 km gridded precipitation dataset from the Danish Meteorological Institute (DMI; Scharling, 1999). Data were extracted for a single 10 km grid cell, which fully encompasses the study site. Data are available via the DMI's free data API (DMI, 2024). For the analysis, we aggregated the daily precipitation time series to weekly values using the sum function.
2.6 Correlation analysis
Correlation analysis between movement data of the three landslides, WTD and precipitation was carried out in the R software package (R Project, 2023). Spearman's rank correlation coefficient (ρ) was calculated to investigate the extent of correlation between the WTD and the weekly LOS movement of each landslide. Positive LOS movement rates were considered outliers and removed before the analysis. Spearman's rank correlation assesses the monotonicity of the relation between two variables which we favoured over the Pearson correlation because of the expected non-linearity between WTD and InSAR landslide movement.
3.1 Spatial movement patterns of the landslides
For the Mørkholt landslide, the DoD shows subsidence along the backscarp and at the coast with a vertical component of up to 2.6 m over 4 years (equivalent to an average subsidence of 650 mm yr−1). InSAR reflectors are present in the northern part of the landslide but are absent in the central and southern parts where large DoD anomalies are evident. The largest recorded InSAR movement is observed near the eastern row of houses with 5–10 mm yr−1. Field evidence of active deformation is ubiquitous across the landslide and includes structural damage to fences and buildings, an open fracture with up to 30 cm vertical offset, an uplifted surface of black clay at the beach, rotated landslide blocks (Fig. 4), and springs (Fig. 1c and d).
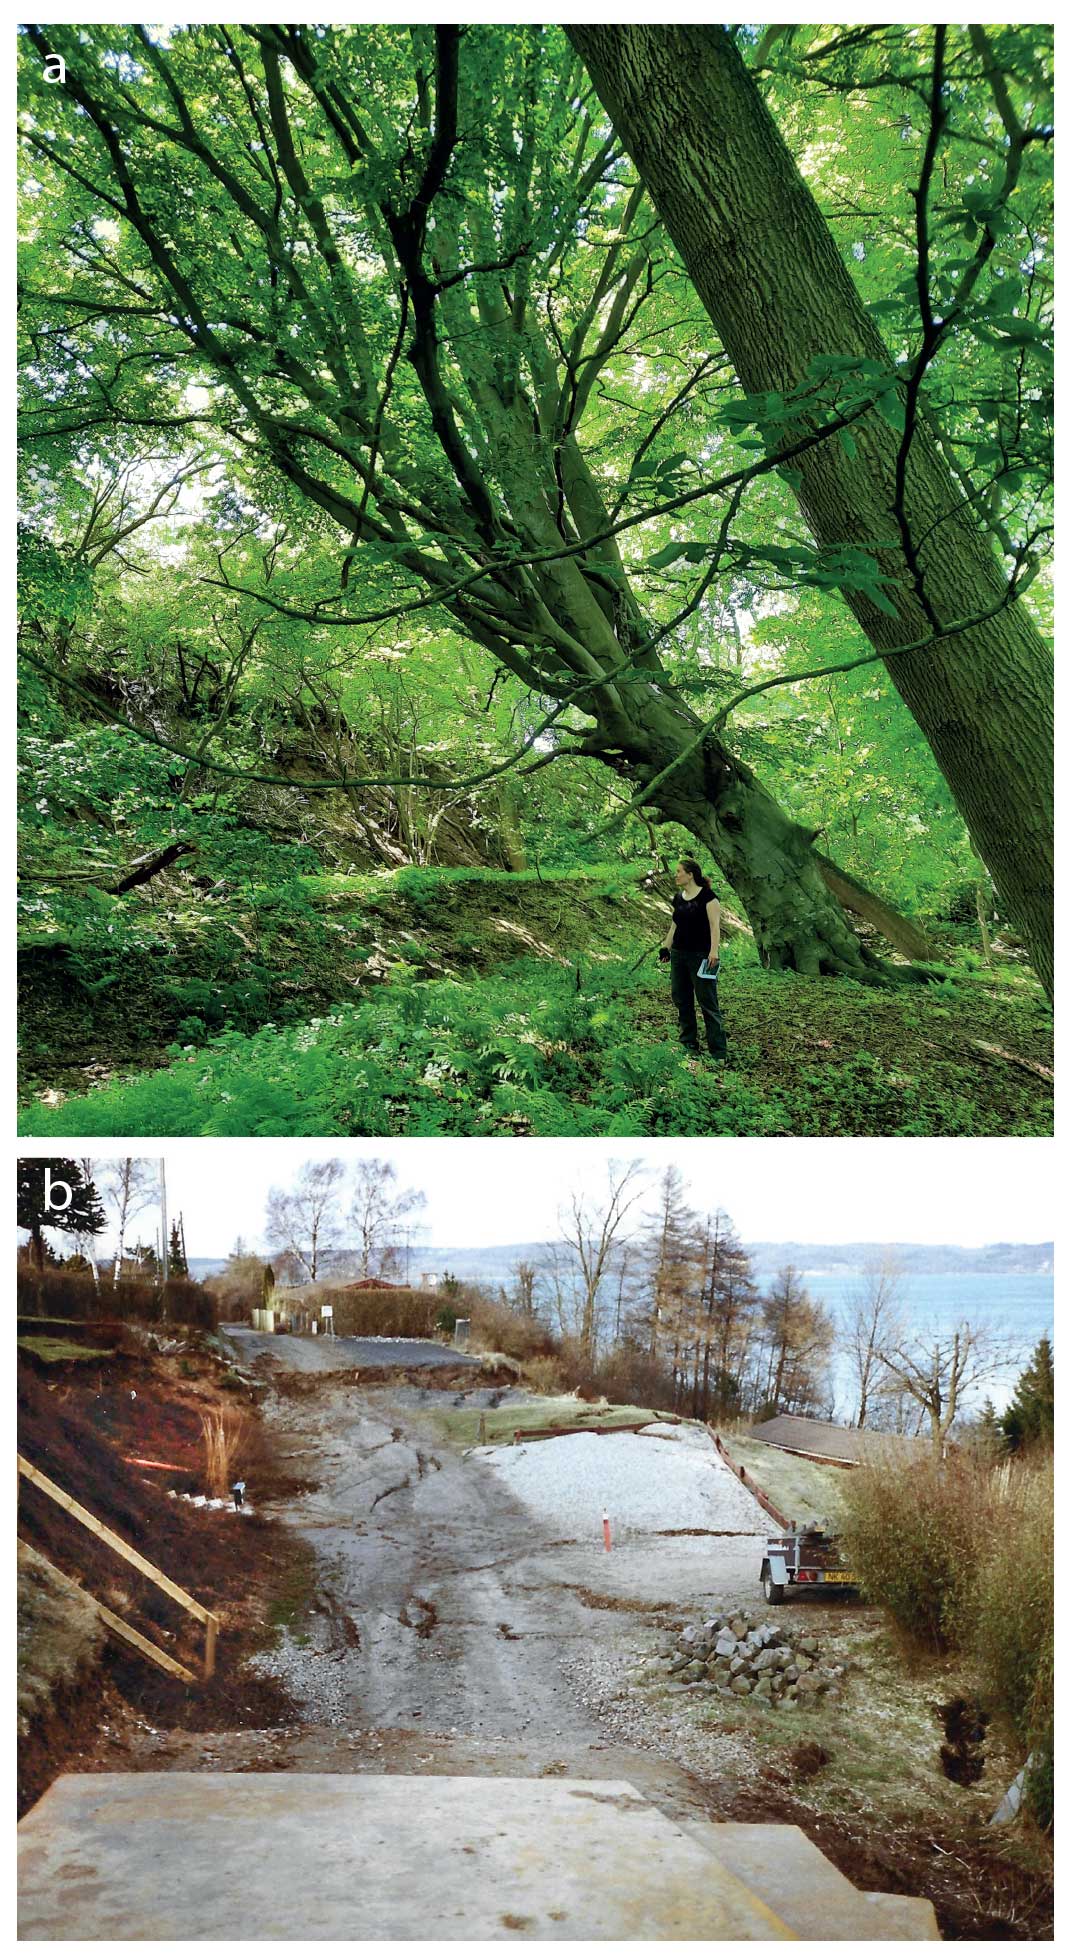
Figure 4(a) Field photo of a large beech tree (Fagus sylvatica) on the Mørkholt landslide. The tree has been tilted by progressive landslide activity, as shown by the upward-changing dip of the trunk, demonstrating the progressive and long-lived nature of the landslide. A minor scarp and the backscarp of the Mørkholt landslide are seen to the left of the tree. See Fig. 1d for the location of the photo. (b) Photo taken in March 1981 at the head of the Svinget landslide after a month of accelerated landslide activity. The photographer is standing on the southern part of the gravel road, the central part of which has subsided by 4–6 m over a month, creating the present backscarp of the Svinget landslide. See Fig. 1d for the location of the photo. Photo courtesy of Lars Hansen.
For the Svinget landslide, the DoD shows heterogeneous movement across the landslide. The maximum average subsidence of ca. 70 mm yr−1 is found in the northern part. Rotated landslide blocks bounded by steeper slopes of around 40° inside the central and northern parts of the landslide show a relative uplift in the DoD. The Svinget landslide has a few persistent scatter points in the central part of the landslide, close to the coast, with movement of up to 25 mm yr−1. InSAR points in the southern part of the landslide show no or little movement. Only a few signs of active deformation were observed during the June 2021 fieldwork; however, a brick-and-mortar house built across the backscarp in the northern part of the landslide was observed to be severely damaged. A local house owner explained that he re-levels his house every 2 to 5 years with a jack, as landslide activity is tilting it, and that fractures appear in lawns and paths in the same place every spring near where InSAR data show the highest movement rates (InSAR point ID “3WC5v2Vewp” in Fig. 3).
Historical records and information provided by local house owners informed us that the central part of the Svinget landslide had a period of rapid movement in the early 1980s, mainly focused around February and March 1981. The landslide movement continued for a couple of years, with one of the houses close to the backscarp moving by a total of 18 m, and 40 m of the road going through the landslide was damaged and had to be abandoned (Fig. 4b). Today, this scarp is outlined by the central 120 m wide slope in the Svinget landslide. In association with this landslide activity, a parallel bar of clay on the coast emerged in the sea ca. 30 m from the shore, indicating that the seabed where the basal surface of ruptured daylight was uplifted during the event. Wave erosion removed this feature after some years, but a dark lineament on the seabed is still apparent in orthophotos (Fig. 1c). Both 1980 and 1981 were extremely wet years, with annual precipitation for both years being 100 mm above the Danish 1981–2010 normal (Cappelen, 2019). March 1981 is the fourth wettest March on record in Denmark, with total precipitation of 91 mm (Cappelen, 2019).
The DoD does not show subsidence in the Gimlegrunden landslide. A DoD anomaly in the northern part of the landslide is probably due to excavation work. InSAR points are available throughout the landslide with movements of up to 10 mm yr−1. Movement is more pronounced near the coast. No obvious signs of active deformation could be observed in the field.
3.2 Temporal movement and dynamic conditioning factor pattern–InSAR movement and groundwater modelling results
The average WTD seasonality, expressed as the difference between the long-term average winter and summer WTD (1991–2020), varied between ca. 0 and 2 m for the study site (Fig. 5). Figure 6a depicts the average WTD seasonality over the three landslides for 5 years. The dynamics are characterized by shallow groundwater levels during winter and deep groundwater levels during summer. Depending on precipitation and evapotranspiration during a year, the seasonality can vary between less than 1 m in 2017 and approximately 2 m in 2016 and 2018 (Fig. 6a). The highest WTD is simulated for the winters 2015/2016, 2017/2018 and 2019/2020, whereas the winters 2016/2017 and 2018/2019 have a relatively deep normalized WTD. The WTD uncertainty for the study site also varies seasonally, with the highest variability found in months with the highest and lowest groundwater levels. More specifically, the standard deviation can vary between approximately 0.1 m (December 2016) and 0.5 m (January 2016). Comparing the WTD seasonality shown in Figs. 5 and 6a underlines that a distinct variability in space (Fig. 5) and time (Fig. 6a) exists. The WTD time series shown in Fig. 6a is averaged over 16 simulation grids (shown in Fig. 5) and aggregated from a daily to monthly timescale.
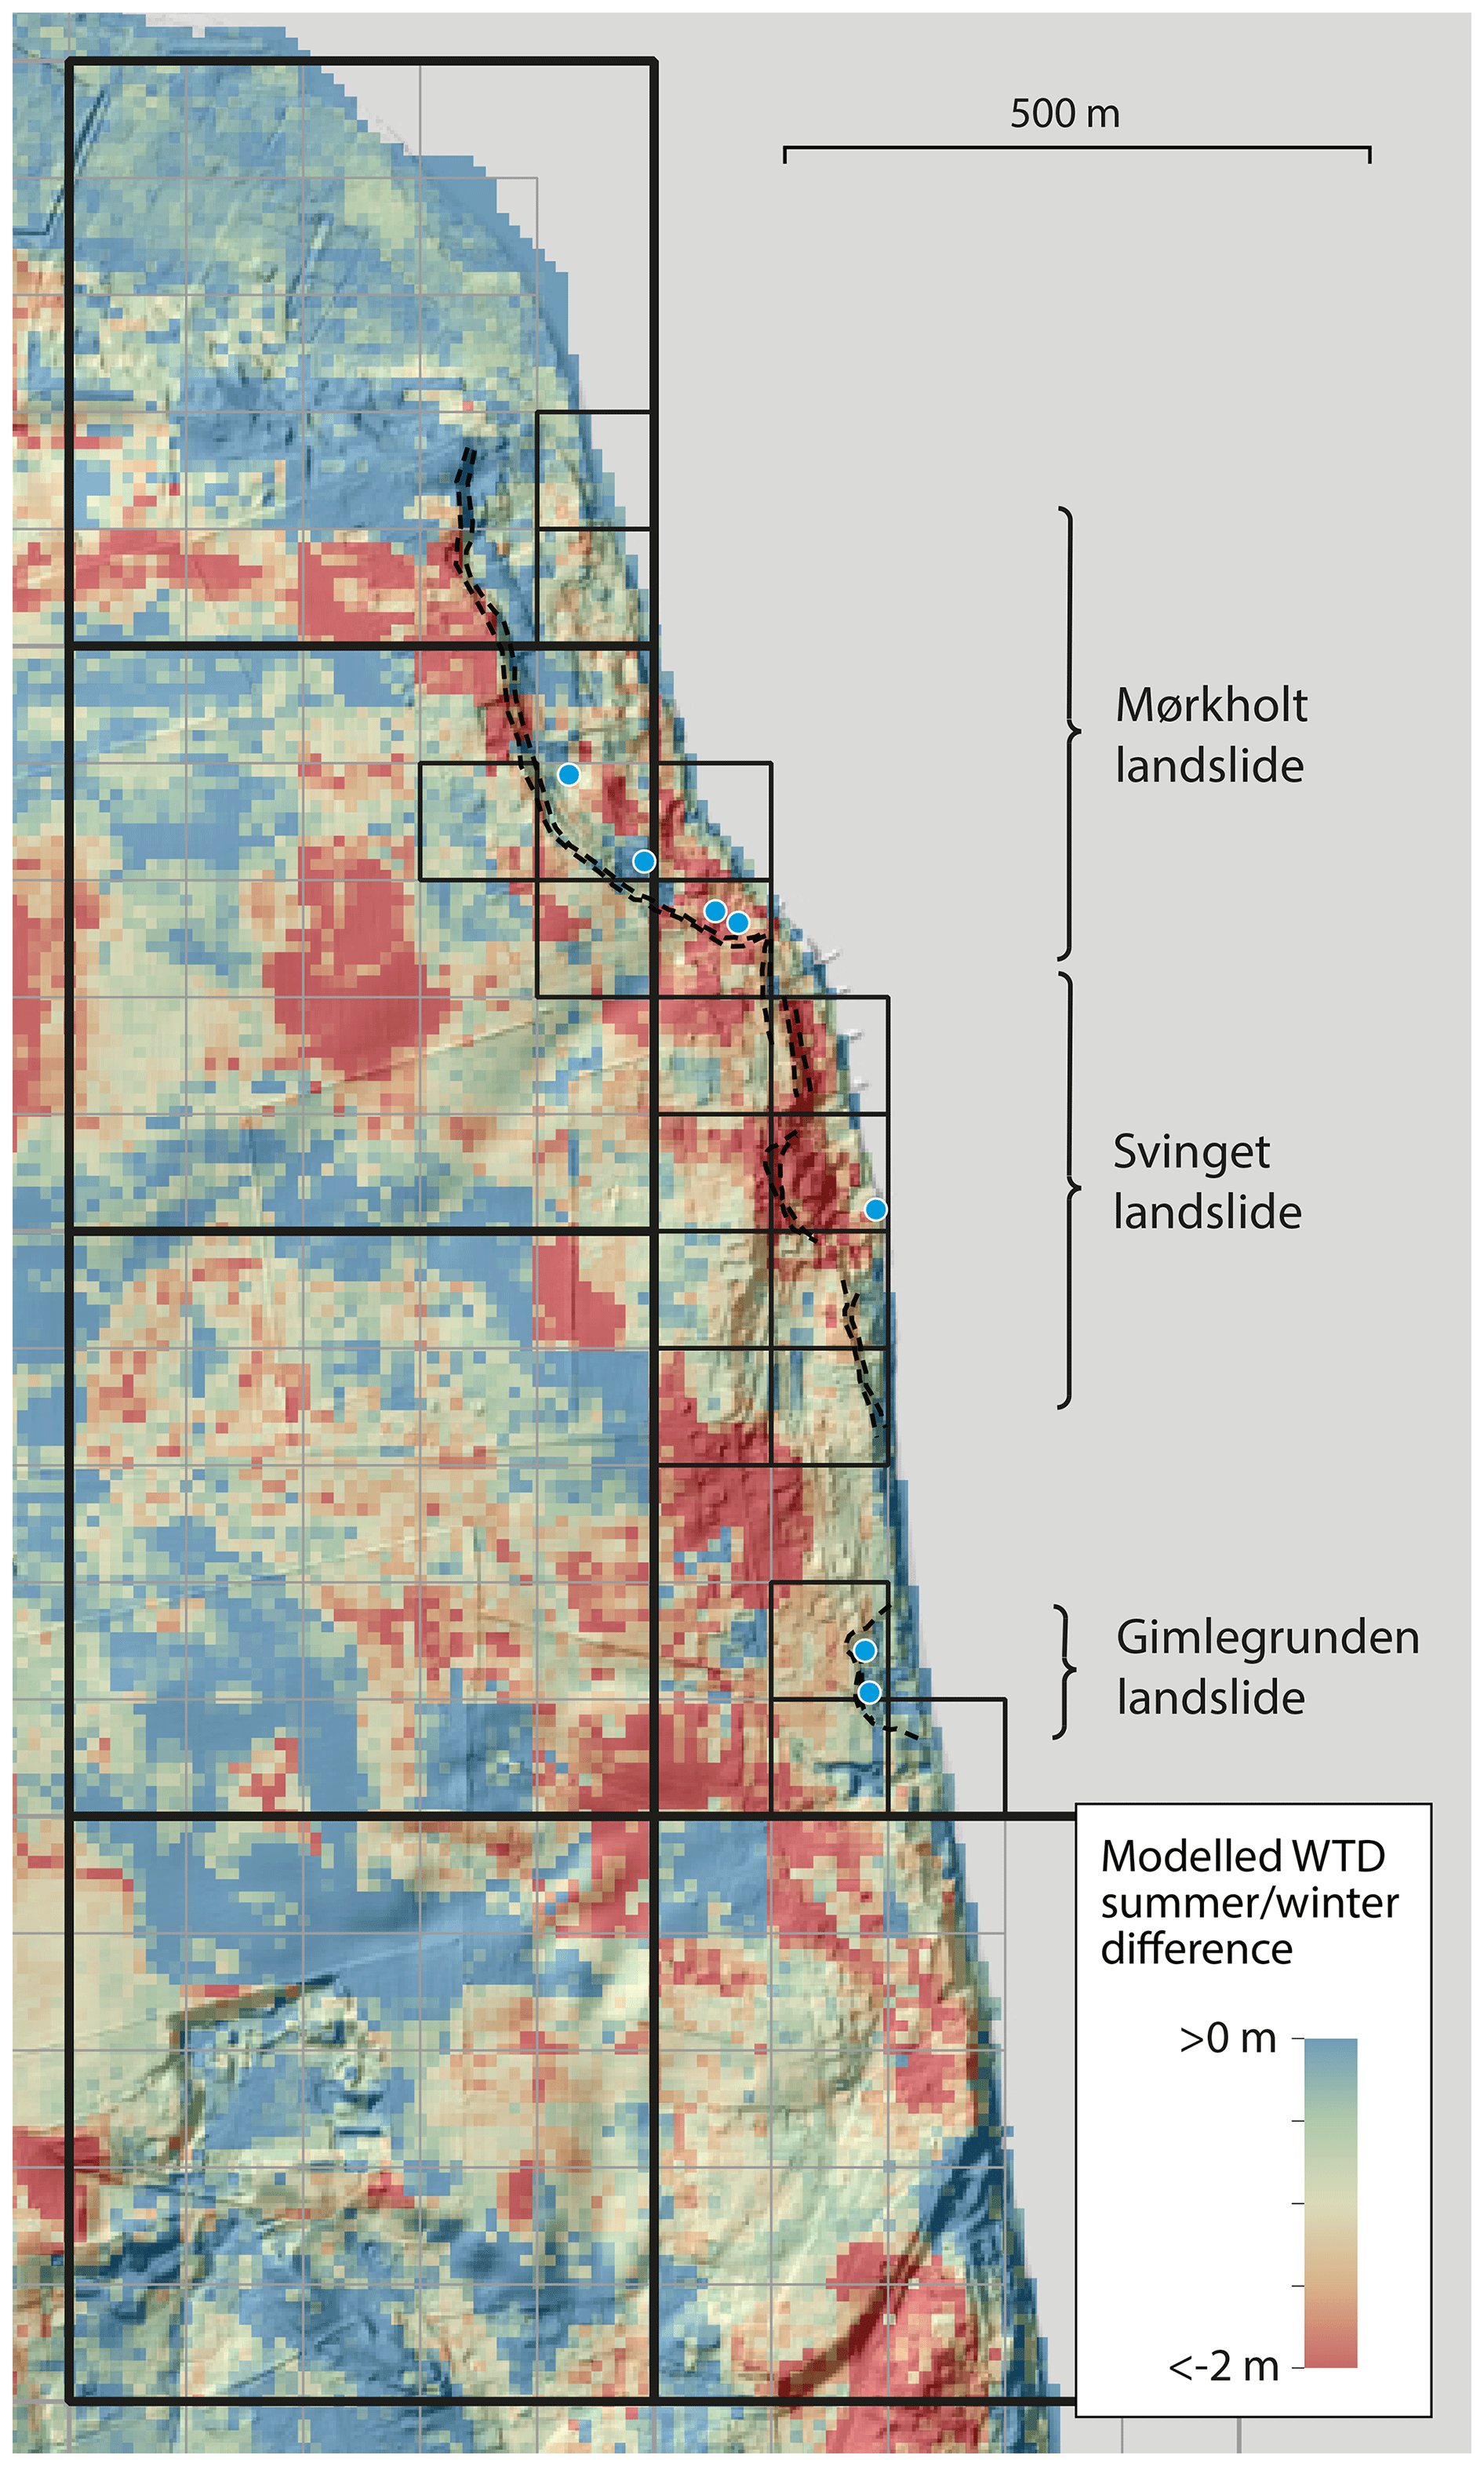
Figure 5Danish Hydrological Information and Prognosis system (DK-HIP model). Map showing the difference between the modelled summer and winter water table depth (WTD) in the study area for the period 1991 to 2020, downscaled following Koch et al. (2021). The small 100 m grid cells highlighted in black (n=16) are used to calculate the WTD in Fig. 6a. Larger (500 m) grid cells (n=5) are used to analyse the climate change impact on WTD in Fig. 7. The map is overlain by a hillshade. Mapped landslide backscarps are shown with dashed black lines. Springs observed during fieldwork in June 2021 are indicated with blue dots. Note that the map extent is slightly larger than that in Fig. 1c and d in order to show the 500 m grid cells.
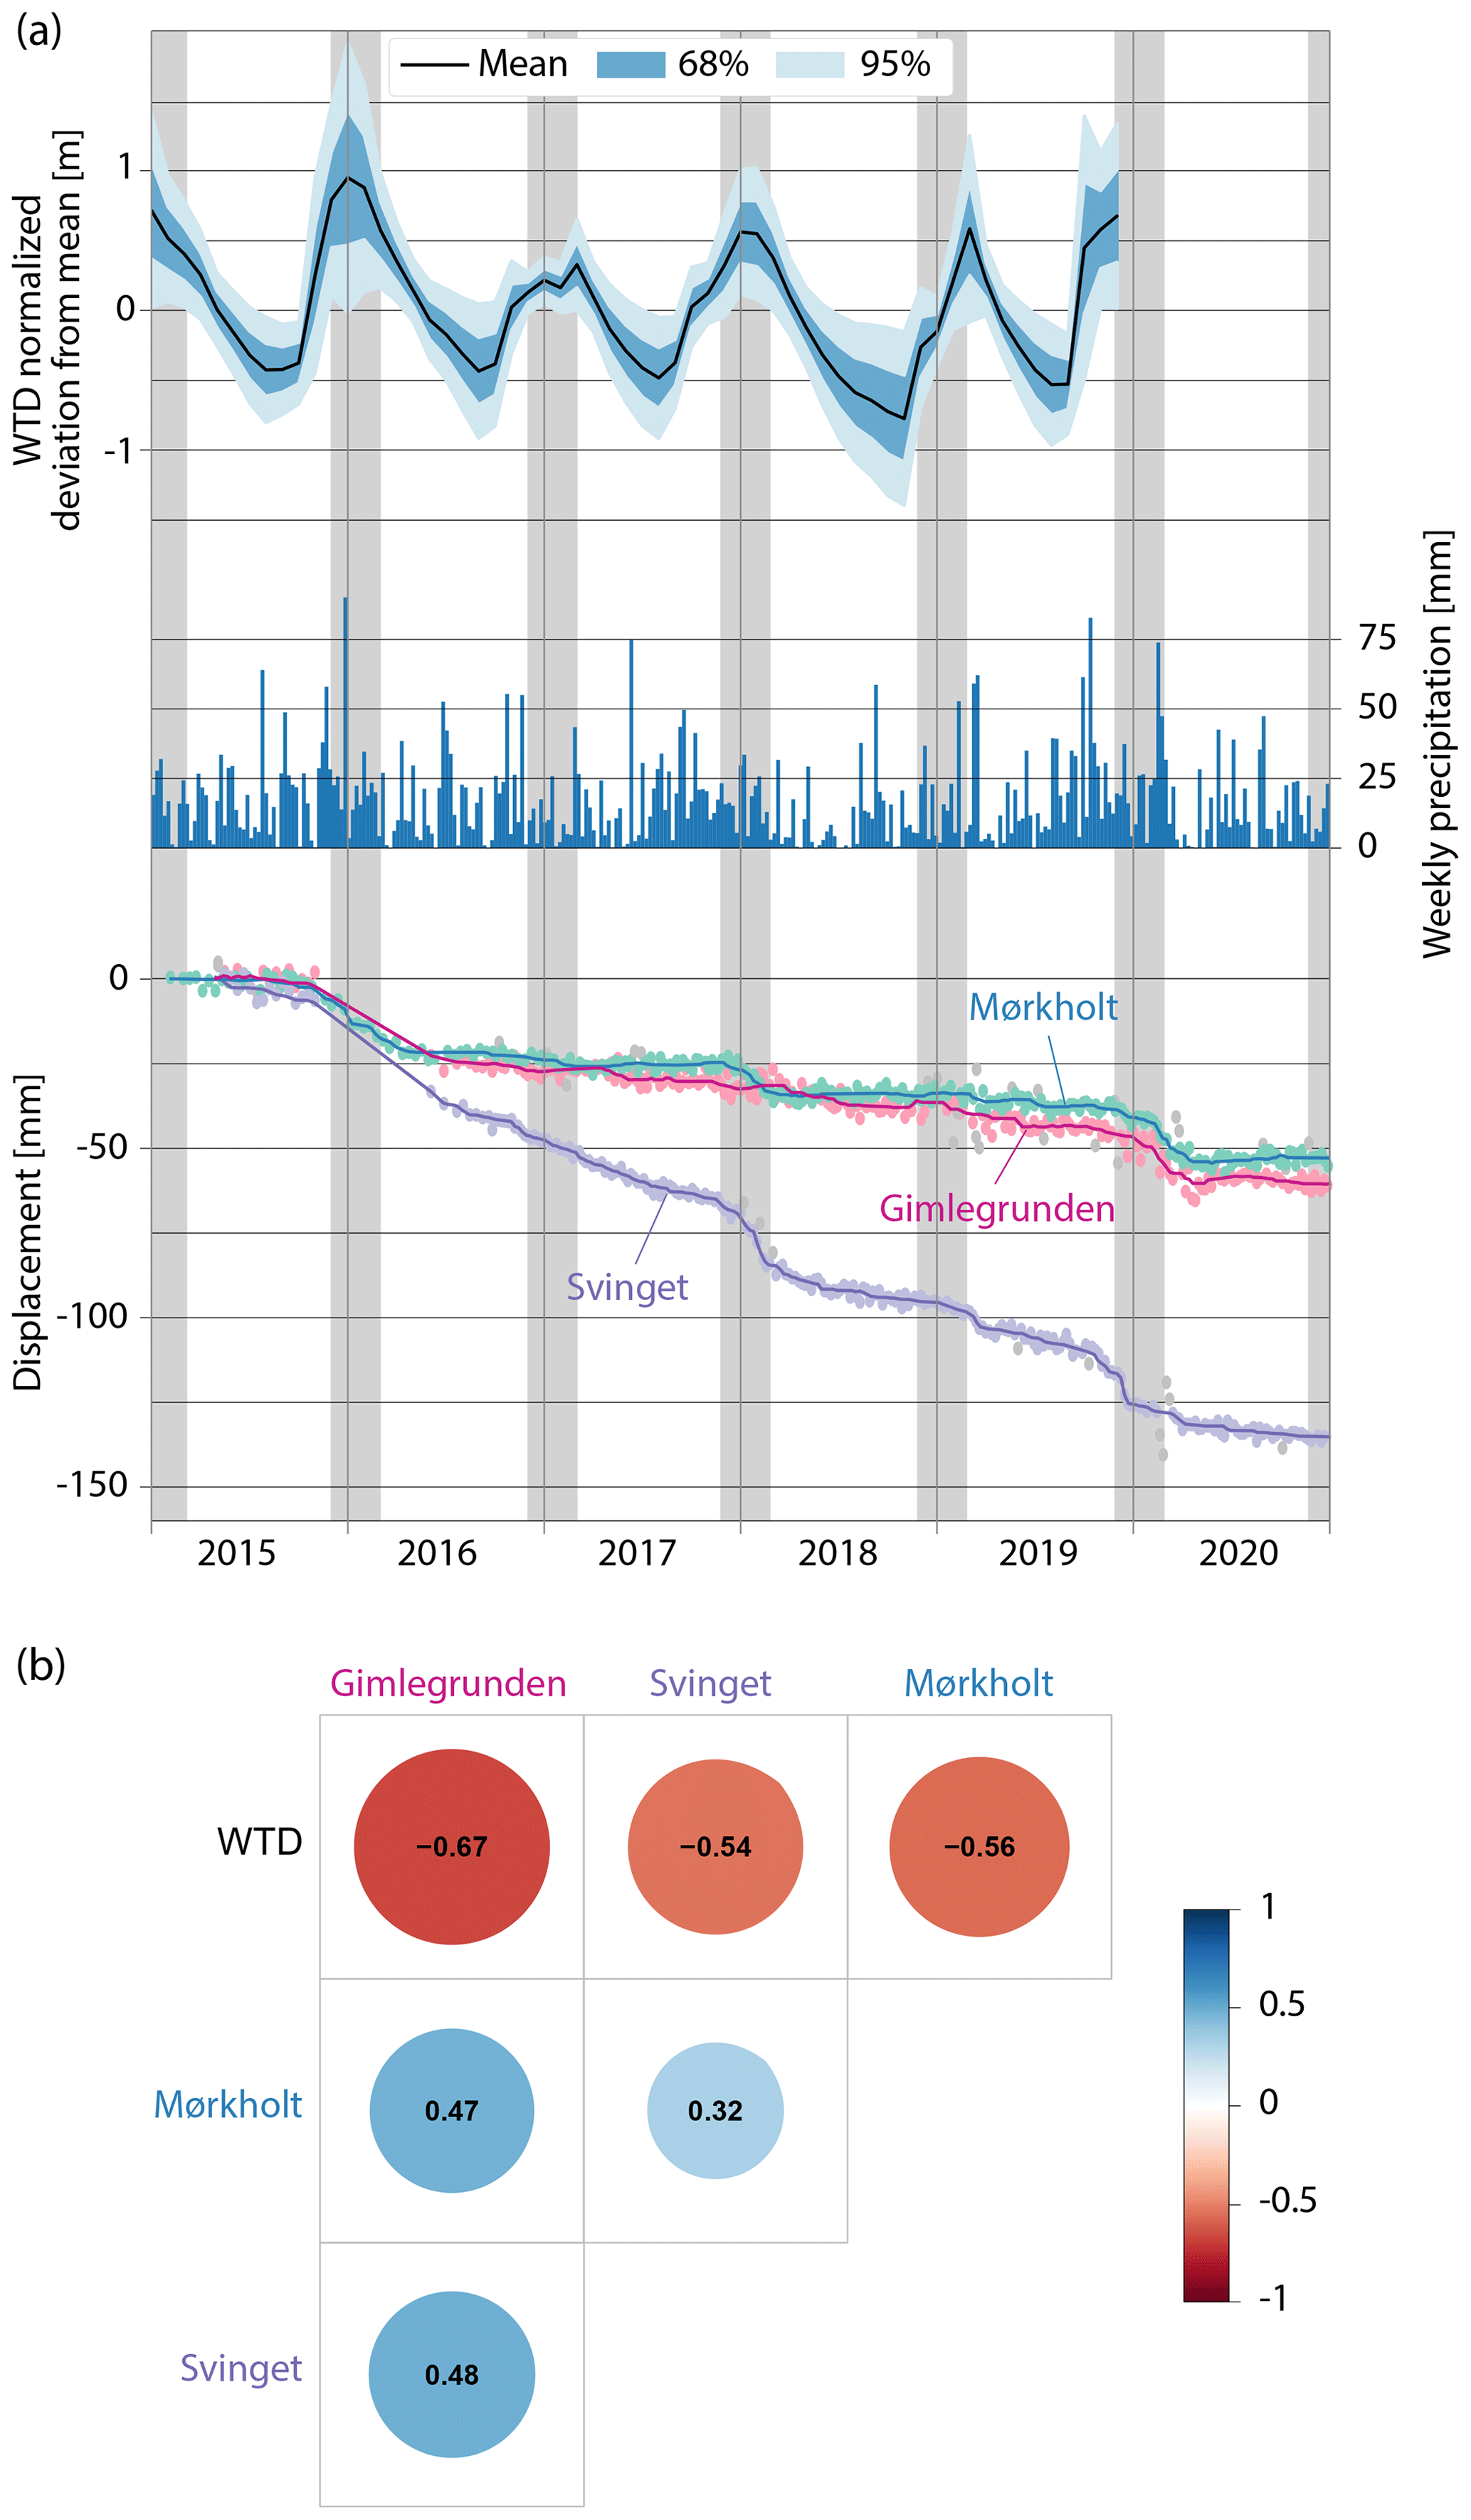
Figure 6(a) Mean normalized WTD for the 16 selected 100 m grids (see Fig. 5) at monthly timescales and InSAR displacement data for three InSAR points within each landslide (see Fig. 3). Also shown is the weekly precipitation for the period. InSAR outliers disregarded for the running average calculation are coloured grey. Winter months (December, January and February) are shown as shaded-grey bars to aid readability. (b) Spearman's rank correlation coefficient (ρ) derived from the WTD and the weekly movement for each of the three landslides. Blue indicates positive correlations and red indicates negative correlations, with p<0.01.
Movement is observed exclusively in the winter seasons in the Mørkholt and Gimlegrunden landslides. For the Mørkholt landslide, particularly large movements of 48–72 mm yr−1 are seen in the winters of 2015/2016, 2017/2018 and 2019/2020 (Fig. 6a). Our WTD time series does not include the entire 2019/2020 season as the model only runs to December 2019. However, that winter was the wettest on record in Denmark. For the Svinget landslide, movement occurs throughout the year but at various rates, with the fastest movement of up to 84 mm yr−1 in winter and early spring (Fig. 6a).
The WTD shows a strong negative correlation (ρ ranges between −0.54 and −0.67) with the movement for all three landslides (Fig. 6b); when the water table is high, the weekly movement is also high, and when the water table is low, the weekly movement is also low. No correlation was found between the accumulated weekly precipitation and the InSAR movement of any of the three landslides. The temporal lag between weekly precipitation and InSAR movement is expected to be negligible for the case study, since the WTD is around 2 m below terrain (Fig. 5), giving a direct response to precipitation events.
3.3 Climate modelling
To understand how climate change may impact future landslide activity, simulated groundwater levels for the study area were examined for the historic period of 1990–2019, and two climate scenarios, RCP4.5 and RCP8.5, were examined for the period of 2071–2100. Figure 7a depicts the long-term average and standard deviation of the historic WTD at monthly timescales for the 16 selected simulation grids shown in Fig. 5. The climate change impacts in Fig. 7b and c are averaged for the five 500 m simulation grids also shown in Fig. 5. The WTD is expected to rise for all months towards the end of the twenty-first century. The rise in WTD is more pronounced for RCP8.5 than for RCP4.5. The rise in WTD in the period 2071–2100 is most distinct during the winter months, showing that we can expect wetter winters with a WTD in December up to 0.7 m higher relative to today, following the RCP8.5 (95 % confidence interval;red asterisk in Fig. 7c). The similar value for RCP4.5 (95 % confidence interval) is 0.3 m (blue asterisk in Fig. 7b). These values are calculated by adding 2 × standard deviation to the mean.
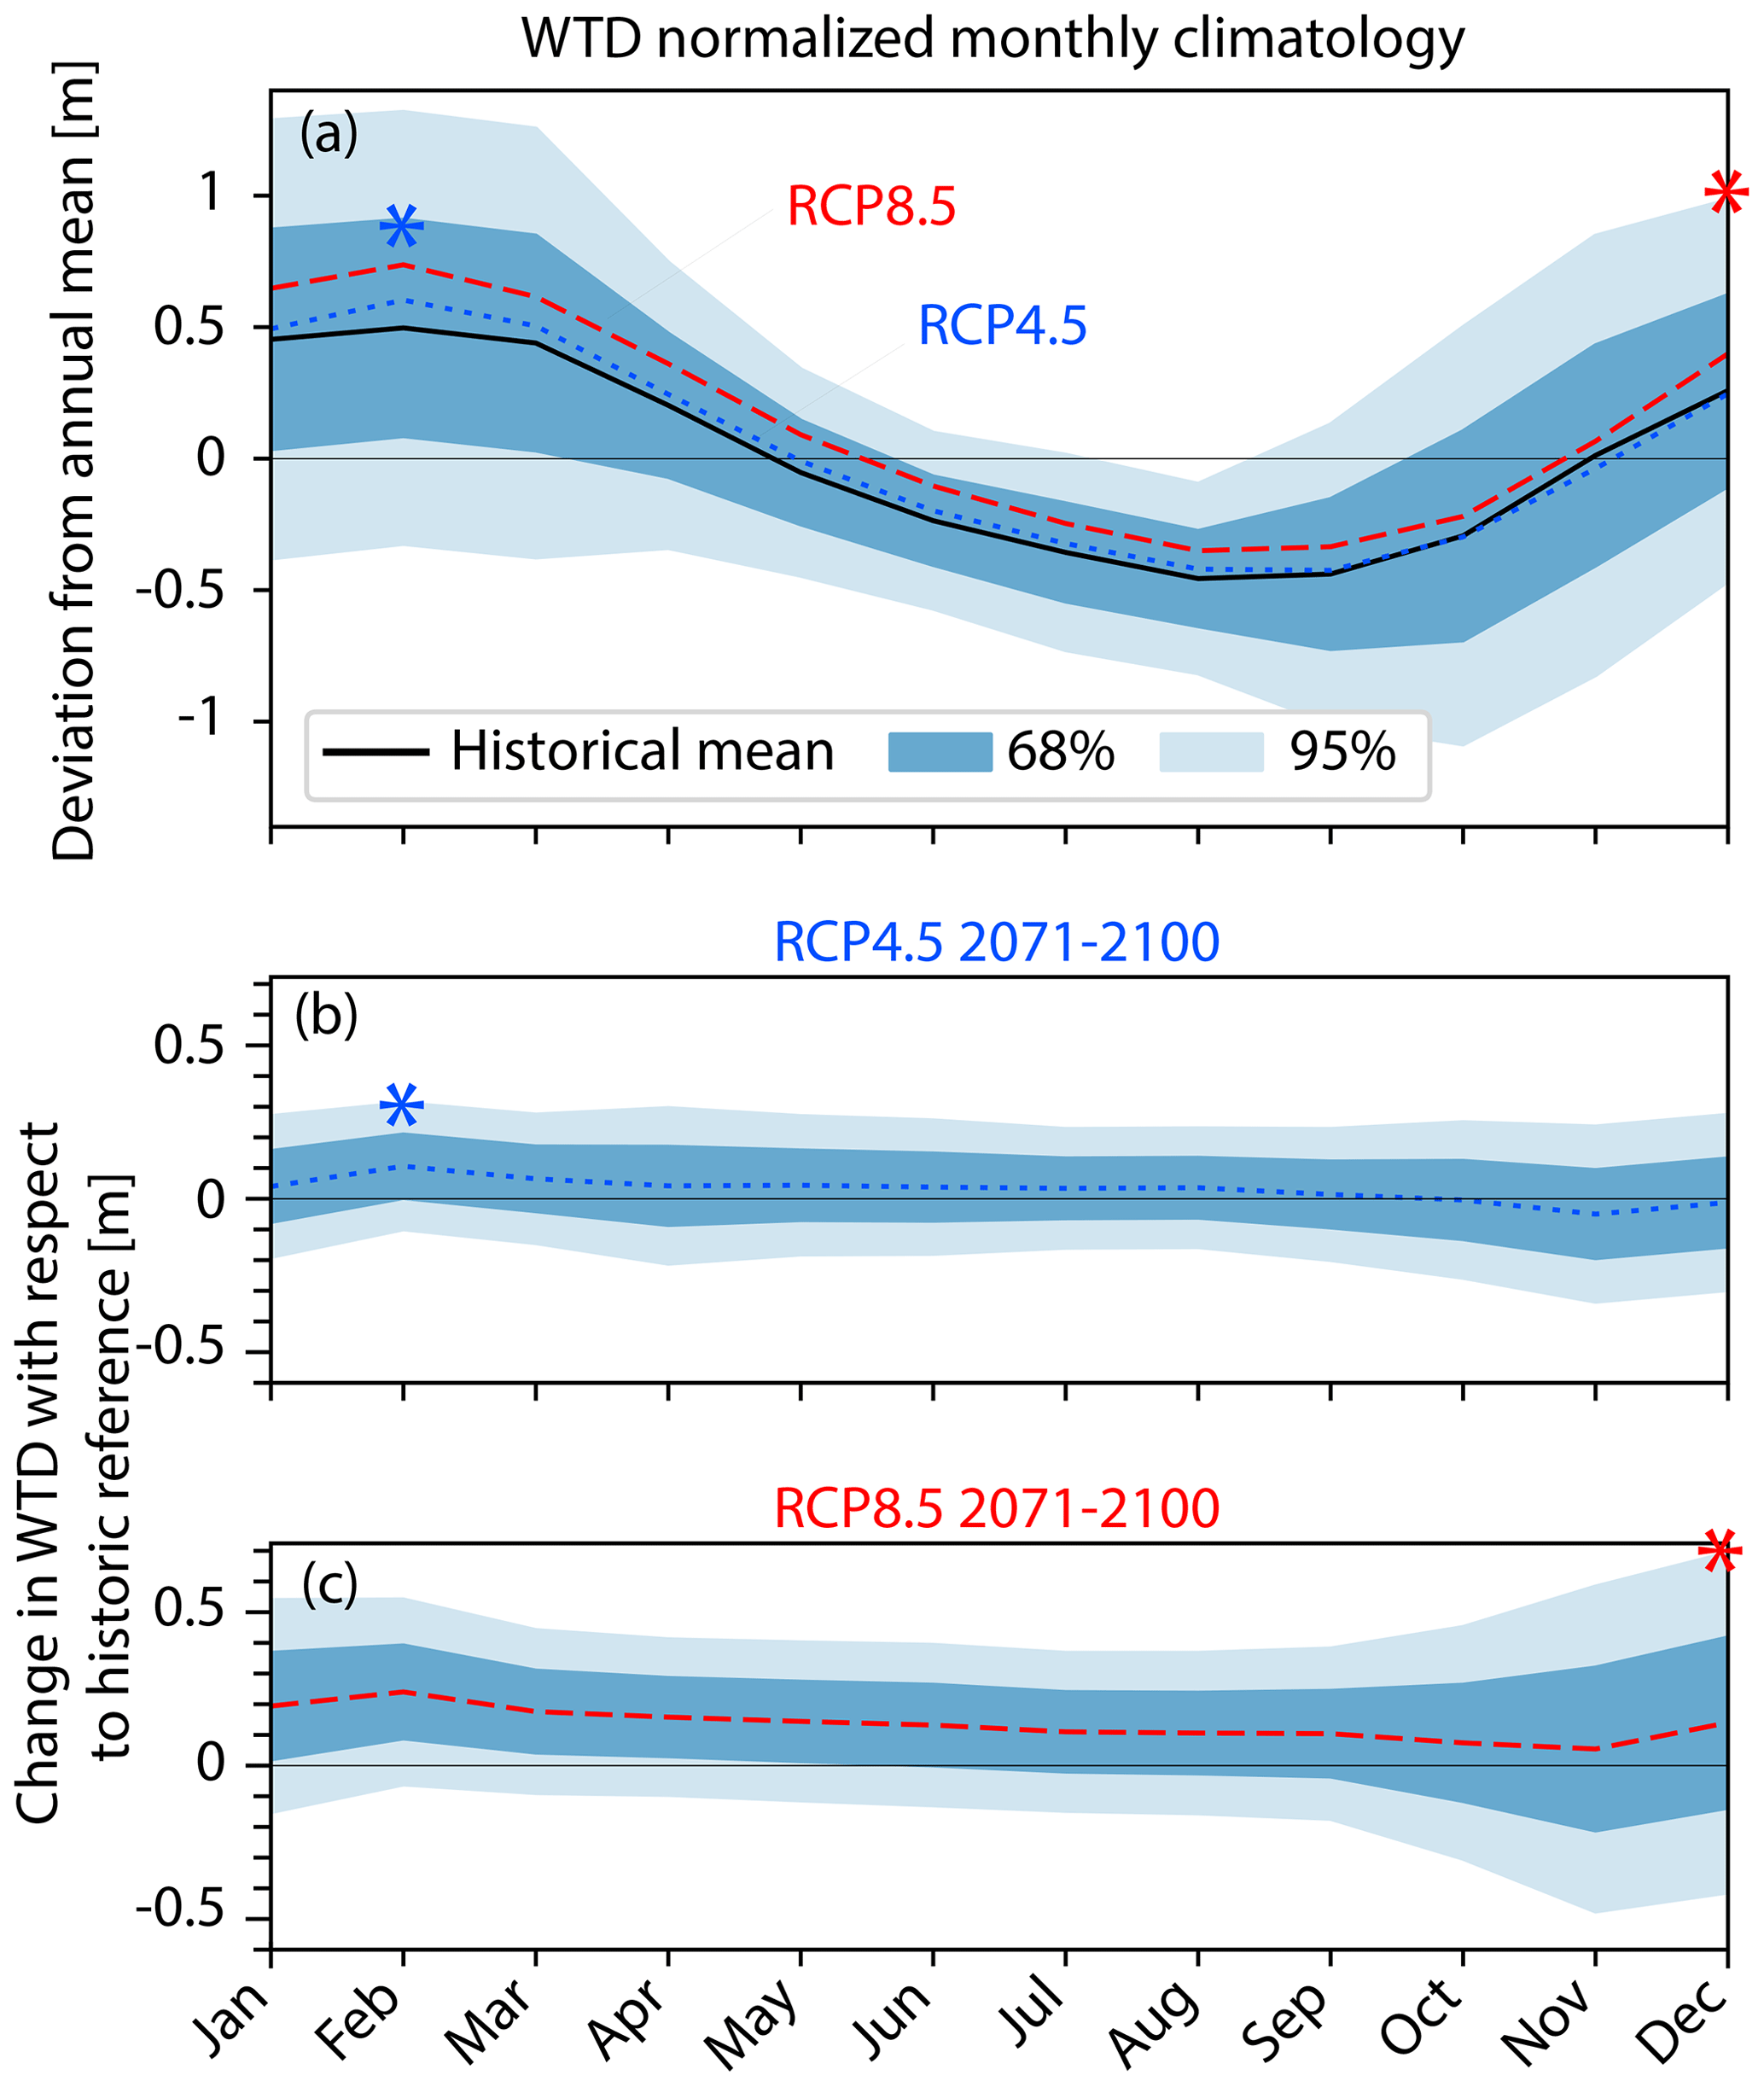
Figure 7Climate change scenarios. (a) Monthly climatology for the historic period of 1990–2019 for the normalized WTD for the 16 selected 100 m grids (Fig. 5). The mean ±68 % and 95 % confidence intervals are shown, which represent the spatial variability across the study site. The red and blue asterisks indicate the maximum WTD values within RCP4.5 and 8.5 within a 95 % confidence interval; this is also shown in panel (b) and panel (c). (b) Simulated change in WTD for the period of 2071–2100 based on RCP4.5 concerning the historic reference. The blue asterisk is the maximum expected WTD of up to 0.3 m, which is mentioned in the text using this RCP scenario. (c) Simulated change in WTD for the period of 2071–2100 based on RCP8.5 concerning the historic reference. The red asterisk is the maximum expected WTD of up to 0.7 m, which is mentioned in the text using this RCP scenario. The confidence intervals in panel (b) and panel (c) represent the variability origination from using an ensemble of climate models in the impact simulation. Dotted and dashed lines in panel (b) and panel (c) represent the ensemble mean and are added to the historic climatology in panel (a).
4.1 WTD seasonality and landslide movement pattern
The observed landslide movement varies across and between seasons but is generally observed in the wet season (winter to early spring), with a relatively shallow WTD (Fig. 6a). There is a clear correlation, for the whole time series examined, between WTD and landslide movement (Fig. 6b), whereas it is not possible to establish a correlation between weekly precipitation and landslide movement. This is because the dynamics in WTD are a result of multiple hydrological processes taking place, such as precipitation, evapotranspiration, recharge and runoff, which are all accounted for in the DK-HIP model (Henriksen et al., 2020). The DK-HIP model is based on a coupled surface–subsurface hydrological model that integrates national databases of borehole information, geophysics, and observations of river discharge and groundwater head. Our correlation analysis (Fig. 6b) shows that these processes need to be considered when studying landslide movement either by on-site monitoring or, as in our case, by modelling and remote sensing. This is at least valid for the temperate climate conditions of Denmark, where rainfall is often evenly distributed over the year (see Fig. 6a) and WTD dynamics are modulated by the seasonality of air temperature and, thereby, potential evapotranspiration. Under different climate conditions, e.g. where precipitation has a more distinct seasonality, the correlation between terrain movement and precipitation may be higher (Handwerger et al., 2022; Cohen-Waeber et al., 2018; Wistuba et al., 2021).
In the relatively dry winter and early spring seasons of 2016/2017 and 2018/2019, where the normalized WTD is generally below +0.5 m, seasonal movement is not observed for the three landslides. In the winter seasons of 2015/2016, 2017/2018 and 2019/2020, the mean normalized WTD exceeded ca. +0.5 m, and landslide movement was observed. We thus estimate that the empirical threshold for landslide movement for the three landslides is at a ca. +0.5 m normalized WTD. A more detailed investigation, preferably with in situ measurements, would be required to properly constrain a critical WTD threshold for seasonal landslide movement.
4.2 Climate projections and landslide evolution
We can quantify an overall increase in mean WTD by 2071–2100 for both RCP4.5 and RCP8.5 (Fig. 7b and c). For RCP8.5, the increase in WTD is predicted to be up to 0.7 m (95 % confidence interval), mainly focussed in the winter season (red asterisk in Fig. 7c). This trend will lead to wetter initial conditions, meaning that less precipitation in an event will be required to achieve critical WTD levels, leading to a decrease in the basal shear strength (Crozier, 2010). This will overall lead to increased seasonal landslide activity.
If 0.7 m of WTD increase is applied to the dry seasons of 2016/2017 and 2018/2019, where normalized WTD in the winter season under current conditions does not exceed +0.5 m, then the landslides would experience a WTD similar to the one evident for the seasons 2015/2016, 2017/2018 and 2019/2020, which are some of the wettest seasons (by precipitation) on record in Denmark to date (Cappelen, 2019).
The wet seasons of 2015/2016, 2017/2018 and 2019/2020, exhibiting a normalized WTD above +0.5 m, would, with an increase in WTD of 0.7 m, experience values that fall beyond the 95 % confidence interval in Fig. 7a (red asterisk). The WTD would, thus, exceed what this area has likely experienced in the modelled historical period of 1990–2019.
The wet seasons of 2015/2016, 2017/2018 and 2019/2020, with a normalized WTD greater than +0.5 m, would result in an elevated WTD of 0.7 m, exceeding the 2 standard deviation interval depicted in Fig. 7a (represented by a red asterisk) and surpassing historical modelled values from the period of 1990–2019.
RCP4.5 predicts up to a 0.3 m increase in normalized WTD in the winters at the end of this century (95 % confidence interval, Fig. 7b). This will potentially elevate the WTD of dry winters, such as 2016/2017 and 2018/2019, up to and above the +0.5 m threshold, making them wetter than the average WTD for the historic period (Fig. 7a). In wet years, such as 2015/2016, 2017/2018 and 2019/2020, the WTD will potentially increase to within the 95 % confidence interval of historic WTD levels (Fig. 7a), also surpassing most modelled historical WTD levels. Thus, the RCP4.5 scenario also points towards increasing landslide activity and the likelihood of thresholds being breached.
The response of the landslides to such a potential breach of thresholds may be similar to the historical case of extreme sliding that occurred in the Svinget landslide in 1981. Here, individual houses moved by 18 m over a year, mainly focused on February and March (>1500 mm per month average over the year), leading to structural damage on roads and buildings. This occurred during, at that time, the wettest winter in Denmark, only to be surpassed in recent decades (Cappelen, 2019). This demonstrates that these landslides can accelerate from slow to moderate velocities, warranting evacuation (sensu Hungr et al., 2014) during extreme events which we show are likely to increase in frequency. This is, however, a hypothetical conclusion without knowing the WTD at the time of this historic landslide activity.
Other dynamic conditioning factors for landslide movement, such as increased coastal erosion caused by higher sea levels and storm wave activity, along with a projected increase in extreme rainfall events (Crozier, 2010), are not included in our present analysis. However, these are also projected to change (DMI, 2023) in a direction that is expected to accelerate landslide movement. Thus, all the main natural dynamic conditioning factors controlling landslide activity are shifting towards increasing landslide activity. In an area with many similar landslides of low activity, such as Denmark (Herrera et al., 2018; Mateos et al., 2020; Svennevig et al., 2020), the net result is likely to be an increase in landslide activity as both an increase in landslide movement and a potential expansion of currently active landslides and the development of new coastal landslides. This will pose new challenges to authorities, landowners and decision-makers, who have little or no experience in dealing with the consequences of landslides.
The impact of climate change on landslides has been investigated in several studies, with varying results. For example, Dixon and Brook (2007) found that the instability threshold of examined landslides could decrease under the medium–high climate change scenario, while Collison et al. (2000) found no significant change in the frequency of large landslides in southeast England due to the projected increased rainfall being matched by increases in evapotranspiration. In contrast, Lin et al. (2022) discovered that the extent of landslide-susceptible terrain and the frequency of landslide-triggering rainfall will increase under climate change in China, but they also noted a spatially heterogeneous pattern. Peres and Cancelliere (2018) found a general tendency for a decrease in landslide hazard due to progressive climate change in a site in Italy. The differing outcomes of these and other studies, along with our present contribution, highlight the site and region-specific impacts of climate change on landslides.
4.3 Limitations and benefits of using free and publicly available data
The empirical threshold of +0.5 m WTD for landslide activation is not universal and can vary depending on site-specific factors, such as topography, geology and climate. However, the workflow outlined in Fig. 2 can be applied widely as larger datasets on dynamic conditioning become available. Our study is based on a limited dataset, and longer periods would increase the robustness of our correlation analysis. InSAR data from the EGMS are freely available for all of Europe, with periodic updates planned to provide longer movement time series for analysis. Furthermore, the WTD model used here is planned to be rerun up to the present and future predictions refined, which will no doubt nuance our current findings.
Although this workflow, based solely on remotely sensed data and modelling data (Fig. 2), is not a substitute for on-site monitoring, it can serve as an initial screening process to inexpensively screen landslides for sensitivities to projected climate change in areas where remote data on dynamic conditioning factors, along with movement data, are available. This information can help prioritize resources for further investigations and monitoring. However, in-depth studies on landslides, e.g. linking WTD and landslide movement, should preferably use local groundwater models calibrated with in situ measurements, as they can better incorporate local hydrogeology. Moreover, the DK-HIP model was calibrated to average WTD conditions, so we recommend that local groundwater models be calibrated to better represent extreme wet conditions, with a focus on the effects of high-intensity precipitation events on WTD, as landslide movement is sensitive to extreme WTD.
When it comes to transferring our approach to other case studies, more limitations may arise. These may be due to variable data availability and quality, namely the availability of high-quality DEMs and sufficient quality data on dynamic preconditioning factors. Site-specific InSAR limitations regarding geometry and LOS issues, vegetation, snow cover and displacement rates exceeding wavelength-associated thresholds should also be considered.
Integrating DoD and InSAR PS datasets has huge potential, and the two methods are highly supplementary. DoD anomalies are confident in areas where there are no natural InSAR reflectors and where LOS displacement rates exceed wavelength-associated thresholds. At Mørkholt, only houses moving by less than ca. 100 mm yr−1 provide good InSAR reflectors. By integrating the two datasets, as demonstrated here, we can infer the PS time series to represent movement in a landslide area outlined by a DoD anomaly. Similarly, deformation rates (LOS for PS and vertical subsidence for DoD) can be compared and discussed against each other. However, it should be stressed that these numbers do not represent the same direction and time resolution.
Seasonal activity in three large slow-moving coastal landslides in Denmark correlates with modelled changes in water table depth (WTD). Seasonal movement begins when the normalized WTD exceeds +0.5 m in the winter during wet years. Weekly precipitation data show no correlation with landslide movement.
WTD is projected to increase by up to 0.7 m towards 2100 CE (RCP8.5, 95 % confidence interval) in this area. These WTD values exceed what this area has experienced in the past decades (1990–2019), and this is likely to result in increasing landslide activity as the landslides equilibrate to the changing conditions. The RCP4.5 scenario also points to increased activity in the landslides.
A historic case from 1981 of accelerated landslide movement resulting in serious structural damage may serve as an example of the kind of extreme event we will see more of in the future as a direct result of an elevated WTD caused by climate change.
Our study highlights the potential of utilizing high-quality, publicly available data to address complex scientific questions and presents a workflow for doing this. The quality and quantity of such data are ever increasing and so is the potential of such an approach.
All data are publicly available from the links in the “Data and methods” section.
KS: conceptualization; data curation; formal synthesis analysis; writing (original draft, review and editing). JK: formal analysis of the DK-HIP model; writing (review and editing). MK: formal analysis of InSAR; writing (review and editing). GL: formal analysis of DoD and correlation analysis; writing (review and editing).
The contact author has declared that none of the authors has any competing interests.
Publisher's note: Copernicus Publications remains neutral with regard to jurisdictional claims made in the text, published maps, institutional affiliations, or any other geographical representation in this paper. While Copernicus Publications makes every effort to include appropriate place names, the final responsibility lies with the authors.
Residents of Mørkholt are thanked for their cooperation. Lars Hansen is thanked for information on the 1981 event and for the use of photos he took during the event (Fig. 4b). Vejle Municipality is thanked for their cooperation during fieldwork and for their aid in communication with local stakeholders. Daniel Ben-Yehoshua and two anonymous reviewers are thanked for their reviews.
Field validation of the remotely sensed observations was conducted within a project financed by Vejle Municipality.
Gregor Luetzenburg has been supported by the European Union's Horizon 2020 Marie Skłodowska-Curie Actions (grant no. 801199).
This paper was edited by Margreth Keiler and reviewed by Daniel Ben-Yehoshua and two anonymous referees.
Abbott, M. B., Bathurst, J. C., Cunge, J. A., O'Connell, P. E., and Rasmussen, J.: An introduction to the European Hydrological System – Systeme Hydrologique Europeen, “SHE”, 1: History and philosophy of a physically-based, distributed modelling system, J. Hydrol., 87, 45–59, 1986.
Alberti, S., Olsen, M. J., Allan, J., and Leshchinsky, B.: Feedback thresholds between coastal retreat and landslide activity, Eng. Geol., 301, 106620, https://doi.org/10.1016/j.enggeo.2022.106620, 2022.
Bennett, G. L., Roering, J. J., Mackey, B. H., Handwerger, A. L., Schmidt, D. A., and Guillod, B. P.: Historic drought puts the brakes on earthflows in Northern California, Geophys. Res. Lett., 43, 5725–5731, https://doi.org/10.1002/2016GL068378, 2016.
Cappelen, J.: Ekstrem nedbør i Danmark – opgørelser og analyser til og med 2018, Danmarks Meteorologiske Institut, Copenhagen, https://www.dmi.dk/fileadmin/Rapporter/2021/DMIRap21-06.pdf (last access: 30 May 2024), 2019.
Coe, J. A.: Regional moisture balance control of landslide motion: Implications for landslide forecasting in a changing climate, Geology, 40, 323–326, https://doi.org/10.1130/G32897.1, 2012.
Coe, J. A., Michael, J. A., Crovelli, R. A., Savage, W. Z., Laprade, W. T., and Nashem, W. D.: Probabilistic assessment of precipitation-triggered landslides using historical records of landslide occurence, Seattle, Washington, Environ. Eng. Geosci., 10, 103–122, https://doi.org/10.2113/10.2.103, 2004.
Cohen-Waeber, J., Bürgmann, R., Chaussard, E., Giannico, C., and Ferretti, A.: Spatiotemporal Patterns of Precipitation-Modulated Landslide Deformation From Independent Component Analysis of InSAR Time Series, Geophys. Res. Lett., 45, 1878–1887, https://doi.org/10.1002/2017GL075950, 2018.
Collison, A., Wade, S., Gri, J., and Dehn, M.: Modelling the impact of predicted climate change on landslide frequency and magnitude in SE England, Eng. Geol., 55, 205–218, 2000.
Copernicus Land Monitoring Service: European Ground Motion Service, https://land.copernicus.eu/en/products/european-ground-motion-service (last access: 29 January 2024), 2024.
Corominas, J., Moya, J., Ledesma, A., Lloret, A., and Gili, J. A.: Prediction of ground displacements and velocities from groundwater level changes at the Vallcebre landslide (Eastern Pyrenees, Spain), Landslides, 2, 83–96, https://doi.org/10.1007/s10346-005-0049-1, 2005.
Costantini, M., Minati, F., Trillo, F., Ferretti, A., Passera, E., Rucci, A., Dehls, J., Larsen, Y., Marinkovic, P., Eineder, M., Brcic, R., Siegmund, R., Kotzerke, P., Kenyeres, A., Costantini, V., Proietti, S., Solari, L., and Andersen, H. S.: EGMS: Europe-Wide Ground Motion Monitoring based on Full Resolution Insar Processing of All Sentinel-1 Acquisitions, in: IGARSS 2022 – 2022 IEEE International Geoscience and Remote Sensing Symposium, 17–22 July 2022, Kuala Lumpur, Malaysia, 5093–5096, https://doi.org/10.1109/IGARSS46834.2022.9884966, 2022.
Crosetto, M., Monserrat, O., Cuevas-González, M., Devanthéry, N., and Crippa, B.: Persistent Scatterer Interferometry: A review, ISPRS J. Photogram. Remote Sens., 115, 78–89, https://doi.org/10.1016/j.isprsjprs.2015.10.011, 2016.
Crosetto, M., Solari, L., Mróz, M., Balasis-Levinsen, J., Casagli, N., Frei, M., Oyen, A., Moldestad, D. A., Bateson, L., Guerrieri, L., Comerci, V., and Andersen, H. S.: The evolution of wide-area DInSAR: From regional and national services to the European ground motion service, Remote Sens., 12, 1–20, https://doi.org/10.3390/RS12122043, 2020.
Crozier, M. J.: Deciphering the effect of climate change on landslide activity: A review, Geomorphology, 124, 260–267, https://doi.org/10.1016/j.geomorph.2010.04.009, 2010.
Dixon, N. and Brook, E.: Impact of predicted climate change on landslide reactivation: Case study of Mam Tor, UK, Landslides, 4, 137–147, https://doi.org/10.1007/s10346-006-0071-y, 2007.
DMI: Klimaatlas, https://www.dmi.dk/klima-atlas/data-i-klimaatlas/ (last access: 30 January 2023), 2023.
DMI: Weather archive Vejle, https://www.dmi.dk/lokationarkiv/show/DK/2621215/Greve?cHash=cd7318c15ef5cd901a6038c352a7d4ed (last access: 25 January 2024), 2024.
Ferretti, A., Prati, C., and Rocca, F.: Permanent Scatterers in SAR Interferometry, IEEE T. Geosc. Remote, 39, 8–20, 2001.
Froude, M. J. and Petley, D. N.: Global fatal landslide occurrence from 2004 to 2016, Nat. Hazards Earth Syst. Sci., 18, 2161–2181, https://doi.org/10.5194/nhess-18-2161-2018, 2018.
Gariano, S. L. and Guzzetti, F.: Landslides in a changing climate, Earth-Sci. Rev., 162, 227–252, https://doi.org/10.1016/j.earscirev.2016.08.011, 2016.
Håkansson, E. and Pedersen, S. A. S.: Geologisk Kort over den Danske Undergrund, Varv, https://tidsskrift.dk/varv/issue/archive (last access: 30 May 2024), 1992.
Handwerger, A. L., Fielding, E. J., Huang, M. H., Bennett, G. L., Liang, C., and Schulz, W. H.: Widespread Initiation, Reactivation, and Acceleration of Landslides in the Northern California Coast Ranges due to Extreme Rainfall, J. Geophys. Res.-Earth, 124, 1782–1797, https://doi.org/10.1029/2019JF005035, 2019.
Handwerger, A. L., Fielding, E. J., Sangha, S. S., and Bekaert, D. P. S.: Landslide Sensitivity and Response to Precipitation Changes in Wet and Dry Climates, Geophys. Res. Lett., 49, 1–12, https://doi.org/10.1029/2022GL099499, 2022.
Heilmann-Clausen, C., Nielsen, O. B., and Gersner, F.: Lithostratigraphy and depositional environments in the Upper Paleocene and Eocene of Denmark, Bull. Geol. Soc. Denmark, 33, 287–323, 1985.
Henriksen, H. J., Troldborg, L., Nyegaard, P., Sonnenborg, T. O., Refsgaard, J. C., and Madsen, B.: Methodology for construction, calibration and validation of a national hydrological model for Denmark, J. Hydrol., 280, 52–71, 2003.
Henriksen, H. J., Kragh, S. J., Gotfredsen, J., Ondracek, M., van Til, M., Jakobsen, A., Schneider, R. J. M., Koch, J., Troldborg, L., Rasmussen, P., Pasten-Zapata, E., and Stisen, S.: Dokumentationsrapport vedr. modelleverancer til Hydrologisk Informations- og Prognosesystem, https://sdfe.dk/media/2920242/hip4plus_dokumentationsrapport31jan2021.pdf (last access: 30 May 2024), 2020.
Hermanns, R. L., Niedermann, S., Villanueva Garcia, A., and Schellenberger, A.: Rock avalanching in the NW argentine andes as a result of complex interactions of lithologic, structural and topographic boundary conditions, climate change and active tectonics, in: Landslides from Massive Rock Slope Failure, edited by: Evans, S. G., Scarawcia Mugnozza, G., Strom, A. L., and Hermanns, R. L., Springer Netherlands, Celano, 497–520, 2006.
Herrera, G., Mateos, R. M., García-Davalillo, J. C., Grandjean, G., Poyiadji, E., Maftei, R., Filipciuc, T. C., Jemec Auflič, M., Jež, J., Podolszki, L., Trigila, A., Iadanza, C., Raetzo, H., Kociu, A., Przyłucka, M., Kułak, M., Sheehy, M., Pellicer, X. M., McKeown, C., Ryan, G., Kopačková, V., Frei, M., Kuhn, D., Hermanns, R. L., Koulermou, N., Smith, C. A., Engdahl, M., Buxó, P., Gonzalez, M., Dashwood, C., Reeves, H., Cigna, F., Lik, P., Pauditš, P., Mikulėnas, V., Demir, V., Raha, M., Quental, L., Sandić, C., Fusi, B., and Jensen, O. A.: Landslide databases in the Geological Surveys of Europe, Landslides, 15, 359–379, https://doi.org/10.1007/s10346-017-0902-z, 2018.
Højberg, A. L., Troldborg, L., Stisen, S., Christensen, B. B., and Henriksen, H. J.: Stakeholder driven update and improvement of a national water resources model, Environ. Model. Softw., 40, 202–213, 2013.
Hungr, O., Leroueil, S., and Picarelli, L.: The Varnes classification of landslide types, an update, Landslides, 11, 167–194, https://doi.org/10.1007/s10346-013-0436-y, 2014.
Hydrologisk Informations- og Prognosesystem: https://hip.dataforsyningen.dk/ (last access: 29 January 2024), 2024.
Iverson, R. M.: Landslide triggering by rain infiltration, Water Resour. Res., 36, 1897–1910, https://doi.org/10.1029/2000WR900090, 2000.
Jupiter database drill log: https://data.geus.dk/JupiterWWW/borerapport.jsp?borid=458263 (last access: 13 December 2023), 2023.
Kashyap, R., Pandey, A. C., and Parida, B. R.: Spatio-temporal variability of monsoon precipitation and their effect on precipitation triggered landslides in relation to relief in Himalayas, Spat. Inform. Res., 29, 857–869, https://doi.org/10.1007/s41324-021-00392-8, 2021.
Koch, J., Gotfredsen, J., Schneider, R., Troldborg, L., Stisen, S., and Henriksen, H. J.: High resolution water table modelling of the shallow groundwater using a knowledge-guided gradient boosting decision tree model, Front. Water, 3, 701726, https://doi.org/10.3389/frwa.2021.701726, 2021.
Lin, Q., Steger, S., Pittore, M., Zhang, J., Wang, L., Jiang, T., and Wang, Y.: Evaluation of potential changes in landslide susceptibility and landslide occurrence frequency in China under climate change, Sci. Total Environ., 850, 158049, https://doi.org/10.1016/j.scitotenv.2022.158049, 2022.
Luetzenburg, G., Svennevig, K., Bjørk, A. A., Keiding, M., and Kroon, A.: A national landslide inventory for Denmark, Earth Syst. Sci. Data, 14, 3157–3165, https://doi.org/10.5194/essd-14-3157-2022, 2022.
Luna, L. V. and Korup, O.: Seasonal Landslide Activity Lags Annual Precipitation Pattern in the Pacific Northwest, Geophys. Res. Lett., 49, 1–11, https://doi.org/10.1029/2022gl098506, 2022.
Magnin, F., Josnin, J. Y., Ravanel, L., Pergaud, J., Pohl, B., and Deline, P.: Modelling rock wall permafrost degradation in the Mont Blanc massif from the LIA to the end of the 21st century, The Cryosphere, 11, 1813–1834, https://doi.org/10.5194/tc-11-1813-2017, 2017.
Magnin, F., Etzelmüller, B., Westermann, S., Isaksen, K., Hilger, P., and Hermanns, R. L.: Permafrost distribution in steep rock slopes in Norway: measurements, statistical modelling and implications for geomorphological processes, Earth Surf. Dynam., 7, 1019–1040, https://doi.org/10.5194/esurf-7-1019-2019, 2019.
Malet, J.-P., van Asch, T. W. J., van Beek, R., and Maquaire, O.: Forecasting the behaviour of complex landslides with a spatially distributed hydrological model, Nat. Hazards Earth Syst. Sci., 5, 71–85, https://doi.org/10.5194/nhess-5-71-2005, 2005.
Mateos, R. M., López-Vinielles, J., Poyiadji, E., Tsagkas, D., Sheehy, M., Hadjicharalambous, K., Liscák, P., Podolski, L., Laskowicz, I., Iadanza, C., Gauert, C., Todorović, S., Auflič, M. J., Maftei, R., Hermanns, R. L., Kociu, A., Sandić, C., Mauter, R., Sarro, R., Béjar, M., and Herrera, G.: Integration of landslide hazard into urban planning across Europe, Landsc. Urban Plan., 196, 103740, https://doi.org/10.1016/j.landurbplan.2019.103740, 2020.
Moreiras, S., Lisboa, M. S., and Mastrantonio, L.: The role of snow melting upon landslides in the central Argentinean Andes, Earth Surf. Proc. Land., 37, 1106–1119, https://doi.org/10.1002/esp.3239, 2012.
Nuth, C. and Kääb, A.: Co-registration and bias corrections of satellite elevation data sets for quantifying glacier thickness change, The Cryosphere, 5, 271–290, https://doi.org/10.5194/tc-5-271-2011, 2011.
Pasten-Zapata, E., Sonnenborg, T. O., and Refsgaard, J. C.: Climate change: Sources of uncertainty in precipitation and temperature projections for Denmark, GEUS Bull., 43, e2019430102, https://doi.org/10.34194/GEUSB-201943-01-02, 2019.
Penna, I. M., Magnin, F., Nicolet, P., Etzelmüller, B., Hermanns, R. L., Böhme, M., Kristensen, L., Nöel, F., Bredal, M., and Dehls, J. F.: Permafrost controls the displacement rates of large unstable rock-slopes in subarctic environments, Global Planet. Change, 220, 104017, https://doi.org/10.1016/j.gloplacha.2022.104017, 2023.
Peres, D. J. and Cancelliere, A.: Modeling impacts of climate change on return period of landslide triggering, J. Hydrol., 567, 420–434, https://doi.org/10.1016/j.jhydrol.2018.10.036, 2018.
Pfeiffer, J., Zieher, T., Bremer, M., Wichmann, V., and Rutzinger, M.: Derivation of Three-Dimensional Displacement Vectors from Multi-Temporal Long-Range Terrestrial Laser Scanning at the Reissenschuh Landslide (Tyrol, Austria), Remote Sens., 10, 1688, https://doi.org/10.3390/rs10111688, 2018.
Pollock, W. and Wartman, J.: Human Vulnerability to Landslides, GeoHealth, 4, 1–17, https://doi.org/10.1029/2020GH000287, 2020.
Rasmussen, E. S., Dybkjær, K., and Piasecki, S.: Lithostratigraphy of the Upper Oligocene – Miocene succession of Denmark, Geological Survey of Denmark and Greenland Bulletin, 92 pp., https://doi.org/10.34194/geusb.v22.4733, 2010.
Rosen, P. A., Hensley, S., Joughin, I. R., Li, F. K., Madsen, S. N., Rodriguez, E., and Goldstein, R.: Synthetic aperture radar interferometry, Proc. IEEE, 88, 333–382, https://doi.org/10.1109/5.838084, 2000.
R Project: A language and environment for statistical computing: https://www.r-project.org/ (last access: 30 January 2023), 2023.
Saba, S. B., van der Meijde, M., and van der Werff, H.: Spatiotemporal landslide detection for the 2005 Kashmir earthquake region, Geomorphology, 124, 17–25, https://doi.org/10.1016/j.geomorph.2010.07.026, 2010.
Scaioni, M., Longoni, L., Melillo, V., and Papini, M.: Remote Sensing for Landslide Investigations: An Overview of Recent Achievements and Perspectives, Remote Sens., 6, 9600–9652, https://doi.org/10.3390/rs6109600, 2014.
Scharling, M.: Klimagrid Danmark Nedbør 10×10 km (ver. 2) – Metodebeskrivelse, Danish Meteorological Institute Technical Report, Danish Meteorological Institute, Copenhagen, https://www.dmi.dk/fileadmin/user_upload/Rapporter/TR/1999/tr99-15.pdf (last access: 30 May 2024), 1999.
SDFI: Denmark's Elevation Model, https://eng.sdfi.dk/data/the-danish-elevation-model-dk-dem (last access: 30 May 2024), 2020.
Svennevig, K. and Keiding, M.: En dansk nomenklatur for landskred, Geologisk Tidsskrift, 2020, 19–30, 2020.
Svennevig, K., Luetzenburg, G., Keiding, M. K., Pedersen, S. A. S., Asbjørn, S., and Pedersen, S. A. S.: Preliminary landslide mapping in Denmark indicates an underestimated geohazard, GEUS Bull., 44, 1–6, https://doi.org/10.34194/geusb.v44.5302, 2020.
Svennevig, K., Hermanns, R. L., Keiding, M., Binder, D., Citterio, M., Dahl-Jensen, T., Mertl, S., Sørensen, E. V., and Voss, P. H.: A large frozen debris avalanche entraining warming permafrost ground – the June 2021 Assapaat landslide, West Greenland, Landslides, 19, 2549–2567, https://doi.org/10.1007/s10346-022-01922-7, 2022.
Svennevig, K., Keiding, M., Korsgaard, N. J., Lucas, A., Owen, M., Poulsen, M. D., Priebe, J., Sørensen, E. V., and Morino, C.: Uncovering a 70-year-old permafrost degradation induced disaster in the Arctic, the 1952 Niiortuut landslide-tsunami in central West Greenland, Sci. Total Environ., 859, 160110, https://doi.org/10.1016/j.scitotenv.2022.160110, 2023.
Terzaghi, K.: Mechanism of Landslides, edited by: Paige, S., Geological Society of America, https://doi.org/10.1130/Berkey.1950.83, 1950.
Uhlemann, S., Smith, A., Chambers, J., Dixon, N., Dijkstra, T., Haslam, E., Meldrum, P., Merritt, A., Gunn, D., and Mackay, J.: Assessment of ground-based monitoring techniques applied to landslide investigations, Geomorphology, 253, 438–451, https://doi.org/10.1016/j.geomorph.2015.10.027, 2016.
van Asch, T. W. J. and Buma, J. T.: Modelling groundwater fluctuations and the frequency of movement of a landslide in the Terres Noires region of Barcelonnette (France), Earth Surf. Proc. Land., 22, 131–141, https://doi.org/10.1002/(SICI)1096-9837(199702)22:2<131::AID-ESP679>3.0.CO;2-J, 1997.
van Asch, T. W. J., Buma, J., and Van Beek, L. P. H.: A view on some hydrological triggering systems in landslides, Geomorphology, 30, 25–32, https://doi.org/10.1016/S0169-555X(99)00042-2, 1999.
van Asch, T. W. J., Malet, J. P., and Bogaard, T. A.: The effect of groundwater fluctuations on the velocity pattern of slow-moving landslides, Nat. Hazards Earth Syst. Sci., 9, 739–749, https://doi.org/10.5194/nhess-9-739-2009, 2009.
Van Beek, L. P. H. and Van Asch, T. W. J.: Regional assessment of the effects of land-use change on landslide hazard by means of physically based modelling, Nat. Hazards, 31, 289–304, https://doi.org/10.1023/B:NHAZ.0000020267.39691.39, 2004.
Vitousek, S., Buscombe, D., Vos, K., Barnard, P. L., Ritchie, A. C., and Warrick, J. A.: The future of coastal monitoring through satellite remote sensing, Cambridge Prisms: Coastal Futures, 1, e10, https://doi.org/10.1017/cft.2022.4, 2023.
Wistuba, M., Gorczyca, E., and Malik, I.: Inferring precipitation thresholds of landslide activity from long-term dendrochronological and precipitation data: Case study on the unstable slope at Karpenciny, Poland, Eng. Geol., 294, 106398, https://doi.org/10.1016/j.enggeo.2021.106398, 2021.
Zieher, T., Gallotti, G., Rianna, G., Reder, A., and Pfeiffer, J.: Exploring the effects of climate change on the water balance of a continuously moving deep-seated landslide, Nat. Hazards, 115, 357–387, https://doi.org/10.1007/s11069-022-05558-7, 2023.