the Creative Commons Attribution 4.0 License.
the Creative Commons Attribution 4.0 License.
Integrated sea storm management strategy: the 29 October 2018 event in the Adriatic Sea
Christian Ferrarin
Andrea Valentini
Martin Vodopivec
Dijana Klaric
Giovanni Massaro
Marco Bajo
Francesca De Pascalis
Amedeo Fadini
Michol Ghezzo
Stefano Menegon
Lidia Bressan
Silvia Unguendoli
Anja Fettich
Jure Jerman
Matjaz̆ Ličer
Lidija Fustar
Alvise Papa
Enrico Carraro
Addressing coastal risks related to sea storms requires an integrative approach which combines monitoring stations, forecasting models, early warning systems, and coastal management and planning. Such great effort is sometimes possible only through transnational cooperation, which becomes thus vital to face, effectively and promptly, the marine events which are responsible for damage impacting the environment and citizens' life. Here we present a shared and interoperable system to allow a better exchange of and elaboration on information related to sea storms among countries. The proposed integrated web system (IWS) is a combination of a common data system for sharing ocean observations and forecasts, a multi-model ensemble system, a geoportal, and interactive geo-visualisation tools to make results available to the general public. The multi-model ensemble mean and spread for sea level height and wave characteristics are used to describe three different sea condition scenarios. The IWS is designed to provide sea state information required for issuing coastal risk alerts over the analysed region as well as for being easily integrated into existing local early warning systems. This study describes the application of the developed system to the exceptional storm event of 29 October 2018 that caused severe flooding and damage to coastal infrastructure in the Adriatic Sea. The forecasted ensemble products were successfully compared with in situ observations. The hazards estimated by integrating IWS results in existing early warning systems were confirmed by documented storm impacts along the coast of Slovenia, Emilia-Romagna and the city of Venice. For the investigated event, the most severe simulated scenario results provide a realistic and conservative estimation of the peak storm conditions to be used in coastal risk management.
- Article
(9503 KB) - Full-text XML
- BibTeX
- EndNote
Sea storms represent the main threat in coastal areas. In fact, they can cause a range of potential hazards, such as coastal erosion and inundation, as well as damage to infrastructure and to the important cultural heritage exposed to these phenomena (Chaumillon et al., 2017; Reimann et al., 2018; Vousdoukas et al., 2018a). Along the coast, extreme storms can also significantly affect businesses activities, such as aquaculture, fisheries, tourism and beach facilities. The potential future effects of global climate change emphasise the need for strategies based on an anticipatory approach particularly in coastal areas at immediate and high risk (Hinkel et al., 2014; Vousdoukas et al., 2018b). This is particularly true for coastal wetlands if enough additional accommodation space will not be created through careful nature-based adaptation solutions to coastal management (Schuerch et al., 2018).
Coastal flooding is induced by extreme sea levels, determined by the increase in sea level caused by strong winds and low atmospheric pressure (storm surge), often in combination with high tides (Muis et al., 2016). Under such extreme meteorological conditions, the coast could be also vulnerable to stormy waves with potential damage to infrastructure and erosion. Moreover, when waves reach the coast they interact with the bathymetry and drive an additional increase in water levels through wave set-up (Longuet-Higgins and Steward, 1963), and they travel up and down the beach before being reflected seaward (swash processes). The maximum vertical excursion of wave uprush on a beach or structure above the still water level is called the wave run-up (Sorensen, 1997).
The water levels along the coast can be estimated by numerical models and combined with a digital elevation model (DEM) for forecasting inundation intensity and extent. Several methodologies have been developed and applied at the basin and local scales for estimating hazard maps for coastal flooding (Hinkel et al., 2014; Vousdoukas et al., 2016; Wolff et al., 2016; Ferreira et al., 2017; Rizzi et al., 2017; Armaroli and Duo, 2018). It must be taken into account that meteorological and ocean models provide just an approximation of reality, despite their continuous development and improvements. Moreover, the interactions between atmospheric, oceanic and coastal processes are not fully understood, resulting in large uncertainties in the predictions of coastal flooding, in particular under extreme conditions (Baart et al., 2011; Zou et al., 2013). This is mainly due to the chaotic nature of the atmosphere and the complexity of the air–sea interactions across scales over several orders of magnitude (Schevenhoven and Selten, 2017). Small errors in the initial conditions of a numerical weather prediction model grow rapidly and affect predictability; forecasted atmospheric conditions are then affected by errors (Molteni et al., 2001). However, as stated by Flowerdew et al. (2010), atmospheric forcing is not the only source of uncertainty in storm surge forecasting. Many other sources of uncertainty, like the model numerics, resolution, parameterisation, boundary conditions and initial sea state, contribute non-linearly to the final forecast uncertainty.
Coastal flooding of urban areas, beach erosion, and damage to infrastructure and productive activities can worsen if combined with the absence of an adequate sea storm management strategy with significant related economic costs (Hinkel et al., 2014; Prahl et al., 2018). The difficulty of reacting promptly to extreme events is also connected to the lack of shared data and know-how. Recognising the importance of information sharing for disaster risk reduction and human safety and well-being, the World Meteorological Organization (WMO; https://public.wmo.int/, last access: 20 October 2019) has promoted the standardisation and exchange of observations since 1873. Similarly, the Permanent Service for Mean Sea Level (PSMSL; http://www.psmsl.org/, last access: 20 October 2019) and the Global Sea Level Observing System (GLOSS; http://www.ioc-sealevelmonitoring.org/, last access: 20 October 2019) are responsible for the collection, publication, analysis and interpretation of sea level data from the global network of tide gauges. In the same way, at the European level, the Copernicus Marine Environment Monitoring Service (CMEMS; http://marine.copernicus.eu/, last access: 20 October 2019), the European Marine Observation and Data Network (EMODnet; http://www.emodnet.eu/, last access: 20 October 2019), and the European Global Ocean Observing System (http://eurogoos.eu/, last access: 20 October 2019) aim at sharing information from both satellite and in situ observations as well as state-of-the-art analyses and daily forecasts, which offer an unprecedented capability to observe, understand and anticipate marine environment events.
Despite such international effort on sharing data, as weather, climate and ocean know no national boundaries, the insufficient level of cooperation among neighbouring countries is often a cause of ineffective actions at the local level and missed opportunities to collaborate with other actors to increase overall preparedness for sea storms (Chaumillon et al., 2017).
The problem of sea storms is particularly relevant for the Adriatic Sea, where extreme sea levels are higher than in other parts of the Mediterranean Basin (Marcos et al., 2009) and where several coastal cultural World Heritage sites are located (http://whc.unesco.org/, last access: 20 October 2019) at risk of coastal flooding and erosion (Prahl et al., 2018; Reimann et al., 2018). This study presents the management approach for sea storm hazards initiated as part of the I-STORMS (Integrated Sea sTORm Management Strategies) project for the coastline of the Adriatic–Ionian macro-region (https://istorms.adrioninterreg.eu/, last access: 20 October 2019). This paper describes a joint strategy for safeguarding the coast from sea storm emergencies by sharing knowledge, data and forecasts among involved countries and improving their capacities in terms of early warning and management procedures. This study focuses on the recent exceptional storm event of 29 October 2018, which is taken here as a pilot study for applying and testing the developed approach.
Study area
The Adriatic and Ionian seas are part of the Mediterranean Sea positioned between the eastern coastline of Italy, countries of the Balkan Peninsula (from Slovenia to the south through Croatia, Bosnia and Herzegovina, Montenegro and to Albania) and Greece. The Adriatic Sea is an 800 km long, 150 km wide elongated semi-enclosed basin interacting with the Ionian Sea through the Otranto Strait in the southern part (Fig. 1). The shallow northern Adriatic Sea is the Mediterranean sub-basin where storm surges reach higher values (Marcos et al., 2009), mainly triggered by a strong south-easterly moist and warm wind, called sirocco. For this reason, in this area storm surges and waves have been deeply investigated in the past (Orlić et al., 1992; Bajo and Umgiesser, 2010; Cavaleri et al., 2010; Lionello et al., 2012; Medugorac et al., 2015; Ferrarin et al., 2017; Pomaro et al., 2017; Vilibić et al., 2017; Bajo et al., 2019; Ferrarin et al., 2019). Tidal dynamics are particularly evident in the northern Adriatic Sea, where the most energetic tidal constituents, the semi-diurnal M2 and the diurnal K1, reach amplitudes of 27 and 18 cm, respectively (Ferrarin et al., 2017).
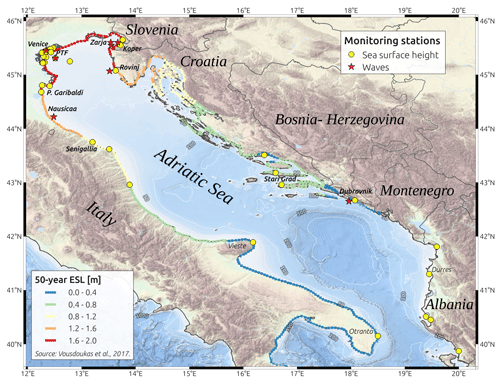
Figure 1Bathymetry of the Adriatic Sea, with monitoring stations for sea surface height (yellow dots) and waves (red stars). The 50-year extreme sea levels (ESLs) from Vousdoukas et al. (2017) are also reported. Background: EMODnet bathymetry (EMODnet Bathymetry Consortium, 2018).
The weather in the Adriatic area is strongly influenced by local orography and small-scale processes (Pasarić et al., 2009). The use of high-resolution meteorological models is essential to capture the temporal and spatial inhomogeneity of north-easterly bora winds, characterised by topographically controlled high-speed wind jets along the eastern shore (Signell et al., 2005; Davolio et al., 2015). The same holds for sirocco: global and regional numerical models have been shown to consistently underestimate its speed due to the fact that orography, and hence the channelling of the air flow, is not well represented at typical model resolution (Cavaleri and Bertotti, 2004). Long-term analyses of general wind conditions over the Adriatic basin further indicate a trend of reduction of the intensity of wind events – mostly due to bora (Pirazzoli and Tomasin, 2003) – and a general increase in terms of frequency, mostly associated with the increasing storminess of sirocco (Pomaro et al., 2017).
The eastern and western coasts of the Adriatic Sea greatly differ in appearance and are therefore differently impacted by sea storms. The western coast is largely sedimentary, with mild sloping and sandy beaches, while the eastern coast is composed of many islands and headlands and is generally high and rocky. Due to its alluvial origin, natural subsidence occurs in the north-western Adriatic Sea because of compaction of fine-grained deposits (Carbognin and Tosi, 2002), which is worsened by the human exploitation of underground water and gas in some areas. Several shallow coastal transitional water bodies are present along the Italian coastline; the main ones are the lagoon of Marano–Grado, the lagoon of Venice, the system of lagoons of the Po delta, the lagoon of Lesina and the lagoon of Varano (Umgiesser et al., 2014).
Extreme sea levels cause the flooding of several coastal cities on both sides of the Adriatic Sea (Lionello et al., 2012; Medugorac et al., 2015), especially when the storm is associated with spring tides (Bajo et al., 2017). Part of the western coast is below sea level, and therefore it is also very vulnerable to such hazards (Lionello et al., 2012). These coastal zones are also strongly impacted by north-easterly storms with severe morphological impacts on natural sectors and damage to structures along urbanised zones (Armaroli et al., 2012; Harley et al., 2016). Conversely, recurrent meteotsunami events occur on the eastern side of the Adriatic Sea, and particularly on the Croatian coast and islands, causing flooding and damage in some harbours (Orlić, 2015). According to Rizzi et al. (2017) and Satta et al. (2017), the northern Adriatic coastline, due to its low elevation, will be one of the regions in the Mediterranean area most exposed – in terms of coastal risk for flooding and erosion – to future climate change.
In order to address the territorial challenges related to sea storms' effect on the coastal areas, we developed a shared and interoperable system (integrated web system – IWS) to allow a better exchange of information at a basin scale. Therefore, available resources can be accessed simultaneously in an aggregated and standard way. IWS was designed to specifically store, visualise and share the following category of geospatial and informative contents:
- a.
historical and real-time (or near-real-time) time series of observations from fixed-point sensor networks;
- b.
outputs from existing operational forecast models;
- c.
localisation and description of coastal sea storm events that have damaged the environment, sociocultural and economic assets;
- d.
bi-dimensional geospatial layers to provide georeferenced representations of the study area, with such layers being organised into thematic categories (e.g. terrestrial and maritime boundaries, ports, shorelines, morphology and bathymetry, cultural heritage, and coastal defence work);
- e.
datasets, model outputs and time-series metadata to improve discoverability and proper reuse of the shared resources.
All information on coastal disaster due to sea storm events (historical and more recent) is organised and mapped into geospatial layers which constitute the Sea Storms Atlas. This series can be used to draw the map of risk characterisation of the coast with the aim of identifying the most vulnerable areas and supporting the planning of coastal area use and development (Depellegrin et al., 2017).
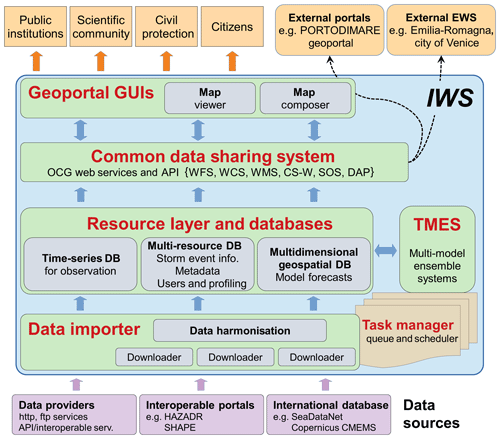
The IWS architecture design follows a resource-centred and service-oriented approach as described in Yang et al. (2007) and Longueville (2010). Following the so-called service-oriented geoportal architecture, the IWS includes three main layers:
-
The resource layer corresponds to the physical storage of the structured information in databases or files.
-
The access layer includes all code and software designed to provide access to the resources in the appropriate format.
-
The graphical user interface (GUI) is the client-side component of the geoportal architecture; the role of GUIs is not limited to the rendering of a given set of resources but also includes the aggregation of relevant resources through lightweight and loosely coupled JavaScript code. In other words, the GUI is not only a presentation layer but also creates a mash-up of relevant resources.
The IWS overall architecture is described in Fig. 2. Furthermore, the schema highlights the user typologies served by the IWS and the interactions and connections with the data sources and with external portals and early warning systems. The IWS is structured into the following six main components.
-
The data importer for data ingestion, harmonisation and preparation, and deposit of the datasets in the storage facilities of the resource layer. For this purpose, we implemented the use of data servers (e.g. THREDDS and Hyrax), with the advantage that such web systems are open source and already implement services like DAP (Data Access Protocol), WCS (Web Coverage Service), WMS (Web Map Service) and SOS (Sensor Observation Service).
-
The resource layer for storing the datasets, metadata, model forecasts, resources and all the necessary information. It consists of a combination of different storage solutions in order to support the several heterogeneous data models and formats shared and all the information needed to achieve a fully operational infrastructure (e.g. metadata, catalogue information, and user accounts and profiles).
-
The transnational multi-model ensemble system (TMES) for combining the results from existing operational forecasting systems (described in Sect. 2.2). TMES outputs are also stored in the resource layer.
-
The task manager middleware for orchestrating the communication with IWS components (e.g. data importer and TMES) in order to launch the process (e.g. download the data from the partners' node), monitor the execution status and concatenate multiple tasks in a single processing pipeline. The task manager middleware supports a time-based job scheduler, a synchronous–asynchronous task queue system and a message broker system.
-
The common data sharing system (CDSS; access layer) for publishing the API and the web services to interact (e.g. search, visualise, download and manage) with the informative resources through standardised interfaces (e.g OGC-Web service and web API).
-
The Geoportal (graphical user interface) for implementing the end-user interfaces and tools to search, visualise, explore and analyse informative resources. The map viewer and composer is an interactive and dedicated GUI for creating, managing and sharing multi-layered maps and for navigating and querying them.
IWS implementation follows a full-fledged free and open-source software (FOSS) approach in order to foster transparency, transferability and durability of the system and to be in accord with the open-source software strategy of the European Commission (European Commission, 2016). IWS provides spatial data infrastructure functionalities for accessing geospatial layers and forecast model outputs through OGC (Open Geospatial Consortium; http://www.opengeospatial.org/, last access: 20 October 2019) interoperable services. Such an approach is widely accepted and implemented at the European (INSPIRE directive – European Commission, 2007; EuroGEOSS initiative – Vaccari et al., 2012) and global level (GEOSS – Global Earth Observation System of Systems) to facilitate intergovernmental and inter-agency data exchange and harmonisation (Maguire and Longley, 2005). Incorporating the THREDDS data server, IWS provides access to stored resources also through OPeNDAP and netCDF standard services and formats. These standards are all products of the scientific communities in oceanography, meteorology and climate sciences and are designed to specifically meet their needs (Hankin et al., 2010), providing coherent access to a large collection of real-time and archived datasets from a variety of environmental data sources at a number of distributed server sites (Unidata, 2019).
2.1 The monitoring networks
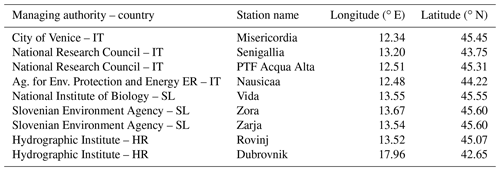
A joint asset which could be exploited through fruitful cooperation is the presence in the whole Adriatic–Ionian coastal territories of large networks of sensors and stations. In the Adriatic region, we mapped 35 tide gauges (9 inside the lagoon of Venice) and nine wave stations, with the highest concentration in the northern Adriatic Sea. The location of all reported monitoring stations is illustrated in Fig. 1, and their general characteristics are summarised in Tables A1 and A2 for sea level and wave, respectively. The stations' lists are not exhaustive, since there are other monitoring stations active in the area, the data of which were not available at the time of writing this document.
In several cases, the stations are also equipped with sensors for monitoring meteorological (wind speed and direction, sea surface pressure, air temperature, relative humidity, and precipitation) or oceanographic parameters (seawater temperature, salinity, and current speed and direction).
2.2 The forecasting systems
A multi-model ensemble was developed to combine the outcomes of existing ocean and wave forecasting systems, helping with improving the forecast accuracy and reliability on one hand and by adding indications on the forecast uncertainty on the other hand. The error of multi-model ensemble products should be the lowest on average compared to those of the ensemble members (Golbeck et al., 2015). According to Di Liberto et al. (2011), operational forecasts benefit from the combination of different ocean models by considering different physical parameterisations, numerical schemes, model resolutions and forcings.
Several operational ocean forecasting models are currently available for the Adriatic–Ionian region. Here we combined 17 forecasting systems, with 10 predicting sea level height (either storm surge or total water level) and 9 predicting wave characteristics. The general characteristics of the forecasting systems are summarised in Tables 1 and 2, respectively, for sea level and wave. MED-Currents and MED-Waves forecasts were retrieved from CMEMS (http://marine.copernicus.eu/). We would like to point out that there are other operational systems active in the area (e.g. the pan-European Storm Surge Forecasting System; Fernández-Montblanc et al., 2019), the results of which were not available at the time of writing this document.
Table 1Details of the sea level forecasting systems used in the TMES. Key references are reported at the bottom of the table.

1 Bajo and Umgiesser (2010). 2 Ferrarin et al. (2013). 3 Ferrarin et al. (2019). 4 Russo et al. (2013). 5 Bressan et al. (2017). 6 Mariani et al. (2015). 7 Ličer et al. (2016). 8 Tonani et al. (2009). 9 Retrieved from CMEMS: http://marine.copernicus.eu/.
Table 2Details of the wave forecasting systems used in the TMES. Key references are reported at the bottom of the table.

1 Ferrarin et al. (2013). 2 Bertotti et al. (2013). 3 Bertotti et al. (2011). 4 Valentini et al. (2007). 5 Mariani et al. (2015). 6 Dutour Sikirić et al. (2018). 7 Zacharioudaki et al. (2015).
8 Retrieved from CMEMS: http://marine.copernicus.eu/.
The different operational models are forced at the surface boundary by several meteorological models (ECMWF, BOLAM, MOLOCH, COSMO, WFR and ALADIN) with a horizontal resolution ranging from 55 to 1.25 km. The length of the ocean forecast is mostly related to the length of the meteorological forecast and varies from 3 to 10 d. There is large variability in the model's set-up in terms of spatial resolution, temporal frequency, spatial domain (Mediterranean Sea, Adriatic Sea and northern Adriatic Sea), grid arrangement (e.g. structured or unstructured) and data format (netCDF and GRIB). Three of the considered systems (Kassandra, MED-Currents and Adriac) account for the current–wave coupling, and two forecasting systems perform data assimilation of tide gauge observations in the operational chain (SIMMb and SIMMe).
TMES is implemented as an internal processing engine which interacts directly with the resource layer to access the datasets (e.g. time series and forecasts) and to deposit the processing results (e.g. ensemble model result, report and statistics). Such outputs are available to the end users and external portal through the common data sharing system and the geoportal web interfaces.
All numerical model results are interpolated, through a distance-weighted average remapping of the nearest neighbours, on a common regular latitude–longitude grid covering the Adriatic–Ionian macro-region with a resolution of 0.02∘. For the purpose of the coastal flooding hazard, the total sea level height must be forecasted. Therefore, the astronomical tide level values obtained by a specific SHYFEM application over the Mediterranean Sea (Ferrarin et al., 2018) are added to the residual sea level simulated by the operational systems not accounting for the tide (SHYMED, ISSOS, SIMMb, SIMMe and MFS). These obtained sea level heights simulated by the different models are all referred to the geoid. The spread among the operational simulations is expected to represent a measure of the uncertainty of prediction and should be linked to the forecast error so that cases with the largest spread are those with the highest uncertainty and where a large error of the ensemble mean (and also of the deterministic forecast) is more likely (Mel and Lionello, 2014a). TMES produces results in terms of the ensemble mean and standard deviation, accounting for a measure of the forecast uncertainty (Flowerdew et al., 2010).
2.3 Storm impact assessment and early warning systems
The vulnerability to sea storms of a particular segment of coast depends on a wide number of variables not only related to the magnitude of the storm but also including the land characteristics and the social and economic activities that distinguish that area. In order to draw a map showing the coastal areas affected by stormy conditions along the Adriatic–Ionian region, the coast is subdivided into segments of variable length in function of morphology, human settlements and administrative boundaries. The coastal assessment units were selected according to the Mediterranean coastal database (MCD) developed by Wolff et al. (2018). The MCD segments have an average length of 4.5 km. For each of these units, the database provides information on the characteristics of the natural and socio-economic subsystems, such as vertical land movement, coastal slope, coastal material, and the number of people exposed to sea level rise and to extreme sea levels.
At each location, three sea condition scenarios are computed considering the mean and standard deviation of predicted sea level and wave ensembles:
-
MIN: ensemble mean − ensemble SD;
-
MEAN: ensemble mean;
-
MAX: ensemble mean + ensemble SD.
Over the whole Adriatic–Ionian coastal region, the nearshore forecasts provided by the TMES were combined with the coastal characteristics (coast material and slope) provided by the MCD database for computing the total water level (TWL). For the coastal segments characterised by sandy beaches, the TWL was computed by combining the sea level height, wave set-up and wave run-up according to Stockdon's formula (R2, the 2 % exceedance level of run-up maxima; Stockdon et al., 2006). For gravel beaches and rocky cliffs, other methodologies should be used for estimating wave run-up (Poate et al., 2016; Dodet et al., 2018), but they could not be applied in this study due to the lack of the required detailed coastal information (sediment grain size, type of rocks, and permeability of the structure).
It is well known that the estimation of the total water level is strongly influenced by the local coast typology and morphology and that the MCD segments are sometimes too coarse to represent complex morphologies, especially in confined coastal systems (lagoons) and along the eastern rocky coast. Therefore, in order to provide more reliable and resolute hazard assessment at a very fine coastal scale, the IWS has been designed to provide multi-model forecast products to existing early warning systems, developed in areas were a deep knowledge of the coastal dynamics and high-resolution datasets (topography and bathymetry) are available. In this study, we present three existing local forecasting and early warning systems operative in the Adriatic Sea (Slovenia, the Emilia-Romagna region and the city of Venice), to which IWS provides the information required for issuing coastal risk alerts.
2.3.1 Slovenia
TMES forecasts can be used directly by regional authorities for assessing the hazard of a particular segment of the coast to the storm event according to predefined thresholds. As an example, we report here the IWS-based hazard estimates for the Slovenian coast, which is predominantly rocky and steep (flysch cliffs) and therefore well protected from flooding during storm surges. Important exceptions are the salt pans (Sec̆ovlje and Strunjan) and urban areas such as Piran, Koper and Izola, where lower parts get flooded up to 17 times per year (data for the 1963–2003 period; Kolega, 2006), with consequent damage to private property and cultural heritage. The Slovenian Environment Agency issues a warning when the predicted sea level at Koper exceeds the yellow alert level, which is set at 300 cm (above local datum). This is the value that marks the flooding of the lowest coastal urban areas. Orange and red alert levels are set to 330 and 350 cm, respectively.
2.3.2 Emilia-Romagna
In addition to the evaluation of thresholds for identifying critical storm conditions at sea (Armaroli et al., 2012), since December 2012, the Emilia-Romagna region (northern Italy) has provided daily 3 d forecasts of the coastal storm hazard at eight key sites along the coast where several past sea storms have induced significant morphological change and damage. The Emilia-Romagna coastline is particularly vulnerable to sea storms due to its low-lying nature and high coastal urbanisation (Armaroli and Duo, 2018). During major storm events, the water levels often exceed those of the dune crest and building foundations (Harley et al., 2016). The existing coastal early warning system (Harley et al., 2016) is based on the 1-D cross-shore implementation of the XBeach morphodynamic model (Roelvink et al., 2009), a 2DH (depth-averaged) cross-shore process-based model that solves intra-wave flow and surface elevation variations for waves in intermediate and shallow water depths. The XBeach model is used to forecast wave run-up and total water level during storm events. For each key site, the IWS provides the sea level and wave characteristics for the three above-mentioned sea condition scenarios to the XBeach model. Hence, the developed methodology allows converting the forecast uncertainty on nearshore sea conditions into a coastal flooding hazard range of predictions. Coastal hazard is estimated here in terms of two storm impact indicators:
-
safe corridor width (SCW), a measure of the amount of dry beach available between the dune foot and waterline for safe passage by beach users,
-
building waterline distance (BWD), a measure of the amount of dry beach available between the seaward edge of a building and the model-derived waterline.
2.3.3 City of Venice
The city of Venice is located in the centre of a shallow lagoon and is composed of more than a hundred islands linked by bridges. The elevation of these islands is extremely low, subjecting them to flooding during storm tides (resulting from the combination of storm surge and the astronomical tide), which in turn threatens the unique cultural heritage of this city and affects its everyday life, causing difficulties in transport, the use of roads and internal channels, emergency procedure response, and commercial activities. In the city of Venice, a bulletin of forecasted sea level up to 3 d is emitted three times per day (at 09:00, 13:00 and 17:00 UTC) by the Tide Forecast and Early Warning Center (CPSM). The forecast is based on a combination of statistical and deterministic models as well as an evaluation of the synoptic meteorological conditions (https://www.comune.venezia.it/it/content/centro-previsioni-e-segnalazioni-maree, last access: 20 October 2019).
Since Venice is protected from the sea by barrier islands (separated by three inlets), storm waves do not affect significantly – through set-up and run-up – the sea level height inside the lagoon (Roland et al., 2009). While propagating from the sea to the lagoon through the inlets, the tidal signal is deformed, either damped or amplified, according to a relationship between local flow resistance and inertia and the characteristics of the incoming open-sea signal (Ferrarin et al., 2015). For those reasons, sea level height forecasts are used instead of TWL predictions in the operational system. To propagate the sea level from the inlets to the inner lagoon, nearshore TMES values of sea level height – for each of the above-mentioned three sea condition scenarios – are referred to the local sea level reference datum (Punta della Salute) and used as open-sea boundary conditions in the SHYFEM finite element hydrodynamic model of the lagoon of Venice (Bajo and Umgiesser, 2010; Cavaleri et al., 2019). Such model adequately reproduces the complex geometry and bathymetry of the lagoon of Venice using an unstructured numerical mesh composed of triangular elements of variable form and size (down to a few metres in the tidal channels). Flooding maps of the city floor are produced by imposing the sea level height observed and predicted at Punta della Salute (at intervals of 10 cm) to a centimetre-accurate digital terrain model of the city (http://www.ramses.it/, last access: 20 October 2019).
The municipality plan of procedure in case of high and low tide (City of Venice, 2002) defines the actions several stakeholders (civil protection, public security and rescue forces, transport companies, and public services) adopt in case of a risk of flooding with respect to the specific forecasted sea levels. Depending on the forecasted sea level, particular categories of stakeholders are informed by CPSM and elevated wooden walkways are installed in areas of the city that are prone to flooding. The communication channels for the warning include the website, messages (SMS or social network), e-mails, phone calls, acoustic signals, and direct information (door to door). Moreover, an operating room with forecasters functions 24 h a day at CPSM during the most severe storm tide event.
3.1 Storm description
On 29 October 2018, an exceptional storm hit the central and northern part of Italy with very strong south-easterly winds (called sirocco) over the Adriatic Sea. The basic meteorological situation of the 2018 storm was similar to the 1966 and 1979 ones, although with a weaker pressure gradient over the Adriatic area (Cavaleri et al., 2019). The weather condition was governed by a semi-stationary upper-level trough which was positioned over the western Mediterranean on 28 October and was only slowly moving north-eastward on 29 and 30 October (Fig. 3). The upper-level southerly flow on the eastern side of the trough was very intense due to strong pressure gradients throughout the whole period of the event. The occurrence of the upper-level trough resulted in a formation of a very intense low-level low-pressure system over the Alps and central Mediterranean which was the most prominent surface feature of the event.
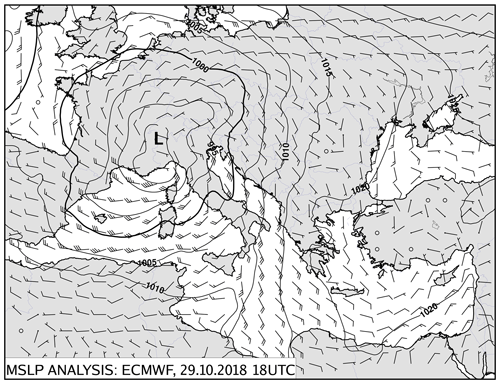
Figure 3ECMWF 10 m wind speed and mean sea level pressure fields over the Mediterranean Sea on 29 October 2018 at 18:00 UTC.
The air mass over the Italian Peninsula and Adriatic was very unstable on 28 and 29 October due to the meridional flow which was bringing moist and warm air from North Africa and central Mediterranean. In this sense, it was a typical Autumn situation when the amount of precipitation can be extreme, especially on the windward side of orographic barriers. The flow at the surface was further intensified by extreme convection over the Apennines and the Alps. The amount of precipitation in northern Italy and wind storms over the Alps and northern Adriatic was rather extreme and not often observed in such intensity.
It is worth mentioning that the sirocco wind started already on 26 October at the most of Adriatic and lasted for almost 4 d without interruption, with the strongest wind in the northern Adriatic on 29 October afternoon, just before the passage of the cold front. Most of this time, the sirocco was well developed over the entire Adriatic basin and even further south in the Ionian Sea. This meant that the fetch was exceptionally long for the locations in the northern Adriatic Sea.
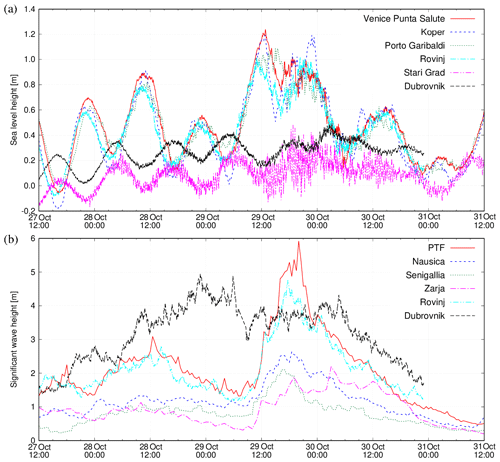
Figure 4Observed sea level height (a) and significant wave heights (b) measured at different locations (see Fig. 1 for reference).
Consequently, the sea level rose in the northern part of the Adriatic Sea – the area most affected by flooding – reaching peak values around 13:00 UTC in Venice, Koper and Rovinj (Fig. 4a). Exceptional sea levels were reached also along the Emilia-Romagna region, with values higher than 1 m for about 5 h, as measured at Porto Garibaldi. It has to be noted that these maximum values were not registered during the storm peak (happening at around 19:00 UTC in this location) due to being out of phase with the astronomical tide. A secondary maximum was recoded in Koper and Rovinj just after the cold front passed and when the wind and waves were decreasing but the tide was rising. Along the central and southern Croatian coast, sea level resulted in being marginally affected by storm surge even if weak meteotsunamis were observed during the frontal passage late in the evening on 29 October.
The very long wind fetch allowed waves to develop over the whole basin. Available wave monitoring stations recorded values of significant wave height (the average height of the highest one-third of all waves measured; SWH) up to 6 m at the Piattaforma Acqua Alta (PTF), 15 km off the shore of the Venetian littoral and up to 4.7 m (8 m of maximum wave height) near the city of Rovinj (Fig. 4b). Along the north-western Italian coastline, due to its mild slope, wave breaking occurs and the measured SWH reaches values of about 2 m during the storm peak (Nausicaa and Senigallia monitoring stations). On the Gulf of Trieste, the highest waves occurred 6 h later (Zarja wave buoy), probably due to the eastward shift of the wind induced by the passage of the cold front. In the south-eastern Adriatic Sea, high wind and wave values were recorded even before the cold front on 28 October. The highest waves recorded in Dubrovnik reached values of about 5 and 9 m for significant and maximum wave height, respectively. Rough sea conditions (SWH >2.5 m) lasted for 57 h, while the very rough sea state (SWH >4 m) was recorded for 9.5 h. According to long-term time series of observations, the 29 October 2018 event reached the records of the second highest sea state ever measured all along the Adriatic coast.
3.2 Storm predictability
Here we present the results of the forecasting system at the hourly time step and for the day of the event only. However, as described by Cavaleri et al. (2019), up to 5 d (6 d for the surge) earlier there were indications of a severe event. Figure 5 shows the TMES results in terms of the ensemble mean and standard deviation for both the sea level height (Fig. 5a and b) and the significant wave height (Fig. 5c and d). The storm surge during the 29 October event affected mostly the northern Adriatic Sea (Fig. 5a), while severe sea conditions occurred over most of the Adriatic Sea, with the higher waves impacting the Croatian coast (Fig. 5c). The ensemble operational system also provides the estimation of the uncertainty associated with the forecast of this event. Uncertainty is generally higher where the sea level and the waves reach the highest values (Fig. 5b and d). The ensemble standard deviation reached maximum values of about 30 cm for the sea level and 1.5 m for the significant wave height.
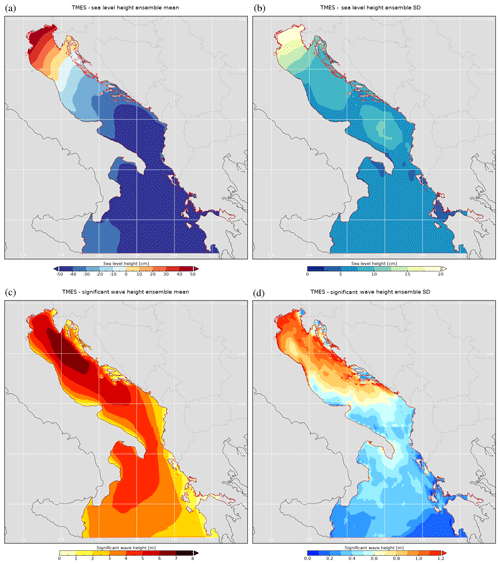
Figure 529 October 2018 results of TMES in terms of the ensemble mean (a, c) and ensemble standard deviation (b, d) for sea level height at 13:00 UTC (a, b) and significant wave height at 19:00 UTC (c, d), respectively.
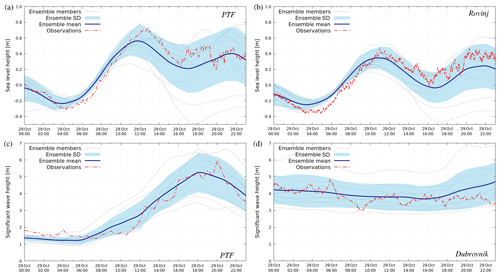
Figure 6TMES sea level height extracted at PTF (a) and Rovinj (b), and significant wave height extracted at PTF (c) and Dubrovnik (d).
Model forecasts could be extracted at any location in the domain to provide a clear representation of sea storm evolution. As an example, we reported in Fig. 6 the values extracted at PTF, Rovinj and Dubrovnik (see Fig. 1 for their location). The comparison with the observations highlights the good performance of the ensemble methodology in reproducing such a strong event. The ensemble mean time-series are smoother than the observations and slightly underestimate the maximum sea level in the northern Adriatic Sea (Figs. 5a and 6b) as well as the peak wave height at 20:00 UTC (5 m of forecasted significant wave height with respect to almost 6 m of observed at PTF; Fig. 6c). However, the observed values are – almost always – within the TMES spread (i.e. the standard deviation of the ensemble members). It is worth noting that the forecast uncertainty increases with the forecast lead time and with the severity of the storm, the maximum of which was reached in the northern Adriatic Sea between 19:00 and 20:00 UTC. In the southern Adriatic Sea (Fig. 6d), the ensemble mean reproduces the observed significant wave height well, which remained between 3 and 5 m for the whole day. For this specific location the spread of the ensemble assumed values between 0.7 and 1.1 m on 29 October.
3.3 Storm impact and hazard assessment on the coast
In order to provide the perception of the physical processes acting along the Adriatic–Ionian coastal areas that are responsible for storm-related hazards, the results of the multi-model ensemble – in terms of sea level and wave conditions – were processed for each coastal assessment unit. Considering the general underestimation of the ensemble means during the peak of the storm, we will mostly focus our basin-wide storm analysis on the MAX sea condition scenario.
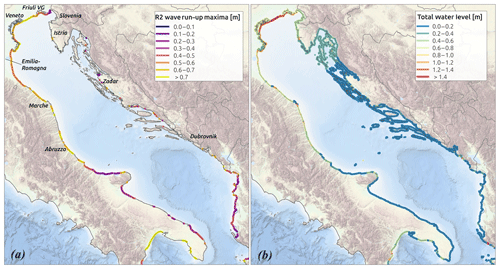
Figure 7Forecasted 2 % exceedance level of run-up maxima (a) and total water level (b) for the MAX sea condition scenario at 19:00 UTC of 29 October 2018. Background: EMODnet bathymetry (EMODnet Bathymetry Consortium, 2018).
The 2 % exceedance level of wave run-up maxima (R2) computed according the Stockdon's formula (Stockdon et al., 2006) and the total water levels forecasted for the 29 October 2018 event (at 19:00 UTC) are reported in Fig. 7 for the MAX scenario. As for sea level height results (Fig. 5a), the maximum values of TWL are found in the northern Adriatic along the Veneto and Friuli Venezia Giulia coasts. Indeed, during the 29 October storm, several coastal lowlands in the northern Adriatic were flooded. At these locations, characterised by gently sloping sandy beaches, the estimated R2 reached maximum values of 0.8 m, accounting therefore for about 50 % of the total water level. The combination of the sea level height and the wave set-up and run-up generated high values of the total water level (TWL >1 m) also at some locations on the along the eastern Adriatic coast and the Marche region. Along the Croatian coast, the extremely high waves and the high sea levels caused inundation and widespread damage to the coastal infrastructure (Istria and Zadar). Moreover, because of the rough sea conditions, there was a disruption of the maritime traffic during 27–30 October, and the ferry service cancelled almost all the scheduled sailings on 29 October, so most of the Croatian islands were cut off from the mainland for more than a day. TWL differences between the MEAN and MAX scenarios (not shown) reached the maximum values of about 0.4 m there, which is higher than the standard deviation of the multi-model ensemble for the sea level height.
As stated in Sect. 2.3, previous studies demonstrated that the wave run-up estimation increases with the beach slope. Therefore, the high wave run-up values found at some coastal segments (e.g. along the Marche and Abruzzo regions) are due not only to the severe wave conditions but also to the fact that they are characterised by a steep coast (slope >0.15). In such reflective conditions, the use of an alongshore-averaged beach slope in practical applications of the run-up parameterisation may result in large run-up error (Stockdon et al., 2006).
In the following paragraphs, we describe the results of the application of the multi-model ensemble to the existing early warning systems and investigate the details of the storm impact and hazard at the three selected locations.
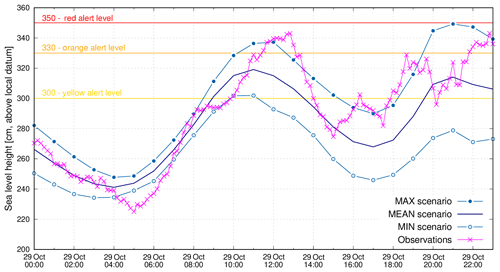
Figure 8Observed and predicted (according to the three sea condition scenarios) sea level height at Koper (Slovenia). The yellow, orange and red lines indicate the adopted thresholds for flooding alerts.
Due to its northward orientation, the Slovenian coast is relatively well protected from the waves generated by southerly winds, as in the case of the 29 October 2018 storm. Indeed, over there and for this event, the wave contribution to the total water level is negligible. According to the 10 min observation data presented in Fig. 8, the sea level in Koper reached peak values well above the orange alert level (343 cm at 12:50 UTC and 341 cm at 23:20 UTC) and lasted for almost 10 h above the yellow alert level. As a consequence, the sea flooded several coastal locations, where the firemen set up anti-flooding barrages. As shown in Fig. 8, the MEAN scenario predicted the exceedance of the yellow flooding alert level but underestimated the observed peak values. A more realistic – even if slightly overestimated – prediction of the flooding hazard for the Slovenian coast is provided by the MAX scenario.
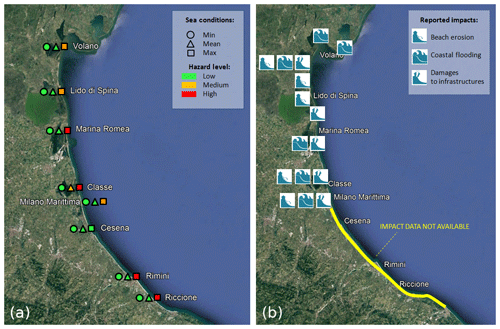
Figure 9Predicted coastal hazard (a) and the documented coastal impacts (b) along the coast of Emilia-Romagna, Italy. Background: image © Google and © 2019 TerraMetrics.
Throughout the Emilia-Romagna region, several coastal sites were affected by flooding and erosion during the 29 October 2018 sea storm due to the combination of the high sea level and energetic wave conditions. The documented coastal impacts are reported in Fig. 9b and include the erosion of the beach and of the winter dunes, coastal flooding, and damage to coastal infrastructure and defence structures. Damage and impacts were reported especially for the northern part of the region, while along the southern coastal area between Cesena and Riccione, real impact data are not available. The hazard index computed for this event using the XBeach model forced with the three (MEAN, MIN and MAX) conditions reveals that the most severe sea condition scenario (MAX scenario) provides an exceedance of the predefined alert thresholds, indicating a high level of coastal risk. An example of the safe corridor width (described in Sect. 2.3.2) calculated for a single cross-shore section, located at Lido di Classe, is reported in Fig. 10. The predicted coastal hazard (Fig. 9a) shows that the most critical scenario is in good agreement with the documented coastal impacts, displayed in the right panel. For this event, by comparing hazard forecasts and observations, the use of IWS provides a good prediction (MAX scenario) of coastal impacts for the major part of the Emilia-Romagna coastal area. Moreover, considering the distance between the MIN and the MAX conditions, IWS provides useful information about the range of the possible impacts.
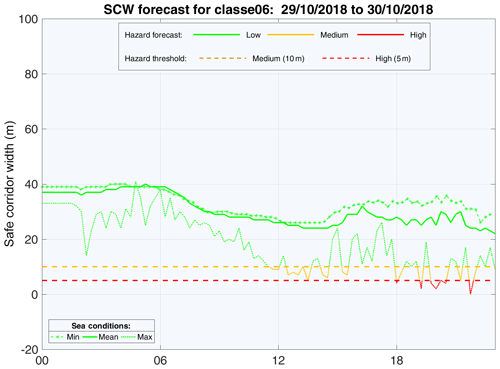
Figure 10Forecasted safe-corridor-width index for the beach profile of classe06 (Lido di Classe, Emilia-Romagna, Italy). The dashed orange and red lines indicate, respectively, the medium and high thresholds for coastal alerts.
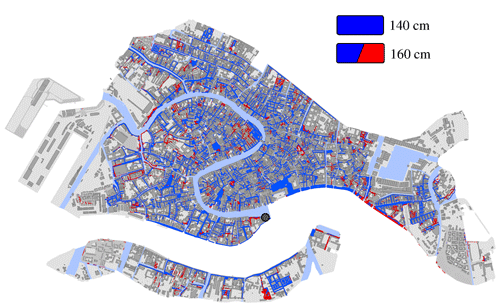
On 29 October 2018, the city of Venice was inundated by the exceptional sea storm. At 13:40 UTC the sea level reached the peak value of 156 cm at Punta della Salute (fourth historical level of flooding in Venice since 1872), which put three-quarters of the pedestrian public area of the historic town under water. Sea levels reaching 120 cm (above local datum), at which point flooding covers 28 % of Venice, lasted for about 14 h. The SHYFEM application to the lagoon of Venice, forced by the open-sea TMES results, forecasted sea level peak values of 142 and 161 cm for the MEAN and MAX scenarios, respectively. Figure 11 shows the corresponding flooding map of the city of Venice according to the predicted peak values (rounded at 140 and 160 cm); 59 % and 77 % of the pedestrian surface is flooded for the two scenarios, respectively. In the first case, the public navigation transport is strongly limited, and only links to the islands are guaranteed; besides this, most of the elevated walkways are unusable. In the second case, the public navigation transport is no longer guaranteed as well as all of the elevated walkways. Moreover, many internal channels are no longer navigable due to insufficient vertical space under some bridges, and hence the emergency rescue response may be strongly delayed. Since the observed peak was 156 cm, the MAX scenario provided a realistic prediction of the flooding hazard for the city of Venice.
To improve knowledge on sea storms events in order to progress the prevention and protection measures integrated into coastal defence plan and procedures, we developed a transnational integrated web system (IWS) for sharing information, observations and forecasts across the Adriatic and Ionian seas.
The IWS allows strengthening the forecasts with useful information of their degree of uncertainty and hence analyse the propagation of uncertainty towards the coastal forecasts. The awareness of the prediction uncertainties and errors has led many operational and research flood forecasting systems around the world to move toward numerical forecasts based on a probabilistic concept: the ensemble technique (Cloke and Pappenberger, 2009). In this context, a probabilistic forecasting system could be based on the perturbation of initial conditions, forcing and parameters of a single model (Flowerdew et al., 2010; Bernier and Thompson, 2015; Salighehdar et al., 2017). Such an approach has already been applied to the Adriatic Sea for improving storm surge forecast and providing a realistic estimate of the prediction uncertainty (Mel and Lionello, 2014a, b, 2016; Bajo et al., 2019). In order to improve sea storm predictions, here we instead implemented, for the Adriatic–Ionian macro-region, a multi-model ensemble system which combines several existing oceanographic and wave forecasting systems. The magnitude of the ensemble spread is a good indicator of how the forecast accuracy varies between different forecasting situations, indicating a decrease in reliability when the spread increases (World Meteorological Organization, 2012). It is not straightforward which averaging weights should be used for the multi-model ensemble forecast, and therefore we used equally weighted members, despite the fact that forecasts which are more precise than others should have more importance in the TMES (Salighehdar et al., 2017; Schevenhoven and Selten, 2017). Here we applied a simple average of the forecasts at every timestamp to compute the ensemble mean, but more sophisticated methods based on weighting function determined by comparison of the single model results with near-real-time observations can be implemented in future (Di Liberto et al., 2011; Salighehdar et al., 2017). Taking advantage of the near-real-time observations acquired by the aggregated monitoring network, the root-mean-square error of the individual forecast will be evaluated and stored for long-term statistics.
Nearshore TMES sea levels and wave characteristics can be directly used in an early warning procedure on the basis of predefined thresholds for morphological change and for coastal erosion and flooding (e.g. Armaroli et al., 2012). TMES predictions are also used to compute the alongshore total water level time series. The estimated run-up values need to be considered with care due to the uncertainty associated with the geomorphological characteristics of the coastal segment units (beach material and slope in particular). Indeed, Bosom and Jiménez (2011) and De Leo et al. (2019) found large variability in hazard intensity and vulnerability along limited coast sectors (20 to 50 km long), even with homogeneous offshore wave conditions. Therefore, the choice of the coastal segment database and its resolution has a substantial effect on the accuracy of the hazard model. The MCD dataset has some limits in reproducing detailed coastal morphologies (i.e. northern Adriatic lagoons and Croatian islands) as well as storm defence structures as breakwaters and seawalls. However, the developed IWS has been designed to be flexible in integrating better defined coastal segment units. If detailed beach geomorphological information is available, process-based hazard indicators (Ferreira et al., 2017) could be used for assessing the potential of a coastal system to be harmed by the impact of a storm (inundation or erosion), comparing the magnitude of the impact (total water level for inundation and beach–shoreline retreat for erosion) with the morphological characteristics of the system (dune or berm height for inundation and beach width for erosion).
The developed system has been tested against observations acquired during a very severe storm that affected the Adriatic Sea on 29 October 2018. TMES forecast results were in agreement – even if slightly underestimated during the storm peak – with the observed sea level height and significant wave height. The predicted ensemble mean and standard deviation were combined for creating three different sea condition scenarios all along the Adriatic and Ionian coastline, allowing to evaluate a range of coastal hazard forecast. Moreover, nearshore forecasts were successfully integrated into existing early warning systems for estimating storm hazard at three locations (Slovenia, the Emilia-Romagna region and the city of Venice). Through this system coupling, the predicted sea conditions were translated into local storm impact indicators and very detailed flooding maps. The underestimation of predicted sea levels and waves during the 29 October storm peak is probably a consequence of a general underestimation of the wind forecasts produced by the operational meteorological models. Cavaleri and Bertotti (2004) provided clear evidence of the wind speed problem over the Adriatic Sea. In particular, for the sea storm of 29 October 2018, Cavaleri et al. (2019) compared the ECMWF model wind with scatterometer data and estimated a 1.11 average enhancement factor.
For the reasons stated above and considering the results presented in this study, the most severe sea condition scenario (MAX = ensemble mean + ensemble standard deviation) can be considered for the investigated area to be a conservative estimation of the peak storm conditions to be used for coastal risk management. Another possible application of TMES outputs could be to use all possible combinations of ensemble mean and standard deviation for the sea level and wave characteristics, providing a large number of sea state combinations. In that way, it would be possible to calculate and estimate the frequency of exceeding predefined thresholds for coastal hazards. This approach is closer to the idea of the probability of threshold exceedance and will be explored in future.
The aggregating approach for collecting and sharing observations is crucial for providing real-time information about the sea state – and its evolution – to be used by several countries for prompt emergency response and to increase the overall preparedness to sea storms. Moreover, by merging data from several stations and sensors, the IWS is an important storage server for any data assimilation system. According to Lionello et al. (2006) and Bajo et al. (2019), the assimilation of tide-gauge data in the Adriatic Sea has a strong positive impact on the forecast performance, lasting several days, despite the underestimation in the atmospheric forcing. The forecast improvement is particularly relevant in the case of consecutive sea storms when storm surge levels are influenced by pre-existing oscillations of the basin (seiches) induced by previous events. It is worth mentioning that in the case of the Adriatic Sea – but there could be many other similar situations – transnational cooperation is crucial for sharing observations acquired along the whole basin in order to provide real-time information on the sea state to be used in a data assimilation system.
Real-time observations and numerical model forecasts required to address environmental management problems such as sea storms are commonly excessively intricate for civil protection and stakeholder use (Magaña et al., 2018). The IWS is equipped with geoportal functionalities and interactive geo-visualisation tools for simplifying searching and accessing geospatial data (including forecast model outputs) and monitoring networks' time series. Such tools help and assist people who want to use IWS concepts, databases and results in their work and support their activities. Moreover, a dedicated website (https://iws.seastorms.eu/, last access: 20 October 2019), designed to foster the data dissemination according to the community-based paradigm and to the open data principles (https://opendatacharter.net/, last access: 20 October 2019), will allow the public data, the forecast results and related statistics to be explored by non-experts over the Internet through the use of shared maps, dashboards, graphics, tables and other interactive geo-visualisation tools.
In conclusion, to improve the capacity to react to sea storms, all relevant actors of the coastal area (public authorities, regional and national authorities in charge of civil protection, meteorological and forecast services, universities and research institutes, cruise ship enterprises, maritime business enterprises, marinas, aquaculture small- and medium-sized enterprises (SMEs), and stakeholders from the touristic sector) should be involved – through the web and social media – in a transnational cooperation strategy to foster the following:
-
knowledge and data exchange for providing real-time information about the basin-wide sea state through the use of standardised formats, protocols and services;
-
coordination of all available ocean forecasting systems in a multi-model ensemble for enhancing the predictability of extreme events and for evaluating the uncertainty of the operational ocean products;
-
integration of observations and numerical models through data assimilation techniques for improving the forecast accuracy;
-
downscaling of open-sea ensemble forecasts to be integrated into site-specific early warning systems managed by local authorities;
-
data and forecasts dissemination to all relevant coastal actors and citizens over the Internet.
Table A1Details of the sea level monitoring stations (yellow dots in Fig. 1).
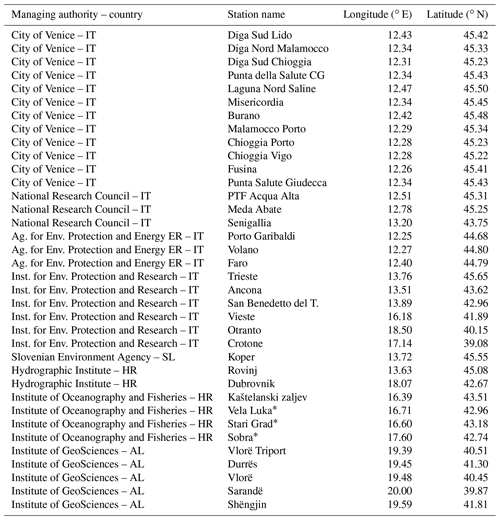
∗ Available through http://www.ioc-sealevelmonitoring.org/.
Table A2Details of the wave monitoring stations (red stars in Fig. 1).
The IWS model is available as an open-source code from https://github.com/CNR-ISMAR/iws (Fadini et al., 2019a). The SHYFEM hydrodynamic model is open source and freely available at https://github.com/SHYFEM-model (last access: 10 January 2020; Umgiesser et al., 2018). The data and forecast results used in this study can be accessed, depending on the specific provider's data policy, upon request to the corresponding author. Monitoring networks' time series and forecast model outputs are operationally available at https://iws.seastorms.eu/ (Fadini et al., 2019b).
CF conceived the idea of the study, with the support of AV, SM and MV. SM and AFa designed the IWS structures. SM, AFa, AV, LB, CF, MB, MV, ML and GM prepared the model results and developed the multi-model ensemble. AFa, CF and SM developed the scripts for computing TWL on the MCD coastal segments. JJ and AFe described the meteorological situation of the 29 October 2018 storm. SU and AV elaborated the TMES results for computing the ER-EWS storm impact indicators for the Emilia-Romagna coast. GM, AP, CF and MB applied the TMES results to the early warning system of the city of Venice. All authors discussed, reviewed and edited the different versions of the paper.
The authors declare that they have no conflict of interest.
This work was supported by the I-STORMS project (Integrated Sea sTORm Management Strategies) funded by the European Union under the Interreg V-B Adriatic–Ionian programme with agreement no. 69 of 9 March 2019. The authors wish to thank Isabella Marangoni, Denise Florean, Anna Zarotti, Alessia Porcu and Silvia Comiati from the city of Venice – European Policies Division – for promoting and supporting the project activities; Fabio Raicich from CNR-ISMAR for providing sea level data for the Trieste tide gauge; Pierluigi Penna from CNR-IRBIM for providing data for the Senigallia monitoring station; and Luigi Cavaleri and Luciana Bertotti from CNR-ISMAR for sharing wave results of the Nettuno and Henetus systems. Wave data of the Nettuno forecasting systems were kindly provided by Centro Nazionale di Meteorologia e Climatologia Aeronautica (CNMCA). We thank Maurizio Ferla, Elisa Coraci and Roberto Inghilesi from ISPRA for providing sea level and wave forecasts of the SIMM systems; Janez Polajnar from the Slovenian Environment Agency for the data on storm impacts on the Slovenian coast; Luisa Perini, Lorenzo Calabrese and Paolo Luciani from the Geological Seismic and Soil Survey of the Emilia-Romagna region for providing the report of impacts occurring along the regional coast during the event; Alessandro Coluccelli and Aniello Russo from the Università Politecnica delle Marche for the support on the AdriaROMS model; and the Croatian Hydrographic Institute in Split for the tide-gauge records originating from Rovinj and Dubrovnik and for wave riders' records originating from buoys near Rovinj and Dubrovnik – Sveti Andrija.
This research has been supported by the European Union under the Interreg V-B Adriatic–Ionian programme (grant no. 69 of 9 March 2019).
This paper was edited by Piero Lionello and reviewed by two anonymous referees.
Armaroli, C. and Duo, E.: Validation of the coastal storm risk assessment framework along the Emilia-Romagna coast, Coast. Eng., 134, 159–167, https://doi.org/10.1016/j.coastaleng.2017.08.014, 2018. a, b
Armaroli, C., Ciavola, P., Perini, L., Calabrese, L., Lorito, S., Valentini, A., and Masina, M.: Critical storm thresholds for significant morphological changes and damage along the Emilia-Romagna coastline, Italy, Geomorphology, 143–144, 34–51, https://doi.org/10.1016/j.geomorph.2011.09.006, 2012. a, b, c
Baart, F., van Gelder, P. H. A. J. M., and van Koningsveld, M.: Confidence in real-time forecasting of morphological storm impacts, J. Coast. Res., SI64, 1835–1839, 2011. a
Bajo, M. and Umgiesser, G.: Storm surge forecast through a combination of dynamic and neural network models, Ocean Model., 33, 1–9, https://doi.org/10.1016/j.ocemod.2009.12.007, 2010. a, b, c
Bajo, M., De Biasio, F., Umgiesser, G., Vignudelli, S., and Zecchetto, S.: Impact of using scatterometer and altimeter data on storm surge forecasting, Ocean Model., 113, 85–94, https://doi.org/10.1016/j.ocemod.2017.03.014, 2017. a
Bajo, M., Medugorac, I., Umgiesser, G., and Orlić, M.: Storm surge and seiche modelling in the Adriatic Sea and the impact of data assimilation, Q. J. Roy. Meteor. Soc., 145, 2070–2084, https://doi.org/10.1002/qj.3544, 2019. a, b, c
Bernier, N. B. and Thompson, K. R.: Deterministic and ensemble storm surge prediction for Atlantic Canada with lead times of hours to ten days, Ocean Model., 86, 114–127, https://doi.org/10.1016/j.ocemod.2014.12.002, 2015. a
Bertotti, L., Canestrelli, P., Cavaleri, L., Pastore, F., and Zampato, L.: The Henetus wave forecast system in the Adriatic Sea, Nat. Hazards Earth Syst. Sci., 11, 2965–2979, https://doi.org/10.5194/nhess-11-2965-2011, 2011. a
Bertotti, L., Cavaleri, L., Loffredo, L., and Torrisi, L.: Nettuno: Analysis of a Wind and Wave Forecast System for the Mediterranean Sea, Mon. Weather Rev., 141, 3130–3141, https://doi.org/10.1175/mwr-d-12-00361.1, 2013. a
Bosom, E. and Jiménez, J. A.: Probabilistic coastal vulnerability assessment to storms at regional scale – application to Catalan beaches (NW Mediterranean), Nat. Hazards Earth Syst. Sci., 11, 475–484, https://doi.org/10.5194/nhess-11-475-2011, 2011. a
Bressan, L., Valentini, A., Paccagnella, T., Montani, A., Marsigli, C., and Tesini, M. S.: Sensitivity of sea-level forecasting to the horizontal resolution and sea surface forcing for different configurations of an oceanographic model of the Adriatic Sea, Adv. Sci. Res., 14, 77–84, https://doi.org/10.5194/asr-14-77-2017, 2017. a
Carbognin, L. and Tosi, L.: Interaction between Climate Changes, Eustacy and Land Subsidence in the North Adriatic Region, Italy, Mar. Ecol., 23, 38–50, https://doi.org/10.1111/j.1439-0485.2002.tb00006.x, 2002. a
Cavaleri, L. and Bertotti, L.: Accuracy of the modelled wind and wave fields in enclosed seas, Tellus A, 56, 167–175, https://doi.org/10.3402/tellusa.v56i2.14398, 2004. a, b
Cavaleri, L., Bertotti, L., Buizza, R., Buzzi, A., Masato, V., Umgiesser, G., and Zampieri, M.: Predictability of extreme meteo-oceanographic events in the Adriatic Sea, Q. J. Roy. Meteor. Soc., 136, 400–413, https://doi.org/10.1002/qj.567, 2010. a
Cavaleri, L., Bajo, M., Barbariol, F., Bastianini, M., Benetazzo, A., Bertotti, L., Chiggiato, J., Davolio, S., Ferrarin, C., Magnusson, L., Papa, A., Pezzutto, P., Pomaro, A., and Umgiesser, G.: The October 29, 2018 storm in Northern Italy – an exceptional event and its modeling, Prog. Oceanogr., 178, 102178, https://doi.org/10.1016/j.pocean.2019.102178, 2019. a, b, c, d
Chaumillon, E., Bertin, X., Fortunato, A., Bajo, M., Schneider, J.-L., Dezileau, L., Walsh, J. P., Michelot, A., Chauveau, E., Créach, A., Hénaff, A., Sauzeau, T., Waeles, B., Gervais, B., Jan, G., Baumann, J., Breilh, J.-F., and Pedreros, R.: Storm-induced marine flooding: lessons from a multidisciplinary approach, Earth-Sci. Rev., 165, 151–184, https://doi.org/10.1016/j.earscirev.2016.12.005, 2017. a, b
City of Venice: Attachment to Municipality Deliberation no. 129 22/07/2002: Piano integrato degli interventi in caso di alta marea e bassa marea, Venice, Italy, 2002. a
Cloke, H. L. and Pappenberger, F.: Ensemble flood forecasting: A review, J. Hydrol., 375, 613–626, https://doi.org/10.1016/j.jhydrol.2009.06.005, 2009. a
Davolio, S., Stocchi, P., Benetazzo, A., Bohm, E., Riminucci, F., Ravaioli, M., Li, X.-M., and Carniel, S.: Exceptional Bora outbreak in winter 2012: Validation and analysis of high-resolution atmospheric model simulations in the northern Adriatic area, Dynam. Atmos. Ocean, 71, 1–20, https://doi.org/10.1016/j.dynatmoce.2015.05.002, 2015. a
De Leo, F., Besio, G., Zolezzi, G., and Bezzi, M.: Coastal vulnerability assessment: through regional to local downscaling of wave characteristics along the Bay of Lalzit (Albania), Nat. Hazards Earth Syst. Sci., 19, 287–298, https://doi.org/10.5194/nhess-19-287-2019, 2019. a
Depellegrin, D., Menegon, S., Farella, G., Ghezzo, M., Gissi, E., Sarretta, A., Venier, C., and Barbanti, A.: Multi-objective spatial tools to inform maritime spatial planning in the Adriatic Sea, Sci. Total Environ., 609, 1627–1639, https://doi.org/10.1016/j.scitotenv.2017.07.264, 2017. a
Di Liberto, T., Colle, B. A., Georgas, N., Blumberg, A. F., and Taylor, A. A.: Verification of a Multimodel Storm Surge Ensemble around New York City and Long Island for the Cool Season, Weather Forecast., 26, 922–939, https://doi.org/10.1175/waf-d-10-05055.1, 2011. a, b
Dodet, G., Leckler, F., Sous, D., Ardhuin, F., Filipot, J., and Suanez, S.: Wave Runup Over Steep Rocky Cliffs, J. Geophys. Res.-Oceans, 123, 7185–7205, https://doi.org/10.1029/2018jc013967, 2018. a
Dutour Sikirić, M., Ivanković, D., Roland, A., Ivatek-Šahdan, S., and Tudor, M.: Operational Wave Modelling in the Adriatic Sea with the Wind Wave Model, Pure Appl. Geophys., 175, 3801–3815, https://doi.org/10.1007/s00024-018-1954-2, 2018. a
EMODnet Bathymetry Consortium: EMODnet Digital Bathymetry (DTM), https://doi.org/10.12770/18ff0d48-b203-4a65-94a9-5fd8b0ec35f6, 2018. a, b
European Commission: Commission of the European Communities, Directive 2007/2/EC of the European Parliament and of the Council of 14 March 2007 Establishing an Infrastructure for Spatial Information in the European Community (INSPIRE), https://inspire.ec.europa.eu/inspire-directive/2 (last access: 20 October 2019), 2007. a
European Commission: Open Source Software Strategy 2014-2017, https://ec.europa.eu/info/departments/informatics/open-source-software-strategy_en (last access: 20 October 2019), 2016. a
Fadini, A., Menegon, S., and Ferrarin, C.: I-STORMS Web System code (IWS), available at: https://github.com/CNR-ISMAR/iws, last access: 20 October 2019a. a
Fadini, A., Menegon, S., and Ferrarin, C.: I-STORMS Web System (IWS), available at: https://iws.seastorms.eu/, last access: 20 October 2019b. a
Fernández-Montblanc, T., Vousdoukas, M. I., Ciavola, P., Voukouvalas, E., Mentaschi, L., Breyiannis, G., Feyen, L., and Salamon, P.: Towards robust pan-European storm surge forecasting, Ocean Model., 133, 129–144, https://doi.org/10.1016/j.ocemod.2018.12.001, 2019. a
Ferrarin, C., Roland, A., Bajo, M., Umgiesser, G., Cucco, A., Davolio, S., Buzzi, A., Malguzzi, P., and Drofa, O.: Tide-surge-wave modelling and forecasting in the Mediterranean Sea with focus on the Italian coast, Ocean Model., 61, 38–48, https://doi.org/10.1016/j.ocemod.2012.10.003, 2013. a, b
Ferrarin, C., Tomasin, A., Bajo, M., Petrizzo, A., and Umgiesser, G.: Tidal changes in a heavily modified coastal wetland, Cont. Shelf Res., 101, 22–33, https://doi.org/10.1016/j.csr.2015.04.002, 2015. a
Ferrarin, C., Maicu, F., and Umgiesser, G.: The effect of lagoons on Adriatic Sea tidal dynamics, Ocean Model., 119, 57–71, https://doi.org/10.1016/j.ocemod.2017.09.009, 2017. a, b
Ferrarin, C., Bellafiore, D., Sannino, G., Bajo, M., and Umgiesser, G.: Tidal dynamics in the inter-connected Mediterranean, Marmara, Black and Azov seas, Prog. Oceanogr., 161, 102–115, https://doi.org/10.1016/j.pocean.2018.02.006, 2018. a
Ferrarin, C., Davolio, S., Bellafiore, D., Ghezzo, M., Maicu, F., Drofa, O., Umgiesser, G., Bajo, M., De Pascalis, F., Marguzzi, P., Zaggia, L., Lorenzetti, G., Manfè, G., and Mc Kiver, W.: Cross-scale operational oceanography in the Adriatic Sea, J. Oper. Oceanogr., 12, 86–103, https://doi.org/10.1080/1755876X.2019.1576275, 2019. a, b
Ferreira, O., Plomaritis, T. A., and Costas, S.: Process-based indicators to assess storm induced coastal hazards, Earth-Sci. Rev., 173, 159–167, https://doi.org/10.1016/j.earscirev.2017.07.010, 2017. a, b
Flowerdew, J., Horsburgh, K., Wilson, C., and Mylne, K.: Development and evaluation of an ensemble forecasting system for coastal storm surges, Q. J. Roy. Meteor. Soc., 136, 1444–1456, https://doi.org/10.1002/qj.648, 2010. a, b, c
Golbeck, I., Li, X., Janssen, F., Brüning, T., Nielsen, J. W., Huess, V., Söderkvist, J., Büchmann, B., Siiriä, S.-M., Vähä-Piikkiö, O., Hackett, B., Kristensen, N. M., Engedahl, H., Blockley, E., Sellar, A., Lagemaa, P., Ozer, J., Legrand, S., Ljungemyr, P., and Axell, L.: Uncertainty estimation for operational ocean forecast products – a multi-model ensemble for the North Sea and the Baltic Sea, Ocean Dynam., 65, 1603–1631, https://doi.org/10.1007/s10236-015-0897-8, 2015. a
Hankin, S., Blower, J., Carval, T., Casey, K., Donlon, C., Lauret, O., Loubrieu, T., Srinivasan, A., Trinanes, J., Godøy, Ø., Mendelssohn, R., Signell, R., de La Beaujardiere, J., Cornillon, P., Blanc, F., Rew, R., and Harlan, J.: NetCDFf-CF-OPeNDAP: Standards for ocean data interoperability and object lessons for community data standards processes, in: Proceedings of OceanObs'09: Sustained Ocean Observations and Information for Society, edited by: Hall, J., Harrison, D., and Stammer, D., vol. 2, ESA Publication, https://doi.org/10.5270/OceanObs09.cwp.41, 2010. a
Harley, M. D., Valentini, A., Armaroli, C., Perini, L., Calabrese, L., and Ciavola, P.: Can an early-warning system help minimize the impacts of coastal storms? A case study of the 2012 Halloween storm, northern Italy, Nat. Hazards Earth Syst. Sci., 16, 209–222, https://doi.org/10.5194/nhess-16-209-2016, 2016. a, b, c
Hinkel, J., Lincke, D., Vafeidis, A. T., Perrette, M., Nicholls, R. J., Tol, R. S. J., Marzeion, B., Fettweis, X., Ionescu, C., and Levermann, A.: Coastal flood damage and adaptation costs under 21st century sea-level rise, P. Natl. Acad. Sci. USA, 111, 3292–3297, https://doi.org/10.1073/pnas.1222469111, 2014. a, b, c
Kolega, N.: Slovenian coast sea floods risk, Acta Geogr. Slov., 46, 143–167, https://doi.org/10.3986/ags46201, 2006. a
Ličer, M., Smerkol, P., Fettich, A., Ravdas, M., Papapostolou, A., Mantziafou, A., Strajnar, B., Cedilnik, J., Jeromel, M., Jerman, J., Petan, S., Malačič, V., and Sofianos, S.: Modeling the ocean and atmosphere during an extreme bora event in northern Adriatic using one-way and two-way atmosphere–ocean coupling, Ocean Sci., 12, 71–86, https://doi.org/10.5194/os-12-71-2016, 2016. a
Lionello, P., Sanna, A., Elvini, E., and Mufato, R.: A data assimilation procedure for operational prediction of storm surge in the northern Adriatic Sea, Cont. Shelf Res., 26, 539–553, https://doi.org/10.1016/j.csr.2006.01.003, 2006. a
Lionello, P., Cavaleri, L., Nissen, K., Pino, C., Raicich, F., and Ulbrich, U.: Severe marine storms in the Northern Adriatic: Characteristics and trends, Phys. Chem. Earth., 40–41, 93–105, https://doi.org/10.1016/j.pce.2010.10.002, 2012. a, b, c
Longuet-Higgins, M. S. and Steward, R. W.: A note on wave set-up, J. Mar. Res., 21, 4–10, 1963. a
Longueville, B. D.: Community-based geoportals: The next generation? Concepts and methods for the geospatial Web 2.0, Comput. Environ. Urban, 34, 299–308, https://doi.org/10.1016/j.compenvurbsys.2010.04.004, 2010. a
Magaña, P., Bergillos, R. J., Del-Rosal-Salido, J., Reyes-Merlo, M. A., Díaz-Carrasco, P., and Ortega-Sánchez, M.: Integrating complex numerical approaches into a user-friendly application for the management of coastal environments, Sci. Total Environ., 624, 979–990, https://doi.org/10.1016/j.scitotenv.2017.12.154, 2018. a
Maguire, D. and Longley, P.: The emergence of geoportals and their role in spatial data infrastructures, Comput. Environ. Urban, 29, 3–14, https://doi.org/10.1016/s0198-9715(04)00045-6, 2005. a
Marcos, M., Tsimplis, M. N., and Shaw, A. G. P.: Sea level extremes in southern Europe, J. Geophys. Res., 144, C01007, https://doi.org/10.1029/2008JC004912, 2009. a, b
Mariani, S., Casaioli, M., Coraci, E., and Malguzzi, P.: A new high-resolution BOLAM-MOLOCH suite for the SIMM forecasting system: assessment over two HyMeX intense observation periods, Nat. Hazards Earth Syst. Sci., 15, 1–24, https://doi.org/10.5194/nhess-15-1-2015, 2015. a, b
Medugorac, I., Pasarić, M., and Orlić, M.: Severe flooding along the eastern Adriatic coast: the case of 1 December 2008, Ocean Dynam., 65, 817–830, https://doi.org/10.1007/s10236-015-0835-9, 2015. a, b
Mel, R. and Lionello, P.: Verification of an ensemble prediction system for storm surge forecast in the Adriatic Sea, Ocean Dynam., 64, 1803–1814, https://doi.org/10.1007/s10236-014-0782-x, 2014a. a, b
Mel, R. and Lionello, P.: Storm surge ensemble prediction for the city of Venice, Weather Forecast., 29, 1044–1057, https://doi.org/10.1175/WAF-D-13-00117.1, 2014b. a
Mel, R. and Lionello, P.: Probabilistic dressing of a storm surge prediction in the Adriatic Sea, Adv. Meteorol., 2016, 3764519, https://doi.org/10.1155/2016/3764519, 2016. a
Molteni, F., Buizza, R., Marsigli, C., Montani, A., Nerozzi, F., and Paccagnella, T.: A strategy for high-resolution ensemble prediction. I: Definition of representative members and global-model experiments, Q. J. Roy. Meteor. Soc., 127, 2069–2094, https://doi.org/10.1002/qj.49712757612, 2001. a
Muis, S., Verlaan, M., Winsemius, H. C., Aerts, J. C. J. H., and Ward, P. J.: A global reanalysis of storm surges and extreme sea levels, Nat. Commun., 7, 11969, https://doi.org/10.1038/ncomms11969, 2016. a
Orlić, M.: The first attempt at cataloguing tsunami-like waves of meteorological origin in Croatian coastal waters, Acta Adriat., 56, 83–96, 2015. a
Orlić, M., Gačić, M., and La Violett, P. E.: The currents and circulation of the Adriatic Sea, Oceanol. Acta, 15, 109–124, 1992. a
Pasarić, Z., Belušić, D., and Chiggiato, J.: Orographic effects on meteorological fields over the Adriatic from different models, J. Marine Syst., 78, S90–S100, https://doi.org/10.1016/j.jmarsys.2009.01.019, 2009. a
Pirazzoli, P. A. and Tomasin, A.: Recent near-surface wind changes in the central Mediterranean and Adriatic area, Int. J. Climatol., 23, 963–973, https://doi.org/10.1002/joc.925, 2003. a
Poate, T. G., McCall, R. T., and Masselink, G.: A new parameterisation for runup on gravel beaches, Coast. Eng., 117, 176–190, https://doi.org/10.1016/j.coastaleng.2016.08.003, 2016. a
Pomaro, A., Cavaleri, L., and Lionello, P.: Climatology and trends of the Adriatic Sea wind waves: analysis of a 37-year long instrumental data set, Int. J. Climatol., 37, 4237–4250, https://doi.org/10.1002/joc.5066, 2017. a, b
Prahl, B. F., Boettle, M., Costa, L., Kropp, J. P., and Rybski, D.: Damage and protection cost curves for coastal floods within the 600 largest European cities, Sci. Data, 5, 180034, https://doi.org/10.1038/sdata.2018.34, 2018. a, b
Reimann, L., Vafeidis, A. T., Brown, S., Hinkel, J., and Tol, R. S. J.: Mediterranean UNESCO World Heritage at risk from coastal flooding and erosion due to sea-level rise, Nat. Commun., 9, 4161, https://doi.org/10.1038/s41467-018-06645-9, 2018. a, b
Rizzi, J., Torresan, S., Zabeo, A., Critto, A., Tosoni, A., Tomasin, A., and Marcomini, A.: Assessing storm surge risk under future sea-level rise scenarios: a case study in the North Adriatic coast, J. Coast. Conser., 21, 453–471, https://doi.org/10.1007/s11852-017-0517-5, 2017. a, b
Roelvink, D., Reniers, A., van Dongeren, A., van Thiel de Vries, J., McCall, R., and Lescinski, J.: Modelling storm impacts on beaches, dunes and barrier islands, Coast. Eng., 56, 1133–1152, https://doi.org/10.1016/j.coastaleng.2009.08.006, 2009. a
Roland, A., Cucco, A., Ferrarin, C., Hsu, T.-W., Liau, J.-M., Ou, S.-H., Umgiesser, G., and Zanke, U.: On the development and verification of a 2d coupled wave-current model on unstructured meshes, J. Marine Syst., 78, Supplement, S244–S254, https://doi.org/10.1016/j.jmarsys.2009.01.026, 2009. a
Russo, A., Coluccelli, A., Carniel, S., Benetazzo, A., Valentini, A., Paccagnella, T., Ravaioli, M., and Bortoluzzi, G.: Operational models hierarchy for short term marine predictions: The Adriatic Sea example, in: 2013 MTS/IEEE OCEANS – Bergen, IEEE, https://doi.org/10.1109/oceans-bergen.2013.6608139, 2013. a
Salighehdar, A., Ye, Z., Liu, M., Florescu, I., and Blumberg, A. F.: Ensemble-Based Storm Surge Forecasting Models, Weather Forecast., 32, 1921–1936, https://doi.org/10.1175/waf-d-17-0017.1, 2017. a, b, c
Satta, A., Puddu, M., Venturini, S., and Giupponi, C.: Assessment of coastal risks to climate change related impacts at the regional scale: The case of the Mediterranean region, Int. J. Disast. Risk Re., 24, 284–296, https://doi.org/10.1016/j.ijdrr.2017.06.018, 2017. a
Schevenhoven, F. J. and Selten, F. M.: An efficient training scheme for supermodels, Earth Syst. Dynam., 8, 429–438, https://doi.org/10.5194/esd-8-429-2017, 2017. a, b
Schuerch, M., Spencer, T., Temmerman, S., Kirwan, M. L., Wolff, C., Lincke, D., McOwen, C. J., Pickering, M. D., Reef, R., Vafeidis, A. T., Hinkel, J., Nicholls, R. J., and Brown, S.: Future response of global coastal wetlands to sea-level rise, Nature, 561, 231–234, https://doi.org/10.1038/s41586-018-0476-5, 2018. a
Signell, R. P., Carniel, S., Cavaleri, L., Chiggiato, J., Doyle, J. D., Pullen, J., and Sclavo, M.: Assessment of wind quality for oceanographic modelling in semi-enclosed basins, J. Marine Syst., 53, 217–233, https://doi.org/10.1016/j.jmarsys.2004.03.006, 2005. a
Sorensen, R. M.: Coastal Engineering, in: Basic Coastal Engineering, Springer US, https://doi.org/10.1007/978-1-4757-2665-7_1, 1997. a
Stockdon, H. F., Holman, R. A., Howd, P. A., and Sallenger, A. H.: Empirical parameterization of setup, swash, and runup, Coast. Eng., 53, 573–588, https://doi.org/10.1016/j.coastaleng.2005.12.005, 2006. a, b, c
Tonani, M., Pinardi, N., Fratianni, C., Pistoia, J., Dobricic, S., Pensieri, S., de Alfonso, M., and Nittis, K.: Mediterranean Forecasting System: forecast and analysis assessment through skill scores, Ocean Sci., 5, 649–660, https://doi.org/10.5194/os-5-649-2009, 2009. a
Umgiesser, G., Ferrarin, C., Cucco, A., De Pascalis, F., Bellafiore, D., Ghezzo, M., and Bajo, M.: Comparative hydrodynamics of 10 Mediterranean lagoons by means of numerical modeling, J. Geophys. Res.-Oceans, 119, 2212–2226, https://doi.org/10.1002/2013JC009512, 2014. a
Umgiesser, G., Ferrarin, C., and Bajo, M.: SHYFEM, shallow water hydrodynamic finite element model (Version VERS_7_5_67), https://doi.org/10.5281/zenodo.1311751, 2018. a
Unidata: THREDDS Data Server (TDS), version 4.6.13 [software], UCAR/Unidata, Boulder, CO, USA, https://doi.org/10.5065/D6N014KG, 2019. a
Vaccari, L., Craglia, M., Fugazza, C., Nativi, S., and Santoro, M.: Integrative Research: The EuroGEOSS Experience, IEEE J. Sel. Top. Appl., 5, 1603–1611, https://doi.org/10.1109/jstars.2012.2190382, 2012. a
Valentini, A., Delli Passeri, L., Paccagnella, T., Patruno, P., Marsigli, C., Deserti, M., Chiggiato, J., and Tibaldi, S.: The Sea State forecast system of ARPA-SIM, Boll. Geof. Teor. Appl., 48, 333–349, 2007. a
Vilibić, I., Šepić, J., Pasarić, M., and Orlić, M.: The Adriatic Sea: A Long-Standing Laboratory for Sea Level Studies, Pure Appl. Geophys., 174, 3765–3811, https://doi.org/10.1007/s00024-017-1625-8, 2017. a
Vousdoukas, M. I., Voukouvalas, E., Mentaschi, L., Dottori, F., Giardino, A., Bouziotas, D., Bianchi, A., Salamon, P., and Feyen, L.: Developments in large-scale coastal flood hazard mapping, Nat. Hazards Earth Syst. Sci., 16, 1841–1853, https://doi.org/10.5194/nhess-16-1841-2016, 2016. a
Vousdoukas, M. I., Mentaschi, L., Voukouvalas, E., Verlaan, M., and Feyen, L.: Extreme sea levels on the rise along Europe's coasts, Earth's Future, 5, 304–323, https://doi.org/10.1002/2016ef000505, 2017. a
Vousdoukas, M. I., Mentaschi, L., Voukouvalas, E., Bianchi, A., Dottori, F., and Feyen, L.: Climatic and socioeconomic controls of future coastal flood risk in Europe, Nat. Clim. Change, 8, 776–780, https://doi.org/10.1038/s41558-018-0260-4, 2018a. a
Vousdoukas, M. I., Mentaschi, L., Voukouvalas, E., Verlaan, M., Jevrejeva, S., Jackson, L. P., and Feyen, L.: Global probabilistic projections of extreme sea levels show intensification of coastal flood hazard, Nat. Commun., 9, 2360, https://doi.org/10.1038/s41467-018-04692-w, 2018b. a
Wolff, C., Vafeidis, A. T., Lincke, D., Marasmi, C., and Hinkel, J.: Effects of Scale and Input Data on Assessing the Future Impacts of Coastal Flooding: An Application of DIVA for the Emilia-Romagna Coast, Front. Mar. Sci., 3, 41, https://doi.org/10.3389/fmars.2016.00041, 2016. a
Wolff, C., Vafeidis, A. T., Muis, S., Lincke, D., Satta, A., Lionello, P., Jimenez, J. A., Conte, D., and Hinkel, J.: A Mediterranean coastal database for assessing the impacts of sea-level rise and associated hazards, Sci. Data, 5, 180044, https://doi.org/10.1038/sdata.2018.44, 2018. a
World Meteorological Organization: Guidelines on Ensemble Prediction Systems and Forecasting, World Meteorological Organization: Weather, Climate, and Water, Geneva, Switzerland, 32 pp., 2012. a
Yang, P., Evans, J., Cole, M., Marley, S., Alameh, N., and Bambacus, M.: The Emerging Concepts and Applications of the Spatial Web Portal, Photogramm. Eng. Remote Sens., 73, 691–698, https://doi.org/10.14358/pers.73.6.691, 2007. a
Zacharioudaki, A., Korres, G., and Perivoliotis, L.: Wave climate of the Hellenic Seas obtained from a wave hindcast for the period 1960–2001, Ocean Dynam., 65, 795–816, https://doi.org/10.1007/s10236-015-0840-z, 2015. a
Zou, Q.-P., Chen, Y., Cluckie, I., Hewston, R., Pan, S., Peng, Z., and Reeve, D.: Ensemble prediction of coastal flood risk arising from overtopping by linking meteorological, ocean, coastal and surf zone models, Q. J. Roy. Meteor. Soc., 139, 298–313, https://doi.org/10.1002/qj.2078, 2013. a


