the Creative Commons Attribution 4.0 License.
the Creative Commons Attribution 4.0 License.
Hydrological impacts of climate change on small ungauged catchments – results from a global climate model–regional climate model–hydrologic model chain
Aynalem T. Tsegaw
Marie Pontoppidan
Erle Kristvik
Knut Alfredsen
Tone M. Muthanna
Climate change is one of the greatest threats currently facing the world's environment. In Norway, a change in climate will strongly affect the pattern, frequency, and magnitudes of stream flows. However, it is challenging to quantify to what extent the change will affect the flow patterns and floods from small rural catchments due to the unavailability or inadequacy of hydro-meteorological data for the calibration of hydrological models and due to the tailoring of methods to a small-scale level. To provide meaningful climate impact studies at the level of small catchments, it is therefore beneficial to use high-spatial- and high-temporal-resolution climate projections as input to a high-resolution hydrological model. In this study, we used such a model chain to assess the impacts of climate change on the flow patterns and frequency of floods in small ungauged rural catchments in western Norway. We used a new high-resolution regional climate projection, with improved performance regarding the precipitation distribution, and a regionalized hydrological model (distance distribution dynamics) between a reference period (1981–2011) and a future period (2070–2100). The flow-duration curves for all study catchments show more wet periods in the future than during the reference period. The results also show that in the future period, the mean annual flow increases by 16 % to 33 %. The mean annual maximum floods increase by 29 % to 38 %, and floods of 2- to 200-year return periods increase by 16 % to 43 %. The results are based on the RCP8.5 scenario from a single climate model simulation tailored to the Bergen region in western Norway, and the results should be interpreted in this context. The results should therefore be seen in consideration of other scenarios for the region to address the uncertainty. Nevertheless, the study increases our knowledge and understanding of the hydrological impacts of climate change on small catchments in the Bergen area in the western part of Norway.
- Article
(2110 KB) - Full-text XML
- BibTeX
- EndNote
Climate change is one of the greatest threats to human existence, economic activity, ecosystems, and civil infrastructure (Kim and Choi, 2012). The climate change risks depend on the magnitude of warming, rate of warming, geographic location, levels of development, vulnerability, and choices and implementation of adaptation and mitigation options (IPCC, 2018). The trends of changes vary considerably in different parts of Europe because of changes in large-scale atmospheric circulation or local orographic circulation (Eisenreich et al., 2005; Hattermann et al., 2009).
Changes in temperature and precipitation and the shift in winter precipitation from snow to rain play an important role in studying impacts of climate change on the hydrology of a catchment. These changes influence the hydrological regime of a stream, and the most serious and widespread potential impact of the changes is flooding (Baltas, 2007; Richardson, 2002; Thornes, 2002). The Blöschl et al. (2019) study shows that increasing autumn and winter rainfall results in increasing mean annual floods in northern Europe. In Norway, the average annual temperature and precipitation are expected to increase by 3.8 to 6.2 ∘C and 7 % to 27 %, respectively, by the end of the century using the RCP8.5 scenario (Hanssen-Bauer et al., 2015). The largest increase in precipitation is mostly expected during the autumn and winter months, which will in turn impact the magnitude and in some cases the seasonality of flood peaks. A climate impact study in Sogn and Fjordane county of Norway showed that flood peaks shift from summer to autumn in the future scenario (2071–2100) (Chernet et al., 2014). Donnelly et al. (2017) studied climate change impacts on European hydrology and found that climate change will strongly affect the hydrological cycle in the regions of Europe where Norway is in the future period. Outside Norway, authors have reported that the frequency and magnitude of flows are being affected by the changes in climatic conditions (Alfieri et al., 2015; Blöschl et al., 2019; Madsen et al., 2014; Mallakpour and Villarini, 2015; Rojas et al., 2013). Adverse effects of climate change on river regimes worldwide (Pumo et al., 2016) call attention to the hydrological impact of climate change study at a local scale.
An increase in heavy localized precipitation events as projected suggests an increase in precipitation-generated local flooding. An increase in local flash floods can cause significant danger and loss of life and property (Borga et al., 2011; Kundzewicz et al., 2014). Local flash floods usually occur in small catchments (e.g., area less than 50 km2). These types of flood events are usually short in duration, but they are usually connected with severe damage (Menzel et al., 2006). Studies show that the probability and magnitude of hazardous heavy-precipitation events have been increasing in several European regions (e.g., Golz et al., 2016). Heavy localized precipitation could be caused by low-pressure systems (e.g., western Norway; Azad and Sorteberg, 2017) or by prevailing convective precipitation at hilly or mountainous areas.
A quantitative analysis of the impacts of climate change on the stream flow requires simulations in a hydro-meteorological system. The models on which the simulations are based should adequately represent the system dynamics relevant for different types of flow (e.g., floods) generation (Menzel et al., 2006). Hydrological models provide the means to conceptualize and investigate the relationship between climate (e.g., precipitation and temperature) and water resources (e.g., low flows and floods) of a region. These models are needed in order to assess the likely effects of climate change, and to propose appropriate adaptation strategies (Baltas, 2007). The results of regional climate impact studies aid in proposing adaptation measures adapted to local climatic, geographic, economic, and social conditions (Hattermann, 2009; Krysanova et al., 2008). Investigating the hydrological impact of climate change is generally performed by following a sequence of steps from global and regional climate modeling, through data tailoring (downscaling and bias adjustment) and hydrological modeling (Olsson et al., 2016).
Assessing the impacts of climate change on hydrology of small ungauged catchments is challenging for the following reasons: unavailability or inadequacy of hydro-meteorological data for calibration of hydrological models, the short response time of the catchments, difficulty in describing local hydrological processes, and coarse resolution of climate models. Inadequate process representation in climate models, with coarse spatial resolution (e.g., grid spacing of 9 km), results in poor representation of the observed precipitation in small catchments (e.g., area less than 50 km2), which is inadequate for the assessment of impacts in small catchments (Quintero et al., 2018). For example, Pontoppidan et al. (2017) showed that during a flooding event in western Norway, the regional model simulated observed rainfall considerably better with a grid spacing of 3 km compared to a grid spacing of 9 km due to the complex terrain in the area. Therefore, to provide meaningful climate impact results for small catchments, it is necessary to use high spatial and temporal resolutions of projected climate data as forcing in high-resolution hydrological models (Lespinas et al., 2014; López-Moreno et al., 2013; Tofiq and Guven, 2014). Current efforts of coordinated regional downscaling in Europe (EURO-CORDEX; e.g., Jacob et al., 2014; Kotlarski et al., 2014) are performed on a 0.11∘ grid; however a new high-resolution regional downscaling with improved representation of local precipitation distribution for southern Norway is available (Pontoppidan et al., 2018) but has yet to be included in a full hydrological model chain.
To solve the challenge related to lack of availability of a properly calibrated high-resolution hydrological model at ungauged small rural catchments in Norway, a predictive tool has been developed and tested. Tsegaw et al. (2019) calibrated and validated the distance distribution dynamics (DDD) hydrological model for 41 gauged small rural catchments in Norway with hourly temporal resolution. For predicting flow in the ungauged catchments, the DDD model parameters were regionalized using three different methods of regionalization (multiple regression, physical similarity, and combined method). To evaluate the model, a number of gauged catchments were selected and treated as ungauged during evaluation. The findings show that the combined method performs the best of all the methods in predicting flow. Even if the DDD model predicts flow at the test catchments satisfactorily (0.5 ≤ Kling–Gupta efficiency < 0.75), the model underestimates most of the observed flood peaks (Tsegaw et al., 2019). To improve the prediction of observed floods, a dynamic river network method has been introduced and implemented in DDD (Tsegaw et al., 2020). It is this improved setup that has been used in this study where the general objective was to assess the hydrological impacts of climate change on small ungauged catchments using a novel model chain consisting of a high-resolution, bias-corrected dynamical downscaled climate scenario and the improved DDD model. More specifically,
- i.
we assess the impacts of climate change on the changes of flow patterns at ungauged small rural catchments around Bergen, Norway, and
- ii.
we assess impacts of climate change on the pattern and frequency of floods in ungauged small rural catchments around Bergen, Norway.
2.1 Study area
The Bergen area is known for its wet climate. The location is in western Norway (60∘ N, 5∘ E) with a coastal climate and a pronounced topography. The annual precipitation for the normal period 1961–1990 was 2250 mm at the Florida weather station, with precipitation typically occurring 243 d of the year every year (i.e., days with 0.1 mm or more precipitation) (Kristvik and Riisnes, 2015). The region is mostly affected by orographic precipitation, which is produced when humid air from the North Sea is lifted as it moves over the mountain range. The air rises and cools, forming clouds that typically precipitate upwind of the mountain ridge. In particular, prominent mountains oriented across the wind gradient receive the heaviest precipitation. This causes major variations in precipitation loads, even within small distances (Kristvik and Riisnes, 2015).
Floods in the western part of Norway (where Bergen is located) are mainly caused by heavy rainfall during the autumn season (Roald, 2008). The Norwegian Center for Climate Services report pointed out that rainfall-dominated floods are projected to increase by almost 60 % (with RCP8.5 scenario) towards the end of the century, and more frequent and stronger intense rainfall events may in the future present special challenges in small, steep rivers being fed by small upland catchments (Hanssen-Bauer et al., 2015). Vormoor et al. (2015) found that autumn–winter events will become more frequent by 2099, which will lead to an intensification of the current autumn–winter flood regime for the coastal catchments in Norway. Blöschl et al. (2017) studied the impacts of climate change on shifting the timing of European floods using observed floods and found that in western Norway, 50 % of the stations show a shift towards floods occurring later in the year by more than +8 d every 50 years.
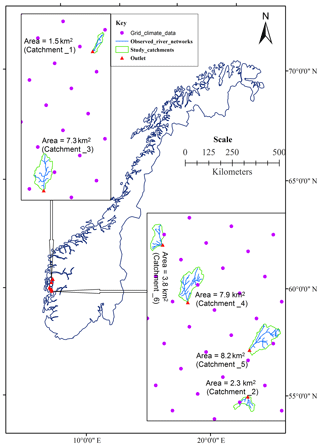
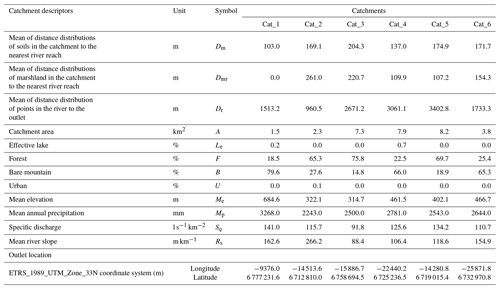
Six ungauged small rural catchments, located in western Norway around Bergen, were used in this study. The catchment descriptor data are taken from http://nevina.nve.no/ (last access: 23 August 2019) and http://www.statenskartverk.no/ (last access: 29 August 2019). The definition of small rural catchments is based on the report by Fleig and Wilson (2013) applying an upper area limit of 50 km2. The catchments were selected for this impact study because there are critical infrastructures (e.g., culverts, bridges, and buildings) at the outlet of the catchments which could be damaged by floods in the future period (2070–2100). We selected three catchments with bare mountain land use (>50 %) and three catchments with forest land use (>50 %) to include diverse types of land use in the study. The locations of the catchments and stream network for each of the catchments are depicted in Fig. 1. The catchment descriptors (CDs) and outlet coordinates are presented in Table 1.
2.2 Climate, topography, and land use data
2.2.1 Climate data and bias correction
The precipitation and temperature data used to drive the hydrological model were obtained from a simulation performed by the Weather Research and Forecasting model (WRF) version 3.8.1 (Skamarock et al., 2008). The model is non-hydrostatic and widely used for weather forecasting and research purposes. This RCP8.5 scenario climate projection is unique because of its high spatial grid resolution of 4 km × 4 km. To our knowledge, no other convective-permitting, century-long, dynamically downscaled climate projection is available for Norway. Precipitation and temperature data are available with a 3 h resolution. However, regional models, such as WRF, inherit biases from the boundary conditions used to drive the model. These biases may lead to a misrepresentation of important features in the models; e.g., the known bias of the North Atlantic storm track (Zappa et al., 2013) leads individual storms into central Europe instead of on a more northern path along the Norwegian coast as the observations suggest. Therefore, the global climate model NorESM1-M (r1i1p1), used as forcing data at the boundaries in WRF, was bias corrected before the regional downscaling.
Bias correction is a commonly used method to address systematic model errors. Many studies apply a correction to variables such as temperature and precipitation via a choice of distribution mapping towards observations. Normally this is performed on the regional climate model output (e.g., Muerth et al., 2013; Tramblay et al., 2013). Such posterior bias correction highly constrains the model output, and the use of such has therefore been questioned (Maraun, 2016; Maraun et al., 2017). Correcting variables individually may violate physical consistency because it tampers with known physical dependencies. Alternatively, bias correction can be applied upstream, i.e., to the global climate model before it is used as driving data for a regional model. In principle, this will allow the interior of the regional model to adjust to any physical inconsistencies applied at the boundaries and develop a physically consistent climate within the model domain. Such an approach is widely used in a “storyline” approach where one adds a climate change signal to reanalysis data before the downscaling (e.g., Rasmussen et al., 2011; Schär et al., 1996). However this pseudo global warming method also has caveats; it assumes that the climate variability is stationary in time, an assumption which has been widely questioned (Christensen et al., 2008; Maraun, 2012; Vannitsem, 2011). Instead we use a method that corrects the global climate model's monthly mean towards the reanalysis monthly mean. By doing so we overcome the stationary assumption because we retain the variability from the global model instead of limiting the variability to the reanalysis.
Bias correction of the global climate model driving data prior to the dynamical downscaling leads to physical consistency in the interior domain and a potential gain from the increased horizontal resolution. This particular approach showed improved precipitation representation in an Australian (Rocheta et al., 2017) and in a North American climate (Wang and Kotamarthi, 2015; Xu and Yang, 2012, 2015) as well as in a hurricane representation along the US east coast (Bruyère et al., 2014). In Norway the upstream bias correction led to a better represented North Atlantic storm track and an improved spatial precipitation distribution (Pontoppidan et al., 2018).
The bias correction was performed following the anomaly approach, available for downloading and thoroughly described in Bruyère et al. (2015). A reference period of 30 years (ref, from 1981 to 2010) was selected for which we calculated mean values for the month m=1, …, 12 of a variable (e.g., temperature) from ERA-Interim as shown by Eq. (1).
Analogously, we calculated monthly means for variables from the NorESM1-M simulations, denoted . For NorESM1-M simulations (6-hourly time resolution) in the reference period, we define 6-hourly anomalies (Eq. 2) for a data point i as
as deviations from the monthly means of the reference period. For simulations for the future period, anomalies are also taken as deviations from monthly means of the reference period as shown by Eq. (3).
The 6-hourly bias-corrected data point i is now defined as shown by Eq. (4).
where the index “per” denotes the reference (ref) or future (fut) period and “NorBC” denotes the bias-corrected NorESM1-M. As opposed to the pseudo global warming method, this approach ensured that the forcing files of our experiment retained the sub-monthly variability from the climate model but with an adjusted climatological mean for longer timescales.
Bruyère et al. (2014) investigated the effect of bias correcting single and multiple variables. The conclusion was that the best results were obtained when a multivariate bias correction was performed. Based on this finding, we bias corrected the three-dimensional wind components, the temperature, the relative humidity, and the pressure fields in addition to the two-dimensional sea surface temperature fields in our driving data.
2.2.2 Topographical and land use data
The DDD model parameters, which do not need regionalization, were derived from analysis of topographical and land use data of the catchment using GIS. The source of the topography and land use data was the Norwegian Mapping Authority (http://www.statenskartverk.no/, last access: 22 August 2019). The 10 m × 10 m DEM, the river network, and the 1:50 000 scale land use data were retrieved and used in this study. The DEM was reconditioned to the naturally occurring river network using the Arc Hydro tool to create a hydrologically correct terrain model that can improve the accuracy of watershed modeling (Li, 2014). The reconditioned DEM was further used to determine the distance distributions of hill slopes and river networks as needed by DDD.
2.3 DDD hydrological model
2.3.1 General description of the model
The distance distribution dynamics (DDD) hydrological model was developed by Skaugen and Onof (2014) and currently runs operationally with daily and 3-hourly time steps at the Norwegian flood forecasting service. The model is a semi-distributed conceptual model, and it is applicable for catchments ranging from small (e.g., 1 km2) to large (e.g., 5000 km2) and temporal resolutions ranging from low (e.g., daily time step) to high (e.g., hourly time step). It has two main modules: the subsurface and the dynamics of runoff. The volume capacity of the subsurface water reservoir is shared between a saturated zone and an unsaturated zone. The volume of the saturated zone and the unsaturated zone is inversely related; i.e., the higher the unsaturated zone volume, the lower the saturated zone volume (Skaugen and Mengistu, 2016; Skaugen and Onof, 2014). The dynamics of runoff in DDD has been derived from the catchment topography using a GIS combined with a runoff recession analysis. The DDD model applies the distribution of distances between points in the catchment and their nearest river reach (distance distributions of a hillslope) as the basis for describing the flow dynamics of the hillslope. The distribution of distances between points in the river network and the outlet forms the basis for describing the flow dynamics of the river network. The hillslope and river flow dynamics of DDD are described by unit hydrographs (UHs) which are derived from distance distributions and celerity using GIS and recession analysis, respectively (Skaugen and Mengistu, 2016; Skaugen and Onof, 2014). Figure 2 shows the structure of the DDD model.
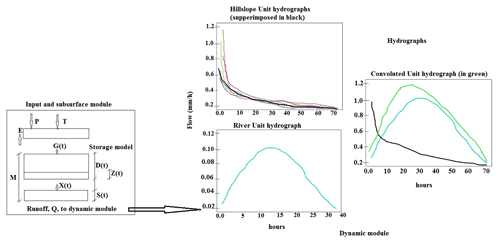
Figure 2Structure of the distance distribution dynamics model adapted from Skaugen and Onof (2014). Left panel: the storage model. Right panel: hydrographs of hillslope and river. P is precipitation, T is temperature, E is actual evapotranspiration, G(t) is input from snowmelt and rain, Z(t) is soil moisture in the unsaturated zone, X(t) is excess water, M is total volume of subsurface water reservoir, S(t) is a saturated zone volume, and D(t) is unsaturated zone volume.
2.3.2 Dynamic river network method in DDD
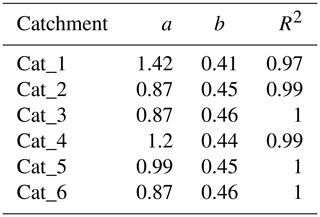
Stream networks in a catchment expand and contract as the catchment wets and dries, both seasonally and in response to individual precipitation events. This dynamic of stream networks gives important information to the pattern and the process of runoff generation in the catchment. Dynamic river networks and hence dynamic overland unit hydrographs have been introduced and implemented in the DDD model in order to improve the simulation of floods (Tsegaw et al., 2020). The mean of the distribution of distances from a point in the catchment to the nearest river reach (Dm) becomes dynamic in the dynamic river network method. Therefore, we need to estimate the dynamic Dm from the relation between the upstream critical supporting area (Ac); i.e., the area needed to initiate and maintain streams, and Dm using GIS and Python script as shown in Eq. (5). The coefficients (a and b) are estimated for the study catchments and presented in Table 2. The calibration parameter of the dynamic river network routine in DDD is the critical flux (Fc) and is estimated by regional regression in this study.
2.3.3 Model parameters and regionalization
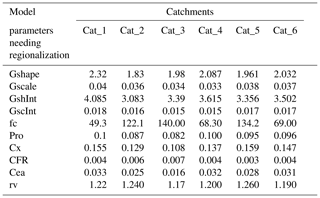
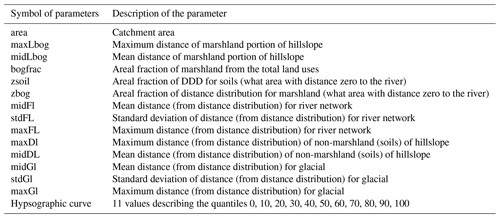
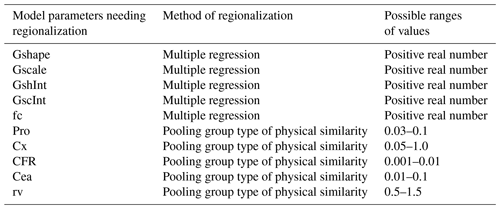
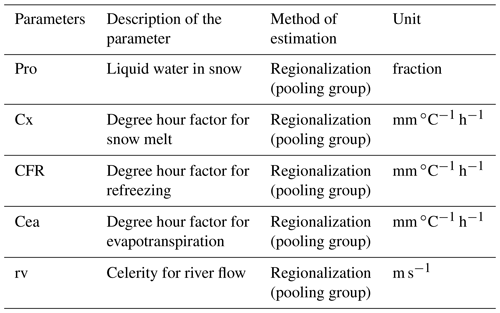
The DDD model parameters are divided into three main groups. The first group contains the parameters estimated by recession analysis from observed flow data (for gauged catchments) or through regionalization for ungauged catchments (Table A1). The second group contains the parameters estimated by model calibration (for gauged catchments) against observed discharge or by regionalization (for ungauged catchments) (Table A2). The third group contains the parameters estimated from digitized geographic maps using GIS (Table A3). In addition, the snow routine in DDD has two parameters estimated from the spatial distribution of observed precipitation data (Skaugen and Weltzien, 2016). The shape parameter (a0) and the decorrelation length (d) of the gamma distribution of the snow and the snow water equivalent (SWE) are estimated from a previous calibration using 84 catchments in Norway (Skaugen et al., 2015). As this study focuses on ungauged catchments, it was not possible to conduct calibration and recession analysis. The model parameters in need of calibration and recession analysis were therefore derived through a combined method of regionalization using 41 gauged small rural catchments in Norway as a base (Tsegaw et al., 2019). To estimate the regionalized parameters for this study (3-hourly time step), regionalized DDD model parameters with hourly resolution were used (Tsegaw et al., 2019). In the combined method of regionalization, the recession parameters and critical flux were estimated using multiple regression between model parameters and CDs, and the parameters in need of calibration (all in Table A2) were estimated using the physical similarity method. The parameters of the model needing regionalization are shown in Tables A1 and A2 (the bottom five in Table A1 and all in Table A2). The CDs of the study catchments, used to get the DDD model parameters through regionalization, are presented in Table 1.
2.4 Impact study
The precipitation and temperature data were extracted from the 4 km × 4 km and 3-hourly resolution climate model. The climate data were then used to force the DDD model to simulate flow, actual evapotranspiration, and snow water equivalent (SWE) for both the reference and the future periods. A total of 30 hydrological years (1 September to 31 August) were used for both periods in the impact study. We have analyzed changes in the following indicators used to describe the climate change impacts:
- i.
the mean annual changes of precipitation, temperature, flow, snow water equivalent (SWE), and actual evapotranspiration;
- ii.
the mean annual and mean seasonal changes of flow;
- iii.
the annual flow duration curves (FDCs);
- iv.
the timing of annual winter–spring and autumn stream flow;
- v.
the mean annual and seasonal maximum flows;
- vi.
floods with return periods of 2 to 200 years.
Changes are computed by Eq. (6) using the magnitude of a hydroclimatic variable (Y) for the reference (Yref) and the future (Yfut) periods.
where ΔY is a change in the hydroclimatic variable.
2.4.1 Changes of hydroclimatic variables
The 3-hourly precipitation and temperature data, extracted from the climate model, were analyzed using an R script to quantify the changes in the mean annual values between the reference and future periods. The 3-hourly time series precipitation, temperature, and discharge data were converted to annual series which was further analyzed in order to obtain the mean annual values.
Seasonal mean flow data were also estimated for the reference and the future periods i.e., winter, spring, summer, and autumn, in order to assess the changes in the seasonal mean flows. The annual maximum SWE was selected from each hydrological year and averaged for the reference and the future periods to get the mean annual maximum SWE for the two periods. The annual actual evapotranspiration was estimated by aggregating the actual evapotranspiration from the 3 h simulation results and then averaged over 30 years to get the mean annual actual evapotranspiration.
2.4.2 Changes in flow duration curves
A flow duration curve is a cumulative curve that shows the percent of time a specified flow is equaled or exceeded during a given period. It shows the flow characteristic of a stream throughout a range of flow, without regard to the sequence of occurrence (Searcy, 1959). The changes in stream flow variability over a hydrologic year between the reference and the future periods were analyzed. The changes of floods (between 0 % and 5 % exceedance) and the median flows (flows which are exceeded by 50 % of the time) were analyzed in this study. The formula to calculate the probability of exceedance is given by Eq. (7).
p is the probability that a given flow will be equaled or exceeded (percent of time). K is the ranked position on the listing (dimensionless). n is the number of events for period of record, and it is dimensionless.
2.4.3 Changes in timing of annual winter–spring and autumn stream flow
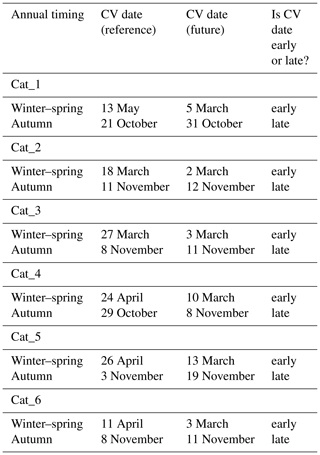
The annual timing of river flows is a good indicator of climate-related changes. Changes in timing of annual winter–spring (WS) and autumn stream flow were analyzed using the center of volume (CV) date (Hodgkins et al., 2003). The center of volume date is the date by which half of the total volume of water for a given period flows by a river section. The center of volume date is expected to be a more robust indicator of the timing of the bulk of high flows in a season than the peak flows, as the peak flow may happen before or after the bulk of seasonal flows (Hodgkins et al., 2003). From the 3 h flow data (simulated for the reference and future periods), the mean 3 h flow value for the 30 years in both periods was calculated. Using the mean 3 h flow value, the seasonal center of volume dates for winter–spring (1 January to 31 May) and autumn (1 October to 31 December) was calculated.
2.4.4 Changes in the maximum flows and flood frequency
The annual and seasonal maximum flows (floods) were selected from the 30 years of the reference and the future periods for the analysis. The changes in the mean and median of the annual and seasonal maximum flows were analyzed.
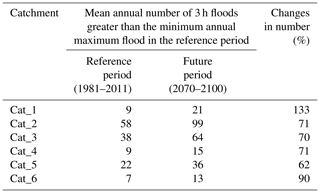
The number of 3 h floods above a certain threshold gives a general overview on the impacts of climate change on the flood risk in small catchments. Accordingly, we have analyzed the changes in the number of 3 h floods between the reference and future periods with a flow higher than the minimum of the 30-year annual maximum flow of the reference period.
To assess the magnitude of a flood with a given probability, the flood frequency methods must be applied. A flood frequency analysis is important for flood hazard mapping, for which a flood of a certain return period (e.g., 200 years in Norway) is used for the flood zone mapping (Groen et al., 2012). To analyze changes in the magnitudes of a flood with a given return period (e.g., 200-year flood), flood frequency analysis is applied to the annual maximum series of the reference (1981–2011) and future period (2070–2100). In this study, the Gumbel distribution (Bhagat, 2017; Shaw, 1983) was used to model the annual maximum series. The Gumbel distribution was selected because it has been widely applied in studies of climate change impacts on floods in Europe (Dankers and Feyen, 2008; Veijalainen et al., 2010).
3.1 Regionalized DDD model parameters
The results of the model parameters obtained after the regionalization are presented in Table 3 for all study catchments. The parameters and possible ranges of values are presented in Table A4.
3.2 Changes in hydroclimatic variables
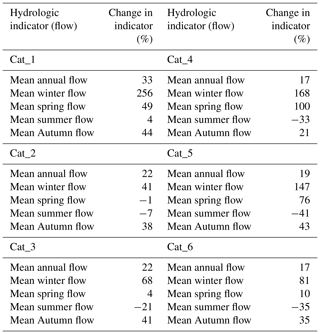
The simulation results of the climate and hydrological models were further analyzed to quantify the changes in the hydroclimatic variables. The mean annual precipitation, temperature, evapotranspiration, flow, and mean autumn and winter flows increase for all the study catchments in the future period, compared to the reference period. The mean spring flow increases in five of the catchments and decreases in one of the study catchments. The mean summer flow decreases for five of the catchments. The mean annual maximum SWE decreases for all the study catchments. In the future period, the mean annual precipitation increases by 20 % to 24 %, and the mean annual temperature rises by 3 to 3.3 ∘C. The mean annual flow increases by 17 % to 33 %. The decrease in the mean summer flow ranges between 7 % and 35 %, and the increase was 4 % in only one of the study catchments. The mean winter flow increases by an average of 127 % (ranging between 41 % and 256 %). The mean spring flow increases by 4 % to 100 % for five of the catchments and decreases by 1 % in one catchment. The mean autumn flow increases by an average of 37 % (ranging from 21 % to 43 %). The results of changes in the mean annual temperature, precipitation, maximum SWE, and actual evapotranspiration are presented in Table 4. Table 5 presents changes in the mean annual and seasonal flows for the catchments. Mean 3-hourly flow of the study catchments is shown in Fig. 3 for the reference and the future periods.
Table 4Changes in mean annual temperature, precipitation, maximum snow water equivalent (SWE), and evapotranspiration for all the study catchments using the bias-corrected NorESM1-M (r1i1p1) global climate model, WRF regional climate model and RCP8.5, and DDD model.
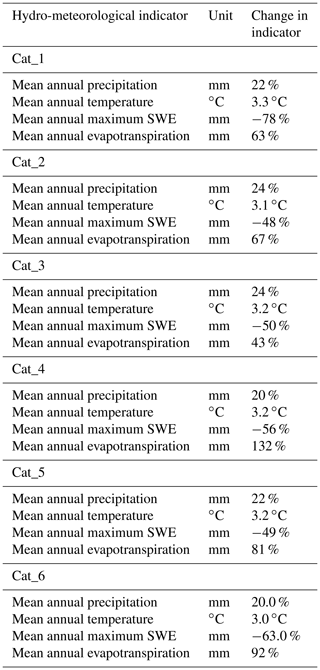
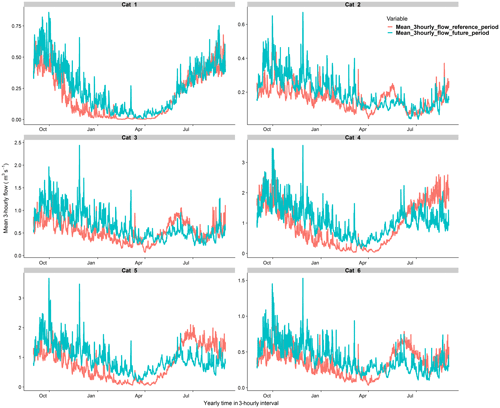
Figure 3Yearly mean 3-hourly hydrographs of the study catchments for the reference and future periods.
3.2.1 Changes in flow duration curves
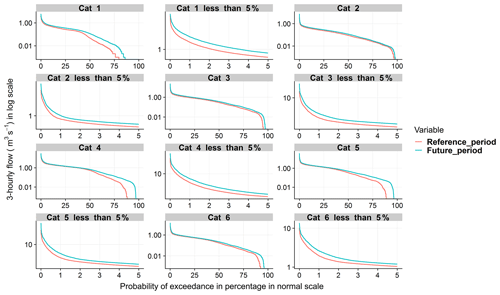
The results of the study show that changes in the flow duration curve (FDC) values are positive for all the flow conditions in all the study catchments. For all catchments, the top 5 % of flows in the future period were higher than the flows in the reference period by 8 % to 62 %. In the future period, the median flows increase by 24 % to 140 % (the highest value is for catchment 1 and the lowest value was for catchment 4). Figure 4 shows the FDCs for both periods for the probability of exceedance less than 5 % and 100 % for all the study catchments.
3.3 Changes in timing of annual winter–spring (WS) and autumn stream flow
For all the study catchments, the mean WS center of volume dates occurred earlier in the future period (16–68 d) than the reference period. The autumn CV date occurs later for all the study catchments in the future period, and a shift of 1–16 d is expected. Table 6 presents the mean WSCV dates and mean autumn CV dates for all the study catchments.
3.4 Changes in the maximum flows and flood frequency
3.4.1 Changes in the annual and seasonal maximum flows
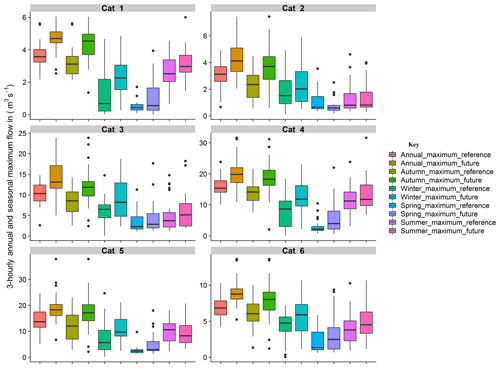
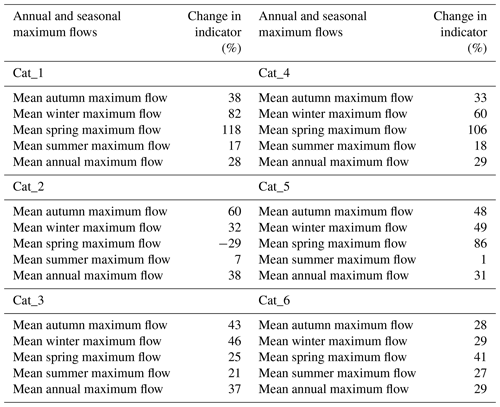
The annual and seasonal maximum flows increase in the future period compared to the reference period. The mean annual maximum flows increase by 29 % to 38 % across all the study catchments. The mean seasonal maximum flows also show an increase in all seasons (1 % to 118 %) and all catchments except for the spring season of catchment 2 (reduction of 29 %) as shown in Table 7. The median of the annual and seasonal maximum flows increases for all catchments except for the spring season of catchment 2 as shown in Fig. 5. Table 7 presents the results of changes in the mean annual and seasonal maximum flows in the future period compared to the reference period. Figure 5 shows the distributions of the 30-year annual and seasonal maximum flows for both the reference and future periods.
Table 7Changes in percentage of the mean annual and seasonal maximum flows in the future period compared to the reference period.
The number of 3 h floods, exceeding the minimum annual maximum floods in the 30 years of the reference period, increases in the future period significantly (Table 8). This result shows that flooding will occur more often in the future period. In the future period, the yearly average number of such floods increase by 62 % to 133 % across all study catchments.
3.4.2 Changes in flood frequency
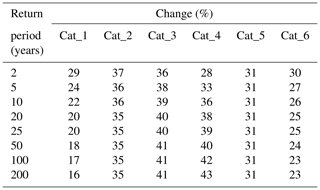
The study results, from the six ungauged small rural catchments, show that there will be an increase in floods with a return periods of 2 to 200 years in the future period. The floods are expected to increase by 16 % to 43 %. Table 9 shows the changes of 2- to 200-year floods for all the study catchments.
4.1 Regionalized DDD model parameters
The physical similarity assessment result, between the study and gauged catchments in the west climate region of Norway, shows that the most similar gauged catchments are located close to the study catchments. This result is evidence that the regionalization method used in this study is plausible.
4.2 Hydrological impacts of climate change
4.2.1 Changes of hydroclimatic variables
Generally, the findings of the increase in precipitation and temperature for the study catchments are in the ranges of the increases predicted by the Norwegian Center for Climate Services (NCCS) under the report Climate in Norway 2100 (Hanssen-Bauer et al., 2015); however, the results from some of the catchments were above or below the prediction interval of the report. This difference for some catchments was not unexpected since the comparison is between catchment-specific values on a small scale and the regional values from the report. The NCCS report is based upon 10 climate models with RCP8.5 and RCP4.5 using daily temporal resolution for the reference period (1971–2000) and future period (2071–2100).
The NCCS report shows that the median projections for changes in the annual mean precipitation are 17 % and 8 % for RCP8.5 and RCP4.5, respectively, and projected increases in the mean annual temperature are 3.7 and 2.3 ∘C for RCP8.5 and RCP4.5, respectively, by 2100 for the southwestern part of Norway (where our study catchments are located). Our combined global climate model (GCM), regional climate model (RCM), and RCP8.5 result shows that the projected increase in the mean annual temperature is 3.3 ∘C and the mean annual precipitation change is 22 % between the 1981–2011 and 2070–2100 periods in the Bergen area of Norway. The comparison shows that the GCM–RCM–RCP8.5 climate model, used in this study, predicts slightly more precipitation than the NCCS report for RCP8.5 and is colder than the NCCS report with RCP8.5.
In the future period, all the study catchments show an increase in the mean annual flow compared to the reference period. The minimum and maximum increases are 17 % and 33 %, respectively. Alcamo et al. (2007) found that the mean annual river flow is projected to increase in northern Europe by approximately 9 % to 22 % up to the 2070s. This result can be comparable with our findings; i.e., the increment could increase by 17 % to 33 % between 2070 and 2100. The increase in mean annual flow is the result of an increase in the mean annual precipitation and temperature (Table 4). The increase in the mean annual temperature results in an increase in water loss by evapotranspiration. However, the mean annual increase in precipitation exceeds the mean annual increase in the actual evapotranspiration computed in the model and these conditions contributed to increase in mean annual flow in general. The Hanssen-Bauer et al. (2015) report shows that the mean annual flow could decrease up to 1 % and increase up to 17 % for western Norway (where the study catchments are located) by 2100, and our result shows that the increase is higher than the increase in the report for four of the study catchments. This may very well be related to the higher resolution of our regional climate model. The higher resolution enables, at least in theory, a better local representation of precipitation and temperature, and the averaging issue in estimating the regional values in the report may lead to differences.
Unlike the changes in the mean annual flow, changes in the temporal distribution of flows (e.g., seasonal) can be important because changes are rarely identical throughout the year (Olsson et al., 2016). The mean winter and autumn flows increase for all study catchments. The main causes for the increase are projected increase in the precipitation and temperature during the autumn and winter seasons. The increase in the mean annual flows is mainly the result of an increase in mean winter flows for all catchments (Table 5 and Fig. 3). The main cause of increase in the mean winter flow is increased winter temperatures. Increased winter temperatures result in a higher proportion of winter precipitation falling as rain which then results in a higher proportion of winter flow. The mean spring flows show an increase for the five catchments and a decrease for one of the catchments while the mean summer flows show a decrease for the five catchments and an increase for one of the catchments. The increase in mean summer flow happened at a catchment which has the highest mean elevation (catchment 1 in Table 1), and this result shows that the future increase in temperature may not result in high evapotranspiration to reduce the mean summer flow at the high-elevation catchment.
Similar results are found in other hydrological assessments of the Bergen region. Previous studies of the water resources under climate change project higher temperatures and increased annual precipitation in the Bergen region for the 2071–2100 future period under the RCP8.5 scenario (Kristvik et al., 2018; Kristvik and Riisnes, 2015). Kristvik et al. (2018) based their assessment on statistical downscaling of an ensemble of RCPs and GCMs, followed by simulations of the hydrological response in terms of inflow to surface water reservoirs. Due to higher temperatures and more rainfall precipitation, strong increases in winter flow were found, while a decrease was projected in spring–summer months due to less snowmelt (Kristvik et al., 2018).
The Hanssen-Bauer et al. (2015) report for western Norway shows that the mean winter and autumn flows increase by 15 % to 42 % and by 5 % to 36 %, respectively, by 2100. The report also predicts that the mean spring flow will decrease up to 9 % and will increase up to 17 %, and the mean summer flow will decrease by 13 % to 28 % by 2100. The findings of our study show that the increase in mean winter flow is higher than the maximum prediction reported by Hanssen-Bauer et al. (2015) for four catchments and up to the higher end of the prediction in the report for the remaining two catchments. In our study, a reduction in mean summer flows was higher than the reduction in the report in four catchments. The findings of this study show that the increase in the mean spring flow is within the prediction interval of the report for three catchments and higher than the maximum prediction values of the report for the remaining three catchments. Wong et al. (2011) studied the differences in hydrological drought characteristics in the summer season of Norway between the periods 1961–1990 and 2071–2100 using the Hydrologiska Byråns Vattenbalansavdelning (HBV) hydrological model with daily temporal resolution and found that substantial increases in hydrological drought duration and drought-affected areas are expected in Norway, which aligns with our findings. The Ministry of the Environment of Norway (2009) pointed out that the summer flow in Norway is projected to be reduced and supports the findings of our study.
Climate change affects the snowpack and the amount of water stored in the snowpack (SWE). Increased winter temperature will generally lead to a reduction in snow storage, and hence the mean maximum SWE will also be reduced in the future. The results of this study show that there will be a reduction in the mean maximum SWE at all the catchments in the future period. The reduction ranges from 48 % to 78 %. The largest reduction is found to be at the catchment with the highest mean elevation value (catchment 1). Snow accumulation and its characteristics are the results of air temperature, precipitation, wind, and the amount of moisture in the atmosphere. Therefore, changes in these and other climatic properties can affect snowpack and hence maximum SWE. In our study, there is an increase in temperature for all study catchments in the future period, and the increase resulted in rain replacing the snow share, which gives rise to the reduction of mean annual maximum SWE at all the study catchments.
4.2.2 Changes in flow duration curves (FDCs)
The results of this study show that climate change affects the FDCs of the study catchments. The future FDCs are higher than the FDCs of the reference period at all catchments for all probability of exceedances (Fig. 4). The FDCs of all the study catchment show that the low flows increase in the future, and there will be longer periods with higher flows in the future period than in the reference period.
4.2.3 Changes in WSCV and autumn CV dates
The results for the mean winter–spring center of volume date (WSCV) showed that WSCV will occur earlier. While the mean autumn CV date came to be later for all the study catchments. The change in WSCV dates is related to the amount and timing of spring snowmelt and warmer winter temperature. The earlier mean WSCV date in the future period is the result of increased precipitation falling during a warmer winter, reduced snow storage, early snowmelt, and warmer spring temperature. The late occurrence of autumn CV dates is related to the higher precipitation and temperature projected in autumn in the future period. The warmer temperature in the future period makes the major proportion of future precipitation happen as rain, especially in the months of November and December. This condition causes the future bulk of high flows to occur towards the end of a year, which will result in the autumn CV dates occurring later. The finding in our study is supported by the finding of Blöschl et al. (2017); i.e., in the southwestern part of Norway, there is a shift towards later floods due to climate change in the same period at the end of a year (October–December).
4.3 Changes in the maximum flows and flood frequency
4.3.1 Annual and seasonal maximum flows
In the future period (2070–2100), the results of this study show that there will be an increase in the mean and median of the annual and the seasonal maximum flows (Tables 7 and 8 and Fig. 5) for all the study catchments except for the spring season for catchment 2. Most (15–23 of the 30 annual maximum floods) of the maximum annual flows occur during the autumn period (1 September to 30 November), and therefore much of the contribution to the increment of the mean and median annual maximum flows stems from the autumn season (Fig. 5). The second largest contributor to the increment of the mean and median annual maximum flows is the winter season (Fig. 5). In the future period, the winter maximum flows will increase in magnitude and frequencies as a substantial amount of precipitation falls as rain in a warmer climate. The mean summer maximum flows show the least increment in the future period (1 % to 21 %). The finding that the mean annual maximum flows (floods) show an increase of 29 % to 38 % is supported by the study of Lawrence and Hisdal (2011). Lawrence and Hisdal (2011) have done ensemble modeling based on locally adjusted precipitation and temperature data from 13 regional climate scenarios in order to assess the likely changes in hydrological floods between a reference period (1960–1990) and two future periods (2021–2050 and 2071–2100), in 115 catchments distributed throughout Norway. Their results showed that western regions of Norway are associated with the largest percentage increases in the magnitude of the mean annual floods (greater than 20 %). Lawrence and Hisdal (2011) also pointed out that the increase in autumn and winter rainfall increases the magnitude of peak flows (floods) during these seasons throughout Norway. For areas already dominated by autumn and winter floods, the projected increases in flood magnitude are large. Lawrence and Hisdal (2011) findings support the findings in this study; i.e., the maximum increases in floods magnitude are expected to happen in the autumn and winter seasons (Table 7 and Fig. 5).
The yearly average number of 3 h flood values, which are greater than the minimum of the annual maximum floods in the 30 years of the reference period, increases. The yearly average number of such floods increase between 62 % and 133 % across all study catchments as presented in Table 8. The results show that there will be a greater number of 3 h floods in the future period than the reference period, and this could increase flood risks at the infrastructure constructed downstream of small ungauged rural catchments in the Bergen region of west Norway. The European Environmental Agency in Alcamo et al. (2007) found that the risk of floods will increase in northern Europe (e.g., Norway), which supports our finding of an increase in the risk of floods. The center for International Climate Research (https://cicero.oslo.no, last access: 27 July 2019) predicts that western Norway will experience more heavy rain and flooding in the future. Our finding confirms their predictions.
4.3.2 Changes in flood frequency
For all return periods, the mean increases in floods were between 31 % and 32 % while the median increases were between 30 % and 34 %. The increase in the 2- to 10-year floods is more than 20 % for all study catchments, and the 20- to 200-year flood increase is greater than 20 % for five of the study catchments. The 50-year flood will increase by 18 % to 40 % in the future periods. The results also show that the increase in the 200-year floods is greater than 30 % for four of the six study catchments (one catchment between 10 % and 20 %, one catchment between 20 % and 30 %, two catchments between 30 % and 40 %, and two catchments between 40 % and 50 %).
Beldring et al. (2006) studied the percentage change in the mean annual floods and the 50-year floods in four catchments in Norway between 1961–1990 and 2070–2100 and found that moderate to large increases are expected (one of the study catchments is in western Norway – Viksvatn in Gaular). the findings of Beldring et al. (2006) support the findings in this study. Lawrence and Hisdal (2011) have found that the projected increase in the 200-year floods exceeds 40 % for some of the catchments in western Norway between the 1961–1990 reference period and the 2071–2100 future period, which is in agreement with our findings. Lawrence (2016) used ensembles of EURO-CORDEX regional climate projection data to force the HBV hydrological model for assessing possible effects of climate change on floods in 115 catchments in Norway for two future periods (2031–2060 and 2071–2100). The assessment result shows that the minimum increase in the 200-year flood, for catchments less than 100 km2 at Hordaland county (where study catchments are located), is 20 %, which is generally in agreement with our findings; i.e., five of the six catchments show an increase greater than 20 % for 200-year floods.
Lawrence (2016) showed that the increase in the 200-year flood is higher for RCP8.5 than RCP4.5 in Hordaland county. Not surprising that the choice of RCP has a significant effect on the results of the 200-year flood frequency. Of the 115 catchments used in the study for all of Norway, 10 of them are in Hordaland county. With the RCP4.5 scenario, eight of the 10 catchments showed an increase of less than 20 % (one catchment a decrease, two catchments an increase between 1 % and 10 %, five catchments an increase between 11 % and 20 %), and two catchments show an increase greater than 20 % (one catchment an increase between 21 % and 30 % and one catchment an increase between 31 % and 40 %). With the RCP8.5 scenario, seven of the 10 catchments show an increase of greater than 20 % (three catchments an increase between 21 % and 30 % and four catchments an increase between 31 % and 40 %), and three catchments show an increase of less than 20 % (one catchment a change of less than 0 % and two catchments an increase between 11 % and 20 %). Generally, our finding with RCP8.5 is similar to the Lawrence (2016) finding with RCP8.5 except that our finding shows an increase higher than 40 % for two of the study catchments.
The main differences between this present study and the Lawrence (2016) study are the number and types of climate models, RCPs, catchment sizes, and temporal resolution. The comparisons of the increase in floods are mainly done in the same county (Hordaland county where Bergen is located) and the area is mainly dominated by floods generated by rain in the autumn season. However, in the Lawrence (2016) study, the catchment sizes were ranged from 6 to 15 449 km2 and 10 global–regional models with RCP8.5 and RCP4.5 were used. The temporal resolution, used in the Lawrence (2016) study, was daily, and these daily data have been bias corrected after the GCM–RCM chain. Changes in floods, higher than 40 % for some catchments in our findings, are related to the differences in the climate models, in the bias correction method, in the temporal resolutions used, and in the hydrological models used, in the sizes of the catchments and capability of the DDD model in predicting 3-hourly floods in small catchments. Our findings are based on the RCP8.5 scenario which can be used as a worst-case scenario in the Bergen area in the southwestern part of Norway.
4.4 Limitations
There are limitations in this study which are related to the DDD model and the climate model. A first limitation is related to the DDD model parameters. In this study, we have used the regionalization method developed for 1 h (Tsegaw et al., 2019) to estimate the DDD model parameters for the 3 h simulation. DDD model parameters like degree hour factor for evapotranspiration (Cea) and degree hour factors for snowmelt (Cx) are sensitive to the temporal resolution. However, the same uncertainty is present in both the reference and future periods. The second limitation is related to the simple degree evaporation model used in the DDD model. Table 4 shows large changes in actual evapotranspiration. The large change in actual evapotranspiration tells us that in the future period there will be more water available (to evaporate) and higher temperature (to cause evaporation) than in the reference period; however, there is a limitation with the simple evaporation model since actual evaporation is not only affected by temperature but also affected by additional climatological factors like wind speed, humidity, cloudiness, etc. This limitation could also be the reason for a large change of actual evapotranspiration between the reference (1981–2011) and the future periods (1970–2100). A third possible limitation is that the DDD model parameters are assumed to be constant under changing climatic conditions, and the same parameter sets are used for the reference and future period simulations. However, studies show that using the same parameter sets for the reference and future periods under climate impact studies can have a significant impact on the simulation results (Merz et al., 2011). A fourth limitation is that the modeled changes in the hydroclimatic variables and flood frequency are derived from a single GCM–RCM model chain using only the RCP8.5 scenario. Thereby, we are not able to capture the GCM–RCM uncertainties usually found by handling model ensembles. However, this simulation has the benefit of a high spatial resolution for a better representation of small-scale features, and additionally a novel bias correction method has been applied prior to the downscaling to ensure physical consistency between temperature and precipitation variables used as input to the hydrological model.
This paper represents one realization of a climate scenario, and we recommend applying the method of Pontoppidan (2018) to other GCMs to capture model uncertainties. Further, the comparison done between our study and other studies shows that our findings are supported by the results of other studies except for a few differences. Therefore, our findings can give a useful addition to the current understandings of the effects of changing climate on the west coast of Norway. Other combinations of GCMs–RCMs–RCPs predict varieties of future climate change signals which could potentially result in different hydroclimatic and flood predictions for the same study catchments. Therefore, the results of this study alone should not be taken as conclusive of what will be seen in the future but could be of practical use to regional decision-makers if considered alongside other previous and future findings.
In this study a new bias-corrected dynamical downscaling product as input for the improved DDD model to investigate the impact of climate change in small ungauged catchments in western Norway was developed. The results show that there will be an increase in the mean annual flow for the future period (2070–2100). The increase in the mean annual flow is due to the increase in the mean autumn, winter, and spring flows in the future period (2070–2100) compared to the reference period (1981–2011). In the future period, the mean summer flow decreases for all the study catchments except one. The future flow duration curves are higher than the flow duration curves of the reference period for all study catchments for all probability of exceedances. The median flow (flows which are exceeded 50 % of the time) increased by 24 % to 140 %. The FDCs of all study catchments show that the low flows increase in the future, and there will be more wetter periods in the future than in the reference period.
There will be an increase in the mean annual floods and floods with 2- to 200-year return periods in the future period. The mean annual maximum floods increase by 29 % to 38 %. This study gives a clear indication that the projected increase in flood frequencies is high (e.g., 200-year floods greater than 40 %) in small catchments around Bergen in western Norway. Such catchments will be more vulnerable to flood risk under the projected future climate. The high-resolution regional climate model with a novel bias correction method improves the knowledge and understanding of climate change impacts on a hydrology of small catchments in western Norway. However, it is important to conduct further research to address the limitations of this study prior to conducting flood risk assessment and planning flood risk management strategies as a national strategy for climate change adaptation.
These simulations are based on high-resolution regional climate model projection with a novel bias correction method and address limitations in previous impact studies where such projections have not yet been available. The simulations also enable in-depth analysis of the impacts of climate change on rapid hydrological processes. An ensemble of GCM–RCM runs building on the results of this paper is suggested as a venue for further work in order to account for uncertainties in the RCP scenarios and climate projections and thus provide more reliable recommendations for infrastructure design and adaptation.
Table A1List of DDD model parameters estimated from observed precipitation data and those estimated from regionalization (multiple regression) for the study catchments.
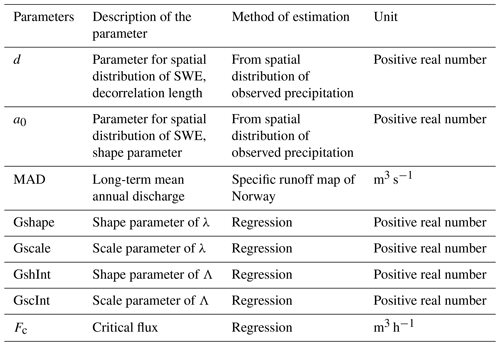
Table A2List of DDD rainfall–runoff model parameters estimated from pooling groups of physical similarity methods of regionalizations.
The hydrological data, used in this research work, can be accessed by contacting Aynalem Tsegaw Tasachew (aynalemtassachew1982@gmail.com) and the climate data, for the reference and future periods, can be accessed by contacting Marie Pontoppidan (mapo@norceresearch.no).
ATT contributed to the design of the study, prepared and ran the hydrological model, interpreted the results, and prepared the manuscript. MP carried out the downscaling and ran the climate model simulations. She also contributed to the interpretation and analysis of the results. EK contributed to the design of the study and to the hydrological analysis based on climate data input. KA contributed to the design of the study, supervision of the research work, and the development of the manuscript. TMM coordinated the work, contributed to drafting of the paper, and was responsible for the project. All authors contributed to preparation of the final version of the manuscript.
The authors declare that they have no conflict of interest.
This article is part of the special issue “Integrated assessment of climate change impacts at selected European research sites – from climate and hydrological hazards to risk analysis and measures”. It is not associated with a conference.
The authors would like to acknowledge the Norwegian Climate Service Centre for providing gridded precipitation and temperature climate data for western Norway. The authors would also like to acknowledge Thomas Skaugen of the Norwegian Water Resources and Energy Directorate (NVE) for providing the DDD model. The authors gratefully acknowledge the financial support from the Bingo (EU Horizon 2020, grant agreement 641739) and Extnd-Bingo projects, Research Council of Norway (RCN) through R3 (grant 255397), and the Centre for Research-based Innovation “Klima 2050” (http://www.klima2050.no/, last access: 29 September 2019). We would also like to acknowledge UNINETT Sigma2 for providing computer resources for the regional downscaling.
This research has been supported by the Bingo and ExtndBingo project (EU Horizon 2020) (grant no. 641739) and the Research Council of Norway (RCN) through R3 (grant no. 255397) and the Centre for Research-based Innovation “Klima 2050”.
This paper was edited by Henning W. Rust and reviewed by two anonymous referees.
Alcamo, J., Flörke, M., and Märker, M.: Future long-term changes in global water resources driven by socio-economic and climatic changes, Hydrolog. Sci. J., 52, 247–275, https://doi.org/10.1623/hysj.52.2.247, 2007.
Alfieri, L., Burek, P., Feyen, L., and Forzieri, G.: Global warming increases the frequency of river floods in Europe, Hydrol. Earth Syst. Sci., 19, 2247–2260, https://doi.org/10.5194/hess-19-2247-2015, 2015.
Azad, R. and Sorteberg, A.: Extreme daily precipitation in coastal western Norway and the link to atmospheric rivers, J. Geophys. Res-Atmos., 122, 2080–2095, https://doi.org/10.1002/2016JD025615, 2017.
Baltas, E. A.: Impact of Climate Change on the Hydrological Regime and Water Resources in the Basin of Siatista, Int. J. Water Resour. D., 23, 501–518, https://doi.org/10.1080/07900620701485980, 2007.
Beldring, S., Roald, L. A., Engen-Skaugen, T., and Førland, E. J.: Climate Change Impacts on Hydrological Processes in Norway 2071–2100. Based on RegClim HIRHAM and Rossby Centre RCAO Regional Climate Model Results. Norwegian Water Resources and Energy Directorate, Oslo, Norway, 2006.
Bhagat, N.: Flood Frequency Analysis Using Gumbel's Distribution Method: A Case Study of Lower Mahi Basin, India, J. Water Resour. Ocean Sci., 6, 51–54, https://doi.org/10.11648/j.wros.20170604.11, 2017.
Blöschl, G., Hall, J., Parajka, J., Perdigão ,R., Merz, B., Arheimer, B., T. Aronica, G., Bilibashi, A., Bonacci, O., Borga, M., Čanjevac, I., Castellarin, A., B. Chirico, G., Claps, P., Fiala, K., Frolova, N., Gorbachova, L., Gül, A., Hannaford, J., Harrigan, S., Kireeva, M., Kiss, A., R. Kjeldsen, T., Kohnová, S. J., Koskela, J., Ledvinka, O., Macdonald, N., Mavrova-Guirguinova, M., Mediero, L., Merz, R., Molnar, P., Montanari, A., Conor Murphy, C., Osuch, M., Ovcharuk, V., Radevski, I., Rogger, M. L., Salinas, J., Sauquet, E., Šraj, M., Szolgay, J., Viglione, A., Volpi, E., Wilson, D., Zaimi, K., and Živković, N.: Changing climate shifts timing of European floods, Science, 357, 588–590, https://doi.org/10.1126/science.aan2506, 2017.
Blöschl, G., Hall, J., Viglione, A., Parajka, J., Perdigão ,R., Merz, B., Lun, D., Arheimer, B., Aronica, G., Bohac, M., Bonacci, O., Borga, M., Čanjevac, I., Castellarin, A., Chirico, G., Claps, P., Fiala, K., Frolova, N., Ganora, D., Gorbachova, L., Gül, A., Hannaford, J., Harrigan, S., Kireeva, M., Kiss, A., Kjeldsen, T., Kohnová, S. J., Koskela, J., Ledvinka, O., Macdonald, N., Mavrova-Guirguinova, M., Mediero, L., Merz, R., Molnar, P., Montanari, A., Murphy, C., Osuch, M., Ovcharuk, V., Radevski, I., Rogger, M., Salinas, J., Sauquet, E., Šraj, M., Szolgay, J., Viglione, A., Volpi, E., Wilson, D., Zaimi, K., and ŽŽivković, N.: Changing climate both increases and decreases European river floods, Nature, 573, 108–111, https://doi.org/10.1038/s41586-019-1495-6, 2019.
Borga, M., Anagnostou, E. N., Blöschl, G., and Creutin, J. D.: Flash flood forecasting, warning and risk management: the HYDRATE project, Environ. Sci. Policy, 14, 834–844, https://doi.org/10.1016/j.envsci.2011.05.017, 2011.
Bruyère, C. L., Done, J. M., Holland, G. J., and Fredrick, S.: Bias corrections of global models for regional climate simulations of high-impact weather, Clim. Dynam., 43, 1847–1856, https://doi.org/10.1007/s00382-013-2011-6, 2014.
Bruyère, C. L., Monaghan, A. J., Steinhoff, D. F., and Yates, D: Bias-Corrected CMIP5 CESM Data in WRF/MPAS Intermediate File Format, NCAR Technical Note NCAR/TN-515+STR, NCAR – National Center for Atmospheric Research, Boulder, Colorado, https://doi.org/10.5065/D6445JJ7, 2015.
Chernet, H. H., Alfredsen, K., and Midttømme, G. H.: Safety of Hydropower Dams in a Changing Climate, J. Hydrol. Eng., 19, 569–582, https://doi.org/10.1061/(ASCE)HE.1943-5584.0000836, 2014.
Christensen, J. H., Boberg, F., Christensen, O. B., and Lucas-Picher, P.: On the need for bias correction of regional climate change projections of temperature and precipitation, Geophys. Res. Lett. , 35, L20709, https://doi.org/10.1029/2008GL035694, 2008.
Dankers, R. and Feyen, L.: Climate Change Impact on Flood Hazard in Europe: An Assessment Based on High-Resolution Climate Simulations, J. Geophys. Res., 113, D19105, https://doi.org/10.1029/2007JD009719, 2008.
Donnelly, C., Greuell, W., Andersson, J., Gerten, D., Pisacane, G., Roudier, P., and Ludwig, F.: Impacts of climate change on European hydrology at 1.5, 2 and 3 degrees mean global warming above preindustrial level, Climatic Change, 143, 13–26, https://doi.org/10.1007/s10584-017-1971-7, 2017.
Eisenreich, S. J., Bernasconi, C., Campostrini, P., De Roo, A., George, G., and Heiskanen, A.: Climate change and the European water dimension, European Commission – Joint Research Centre, Ispra, Italy, EUR 21553, 253 pp., 2005.
Fleig, A. K. and Wilson, D.: Flood estimation in small catchments: literature study, in: Naturfareprosjektet, Rapport (Norges vassdrags- og energidirektorat: online), Norwegian Water Resources and Energy Directorate, Oslo, 2013.
Golz, S., Naumann, T., Neubert, M., and Günther, B.: Heavy rainfall: An underestimated environmental risk for buildings?, in: E3S Web Conf., Vol. 7, 3rd European Conference on Flood Risk management, 08001, https://doi.org/10.1051/e3sconf/20160708001, 2016.
Groen, R., Jespersen, M., de Jong, K., and Olsson, J.: Climate change impacts and uncertainties in flood risk management: Examples from the North Sea Region, Norwegian Water Resources and Energy Directorate, Oslo, 2012.
Hanssen-Bauer, I., Førland, E. J., Haddeland, I., Hisdal, H., Mayer, S., Nesje, A., Nilsen, J. E. Ø., Sandven, S., Sandø, A. B., and Ådlandsvik, A. S. O. B.: Klima I Norge 2100, Miljø Direktoratet, Oslo, 2015.
Hattermann, F., Kundzewicz, Z., Becker, C., Castelletti, A., Gooch, G., Kaden, S., de Lange, W., Laurans, Y., Muhar, S., Pahl-Wostl, C., Soncini-Sessa, R., Stålnacke, P., and Willems, P.: Water Framework Directive: Model supported Implementation, A Water Manager's Guide, IWA Publishing, London, UK, 2009.
Hodgkins, G. A., Dudley, R., and Huntington, T.: Changes in the Timing of High River Flows in New England Over the 20th Century, J. Hydrol., 278, 244–252, https://doi.org/10.1016/S0022-1694(03)00155-0, 2003.
IPCC: Summary for Policymakers, in: Global Warming of 1.5 ∘C, An IPCC Special Report on the impacts of global warming of 1.5 ∘C above pre-industrial levels and related global greenhouse gas emission pathways, in the context of strengthening the global response to the threat of climate change, sustainable development, and efforts to eradicate poverty, edited by: Masson-Delmotte, V., Zhai, P., Pörtner, H.-O., Roberts, D., Skea, J., Shukla, P. R., Pirani, A., Moufouma-Okia, W., Péan, C., Pidcock, R., Connors, S., Matthews, J. B. R., Chen, Y., Zhou, X., Gomis, M. I., Lonnoy, E., Maycock, T., Tignor, M., and Waterfield, T., World Meteorological Organization, Geneva, Switzerland, 32 pp., 2018.
Jacob, D., Petersen, J., Eggert, B., Alias, A., Christensen, O. B., Bouwer, L. M., Braun, A., Colette, A., Déqué, M., Georgievski, G., Georgopoulou, E., Gobiet, A., Menut, L., Nikulin, G., Haensler, A., Hempelmann, N., Jones, C., Keuler, K., Kovats, S., Kröner, N., Kotlarski, S., Kriegsmann, A., Martin, E., van Meijgaard, E., Moseley, C., Pfeifer, S., Preuschmann, S., Radermacher, C., Radtke, K., Rechid, D., Rounsevell, M., Samuelsson, P., Somot, S., Soussana, J.-F., Teichmann, C., Valentini, R., Vautard, R., Weber, B., and Yiou, P.: EURO-CORDEX: new high-resolution climate change projections for European impact research, Reg. Environ. Change., 14, 563–578, https://doi.org/10.1007/s10113-10014-10587-y https://doi.org/10.1007/s10113-014-0587-y, 2014.
Kim, E. S. and Choi, H. I.: Estimation of the relative severity of floods in small ungauged catchments for preliminary observations on flash flood preparedness: a case study in Korea, Int. J. Environ. Res. Publ. Health., 9, 1507–1522, https://doi.org/10.3390/ijerph9041507, 2012.
Kotlarski, S., Keuler, K., Christensen, O. B., Colette, A., Déqué, M., Gobiet, A., Goergen, K., Jacob, D., Lüthi, D., van Meijgaard, E., Nikulin, G., Schär, C., Teichmann, C., Vautard, R., Warrach-Sagi, K., and Wulfmeyer, V.: Regional climate modeling on European scales: a joint standard evaluation of the EURO-CORDEX RCM ensemble, Geosci. Model Dev., 7, 1297–1333, https://doi.org/10.5194/gmd-7-1297-2014, 2014.
Kristvik, E., Muthanna, T. M., and Alfredsen, K.: Assessment of future water availability under climate change, considering scenarios for population growth and ageing infrastructure, J. Water. Clim. Change., 10, 1–12, https://doi.org/10.2166/wcc.2018.096, 2018.
Kristvik, E. and Riisnes, B.: Hydrological Assessment of Water Resources in Bergen, MS thesis, Norwegian University of Science and Technoloy, Trøndheim, Norway, 2015.
Krysanova, V., Vetter, T., and Hattermann, F.: Detection of change in drought frequency in the Elbe basin: comparison of three methods, Hydrolog. Sci. J., 53, 519–537, https://doi.org/10.1623/hysj.53.3.519, 2008.
Kundzewicz, Z. W., Kanae, S., Seneviratne, S. I., Handmer, J., Nicholls, N., Peduzzi, P., Mechler, R., Bouwer, L. M., Arnell, N., Mach, K., Muir-Wood, R., Brakenridge, G. R., Kron, W., Benito, G., Honda, Y., Takahashi, K., and Sherstyukov, B.: Flood risk and climate change: global and regional perspectives, Hydrolog. Sci. J., 59, 1–28, https://doi.org/10.1080/02626667.2013.857411, 2014.
Lawrence, D.: Klimaendring og framtidige flommer i Norge. avdeling, Norges vassdrags-og energidirektorat, Oslo, 2016.
Lawrence, D. and Hisdal, H.: Hydrological projections for floods in Norway under a future climate, NVE – Norwegian Water Resources and Energy Directorate, Oslo, Norway, 2011.
Lespinas, F., Ludwig, W., and Heussner, S.: Hydrological and climatic uncertainties associated with modeling the impact of climate change on water resources of small Mediterranean coastal rivers, J. Hydrol., 511, 403–422, https://doi.org/10.1016/j.jhydrol.2014.01.033, 2014.
Li, Z.: Watershed modeling using arc hydro based on DEMs: a case study in Jackpine watershed, Environ. Syst. Res., 3, 1–11, https://doi.org/10.1186/2193-2697-3-11, 2014.
López-Moreno, J. I., Pomeroy, J. W., Revuelto, J., and Vicente-Serrano, S. M.: Response of snow processes to climate change: spatial variability in a small basin in the Spanish Pyrenees, Hydrol. Process., 27, 2637–2650, https://doi.org/10.1002/hyp.9408, 2013.
Madsen, H., Lawrence, D., Lang, M., Martinkova, M., and Kjeldsen, T. R.: Review of trend analysis and climate change projections of extreme precipitation and floods in Europe, J. Hydrol., 519, 3634–3650, https://doi.org/10.1016/j.jhydrol.2014.11.003, 2014.
Mallakpour, I. and Villarini, G.: The changing nature of flooding across the central United States, Nat. Clim. Change., 5, 250–254, https://doi.org/10.1038/nclimate2516, 2015.
Maraun, D.: Nonstationarities of regional climate model biases in European seasonal mean temperature and precipitation sums, Geophys. Res. Lett., 39, L06706, https://doi.org/10.1029/2012GL051210, 2012.
Maraun, D.: Bias Correcting Climate Change Simulations - a Critical Review, Curr. Clim. Change Rep., 2, 211–220, https://doi.org/10.1007/s40641-016-0050-x, 2016.
Maraun, D., Shepherd, T., Widmann, M., Zappa, G., Walton, D., Gutiérrez, J., Hagemann, S., Richter, I., Soares, P., Hall, A., and Mearns, L.: Towards process-informed bias correction of climate change simulations, Nat. Clim. Change, 7, 764–773, https://doi.org/10.1038/nclimate3418, 2017.
Menzel, L., Niehoff, D., Bürger, G., and Bronstert, A.: Climate change impacts on river flooding: A modelling study of three meso-scale catchments, Climatic Change, 10, 249–269, https://doi.org/10.1007/1000-1306-47983-47984_47914, 2006.
Merz, R., Parajka, J., and Blöschl, G.: Time stability of catchment model parameters: Implications for climate impact analyses, Water Resour. Res., 47, W02531, https://doi.org/10.1029/2010WR009505, 2011.
Ministry of the Environment of Norway: Norway's Fifth National Report under the United Nation's Framework Convention on Climate Change, Norwegian Ministry of the Environment, Oslo, Norway, 2009.
Muerth, M. J., Gauvin St-Denis, B., Ricard, S., Velázquez, J. A., Schmid, J., Minville, M., Caya, D., Chaumont, D., Ludwig, R., and Turcotte, R.: On the need for bias correction in regional climate scenarios to assess climate change impacts on river runoff, Hydrol. Earth Syst. Sci., 17, 1189–1204, https://doi.org/10.5194/hess-17-1189-2013, 2013.
Olsson, J., Arheimer, B., Borris, M., Donnelly, C., Foster, K., Nikulin, G., Persson, M., Perttu, A.-M., Uvo, C. B., Viklander, M., and Yang, W.: Hydrological Climate Change Impact Assessment at Small and Large Scales: Key Messages from Recent Progress in Sweden, Climate, 4, 39, https://doi.org/10.3390/cli4030039, 2016.
Pontoppidan, M., Kolstad, E. W., Sobolowski, S., and King, M. P.: Improving the Reliability and Added Value of Dynamical Downscaling via Correction of Large-Scale Errors: A Norwegian Perspective, J. Geophys. Res-Atmos., 123, 875–811, https://doi.org/10.1029/2018JD028372, 2018.
Pontoppidan, M., Reuder, J., Mayer, S., and Kolstad, E. W.: Downscaling an intense precipitation event in complex terrain: the importance of high grid resolution, Tellus A, 69, 1271561, https://doi.org/10.1080/16000870.2016.1271561, 2017.
Pumo, D., Caracciolo, D., Viola, F., and Noto, L. V.: Climate change effects on the hydrological regime of small non-perennial river basins, Sci. Total Environ., 542, 76–92, https://doi.org/10.1016/j.scitotenv.2015.10.109, 2016.
Quintero, F., Mantilla, R., Anderson, C., Claman, D., and Krajewski, W.: Assessment of Changes in Flood Frequency Due to the Effects of Climate Change: Implications for Engineering Design, Hydrology, 5, 1–19, https://doi.org/10.3390/hydrology5010019, 2018.
Rasmussen, R., Liu, C., Ikeda, K., Gochis, D., Yates, D., Chen, F., Tewari, M., Barlage, M., Dudhia, J., Yu, W., Miller, K., Arsenault, K., Grubišiæ, V., Thompson, G., and Gutmann, E.: High-Resolution Coupled Climate Runoff Simulations of Seasonal Snowfall over Colorado: A Process Study of Current and Warmer Climate, J. Climate, 24, 3015–3048, https://doi.org/10.1175/2010JCLI3985.1, 2011.
Richardson, D.: Flood risk – the impact of climate change, Proc. Inst. Civ. Eng., 150, 22–24, https://doi.org/10.1680/cien.2002.150.5.22, 2002.
Roald, L. A.: Rainfall floods and weather patterns, Report, Norwegian Water Resources and Energy Directorate, Oslo, Norway, 2008.
Rocheta, E., Evans, J. P., and Sharma, A.: Can Bias Correction of Regional Climate Model Lateral Boundary Conditions Improve Low-Frequency Rainfall Variability?, J. Climate, 30, 9785–9806, https://doi.org/10.1175/JCLI-D-16-0654.1, 2017.
Rojas, R., Feyen, L., and Watkiss, P.: Climate change and river floods in the European Union: Socio-economic consequences and the costs and benefits of adaptation, Global Environ. Change, 23, 1737–1751, https://doi.org/10.1016/j.gloenvcha.2013.08.006, 2013.
Schär, C., Frei, C., Lüthi, D., and Davies, C.: Surrogate climate-change scenarios for regional climate models, Geophys. Res. Lett., 23, 669–672, https://doi.org/10.1029/96GL00265, 1996.
Searcy, J.: Flow-duration curves, US Geological Survey water supply paper 1542-A, US Geological Survey, Washington, D.C., 1959.
Shaw, E. M.: Hydrology in Practice, Van Nostrand Reinhold, UK, 1983.
Skamarock, W. C., Klemp, J. B., Dudhia, J., Gill, D. O., Barker, D. M., Duda, M. G., Huang, X. Y., Wang, W., and Powers, J. G.: A Description of the Advanced Research WRF Version 3, NCAR Technical Note NCAR/TN-475+STR, Mesoscale and Microscale Meteorology Division, National Center for Atmospheric Research, Boulder, 2008.
Skaugen, T. and Mengistu, Z.: Estimating catchment-scale groundwater dynamics from recession analysis – enhanced constraining of hydrological models, Hydrol. Earth Syst. Sci., 20, 4963–4981, https://doi.org/10.5194/hess-20-4963-2016, 2016.
Skaugen, T. and Onof, C.: A rainfall-runoff model parameterized from GIS and runoff data, Hydrol. Process., 28, 4529–4542, https://doi.org/10.1002/hyp.9968, 2014.
Skaugen, T., Peerebom, I. O., and Nilsson, A.: Use of a parsimonious rainfall–run-off model for predicting hydrological response in ungauged basins, Hydrol. Process., 29, 1999–2013, https://doi.org/10.1002/hyp.10315, 2015.
Skaugen, T. and Weltzien, I. H.: A model for the spatial distribution of snow water equivalent parameterized from the spatial variability of precipitation, The Cryosphere, 10, 1947–1963, https://doi.org/10.5194/tc-10-1947-2016, 2016.
Thornes, J. E.: IPCC, 2001: Climate change 2001: impacts, adaptation and vulnerability, in: Contribution of Working Group II to the Third Assessment Report of the Intergovernmental Panel on Climate Change, edited by: McCarthy, J. J., Canziani, O. F., Leary, N. A., Dokken, D. J., and White, K. S., Cambridge University Press, Cambridge, UK, and New York, USA, 2001, Int. J. Climatol., 22, 1285–1286, https://doi.org/10.1002/joc.1775, 2002.
Tofiq, F. A. and Guven, A.: Prediction of design flood discharge by statistical downscaling and General Circulation Models, J. Hydrol., 517, 1145–1153, https://doi.org/10.1016/j.jhydrol.2014.06.028, 2014.
Tramblay, Y., Ruelland, D., Somot, S., Bouaicha, R., and Servat, E.: High-resolution Med-CORDEX regional climate model simulations for hydrological impact studies: a first evaluation of the ALADIN-Climate model in Morocco, Hydrol. Earth Syst. Sci., 17, 3721–3739, https://doi.org/10.5194/hess-17-3721-2013, 2013.
Tsegaw, A. T., Alfredsen, K., Skaugen, T., and Muthanna, T. M.: Predicting hourly flows at ungauged small rural catchments using a parsimonious hydrological model, J. Hydrol., 573, 855–871, https://doi.org/10.1016/j.jhydrol.2019.03.090, 2019.
Tsegaw, A. T., Skaugen, T., Alfredsen, K., Tone M., and Muthanna, T. M.: A dynamic river network method for the prediction of floods using a parsimonious rainfall-runoff model, Hydrol. Res., 51, 146–168, https://doi.org/10.2166/nh.2019.003, 2020.
Vannitsem, S.: Bias correction and post-processing under climate change, Nonlin. Processes Geophys., 18, 911–924, https://doi.org/10.5194/npg-18-911-2011, 2011.
Veijalainen, N., Lotsari, E., Alho, P., Vehviläinen, B., and Käyhkö, J.: National Scale Assessment of Climate Change Impacts on Flooding in Finland, J. Hydrol., 391, 333–350, https://doi.org/10.1016/j.jhydrol.2010.07.035, 2010.
Vormoor, K., Lawrence, D., Heistermann, M., and Bronstert, A.: Climate change impacts on the seasonality and generation processes of floods – projections and uncertainties for catchments with mixed snowmelt/rainfall regimes, Hydrol. Earth Syst. Sci., 19, 913–931, https://doi.org/10.5194/hess-19-913-2015, 2015.
Wang, J. and Kotamarthi, V. R.: High-resolution dynamically downscaled projections of precipitation in the mid and late 21st century over North America, Earth's Future, 3, 268–288, https://doi.org/10.1002/2015EF000304, 2015.
Wong, W. K., Beldring, S., Engen-Skaugen, T., Haddeland, I., and Hisdal, H.: Climate Change Effects on Spatiotemporal Patterns of Hydroclimatological Summer Droughts in Norway, J. Hydrometeorol., 12, 1205–1220, 2011.
Xu, Z. and Yang, Z.: An Improved Dynamical Downscaling Method with GCM Bias Corrections and Its Validation with 30 Years of Climate Simulations, J. Climate, 25, 6271–6286, https://doi.org/10.1175/JCLI-D-12-00005.1, 2012.
Xu, Z. and Yang, Z.-L.: A new dynamical downscaling approach with GCM bias corrections and spectral nudging, J. Geophys. Res.-Atmos., 120, 3063–3084, https://doi.org/10.1002/2014JD022958, 2015.
Zappa, G., Shaffrey, L., and Hodges, K.: The Ability of CMIP5 Models to Simulate North Atlantic Extratropical Cyclones, J. Climate, 26, 5379–5396, https://doi.org/10.1175/JCLI-D-12-00501.1, 2013.


