the Creative Commons Attribution 4.0 License.
the Creative Commons Attribution 4.0 License.
Load-resistance analysis: an alternative approach to tsunami damage assessment applied to the 2011 Great East Japan tsunami
Anawat Suppasri
Kwanchai Pakoksung
Ingrid Charvet
Constance Ting Chua
Noriyuki Takahashi
Teraphan Ornthammarath
Panon Latcharote
Natt Leelawat
Fumihiko Imamura
Tsunami fragility functions describe the probability of structural damage due to tsunami flow characteristics. Fragility functions developed from past tsunami events (e.g., the 2004 Indian Ocean tsunami) are often applied directly, without modification, to other areas at risk of tsunami for the purpose of damage and loss estimations. Consequentially, estimates carry uncertainty due to disparities in construction standards and coastal morphology between the specific region for which the fragility functions were originally derived and the region where they are being used. The main objective of this study is to provide an alternative approach to assessing tsunami damage, especially for buildings in regions where previously developed fragility functions do not exist. A damage assessment model is proposed in this study, where load-resistance analysis is performed for each building by evaluating hydrodynamic forces, buoyancies and debris impacts and comparing them to the resistance forces of each building. Numerical simulation was performed in this study to reproduce the 2011 Great East Japan tsunami in Ishinomaki, which is chosen as a study site. Flow depths and velocities were calculated for approximately 20 000 wooden buildings in Ishinomaki. Similarly, resistance forces (lateral and vertical) are estimated for each of these buildings. The buildings are then evaluated for their potential of collapsing. Results from this study reflect a higher accuracy in predicting building collapse when using the proposed load-resistance analysis, as compared to previously developed fragility functions in the same study area. Damage is also observed to have likely occurred before flow depth and velocity reach maximum values. With the above considerations, the proposed damage model might well be an alternative for building damage assessments in areas that have yet to be affected by modern tsunami events.
- Article
(8020 KB) - Full-text XML
- BibTeX
- EndNote
The 2011 Great East Japan earthquake generated a large tsunami that damaged and destroyed more than 250 000 buildings (MLIT, 2012). Building damage characteristics from the 2011 event have since been well-studied and, in most cases, used to develop tsunami damage fragility functions (Suppasri et al., 2015). Tsunami damage fragility functions describe the probability of structural damage due to tsunami flow characteristics, i.e., flow depth, flow velocity and hydrodynamic force. Fragility functions have been developed from past events (e.g., the 2004 Indian Ocean, 2010 Chile and 2011 Great East Japan tsunamis) and are often applied directly, without modification, to other areas facing tsunami risk for damage and loss assessments (Suppasri et al., 2016). The resulting damage estimates carry uncertainty related to differences in construction standards and coastal morphology between the specific region for which the fragility functions were originally derived and the region where they are being used.
Tsunami fragility functions are modeled using tsunami flow characteristics and building damage information. In general, the methods for deriving tsunami fragility functions can be classified into four categories.
-
Empirical methods based on statistical analysis of observed post-tsunami damage data taken during a field survey (e.g., Peiris, 2006; Reese et al., 2007; Dias et al. 2009; Valencia et al., 2011; Suppasri et al., 2015; Charvet et al., 2017; Triantafyllou et al., 2019); maximum flow depths measured from tsunami water traces are typically used as explanatory variables of damage. Building damage data are obtained from on-site observations.
-
Hybrid techniques that combine tsunami hazard mapping (numerical simulation of tsunami inundation such as maximum flow depth, maximum flow velocity and maximum hydrodynamic force) with interpreted building damage data from remote sensing (e.g., Koshimura et al., 2009; Omira et al., 2010; Suppasri et al., 2011) or other damage datasets such as damaged marine vessels (Suppasri et al., 2014), damaged bridges (Shoji and Nakamura, 2017), and aquaculture rafts and eelgrass (Suppasri et al., 2018).
-
Heuristic fragility functions based on expert opinion such as HAZUS (FEMA, 2013) and the Papathoma Tsunami Vulnerability Assessment (PTVA) (Dall'Osso et al., 2016).
-
Analytical fragility functions based on structural modeling and response simulations (e.g., Macabuag et al., 2014; Nanayakkara and Dias, 2016; Attary et al., 2017).
Recent studies have shown tsunami hydrodynamic force to be an important explanatory parameter (Macabuag et al., 2016). Flow velocity at time of occurrence (Song et al., 2017) and floating debris (Macabuag et al., 2018) are both factors when assessing building damage. In order to obtain fragility functions for areas where tsunami data are not yet available, it is necessary to model the deterministic processes relating tsunami characteristics to the capacity of the structure to resist resulting loads. This allows for the structural characteristic information specific to the buildings of a region to be taken into account, as well as bypassing the use of potentially biased observed values for the explanatory variables. This study proposes an alternative approach to tsunami damage assessment by not relying on pre-developed fragility functions but investigating interactions between tsunami loading and the structural resistance of a system (in this case the resistance of a building) using an analytical model to infer tsunami damage. The objective is to provide an alternative approach to assessing tsunami damage, especially for buildings in areas where previously developed fragility functions do not exist. As part of this study, tsunami characteristics at the time of damage occurrence will be investigated and used in the proposed model to provide a complementary insight into the relationship between structural damage and tsunami flow characteristics.
The analytical model is defined following an overview of tsunami flow characteristics and their effects on buildings. Next, the study site and building damage dataset used to demonstrate the application of the model are presented. Two major components of the model are then discussed: tsunami numerical simulation and the estimation of resisting forces. Model results are compared to other building damage assessment estimates and observations in order to examine their applicability in building damage estimation. In addition, because structural damage is usually presented in a qualitative manner, most tsunami damage assessments may not be readily usable by private or governmental organizations. Therefore, a financial metric converting existing structural damage levels into financial cost ratios is proposed.
Damage by tsunamis to infrastructure is caused by many factors, such as tsunami force, impact of waterborne debris, building characteristics and scouring of foundations (Kelman and Spence, 2004). Forces generated by a tsunami can be estimated by classifying them according to their flow conditions and characteristics. Hydrodynamic force is generated by the pressure from flowing water around the structure and is influenced by flow velocity, depth and density of the water, as well as the geometry and angle at which the tsunami hits the structure (Nadal et al., 2009). When hydrodynamic force is used in tsunami science, it usually refers to the drag force, which is directly proportional to the square of flow velocity. Debris impact force is driven by tsunami flow. Tsunami-borne debris, while not a direct action of tsunami flow, can cause substantial damage to buildings. It can result in the reduction of load-bearing capacity in a building and, therefore, the reduction in structural resistance to lateral loads and buoyancy forces (Nadal et al., 2009).
The approach taken in this study is an adaptation from Latcharote et al. (2017), who analyzed and compared the overturning mechanism with the resisting moment for six overturned reinforced concrete buildings in Onagawa. Similarly, the proposed damage model performs load-resistance analysis for each building by evaluating hydrodynamic forces, buoyancy forces, and debris impacts and comparing them to the resistance of each building. There are two general types of resistance that a building provides. First, it provides lateral resistance, which is designed to counter loads that are perpendicular to and imposed on walls. Second, the weight of the buildings acts as downward-acting (vertical) resistance against buoyancy forces or upward-acting loads from wind and seismic activities. The resistance force from pile foundations was also one of the components examined in Latcharote et al. (2017). However, because wooden buildings were used for this study, the resistance force from pile foundations was not considered.
Global stability failure in a building can be a result of either sliding or overturning as a solitary body, often with minimal damage to structural and nonstructural components (Yeh et al., 2014). Overturning refers to the rotation of a building around its foundation where it has failed. Sliding, on the other hand, is the horizontal translation of a building from its original position (Yeh et al., 2014). The two mechanisms are modeled separately in this study to determine the predominant mechanism for building collapse. Differences in the forces and resistance involved in these mechanisms were considered when performing load-resistance analysis.
-
Sliding and non-submerged at the point of impact (Fig. 1a). Only horizontal hydrodynamic force, debris impact and lateral resistance of the building were considered in this case. A building collapses if the compounded hydrodynamic and debris impact forces are greater than the lateral resistance of the building.
-
Overturning and submerged (Fig. 1b). A building collapses when the overturning moment from hydrodynamic and buoyancy forces is greater than the resisting moment from the building weight. Under such circumstances, the building can either be fully submerged, as illustrated in Fig. 1b, or surrounded by water with no water inside. In the former case, when the building is completely inundated, forces from the exterior of the building are canceled out. The latter is the worst-case scenario and is assumed for subsequent analyses of overturning mechanisms in this study.
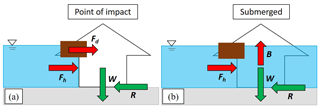
Figure 1Two failure mechanisms are considered in this study: (a) sliding and (b) overturning. The forces denoted are as follows: Fh = hydrodynamic force, Fd = debris impact force, R = lateral resistance, W = building weight and B = buoyancy force.
2.1 Selection of study site
There were many possible areas for studying building damage from the 2011 Great East Japan tsunami event. A suitable study site needs to be highly representative of the processes being modeled, without excessive contributions of un-modeled effects. In addition, a previously investigated area would allow for a fair assessment of the analytical model's results. Ishinomaki, Miyagi Prefecture, was selected as the area displayed the following characteristics:
-
Less impact from wave amplification. Ishinomaki is located on a plain coast, which reduces the effects of wave amplification unlike coastal towns located along the Sanriku Coast.
-
Less impact from floating debris. The populated areas of Ishinomaki are far from fishing ports and storage facilities, many of which were damaged by the tsunami and generated floating debris, which can magnify building damage. Floating debris from broken pine trees can also be excluded from consideration as the coastal pine forest along the city survived.
-
Less impact from wave directions. The effects from varying wave directions are minor as most of the buildings were lined facing the shoreline and the direction of the wave attack was perpendicular to the front of the buildings.
-
Largest sample size. The number of buildings affected by the 2011 event amongst cities along the plain coast was largest in Ishinomaki.
-
Previously developed fragility functions. Fragility functions have been previously developed for the populated areas of Ishinomaki (Charvet et al., 2015). A new study from Hasegawa et al. (2018) provides an excellent opportunity to compare the proposed method in this study with the established model.
2.2 Building damage data
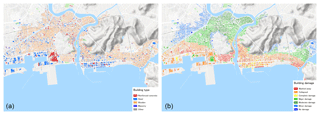
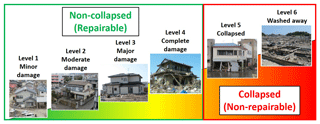
Detailed building damage data from field observations were obtained from the Ministry of Land, Infrastructure and Transportation and Tourism (MLIT, 2012) (Fig. 2) to test the applicability of the proposed building damage model. The data consist of the size (length and width), number of stories, construction material and interpolated measured maximum flow depth of each building. Each building was also classified according to their observed damage. There are a total of six damage levels in the classification scheme by MLIT. Low damage levels (i.e., levels 1–4) are easily misclassified in damage assessments due to overlapping descriptions in the classification scheme (Leelawat et al., 2014), whereas damage levels 5 and 6 are straightforward in their definitions (Fig. 3). “Washed away” and “destroyed” (levels 5 and 6) refer to structures which are irreparable. In this study, the two levels washed away and destroyed are considered since sliding and overturning mechanisms fall into the aforementioned categories. As opposed to lower damage levels, these damage modes are driven by the structural properties of these buildings, thus only buildings damaged at these levels were used for this study. The building type considered in this pioneer study is wooden residential houses, due to their large sample size in this area.
2.3 Numerical simulation of the 2011 tsunami and damage-inducing forces
Tsunami flow characteristics (flow depth, velocity and hydrodynamic force) at the point of damage occurrence were estimated in a time series analysis of the 2011 Great East Japan tsunami, which was reproduced by numerical simulation. The numerical model computed tsunami propagation and run-up by using a set of nonlinear shallow water equations, which were solved by a staggered leapfrog finite difference scheme, and bottom frictional values were written using Manning's formula (Suppasri et al., 2011; Charvet et al., 2015; Macabaug et al., 2016). The model setup includes the preparation of bathymetry and topography data, a nested grid system consisting of six computational domains was used for the study area (Fig. 4): 1215 m (Region 1), 405 m (Region 2), 135 m (Region 3), 45 m (Region 4), 15 m (Region 5) and 5 m (Region 6) (GSI, 2015). A constant value of Manning coefficient was applied to all computational grids except at the finest resolution (Region 6) where different Manning's roughness coefficients were specified according to land use types and building density, as the effect of bottom friction on tsunami propagation in deep water is negligible. Tidal level was set to tide conditions at the time of tsunami occurrence in 2011 and simulation time was set to 3 h. Initial water surface elevation was assumed to follow sea floor deformation, and the fault parameters proposed by the Tohoku University model (Imamura et al., 2011) were selected to reproduce the 2011 Great East Japan tsunami. Results of the numerical simulation are shown in Fig. 5.
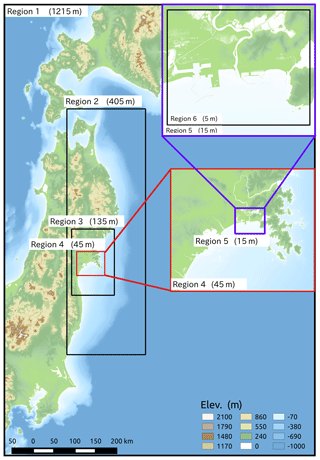
Figure 4Computational regions in this study. The projection of bathymetry and topography data is taken from the Japanese Geodetic Datum 2000 and the Tokyo Peil (T. P.) datum.
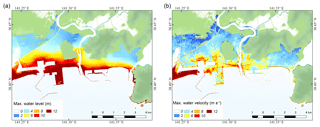
Figure 5Results of the tsunami numerical simulation: (a) maximum flow depth and (b) maximum flow velocity.
The accuracy of model is validated by comparing measured tsunami trace heights and modeled results (Fig. 6) using Aida's K and κ (Aida, 1978) as defined in Eqs. (1)–(3) below.
where xi and yi are the measured and simulated tsunami trace heights (Mori et al., 2012) at point i, respectively. Consequently, K is regarded as a correction factor for adjusting the modeled values to fit the actual tsunami averaged over several locations; κ is defined as a measure of the fluctuation or deviation in Ki. Values of Aida's K and κ are 1.04 and 1.32, respectively. The corrected tsunami simulation produced tsunami flow depths that are a close match to the measured tsunami trace heights and satisfy the guidelines of the Japan Society of Civil Engineers (JSCE) ( and κ<1.45) (JSCE, 2016). Hence, tsunami flow depths and velocities of higher accuracy were reproduced in Ishinomaki.
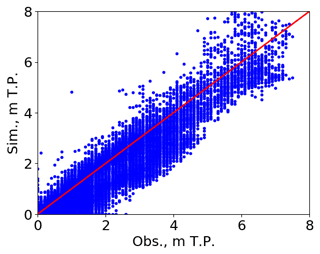
Figure 6Validation of the simulated tsunami inundation heights using the observed tsunami trace heights (Mori et al., 2012).
Results from the tsunami simulation were used to estimate tsunami-induced forces. Flow depth and velocity values were captured at each time step of the simulation and at each building location for more than 20 000 wooden buildings in Ishinomaki. These values were then used to calculate hydrodynamic force (Fh) through drag formula (Eq. 4), debris impact force (Fd), through an impulse-momentum approach (Eq. 5), and buoyancy force (B) (Eq. 6) at each time step for each building (Fig. 1).
where CD denotes the drag coefficient (CD=1.5, as an average value from 1.25 to 2.00, depending on the width to depth ratio; FEMA, 2003), ρ the density of water (=1000 kg m−3), u the current velocity (m s−1), D inundation depth (m), m (kg) the weight of debris, Δt the duration of impact (=0.7 s for wooden wall, FEMA, 2003), g the gravitational acceleration and V the submerged volume. This study follows the recommended weights of floating debris by the American's Federal Emergency Management Agency (FEMA, 2003) and the Japan Society of Material Cycles and Waste Management (JSCWM, 2011), where the estimates were approximately 500 kg for a pine tree; 3000 kg for a vehicle; and 15 000, 30 000, and 60 000 kg for moderately damaged, majorly damaged, and collapsed buildings, respectively.
2.4 Resistant forces
In this study, the designed resistance of each building to withstand loads imposed on them is considered its damage threshold. One aim is to determine if the modeled tsunami-induced forces (i.e., hydrodynamic force, buoyancy force and debris impact force) for each building would exceed its damage threshold and, therefore, result in damage to the building. As mentioned earlier, differences in the types of loads imposed and types of building resistance forces involved were considered when modeling the sliding and overturning mechanisms of a building. Both mechanisms were modeled separately. There are two types of resistant forces in a building, i.e., vertical and lateral resistance. The vertical resistance of a building is its weight and, in this study, it was assumed to be 3000 kN m−2 for each building (Yokohama City, 2018). Vertical load-resistance analysis was used to determine overturning mechanisms.
For the first time, lateral resistance (R) from the bearing wall of a building will be considered when estimating building damage from tsunamis. The failure of lateral resistance of a building can imply that sliding mechanisms are involved in its collapse. The bearing wall of a building must be able to resist lateral loads imposed on them, such as wind or seismic activity. The lateral resistance of each building to earthquake and wind forces was calculated in accordance with the Enforcement Ordinance of Building Standard Law, Article 46 (MLIT, 2018), and in this case lateral resistance is the product of the lateral strength of the bearing wall and the required wall length of each building. The lateral strength of a bearing wall by Japanese housing design standards is 1.96 kN m−1 (MLIT, 2018).
Calculations for the required wall length would differ for both seismic and wind loads. Required wall length for seismic loads can be derived by taking the building's floor area and multiplying it by its design coefficient for seismic load (Fig. 7) (MLIT, 2018), as illustrated in Example 1. On the other hand, for wind loads, the required wall length can be calculated by multiplying the design coefficients with the vertical projection area (both the front and side of the building) (MLIT, 2018), as illustrated in Example 2. The vertical projection area is the area defined by the building width or length multiplied by the floor height above 1.35 m (Fig. 8). As information on building heights in Ishinomaki was not available at the point of this study, an anonymous interview was conducted with a local housing construction company. The estimates provided for the heights of the first, second and third floors of an average wooden house were 3.5, 2.7 and 2.1 m, respectively, which were then used as the average values for the purpose of this study. Wooden buildings in Ishinomaki did not exceed three stories.
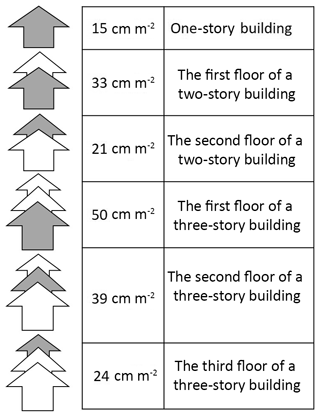
Figure 7Design coefficients for calculating corresponding necessary wall length against seismic load for one to three story wooden houses (MLIT, 2018).
In this study, the lateral resistance of a building against tsunami impacts is considered the sum of lateral resistance for floors below the modeled maximum flow depth. Estimation of lateral resistance for buildings should be taken with care as it was calculated for each floor. The total lateral resistance of a building against seismic or wind loads would be the sum of lateral resistance for every floor where maximum tsunami flow depth has been reached. The highest estimated lateral resistance between seismic and wind loads was then chosen as the maximum effective resistance, hence the assumed lateral resistance design for each building. It should also be noted that the design lateral resistance may decrease due to age and ground shaking from previous earthquakes. A previous study done by the Japan Building Disaster Prevention Association (2012) reported 0.7 as the minimum reduction coefficient to account for these effects. Therefore, a range of bearing wall resistance reduction coefficients (0.7, 0.8, 0.9 and 1.0) was introduced when calculating the lateral resistance of the building.
2.4.1 Example 1
-
Calculation example of required wall length for seismic load.
-
One story with 60 m2 of floor area, the required wall length = 60 m2×15 cm m cm = 9 m.
2.4.2 Example 2
-
Calculation example of required wall length for wind load.
-
The first floor of a two-story building.
-
Front: required wall length = (1)A (m2)×50 cm m−2.
-
Side: required wall length = (2)B (m2)×50 cm m−2.
-
The second floor of a two-story building.
-
Front: required wall length = (2) A (m2)×50 cm m−2.
-
Side: required wall length = (2)B (m2)×50 cm m−2.
-
The designed wall length for wind load will be the summation of the maximum value at each floor.
2.5 Building damage replacement cost ratio
Although financial loss is not the central focus of this paper, it is a good opportunity to present a potential building damage replacement cost index for wooden buildings for future loss estimates. At present, tsunami building damage costs are based on data obtained from insurance claims after tsunami events. Loss estimates are, for the most part, based on analyses that are separate from the damage assessments and they do not account for building conditions and tsunami hydrodynamics.
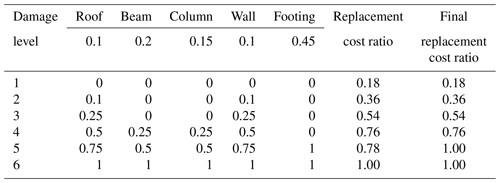
The building damage levels proposed by MLIT (Fig. 3) formed the basis of developing the replacement cost index. Throughout this study, the focus has been on collapsed buildings (levels 5 and 6). This index, however, will be representative of both collapsed and non-collapsed buildings. Collapsed buildings can automatically be assigned as 100 % loss as they are assumed to be irreparable. In general, construction costs of two-story wooden houses in Japan are comprised of two components: architectural work, which forms 70 % of total costs, and structural work, which forms 30 %. Costs of structural work can be further broken down into nonstructural components – roofs (20 %) and walls (10 %) – and structural components – beams (20 %), columns (15 %), and footings (45 %). The averaged numbers of each component were calculated based on actual data of several houses (MN Housing and Building Laboratory, 2015; Cabinet Office of Japan, 2017; Japan Wood-Products Information and Research Center, 2019).
3.1 Accuracy of the proposed building damage assessment method
The results of the proposed building damage assessment model were compared to field observations to assess its performance (Fig. 9). Field observations are presented in the MLIT database and only buildings with damage levels 5 and 6 (collapse conditions) were used for comparison. Table 1 shows the accuracy of modeled collapsed buildings and actual collapsed buildings from field observations when only the sliding mechanism was considered, and Table 2 shows a similar model when both sliding and overturning mechanisms were considered. Both tables have clearly illustrated that debris impact forces and resistance reduction coefficients do not seem to have significantly influenced the collapse of buildings in Ishinomaki. Damage analysis without debris weight input and building resistance reduction coefficient showed a better match. This can be attributed to the fact that Ishinomaki was not heavily affected by floating debris for the reasons stated in Sect. 3.1.
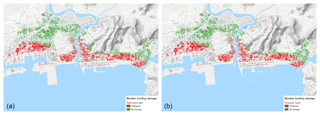
Figure 9Distributions of collapsed and non-collapsed buildings from field observations (a) and the proposed method (b).
Table 1Damage assessment accuracy (in percent) of washed away and destroyed buildings (damage levels 5 and 6) when considering only sliding as a damage mechanism.
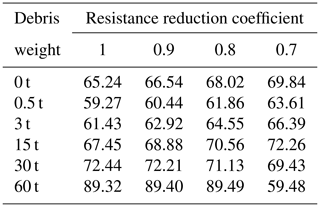
Table 2Damage assessment accuracy (in percent) of washed away and destroyed buildings (damage levels 5 and 6) when considering both damage mechanisms.
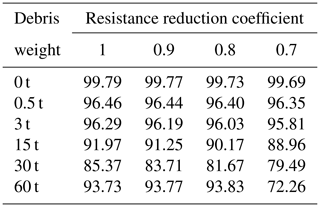
Tables 1 and 2 highlight that the sliding mechanism alone is a poor explanation for collapse. In other words, overturning is an important mechanism when analyzing building collapse. When using the proposed method, the modeled results show a near 100 % accuracy, as shown in Table 2 and illustrated in Fig. 9.
3.2 Comparison of minimum load values for the collapse of wooden buildings against field observations and hydraulic experiments
The average lateral resistance of a building in Ishinomaki, derived from 19 000 wooden houses in this study, is estimated to be about 42 kN, and the average hydrodynamic force is about 10 kN. These findings are evaluated and compared to other findings in tsunami literature to understand the dominant mechanism of building collapse. In a hydraulic experiment by Arikawa (2009), the flexural capacity of a wooden wall was tested. A wooden wall (2.5 m high and 2.7 m wide) supported by a steel frame was placed in a water flume in a full-scale experiment. The wooden wall was found to be destroyed at a tsunami flow depth of 2.5 m. The flexural capacity of the wooden wall was 10 kN m−2, which is equivalent to 67.5 kN. Matsutomi and Harada (2010) measured tsunami flow depth at the front and back of buildings during their field survey. Based on the survey and estimated Froude number, they found that for wooden houses, the necessary lateral force required to cause moderate damage is 5.4–9.9 kN m−1 and for major damage is 9.7–17.6 kN m−1. Therefore, the minimal lateral load required for wooden houses to be washed away is approximately 9.7–17.6 kN m−1 or 88–176 kN, assuming that the width of the house is 5–10 m. This information further supports the consideration of overturning as a critical explanation for collapse mechanisms.
3.3 Tsunami characteristics at the time of collapse and influence of flow characteristics on damage
Critical flow depth (Dc) and critical flow velocity (Vc) values are flow depths and velocities at the time of building collapse or rather, when buildings were considered collapsed when using the proposed damage model. In this study, a further assessment was made to derive maximum flow values and compare them to the critical values modeled for each building. In general, the critical values are lower than maximum values for both flow depth and velocity (Figs. 10 and 11). The maximum flow depth (Dm) is about 4 times higher than the critical flow depth and maximum flow velocity (Vm) is about 2 times higher than the critical flow velocity (Table 3). The implication is straightforward – building damage is highly underestimated when using maximum flow characteristics as explanatory variables. It underscores one of the weaknesses of using traditional tsunami damage assessment methodologies.
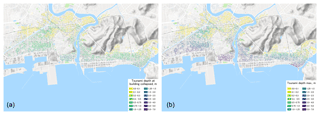
Figure 10Distribution of the simulated critical flow depth (a) and the simulated maximum flow depth (b).
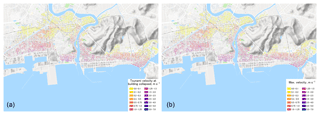
Figure 11Distribution of the simulated critical flow velocity (a) and the simulated maximum flow velocity (b).
Table 3Flow depth and velocity ratios (washed away and destroyed buildings, i.e., damages levels 5 and 6).

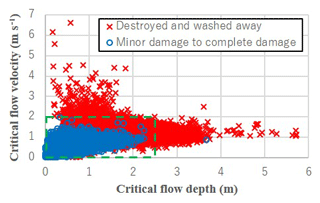
It is also observed that flow depth and flow velocity contribute differently to total building damage. Critical flow depth and velocity for collapsed (damage levels 5 and 6) and non-collapsed buildings are plotted in Fig. 12, and it appears that wooden buildings almost always get washed away when critical flow velocity exceeds 2 m s−1, regardless of the value of critical flow depth. This value may serve as a simple indicative criterion for assessing potential building damage. This criterion when used together with developed tsunami maps or numerical flow simulation allows for some initial building damage assessment and quick estimations.
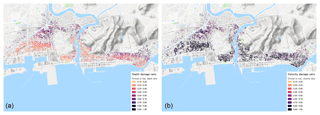
The influence of flow depth and flow velocity on building damage may also vary across space. The relationship between critical and maximum flow depth values are represented as ratios and the distribution of these ratios are plotted on a map (Fig. 13a). Similarly, the distribution of the ratio between critical and maximum flow velocities are plotted on a map (Fig. 13b). Flow velocity appears to be a more significant parameter of damage (as ratios are close to 1.00) in areas nearer to the shoreline where flow velocity is very high and tsunami-induced force is mostly hydrodynamic. On the other hand, flow depth has a greater influence on damage in areas nearer to the inundation limit where pressure from the tsunami is mostly hydrostatic.
3.4 Comparing results from fragility functions
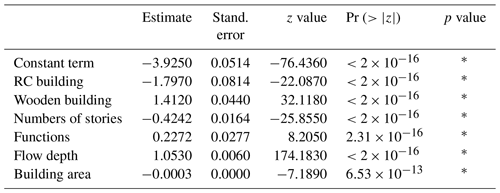
Building collapse in Ishinomaki was recently modeled by Hasegawa et al. (2018), where they developed fragility functions using the same building damage dataset (MLIT, 2012) and collapse criteria. The fragility functions were developed by applying logistic regression (where damage states follow a binomial distribution). The estimated damage probabilities are calculated as per Eq. (7). Values of the maximum likelihood estimations are presented in Table 4.
where p is a probability of collapse, an is a regression constant and xn is an explanatory variable. In the damage assessment of this study, a building is classified as collapsed when the probability of collapse is higher than 50 %.
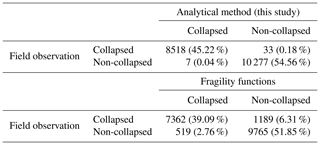
Results from this study are compared to the fragility functions to determine how well building damage can be identified when using either the proposed method or the fragility functions. The building damage condition is reproduced using both methods and compared to actual observations, as shown in Fig. 14. The proposed method is able to correctly reproduce collapsed and non-collapsed buildings with 99.79 % accuracy, while the fragility functions are able to reproduce building damage conditions with 91.06 % accuracy, as summarized in Table 5. It can be observed that the model based on fragility functions does not perform as well when assessing building damage in the zone separating collapsed and non-collapsed buildings.
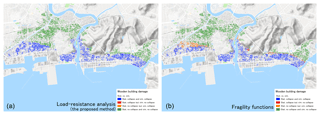
Figure 14Reproduction of building damage conditions (collapsed or non-collapsed): comparison between the proposed method and field observations (a) and fragility functions and field observations (b). Blue: correct reproduction of collapsed buildings; green: correct reproduction of non-collapsed buildings; red: failure to reproduce collapsed buildings; and orange: failure to reproduce non-collapsed buildings.
Table 5Building damage assessment accuracy of this proposed method and previously developed fragility functions compared to field observations. This table shows numbers of buildings for each condition and their accuracy percentages.
It should be noted that building damage assessment with such accuracy can only be replicated because of the strict construction design standards in Japan. How well the proposed method will perform in a context outside of Japan will be largely dependent on local practices in the design and construction of the buildings, the presence debris material and the age of the building (resistance reduction coefficients). Additionally, flow–building interactions that yield lower damage states are not accounted for, so the model may not perform as well for flow conditions that are less severe than the 2011 Great East Japan tsunami.
3.5 Financial loss metrics
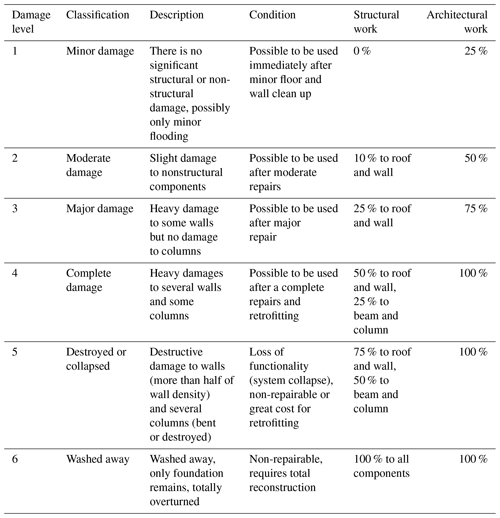
The damage ratio of each structural and nonstructural component at each damage level was interpreted based on MLIT's building damage definition (MLIT, 2012). On account of approximations of the construction cost, as presented in Sect. 2.5, each building damage level defined by structural damage condition can be converted into a replacement cost ratio as shown below (Tables 6 and 7).
Table 6MLIT's damage level classification, description, and condition (MLIT, 2012) and the damage ratio for structural work and architectural work. In this context structural work refers to any components of the buildings that are related to their core structure (e.g., frames, roofing) and architectural work refers to any other superficial or nonstructural component (e.g., decoration, furnishings or utility infrastructure).
This study presented a novel quantitative tsunami damage prediction approach, i.e., load-resistance analysis. While previous empirical and experimental studies have vastly improved our understanding of building response to tsunami impacts and extensively quantified building damage characteristics, implementation of the resulting damage estimates for future tsunami scenarios is challenging, especially when spatial differences such as construction standards and coastal morphology are significant. Load-resistance analysis utilizes building design standards to estimate the resistance force of each building and hence analytically estimate the potential for building damage (collapse) in a localized context. One of the advantages of load-resistance analysis is it can be extended to other areas where existing empirical data are sparse and modified to assess building collapse (sliding or overturning mechanism). This approach is complementary to published statistical tsunami damage fragility functions, as demonstrated in the case study of Ishinomaki.
-
Damage level 1: minor damage (replacement cost ratio = 18 %).
Damage description of “no significant structural or nonstructural damage, possibly only minor flooding”, a 25 % architectural work damage ratio is applied, leaving it within the “possible to be used immediately after minor floor and wall clean up” category.
Replacement cost ratio = .
-
Damage level 2: moderate damage (replacement cost ratio = 36 %).
A damage ratio of 10 % is assigned to roofs and walls according to the damage description “slight damage to nonstructural components”. A 50 % architectural work damage ratio is applied, leaving it within the “possible to be used after moderate repairs” category.
Replacement cost ratio = .
-
Damage level 3: major damage (replacement cost ratio = 54 %)
A damage ratio of 25 % is assigned to roofs and walls according to the damage description “heavy damage to some walls but no damage to columns”. A 75 % architectural work damage ratio is applied, leaving it within the “possible to be used after major repairs” category.
Replacement cost ratio = .
-
Damage level 4: Complete damage (replacement cost ratio = 76 %).
A damage ratio of 50 % is assigned to roofs and walls, and a 25 % damage ratio is applied to beams and columns according to the damage description “heavy damages to several walls and some columns”. A 100 % architectural work damage ratio is applied, leaving it within the “possible to be used after a complete repair and retrofitting” category.
Replacement cost ratio = .
-
Damage level 5: collapsed (replacement cost ratio = 100 %).
A damage ratio of 75 % is assigned to roofs and walls, and a 50 % damage ratio is applied to beams and columns according to the damage description “destructive damage to walls (more than half the wall density) and several columns (bent or destroyed)”. However, because a damage ratio of 100 % is assigned to the footing because of the damage condition “non-repairable or great cost for retrofitting”, the final replacement cost ratio is set to 100 %.
Replacement cost ratio = .
-
Damage level 6: washed away (replacement cost ratio = 100 %).
A damage ratio of 100 % is assigned to all structural components according to the damage description “washed away, only foundation remains, totally overturned” and the damage condition “non-repairable, requires total reconstruction”.
To date, building damage characteristics have been treated separately from the financial losses that are often of interest to policy makers and planners. This study is a first attempt to propose both building damage estimations and financial losses. Using the established classification of building damage by MLIT, building construction costs were evaluated and pegged to each damage level as replacement cost ratios. The proposed replacement cost index provides an approximate estimate of potential financial losses in areas where preexisting disaster-related insurance claim settlements are lacking.
4.1 Main findings
Additional key findings emerging from this study are summarized below.
-
Analytical estimation of the potential for building collapse was calculated using building design standards and accounting for resistance reduction coefficients, as well as tsunami hydrodynamic force, considering different debris weights. The most general case (resistance reduction coefficient of 1.0 and 0 t debris weight) yields the highest accuracy in estimating building collapse in Ishinomaki.
-
Sliding alone is an insufficient explanation for building collapse. It is also important to consider the overturning mechanism.
-
This study has confirmed that the use of maximum values for flow depth and velocity might underestimate damage. Damage is likely to occur before flow depth and velocity reach maximum values. The present results suggest a flow velocity of 2 m s−1 or more would trigger collapse for a typical Japanese two-story residential wooden building.
-
The ratio between critical flow velocity and maximum flow velocity might be a useful alternative damage intensity measure but needs further investigation – particularly in the light of intermediate damage levels.
-
The proposed load-resistance analysis shows higher accuracy in assessing building collapse compared to previously developed fragility functions in the same study area.
-
Replacement cost ratios for each level of MLIT damage classification are approximately 18 %, 36 %, 54 %, 76 %, 100 % and 100 % for damage levels 1, 2, 3, 4, 5 and 6, respectively.
4.2 Future applications and limitations
The newly proposed load-resistance analytical method can be applied to other coastal regions of Japan, as well as globally, but only where building design standards and related information are known and enforced. However, such detailed analyses require higher computational cost and data storage. The proposed method may only work in countries where building design codes are strictly followed as in the case of Japan and for events generating heavy levels of damage. Additionally, the reliability of building damage predictions using this method is dependent on the accuracy of the numerical model. This depends on the availability and quality of information regarding the hazard, the dominant damage mode assumed in the analysis and/or reference dataset, the assumed debris weight coefficient and the resistance reduction coefficient employed. In absence of such information, building damage estimates are subjected to significant uncertainty. Therefore, the application of this method is not to produce absolute figures for damage estimates but to be a useful guideline for planning purposes and an alternative study for comparison.
Source code and details of the tsunami simulation were sourced from Imamura (1996). Topography and bathymetry data were obtained from previous research (Macabuag et al., 2016; Suppasri et al., 2018), which sourced the original data from the Geospatial Information Authority of Japan (GSI, 2015). Damage data were obtained from published results (MLIT, 2012). Figures 4, 5, 9, 10, 11, 13 and 14 were made using a licensed computer software tools called Arc GIS.
AS wrote the whole paper, made the literature review, compiled all the data and information, and did the building damage analysis. KP performed the tsunami numerical simulation and plotted the figures. IC gave advice on building damage analysis and edited the paper. CTC gave advice on building damage analysis and edited the paper. NT gave advice on building damage analysis and edited the paper. TO gave advice on building damage analysis and edited the paper. PL gave advice on the tsunami simulation and edited the paper. NL gave advice on statistical analysis and edited the paper. FI gave general advice throughout the paper.
The authors declare that they have no conflict of interest.
This research was funded and supported by JSPS Grant-in-Aid for Young Scientists (B) “Applying developed fragility functions for the Global Tsunami Model (GTM)” (grant no. 16K16371), a JSPS-NRCT Bilateral Research grant, the Core Research Cluster of Disaster Science in Tohoku University (Designated National University), Tokio Marine & Nichido Fire Insurance Co., Ltd., Willis Research Network (WRN), and the Radchadapisek Sompoch Endowment Fund (2019), Chulalongkorn University (762003-CC).
This research has been supported by the JSPS Grant-in-Aid for Young Scientists (B) (grant no. 16K16371) and the JSPS-NRCT Bilateral Research grant (fiscal year 2017–2018).
This paper was edited by Ira Didenkulova and reviewed by Ceren Ozer Sozdinler and one anonymous referee.
Aida, I.: Reliability of a tsunami source model derived from fault parameters, J. Phys. Earth, 26, 57–73, 1978.
Arikawa, T.: Structural behavior under impulsive tsunami loading, J. Disaster Res., 4, 377–381, 2009.
Attary, N., van de Lindt, J. W., Unnikrishnan, V. U., Barbosa, A. R., and Cox, D. T.: Methodology for development of physics-based tsunami fragilities, J. Struct. Eng., 143, 04016223, https://doi.org/10.1061/(ASCE)ST.1943-541X.0001715, 2017.
Cabinet Office of Japan: Chapter 2: Damage from water-related disasters, p. 72, available at: http://www.bousai.go.jp/taisaku/pdf/h3003shishin_3.pdf (last access: 28 September 2018), 2017.
Charvet, I., Suppasri, A., Kimura, H., Sugawara, D., and Imamura, F.: Fragility estimations for Kesennuma City following the 2011 Great East Japan Tsunami based on maximum flow depths, velocities and debris impact, with evaluation of the ordinal model's predictive accuracy, Nat. Hazards, 79, 2073–2099, 2015.
Charvet, I., Macabuag, J., and Rossetto, T.: Estimating tsunami induced building damage through fragility functions: Critical review and research needs, Front. Built Environ., 3, 1–22, https://doi.org/10.3389/fbuil.2017.00036, 2017.
Dall'Osso, F., Dominey-Howes, D., Tarbotton, C., Summerhayes, S., and Withycombe, G.: Revision and improvement of the PTVA-3 model for assessing tsunami building vulnerability using “international expert judgment”: introducing the PTVA-4 model, Nat. Hazards, 83, 1229–1256, 2016.
Dias, W. P. S., Yapa, H. D., and Peiris, L. M.N .: Tsunami vulnerability functions from field surveys and Monte Carlo simulation, Civ. Eng. Environ. Syst., 26, 181–194, 2009.
FEMA – Federal Emergency Management Agency: Coastal Construction Manual (3 Vols.), 3rd Edn., FEMA 55, Jessup, MD, 2003.
FEMA – Federal Emergency Management Agency: Tsunami methodology technical manual, Washington, D.C., 2013.
GSI – Geospatial Information Authority of Japan: High resolution digital elevation data, available at: http://www.gsi.go.jp/kankyochiri/Laser_demimage.html, last access: 1 April 2015.
Hasegawa, N., Suppasri, A., Makinoshima, F., and Imamura, F.: A proposal of formula for damage prediction of each building using actual damage data from the 2011 Great East Japan tsunami, in: Proceedings of the Annual Conference of JSCE Tohoku branch, II-97, 2018.
Imamura, F.: Review of tsunami simulation with a finite difference method, in: Long-Wave Runup Models, edited by: Yeh, H., Liu, P., and Synolakis, C. E., World Scientific Publishing Co., Singapore, 25–42, 1996.
Imamura, F., Koshimura, S., Mabuchi, Y., Oie, T., and Okada, K.: Tsunami simulation of the 2011 Great East Japan Tsunami using Tohoku University model (Version 1.1), available at: http://www.tsunami.civil.tohoku.ac.jp, last access: 7 November 2011.
Japan Building Disaster Prevention Association: Seismic evaluation (General evaluation method) Pro Ver. 3.01, Tokyo, Japan, 18 pp., 23 February 2012.
Japan Wood-Products Information and Research Center: O&A on utilization of wooden materials, vailable at: http://www.jawic.or.jp/qanda/index.php?no=19 (last access: 28 September 2018), 2019.
JSCE – Japan Society of Civil Engineers: Tsunami assessment method for nuclear power plants in Japan, available at: http://www.jsce.or.jp/committee/ceofnp/Tsunami/eng/JSCE_Tsunami_060519.pdf, last access: 6 August 2016.
JSCWM – Japan Society of Material Cycles and Waste Management, Disaster Waste Countermeasure and Reconstruction Task Team: Disaster waste classification and treatment strategy manual Version 2, the last update on 15 June 2011, available at: http://eprc.kyoto-u.ac.jp/saigai/report/2011/04/001407.html (last access: 14 February 2018), 2011.
Kelman, I. and Spence, R.: An overview of flood actions on buildings, Eng. Geol., 73, 297–309, 2004.
Koshimura, S., Oie, T., Yanagisawa, H., and Imamura, F.: Developing Fragility Functions for Tsunami Damage Estimation using Numerical Model and Post-Tsunami Data from Banda Aceh, Indonesia, Coast. Eng. J., 51, 243–273, 2009.
Latcharote, P., Suppasri, A., Yamashita, A., Adriano, B., Koshimura, S., Kai, Y., and Imamura, F.: Possible Failure Mechanism of Buildings Overturned during the 2011 Great East Japan Tsunami in the Town of Onagawa, Frontiers in Built Environment, Earthquake Engineering, Mega Quakes: Cascading Earthquake Hazards and Compounding Risks, 3, 1–18, 2017.
Leelawat, N., Suppasri, A., Charvet, I., and Imamura, F.: Building damage from the 2011 Great East Japan tsunami: Quantitative assessment of influential factors – A new perspective on building damage analysis, Nat. Hazards, 73, 449–471, 2014.
Macabuag, J., Rossetto, T., and Lloyd, T.: Sensitivity analysis of a framed structure under several tsunami design-guidance loading regimes, in: 2nd European Conference on Earthquake Engineering and Seismology, Istanbul, Turkey, 2014.
Macabuag, J., Rossetto, T., Ioannou, I., Suppasri, A., Sugawara, D., Adriano, B., Imamura, F., and Koshimura, S.: A proposed methodology for deriving tsunami fragility functions for buildings using optimum intensity measures, Nat. Hazards, 84, 1257–1285, 2016.
Macabuag, J., Rossetto, T., Ioannou, I., and Eames, I.: Investigation of the effect of debris-induced damage for constructing tsunami fragility curves for building, Geosciences, 8, 117, 2018.
Matsutomi, H. and Harada, K.: Tsunami-trace distribution around building and its practical use, in: session 3-2, Proceedings of the 3rd International tsunami field symposium, 10–11 April 2010, Sendai, Japan, 2010.
MLIT – Ministry of Land, Infrastructure, Transportation and Tourism: Reconstruction Support Survey Archive, available at: http://fukkou.csis.u-tokyo.ac.jp/, last access: 4 July 2012.
MLIT – Ministry of Land, Infrastructure, Transportation and Tour-ism, Article 46 Enforcement Ordinance of Building Standard Law, available at: http://elaws.e-gov.go.jp/search/elawsSearch/elaws_search/lsg0500/detail?lawId=$325CO0000000338#390 last access: 15 January 2018.
MN Housing and Building Laboratory: Wooden house cost simulation, available at: http://mnsekkei-cost.blogspot.com/ (last access ccessed: 28 September 2018), 2015.
Mori, N., Takahashi, T., and 2011 Tohoku Earthquake Tsunami Joint Survey Group: Nationwide Post Event Survey and Analysis of the 2011 Tohoku Earthquake Tsunami, Coast. Eng. J., 54, 1250001, https://doi.org/10.1142/S0578563412500015, 2012.
Nadal, N. C., Zapata, R. E., Pagán, I., López, R., and Agudelo, J.: Building damage due to riverine and coastal floods, J. Water Resour. Pl. Manage., 136, 327–336, 2009.
Nanayakkara, K. and Dias, W.: Fragility curves for structures under tsunami loading, Nat. Hazards, 80, 471–486, 2016.
Omira, R., Baptista, M. A., Miranda, J. M., Toto, E., Catita, C., and Catalão, J.: Tsunami vulnerability assessment of Casablanca Morocco using numerical modelling and GIS tools, Nat. Hazards, 54, 75–95, 2010.
Peiris, N.: Vulnerability functions for tsunami loss estimation, Paper no. 1121, in: The 1st European Conference on Earthquake Engineering and Seismology, 3–8 September 2006, Geneva, Switzerland, 10 pp., 2006.
Reese, S., Cousins, W. J., Power, W. L., Palmer, N. G., Tejakusuma, I. G., and Nugrahadi, S.: Tsunami vulnerability of buildings and people in South Java – field observations after the July 2006 Java tsunami, Nat. Hazards Earth Syst. Sci., 7, 573–589, https://doi.org/10.5194/nhess-7-573-2007, 2007.
Shoji, G. and Nakamura, T.: Damage assessment of road bridges subjected to the 2011 Tohoku Pacific earthquake tsunami, J. Disaster Res., 12, 79–89, 2017.
Song, J., De Risi, R., and Goda, K.: Influence of flow velocity on tsunami loss estimation, Geosciences, 7, 114, 2017.
Suppasri, A., Koshimura, S., and Imamura, F.: Developing tsunami fragility curves based on the satellite remote sensing and the numerical modeling of the 2004 Indian Ocean tsunami in Thailand, Nat. Hazards Earth Syst. Sci., 11, 173–189, https://doi.org/10.5194/nhess-11-173-2011, 2011.
Suppasri, A., Muhari, A., Futami, T., Imamura, F., and Shuto, N.: Loss functions of small marine vessels based on surveyed data and numerical simulation of the 2011 Great East Japan tsunami, J. Waterway Port Coast. Ocean Eng., 140, 04014018, https://doi.org/10.1061/(ASCE)WW.1943-5460.0000244, 2014.
Suppasri, A., Charvet, I., Imai, K., and Imamura, F.: Fragility curves based on data from the 2011 Great East Japan tsunami in Ishinomaki city with discussion of parameters influencing building damage, Earthq. Spectra, 31, 841–868, 2015.
Suppasri, A., Latcharote, P., Bricker, J. D., Leelawat, N., Hayashi, A., Yamashita, K., Makinoshima, F., Roeber, V., and Imamura, F.: Improvement of tsunami countermeasures based on lessons from the 2011 great east japan earthquake and tsunami-Situation after five years, Coast. Eng. J., 58, 1640011, https://doi.org/10.1142/S0578563416400118, 2016.
Suppasri, A., Fukui, K., Yamashita, K., Leelawat, N., Ohira, H., and Imamura, F.: Developing fragility functions for aquaculture rafts and eelgrass in the case of the 2011 Great East Japan tsunami, Nat. Hazards Earth Syst. Sci., 18, 145–155, https://doi.org/10.5194/nhess-18-145-2018, 2018.
Valencia, N., Gardi, A., Gauraz, A., Leone, F., and Guillande, R.: New tsunami damage functions developed in the framework of SCHEMA project: application to European-Mediterranean coasts, Nat. Hazards Earth Syst. Sci., 11, 2835–2846, https://doi.org/10.5194/nhess-11-2835-2011, 2011.
Triantafyllou, I., Novikova, T., Charalampakis, M., Fokaefs, A., and Papadopoulos, G. A.: Quantitative Tsunami Risk Assessment in Terms of Building Replacement Cost Based on Tsunami Modelling and GIS Methods: The Case of Crete Isl., Hellenic Arc, Pure Appl. Geophys., 176, 3207–3225, https://doi.org/10.1007/s00024-018-1984-9, 2019.
Yeh, H., Barbosa, A. R., Ko, H., and Cawley, J. G.: Tsunami loadings on structures: Review and analysis, Coast. Eng. Proceed., 1, 1–13, 2014.
Yokohama City, Housing and Architecture Bureau: Standard weight table of wooden house and standard weight table' calculation basis of wooden house, available at: http://www.city.yokohama.lg.jp/kenchiku/shidou/shidou/toriatukai/gakeue/siryou3.pdf, last access: 21 February 2018.


