the Creative Commons Attribution 4.0 License.
the Creative Commons Attribution 4.0 License.
Large eddy simulation modeling of tsunami-like solitary wave processes over fringing reefs
Yu Yao
Tiancheng He
Long Chen
Huiqun Guo
Many low-lying tropical and subtropical reef-fringed coasts are vulnerable to inundation during tsunami events. Hence accurate prediction of tsunami wave transformation and run-up over such reefs is a primary concern in the coastal management of hazard mitigation. To overcome the deficiencies of using depth-integrated models in modeling tsunami-like solitary waves interacting with fringing reefs, a three-dimensional (3-D) numerical wave tank based on the computational fluid dynamics (CFD) tool OpenFOAM® is developed in this study. The Navier–Stokes equations for two-phase incompressible flow are solved, using the large eddy simulation (LES) method for turbulence closure and the volume-of-fluid (VOF) method for tracking the free surface. The adopted model is firstly validated by two existing laboratory experiments with various wave conditions and reef configurations. The model is then applied to examine the impacts of varying reef morphologies (fore-reef slope, back-reef slope, lagoon width, reef-crest width) on the solitary wave run-up. The current and vortex evolutions associated with the breaking solitary wave around both the reef crest and the lagoon are also addressed via the numerical simulations.
- Article
(8017 KB) - Full-text XML
- BibTeX
- EndNote
A tsunami is an extremely destructive natural disaster, which can be generated by earthquakes, landslides, volcanic eruptions and meteorite impacts. Tsunami damage occurs mostly in the coastal areas where tsunami waves run up or run down the beach, overtop or ruin the coastal structures, and inundate the coastal towns and villages (Yao et al., 2015). Some tropic and subtropical coastal areas vulnerable to tsunami hazards are surrounded by coral reefs, especially those in the Pacific and Indian oceans. Among various coral reefs, fringing reefs are the most common type. A typical cross-shore fringing reef profile can be characterized by a steep offshore fore-reef slope and an inshore shallow reef flat (Gourlay, 1996). There is also possibly a reef crest lying at the reef edge (e.g., Hench et al., 2008) and/or a narrow shallow lagoon existing behind the reef flat (e.g., Lowe et al., 2009a). Over decades, fringing reefs have been well known to be able to shelter low-lying coastal areas from flood hazards associated with storms and high surf events (e.g., Cheriton et al. 2016; Lowe et al., 2005; Lugo-Fernandez et al., 1998; Péquignet et al., 2011; Young, 1989). However, after the 2004 Indian Ocean tsunami, the positive role of coral reefs in mitigating the tsunami waves has attracted the attention of scholars who conduct postdisaster surveys (e.g., Chatenoux and Peduzzi, 2007; Ford et al., 2014; Mcadoo et al., 2011). There is consensus among the researchers that, in addition to the establishment of the global tsunami warning system, the cultivation of coastal vegetation (mangrove forest, coral reef, etc.) is also one of the coastal defensive measures against the tsunami waves (e.g., Dahdouh-Guebas et al., 2006; Danielsen et al., 2005; Mcadoo et al., 2011). Numerical models have been proven to be powerful tools to investigate tsunami wave interaction with the mangrove forests (e.g., Huang et al., 2011; Maza et al., 2015; Tang et al., 2013, and many others). Comparatively speaking, their applications in modeling coral reefs subjected to tsunami waves are still very few.
Over decades, modeling wave processes over reef profiles face several challenges such as steep fore-reef slope, complex reef morphology and spatially varied surface roughness. Local but strong turbulence due to wave breaking in the vicinity of the reef edge needs to be resolved. Among various approaches for modeling wave dynamics over reefs, two groups of models are the most pervasive. The first group focuses on using the phase-averaged wave models and the nonlinear shallow water equations to model the waves and the flows, respectively, in field reef environments, and typically the concept of radiation stress (Longuet-Higgins and Stewart, 1964) or vortex force (Craik and Leibovich, 1976) is used to couple the waves and the flows (e.g., Douillet et al., 2001; Kraines et al., 1998; Lowe et al., 2009b, 2010; Van Dongeren et al., 2013; Quataert et al., 2015). As for modeling tsunami waves at a field scale, we are only aware of Kunkel et al.'s (2006) implementation of a nonlinear shallow water model to study the effects of wave forcing and reef morphology variations on the wave run-up. However, their numerical model was not verified by any field observations. The second group aims at using the computationally efficient and phase-resolving model based on the Boussinesq equations. This depth-integrated modeling approach employs a polynomial approximation to the vertical profile of velocity field, thereby reducing the dimensions of a three-dimensional problem by one. It is able to account for both nonlinear and dispersive effects at intermediate water level. At a laboratory scale, Boussinesq models combined with some semiempirical breaking wave and bottom friction models have been proven to be able to simulate the motions of regular waves (Skotner and Apelt, 1999; Yao et al., 2012), irregular waves (Nwogu and Demirbilek, 2010; Yao et al., 2016, 2019) and infragravity waves (Su et al., 2015; Su and Ma, 2018) over fringing reef profiles.
The solitary wave has been employed in many laboratory/numerical studies to model the leading wave of a tsunami. Compared to the aforementioned regular/irregular waves, the numerical investigations of solitary wave interaction with the laboratory reef profile are much fewer. Roeber and Cheung (2012) was the pioneer study to simulate the solitary wave transformation over a fringing reef using a Boussinesq model. Laboratory measurements of the cross-shore wave height and current across the reef as conducted by Roeber (2010) were reproduced by their model. More recently, Yao et al. (2018) also validated a Boussinesq model based on their laboratory experiments to assess the impacts of reef morphologic variations (fore-reef slope, back-reef slope, reef-flat width, reef-crest width) on the solitary wave run-up over the back-reef beach. Despite the above applications, several disadvantages still exist in using the Boussinesq-type models: (1) Boussinesq equations are subjected to the mild-slope assumption – thus using them for reefs with a steep fore-reef slope is questionable, particularly when there is a sharp reef crest located at the reef edge; (2) wave breaking could not be inherently captured by Boussinesq-type models – thus empirical breaking model or special numerical treatment is usually needed; (3) Boussinesq models could not resolve the vertical flow structure associated with the breaking waves due to the polynomial approximation to the vertical velocity profile.
To remedy the above deficiencies of using Boussinesq-type models to simulate the solitary processes (wave breaking, bore propagation and run-up) over the fringing reefs, we develop a 3-D numerical wave tank based on the computational fluid dynamics (CFD) tool OpenFOAM® (Open Field Operation and Manipulation) in this study. OpenFOAM® is a widely used open-source CFD code in the modern industry supporting two-phase incompressible flow (via its solver interFoam). With appropriate treatment of wave generation and absorption, it has been proven to be a powerful and efficient tool for exploring complicated nearshore wave dynamics (e.g., Higuera et al., 2013b). In this study, the Navier–Stokes equations for an incompressible fluid are solved. For the turbulence closure model, although large eddy simulation (LES) demands more computational resources than Reynolds-averaged Navier–Stokes (RANS) equations, it computes the large-scale unsteady motions explicitly. Importantly, it could provide more statistical information for the turbulence flows in which large-scale unsteadiness is significant (Pope, 2000). Thus the LES model is adopted by considering that the breaking-wave-driven flow around the reef edge/crest is fast and highly unsteady. The free-surface motions are tracked by the widely used volume-of-fluid (VOF) method.
In this study, we first validate the adopted model by the laboratory experiments of Roeber (2010) as well as our previous experiments (Yao et al., 2018). The robustness of the present model in reproducing such solitary wave processes as wave breaking near the reef edge/crest, turbulence bore propagating on the reef flat and wave run-up on the back-reef beach is demonstrated. The model is then applied to investigate the impacts of varying reef morphologies (fore-reef slope, back-reef slope, lagoon width, reef-crest width) on the solitary wave run-up. The flow and vorticity fields associated with the breaking solitary wave around the reef crest and the lagoon are also analyzed by the model results. The rest of this paper is organized as follows. The numerical model is firstly described in Sect. 2. It is then validated by the laboratory data from the literature as well as our data in Sect. 3. What follows in Sect. 4 are the model applications for which laboratory data are unavailable. The main conclusions drawn from this study are given in Sect. 5.
2.1 Governing equations
To simulate breaking-wave processes across the reef, the LES approach is employed to balance the need of resolving a large portion of the turbulent flow energy in the domain while parameterizing the unresolved field with a subgrid closure in order to maintain a reasonable computational cost. The filtered Navier–Stokes equations are essential to separate the velocity field that contains the large-scale components, which is performed by filtering the velocity field (Leonard, 1975). The filtered velocity in the ith spatial coordinate is defined as
where G(x, x′) is the filter kernel, which is a localized function. The eddy sizes are identified using a characteristic length scale, Δ, which is defined as
where Δx, Δy and Δz are the grid size in streamlines, spanwise and vertical directions, respectively. Eddies that are larger than Δ are roughly considered as large eddies, and they are directly solved. Those which are smaller than Δ are small eddies.
For incompressible flow, the filtered continuity and momentum equations are as follows:
where ρ is the water density, μ is the dynamic viscosity, is the filtered pressure, is the strain rate of the large scales defined as
and is the residual stress approximated by using subgrid-scale (SGS) models to get a full solution for the Navier–Stokes equations.
The residual stress is usually calculated by a linear relationship with the rate-of-strain tensor based on the Boussinesq hypothesis. The one-equation eddy viscosity mode, which is supposed to be better than the well-known Smagorinsky model for solving the highly complex flow and shear flow (Menon et al., 1996), is employed in the present study. Based on the one-equation model (Yoshizawa and Horiuti, 1985), the subgrid stresses are defined as
where δij is the Kronecker delta, and νt is the SGS eddy viscosity, which is given by
and the SGS kinetic energy kS needs to be solved by
where Ck=0.094, Cε=0.916 and Pr=0.9 as suggested by the OpenFOAM® user guide (OpenFOAM Foundation, 2013).
The presence of the free-surface interface between the air and water is treated through the commonly used VOF method (Hirt and Nichols, 1981), which introduces a volume fraction and solves an additional modeled transport equation for this quantity. The general representation of fluid density ρ is written as
where ρ1=1000 kg m−3 is the density of water, ρ2=1 kg m−3 is the density of air and α is the volume fraction of water contained in a grid cell. The distribution of α is modeled by the advection equation
The last term on the left side is an artificial compression term, avoiding the excessive numerical diffusion and the interface smearing; the new introduced is a velocity field suitable to compress the interface.
In the present solver interFoam, the algorithm PIMPLE, which is a mixture of the PISO (Pressure Implicit with Splitting of Operators) and SIMPLE (Semi-Implicit Method for Pressure-Linked Equations) algorithms, is employed to solve the coupling of velocity and pressure fields. The MULES (multidimensional universal limiter for explicit solution) method is used to maintain boundedness of the volume fraction independent of the underlying numerical scheme, mesh structure, etc. The Euler scheme is utilized for the time derivatives, the Gauss linear scheme is used for the gradient term and the Gauss linear corrected scheme is selected for the Laplacian term. The detailed implementation can be founded in the OpenFOAM® user guide (OpenFOAM Foundation, 2013).
2.2 Wave generation and absorption
Wave generation and absorption are essentials for a numerical wave tank, but they are not included in the official version of OpenFOAM®. Therefore, supplementary modules were developed by the other users, e.g., waves2Foam (Jacobsen et al., 2012) and IH-FOAM (Higuera et al., 2013a). In this study, the IH-FOAM is selected because it employs an active wave absorbing boundary and does not require an additional relaxation zone as used by waves2Foam. Meanwhile, it supports many wave theories including the solitary wave theory. The free surface and velocity for a solitary wave generation in IH-FOAM are (Lee et al., 1982)
where η is the free-surface elevation, H is the wave height, h is the water depth, , is the wave celerity, and u and w are the velocities in the streamwise and vertical directions, respectively.
3.1 Experimental settings
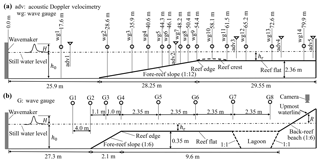
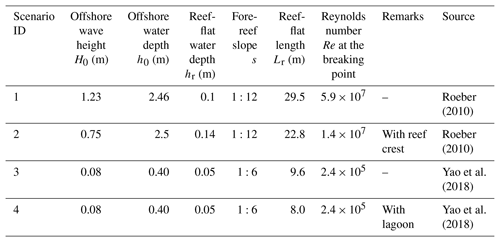
The first set of laboratory experiments serving as validation is from Roeber (2010), who reported two series of experiments conducted at Oregon State University, USA, in separate wave flumes. In this study, we only reproduce their experiments in the large wave flume, which is 104 m long, 3.66 m wide and 4.57 m high. As illustrated in Fig. 1a, the two-dimensional (2-D) reef model, starting at 25.9 m from the wavemaker, was built by a plane fore-reef slope attached to a horizontal reef flat 2.36 m high followed by a back-reef vertical wall. Both the waves and flows across the reef profile were measured by 14 wave gauges (wg1–wg14) and 5 ADVs (acoustic Doppler velocimeters), respectively. Only two scenarios for the reef with and without a trapezoidal reef crest subjected to two incident waves are reported in this study (see also Table 1). The large wave flume experiments enable us to test our model's ability to handle relatively large-scale nonlinear dispersive waves together with wave breaking, bore propagation and associated wave-driven flows. For a more detailed experimental setup, see Roeber (2010).
The second set of 2-D reef experiments for model validation comes from our previous work (Yao et al., 2018). These experiments were conducted in a small wave flume 40 m long, 0.5 m wide and 0.8 m high at the Changsha University of Science and Technology, P. R. China. As shown in Fig. 1b, a plane slope was built 27.3 m from the wavemaker and it was truncated by a horizontal reef flat 0.35 m high. A back-reef beach of 1:6 was attached to the end of the reef flat. The surface elevations were measured at eight cross-shore locations (G1–G8) and no flow measurement was performed. However, a CCD camera was installed to record the process of water uprush on the back-reef slope. Thus the model's robustness to capture the whole process of solitary wave transformation over the reef flat and run-up on the back-reef beach can be evaluated. In this study, we only simulate the tested idealized reef profile with and without a lagoon at the rear of reef flat subjected to the same wave condition (see also Table 1). The lagoon was formed by two 1:1 slopes connecting the reef flat and the toe of the back-reef beach to the flume bottom. The dimensions of the fore-reef slope and the reef flat, the water depths over the reef flat and the incoming wave heights were designed according to the Froude similarity with a target geometric-scale factor of 1:20. See Yao et al. (2018) for the detailed laboratory settings.
3.2 Numerical settings
By considering a balance between the computational accuracy and efficiency, the computational domain (Fig. 2a) is designed to reproduce the main aspects of the laboratory settings. We calibrate the model with the principle that the computed leading solitary wave height at the most offshore gauge should exactly reproduce its measurement. For a solitary wave, wave length (L) can be estimated as a distance containing 95 % of the total mass of the solitary wave, which yields . The largest offshore wave length according to the wave conditions in Table 1 is L=8.44 and 1.52 m for the scenario of Roeber (2010) and Yao et al. (2018), respectively. Thus, we reasonably put the numerical wave generation and absorption at a location 15 and 6 m from the toe of fore-reef slope, which is also the location of left boundary. Behind the reef flat, transmitted waves are allowed to run up on the back-reef beach, but they cannot overtop out of the computational domain due to a solid wall condition at the right boundary. In addition, we set the top boundary free to the atmosphere. For the two side faces, we employed the “empty” boundary in OpenFOAM to simulate the 2-D reef configurations. When solitary waves interact with the investigated laboratory reefs, strong turbulence is expected to be generated inside the domain where the wave breaks near the reef crest and propagates on the reef flat as a moving bore; thus we do not set the inflow boundary condition with desired turbulence characteristics for the LES at the wave generation boundary. Meanwhile, since both the laboratory reef surfaces are very smooth, the flow structure near the bottom is not resolved in our simulations, and we only impose a no-slip boundary condition at the reef surfaces by adjusting the velocity near the bottom to satisfy the logarithmic law of the wall.
Structured mesh is used to discretize the computational domain. The discretization is kept constant in the spanwise (y) direction (one layer of 20 and 10 mm for the Roeber, 2010, and Yao et al., 2018, scenarios, respectively) while it varies in the streamwise (x) direction to reduce the number of the total cells. From the left boundary to the toe of the fore-reef slopes, Δx decreases gradually from 100 to 20 mm for the Roeber (2010) scenario and from 24 to 8 mm for the Yao et al. (2018) scenario (see, e.g., Fig. 2b and c). The core region (see, e.g., Fig. 2d), covering from the fore-reef slope to the back-reef wall or beach, maintains constant cell sizes of Δx=20 mm and 8 mm for the two experiments, respectively. Grid refinement near the free surface (e.g., Fig. 2b and c) is conducted at the core region in the x direction by reducing the grid sizes to one-quarter of their original values, e.g., Δx=5 and 2 mm. For the vertical (z) direction, the grid size is initially set to be Δz=20 and 8 mm across the domain for the Roeber (2010) and Yao et al. (2018) scenarios, respectively. Grid refinement near the free surface (e.g., Fig. 2b and c) is also conducted across the domain by reducing the grid sizes to Δz=5 and 2 mm. The total computational mesh consists of 4.87 and 1.18 million cells for the Roeber (2010) and Yao et al. (2018) scenarios, respectively. The simulation duration is appointed to be 80 and 30 s to guarantee the arrival of the reflected waves at the most offshore wave gauge in both experiments. The time step is automatically adjusted during computation for a constant Courant number of 0.25. Via parallel computing, it takes approximately 16 and 2 d for the Roeber (2010) and Yao et al. (2018) scenarios, respectively, on a cluster server with 44 CPUs (Intel Xeon, E5-2696, 2.2 GHz). No notable improvement of the results could be found with further refinement of the grid size.
For LES modeling solitary wave breaking over reefs, it is crucial to examine the Reynolds number (Re) at the incipient breaking point where strong turbulence is generated. It could be calculated by with and , where Hb, hb, ub and cb are wave height, water depth, streamwise velocity and wave celerity at the breaking point, respectively. Re is estimated for all tested scenarios by using Hb=H0 and hb=hr (i.e., ignoring wave shoaling on the fore-reef slope and assuming wave breaking at the reef edge), and the values are also given in Table 1. Since the near-wall eddies are not resolved in this study, the total required grid number is independent of Re (Pope, 2000). The ideal grid size of the LES model should be down to the Kolmogorov scale, which is not feasible due to the limitation of computational resources. To test the convergence of grid size, we take the experiment with smaller wave flume (i.e., Scenario 3 in Table 1) which requires finer grid resolution as an example. We only examine the grid across the reef profile (the aforementioned core region) where the effect of grid size is supposed to be most influential. Both grid sizes (Δx and Δy) ranging from 8 mm down to 1 mm are tested. The results in terms of the dimensionless free-surface elevation and streamwise velocity associated with the leading solitary wave in the inner reef flat (G7) are compared in Fig. 3. Only differences of less than 2 % in terms of wave and flow could be observed with the grid size varying from 2 to 1 mm, indicating that our selection of grid size mm is sufficient for the current simulations.
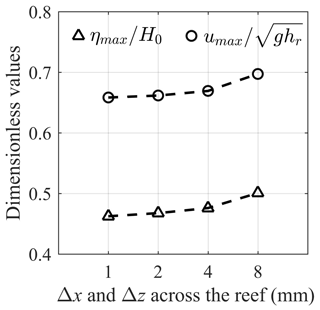
Figure 3Variation of the maximum dimensionless free-surface elevation () and streamwise velocity () at G7 with the grid size (Δx and Δy) across the reef for case 3 in Table 1.
To evaluate the performance of the model, the model skill value is adopted and calculated by Wilmott (1981):
where Ymodel is the predicted value and Yobs is the measured value. The overline indicates that the average value is taken. The higher the skill number (close to 1), the better performance of the numerical model.
3.3 Comparison between numerical and experimental results
Figure 4 compares the computed and the measured cross-shore distribution of the free-surface elevations (η) at different stages (t) for Scenario 1, where η is normalized by the offshore still water depth (h0) and t is normalized by . The incident solitary wave gets steeper on the fore-reef slope at due to the shoaling effect. Then its front becomes vertical prior to breaking at . At , a plunging breaker occurs with air entrainment and splash-up near the reef edge. After that, the breaking wave starts to travel on the reef flat in the form of a propagating turbulent bore at . The bore shows a gradual reduction in amplitude and continues to propagate downstream on the reef flat at . The numerical results generally agree well with the laboratory measurements at all stages with the skill values larger than 0.85, indicating the robustness of the adopted model to address the solitary wave processes across the laboratory reef profile in the large wave flume. When comparing the predictions between our Navier–Stokes-equation-based model and a Boussinesq model adopted by Roeber (2010), it seems that our model better captures the steep slope of the near-breaking wave () and breaking wave ().
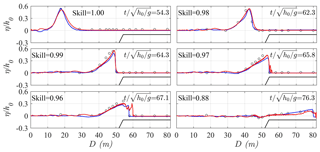
Figure 4Dimensionless free-surface elevations (η∕h0) across the reef at different stages ( for Scenario 1. Red lines – present simulations; blue lines – simulations from Roeber (2010); open circles – measurements from Roeber (2010); skill values are for the present simulations.
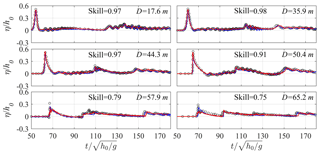
Figure 5Time series of dimensionless free-surface elevations (η∕h0) at different cross-shore distances from the wavemaker (D) for Scenario 1. Red lines – present simulations; blue lines – simulations from Roeber (2010); open circles – measurements from Roeber (2010); skill values are for the present simulations.
Figure 5 illustrates the computed and measured time series of dimensionless free-surface elevations (η∕h0) at different cross-shore locations (D) for Scenario 1. It appears that the model reasonably simulates the transformation processes of the solitary wave on the fore-reef slope (D=35.9 and 44.3 m) and near the reef edge (D=50.4 m) with the skill values larger than 0.9. The skill values relatively decrease right after the incipient wave breaking point (D=57.9 m) and at the central reef flat (D=65.2 m). Such discrepancies may be primarily due to the air entrainment in measuring both the breaking wave and the moving bore (Roeber, 2010) as well as the air bubble effect on free-surface tracking by the VOF method. In addition, the second peaks in the time series are due to wave reflection from the back-reef wall, which are well predicted by the present model. Meanwhile, no notable difference could be found in view of the time-series predictions between the present model and the model of Roeber (2010), except at D=65.2 m where the bore amplitude decays in our simulation compared to that at D=57.9 m.
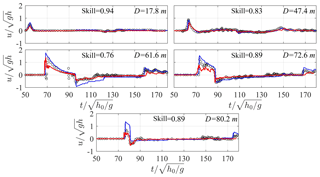
Figure 6Time series of dimensionless streamwise velocity () at different cross-shore distances from the wavemaker (D) for Scenario 1. Red lines – present simulations; blue lines – simulations from Roeber (2010); open circles – measurements from Roeber (2010); skill values are for the present simulations.
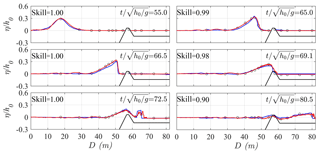
Figure 7Dimensionless free-surface elevations (η∕h0) across the reef at different stages () for Scenario 2. Red lines – present simulations; blue lines – simulations from Roeber (2010); open circles – measurements from Roeber (2010); skill values are for the present simulations.
Figure 6 depicts the time series of streamwise velocity (u) at five cross-shore locations (D) for Scenario 1, in which u is normalized by the local shallow water wave speed (). The model satisfactorily captures the measured velocity offshore (D=17.8 m), on the fore-reef slope (D=47.4 m), on the central reef flat (D=72.6 m) and near the shoreline (D=80.2 m). A transition from the subcritical flow () to supercritical flow () could be observed right after wave breaking (D=61.6 m), and a less satisfactory prediction (skill values = 0.76) at this location is probably again due to both the effect of air bubbles on both flow measurements in the experiments and free-surface tracking in the simulations. Overall, the adopted model outperforms the Boussinesq model of Roeber (2010) in view of the velocity predictions, particularly both near the breaking point (D=61.6 m) and the shoreline on the reef flat (D=80.2 m).
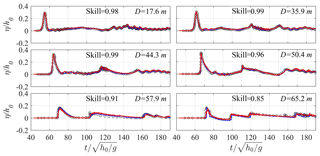
Figure 8Time series of dimensionless free-surface elevations (η∕h0) at different cross-shore distances from the wavemaker (D) for Scenario 2. Red lines – present simulations; blue lines – simulations from Roeber (2010); open circles – measurements from Roeber (2010); skill values are for the present simulations.
As previously introduced, the reef profile of Scenario 2 is identical to that of Scenario 1 except for a reef crest located at the reef edge. The cross-shore distribution of dimensionless free-surface elevations (η∕h0) at different stages () for Scenario 2 is demonstrated in Fig. 7. The steepened shoaling wave on the fore-reef slope appears at and its front becomes almost vertical prior to breaking at . The breaking wave begins to overtop over the reef crest (), and it then collapses on the lee side of reef crest, resulting in a moving turbulent bore (). The bore travels shoreward on the reef flat with the continuous damping of its magnitude (). The skill values for all sampling locations in this scenario are larger than 0.9, implying that the adopted model is able to well address the solitary wave processes over a more complicated reef geometry such as the presence of a reef crest at the reef edge. Again, the present model predicts the near-breaking wave () and breaking wave ( and ) slightly better than the model adopted by Roeber (2010).
Figure 8 compares the measured and simulated times-series of dimensionless free-surface elevations (η∕h0) at various cross-shore locations (D) for Scenario 2. The skill values at all locations are larger than 0.85. It suggest again that the present model not only reasonably reproduces wave propagation offshore (D=17.6 m), shoaling on the fore-reef slope (D=35.9 and 44.3 m) and near breaking in front of the reef crest (D=50.4 m), breaking-wave transformation over the reef crest (D=57.9 m) and bore evolution on the reef flat (D=65.2 m), but also captures the tail waves caused by wave reflection from the back-reef wall (see, e.g., D=65.2 m). Overall, both our model and the model of Roeber (2010) reproduce the time series of free-surface elevations equally well for this scenario.

Figure 9Time series of dimensionless streamwise velocity () at the cross-shore distance D=54.4 m from the wavemaker for Scenario 2. Red lines – present simulations; blue lines – simulations from Roeber (2010); open circles – measurements from Roeber (2010); skill values are for the present simulations.
As for Scenario 2, Roeber (2010) only reported one location of flow measurement on the seaside face of the reef crest. Figure 9 presents the time series of dimensionless streamwise velocity () at the point x=54.4 m, and a skewed and peaky velocity profile is observed to be associated with the leading solitary wave because the position is very close to the incipient wave breaking point. The two secondary peaks in the time series are generated by the reflected waves from the reef crest and from the back-reef wall, respectively. The model captures the temporal variation of the current fairly well with the skill value of 0.86, and its prediction is also better than that from the model of Roeber (2010), particularly for the reflected waves.
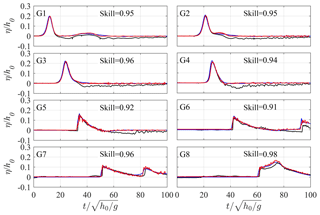
Figure 10Time series of dimensionless free-surface elevations (η∕h0) at different cross-shore sampling locations (G1–G8) for Scenario 3. Red lines – present simulations; blue lines – simulations from Yao et al. (2008); black lines – measurements from Yao et al. (2008); skill values are for the present simulations.
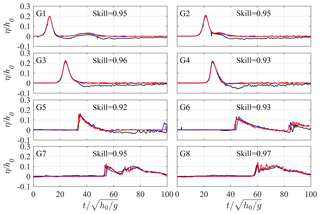
Figure 11Time series of dimensionless free-surface elevations (η∕h0) at different cross-shore sampling locations (G1–G8) for Scenario 4. Red lines – present simulations; blue lines – simulations from Yao et al. (2008); black lines – measurements from Yao et al. (2008); skill values are for the present simulations.
The experiments of Yao et al. (2018) only measured the time series of wave records at limited locations (G1–G8) across the reef as well as the maximum wave run-up on the final beach. Figure 10 compares the computed and measured time series of free-surface elevations for Scenario 3. The overall agreement between the simulations and experiments for G1–G8 is very good, with the skill values at all locations larger than 0.9. When the solitary wave travels from the toe (G2) to the middle of fore-reef slope (G3), it gets steeper due to the shoaling effect. Wave breaking starts at a location right before the reef edge (G4), and the surf zone processes extend over the reef flat in the form of a moving bore. Thus, from G5 to G8, the wave time series show saw-shaped profiles and there is a cross-shore decrease in the leading solitary wave height. Such features of the breaking waves are also well captured by the model. Note that the second peak in the time series of G7 is due to wave reflection from the back-reef beach, and the incident and reflected waves are not fully separated from each other at G8 because this location is too close to the beach. The predicted and measured wave run-ups are 0.122 and 0.109 m, respectively, for this scenario. Compared to the Boussinesq model employed by Yao et al. (2018), no significant difference in the predicted time series could be found for the present Navier–Stokes-equation-based model.
Figure 11 depicts the same comparison of wave time series but for the reef profile with a lagoon (Scenario 4). Again, the model performance for this scenario is fairly good (all skill values larger than 0.9). The predicted and measured wave run-ups are 0.123 and 0.116 m, respectively, for this scenario. Notable mismatch only appears for those small wave oscillations generated by the reflected wave propagating out of the lagoon to the reef flat (i.e., from G8 to G6). But our model seems to be superior to the model of Yao et al. (2018) in reproducing those oscillations at G7 and G8. We finally remark that the tail of the leading solitary wave, particularly from G1 to G4, is below the initial water level in the laboratory data, which is due to the water lost to form the generated wave crest around the paddle of the wavemaker. However, such a phenomenon is not observed in the numerical results because we generate a theoretical solitary wave in the numerical domain as indicated by Eq. (11).
4.1 Effects of reef morphology variations on the solitary wave run-up
In this section, we apply the well-validated LES model to examine the variations of reef morphological parameters (fore-reef slope, back-reef slope, lagoon width, reef-crest width) that may affect the wave run-up (R) on the back-reef beach. Based on Scenario 3 (1:6 for both the slopes of fore reef and back reef, 9.6 m for the reef length, no reef crest and no lagoon) from Yao et al. (2018), we firstly test five slopes (1:2, 1:4, 1:6, 1:8 and 1:10, which all fall within the common range of 1:1 to 1:20 in the reported field observations; see, e.g., Table 1 of Quataert et al., 2015) for both the fore reef and the back reef. We then consider the existence of a lagoon at the rear of reef flat by testing four upper widths of the lagoon (1.6, 3.2, 4.8 and 6.4 m) and comparing to the case without a lagoon (lagoon width = 0 m). We finally investigate a trapezoidal reef crest located at the reef edge with its seaward slope matching the fore-reef slope and its shoreward slope of 1:1. We examine five reef-crest widths (0.1, 0.2, 0.3, 0.4 and 0.5 m) in view that the dimension of reef crest at the field scale is on the magnitude of meters (see, e.g., Hench et al., 2008). During simulations, each run is performed by changing one of above morphological parameters while keeping other parameters unaltered. All runs are conducted under a combination of one solitary wave height (H0=0.08 m) and two reef-flat water depths (hr=0.05 m and hr=0.1 m).
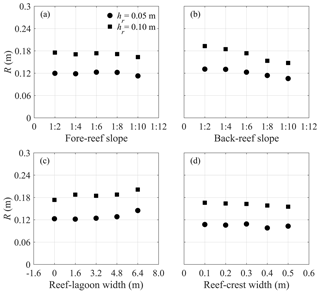
Figure 12The predicted wave run-up on the back-reef beach (R) under H0=0.08 m with varying (a) fore-reef slopes, (b) back-reef slopes, (c) lagoon widths and (d) reef-crest widths.
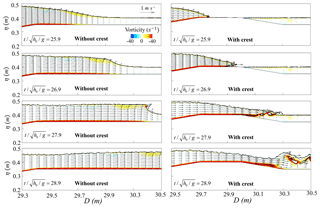
Figure 13Comparison of wave-driven current and vorticity on the x–z plane at different stages () between the reefs with and without the reef crest (H0=0.08 m and hr=0.05 m).
Generally, Fig. 12a shows that R is not very sensitive to the change in the fore-reef slope within the tested range, in that wave breaking for this scenario occurs close to the reef edge (G4); thus most of the surf zone processes and associated energy dispassion complete on the reef flat. Only when the fore-reef slope becomes steeper than 1:8, R decreases slightly under both water depths (hr), which is attributed to the increased fore-reef reflection of the incident wave energy. Figure 12b reveals that R is more sensitive to the back-beach slope under both hr. It decreases significantly as the back-beach slope becomes milder, which is consistent with that found for the plane slope (see, e.g., Synolakis, 1987). Figure 12c shows the variation of R with the lagoon width. Note that the zero width represents the reef without a lagoon. It appears that R increases notably with the increase in lagoon width because a wider lagoon dissipates less wave energy partly due to the stoppage of propagating bore and partly due to the reduction of bottom friction. As for the effect of reef-crest width (Fig. 12d), although the presence of a reef crest is reported to be an important factor affecting the wind wave transformation over fringing reefs (e.g., Yao et al., 2017), it seems to have little impact on the solitary wave run-up under both hr; a slight decline of R could only be found under crest widths larger than 0.4. This is because the solitary wave is very long compared to the reef-crest width; thus most of its energy could transmit over the narrow reef crest. However, when the reef crest becomes sufficiently wide, its shallower crest tends to energize the wave breaking and thus the energy dissipation. To summarize all above analyses, it can be concluded that coastal regions protected by the fringing reefs with steeper back-reef slopes and wider lagoons are more valuable to coastal inundation during a tsunami event.
4.2 Wave-driven current and vortices around the reef crest and the lagoon
One advantage of the current Navier–Stokes-equation-based model over the depth-integrated models is its ability to resolve the vertical flow structure under breaking waves, particularly around the complex reef geometry. Based on the reef profile of Yao et al. (2018), Fig. 13 shows the simulated wave-driven current and vorticity on the x–z plane at different stages () for the reefs with and without a reef crest at the reef edge subjected to the same solitary wave condition (H0=0.08 m and hr=0.05 m). Without the reef crest, the shoaling wave propagates onto the horizontal reef flat with a uniform velocity distribution underneath ( and 26.9), which is typical for the shallow water long waves. Until , wave breaking occurs in the form of a plunging breaker, and vortex generation gathers mainly around the wave crest. The vortices are transported further downstream at . When the wave crest exists, incipient wave breaking moves seaward and it takes place at the seaside edge of the reef crest (). The breaker then overtops over the reef crest () and plunges onto the reef flat lee side of the reef crest, resulting in a hydraulic jump (). Consequently, the wave-driven current at the rear part of the reef crest is dramatically increased compared to the same location without the crest. Both the intensity and the extent of vortex generation are also enlarged at the lee side of the reef crest (), leading to increased wave energy dissipation compared to the case without the reef crest.
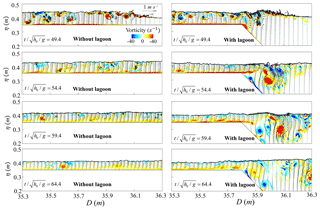
Figure 14Comparison of wave-driven current and vorticity on the x–z plane at different stages () between the reefs with and without the lagoon (H0=0.08 m and hr=0.05 m).
Figure 14 compares the computed wave-driven current and vorticity on the x–z plane at different stages () between the reefs in the presence and absence of the lagoon. Without the lagoon, the propagating bore arrives with strong vortex motions (). The vortices are eventfully transported downstream from to 64.4. However, when the lagoon is present, the current speed over the depth slows down and additional vortices generate at the seaside edge of the lagoon as the bore propagates into the lagoon (). The peak value of the vorticity appears at a later time (). After that, the vortices in the lagoon are primarily diffused by the vortex shedding ( and 64.4). Compared to the case without the lagoon, although the existence of a lagoon dissipates less wave energy by terminating the propagating bore and reducing the reef-flat friction as previously stated, the vortex generation and diffusion in the lagoon as demonstrated here are believed to cause local energy loss. We finally remark that the wave-driven current and vortices examined in this section could provide a first step to analyze more sophisticated problems, such as the tsunami-induced sediment/debris transport over the fringing reefs.
To remedy the inadequacies of using the depth-integrated models to simulate the interaction between tsunami-like solitary waves and fringing reefs, a 3-D numerical wave tank, solving the Navier–Stokes equations with the LES for turbulence closure, has been developed based on the open-source CFD tool OpenFOAM®. The free surface is tracked by the VOF method. Two existing laboratory experiments with the wave, flow and wave run-up measurements based on different fringing reef profiles are employed to validate the numerical model. Simulations show that the current Navier–Stokes-equation-based model outperforms the commonly used Boussinesq-type models in view of its capability to better reproduce the breaking waves and wave-driven current on the reef flat. The model is then applied to investigate the impacts of varying morphologic features on the back-reef wave run-up. The flow and vorticity fields associated with the breaking solitary wave around the reef crest and the lagoon are also analyzed via the numerical simulations.
Model results shows that wave run-up on the back-reef slope is most sensitive to the variation of the back-reef slope, less sensitive to the lagoon width, and almost insensitive to the variations of both the fore-reef slope and the reef-crest width within our tested ranges. The existence of a reef crest or a lagoon can notably alter the wave-driven current and vortex evolutions on the reef flat. These findings demonstrate that low-lying coastal areas fringed by coral reefs with steep back-reef slopes and larger lagoons are expected to experience larger wave run-up near the shoreline; thus they are more susceptible to coastal inundation during a tsunami event.
Most of the simulations are made available in the figures of this paper. The raw simulated data used in this study are available upon request (zzdeng@zju.edu.cn).
YY and LC performed the data analyses and wrote the paper. TH prepared the experimental data. ZD and HG performed the numerical simulations.
The authors declare that they have no conflict of interest.
This research has been supported by the National Natural Science Foundation of China (grant nos. 51679014 and 11702244), the Hunan Science and Technology Plan Program (grant no. 2017RS3035), and the Open Foundation of the Key Laboratory of Coastal Disasters and Defense of Ministry of Education (grant no. 201602).
This paper was edited by Maria Ana Baptista and reviewed by two anonymous referees.
Chatenoux, B., and Peduzzi, P.: Impacts from the 2004 Indian Ocean Tsunami: analysing the potential protecting role of environmental features, Nat. Hazards, 40, 289–304, 2007.
Cheriton, O. M., Storlazzi, C. D., and Rosenberger, K. J.: Observations of wave transformation over a fringing coral reef and the importance of low-frequency waves and offshore water levels to runup, overwash, and coastal flooding, J. Geophys. Res.-Oceans, 121, 3121–3140, https://doi.org/10.1002/2015JC011231, 2016.
Craik, A. D. and Leibovich, S.: A rational model for Langmuir circulations. J. Fluid Mech., 73, 401–426, 1976.
Dahdouh-Guebas, F., Koedam, N., Danielsen, F., Sørensen, M. K., Olwig, M. F., Selvam, V., Parish, F., Burgess, N. D., Topp-Jørgensen, E., Hiraishi, T., Karunagaran, V. M., Rasmussen, M. S., Hansen, L. B., Quarto, A., and Suryadiputra, N.: Coastal vegetation and the asian tsunami, Science, 311, 37–38, 2006.
Danielsen, F., Sørensen, M. K., Olwig, M. F., Selvam, V., Parish, F., Burgess, N. D., Hiraishi, T., Karunagaran, V. M., Rasmussen, M. S., Hansen, L. B., Quarto, A., and Suryadiputra, N.: The asian tsunami: a protective role for coastal vegetation, Science, 310, 643–643, 2005.
Douillet, P., Ouillon, S., and Cordier, E.: A numerical model for fine suspended sediment transport in the southwest lagoon of New Caledonia, Coral Reefs, 20, 361–372, 2001.
Ford, M., Becker, J. M., Merrifield, M. A., and Song, Y. T.: Marshall islands fringing reef and atoll lagoon observations of the Tohoku Tsunami, Pure Appl. Geophys., 171, 3351–3363, 2014.
Gourlay, M. R.: Wave set-up on coral reefs. 2. Wave set-up on reefs with various profiles, Coast. Eng., 28, 17–55, 1996.
Hench, J. L., Leichter, J. J., and Monismith, S. G.: Episodic circulation and exchange in a wave-driven coral reef and lagoon system, Limnol. Oceanogr., 53, 2681–2694, 2008.
Higuera, P., Lara, J. L., and Losada, I. J.: Realistic wave generation and active wave absorption for Navier–Stokes models application to OpenFOAM®, Coast. Eng., 71, 102–118, 2013a.
Higuera, P., Lara, J. L., and Losada, I. J.: Simulating coastal engineering processes with OpenFOAM®, Coast. Eng., 71, 119–134, 2013b.
Hirt, C. W. and Nichols, B. D.: Volume of fluid (VOF) method for the dynamics of free boundaries, J. Comput. Phys., 39, 201–225, 1981.
Huang, Z., Yao, Y., Sim, S. Y., and Yao, Y.: Interaction of solitary waves with emergent, rigid vegetation, Ocean Eng., 38, 1080–1088, 2011.
Jacobsen, N. G., Fuhrman, D. R., and Fredsøe, J.: A wave generation toolbox for the open-source CFD library: OpenFoam®, Int. J. Numer. Meth. Fluids, 70, 1073–1088, 2012.
Kraines, S. B., Yanagi, T., Isobe, M., and Komiyama, H.: Wind-wave-driven circulation on the coral reef at Bora Bay, Miyako Island, Coral Reefs, 17, 133–143, 1998.
Kunkel, C. M., Hallberg, R. W., and Oppenheimer, M.: Coral reefs reduce tsunami impact in model simulations, Geophys. Res. Lett., 33, 265–288, 2006.
Lee, J. J., Skjelbreia, J. E., and Raichlen, F.: Measurement of velocities in solitary waves, J. Waterw. Port C-ASCE, 108, 200–218, 1982.
Leonard, A.: Energy cascade in large-eddy simulations of turbulent fluid flows, Adv. Geophys., 18, 237–248, 1975.
Longuet-Higgins, M. S. and Stewart, R. W.: Radiation stresses in water waves; a physical discussion, with applications, Deep-Sea Res., 11, 529–562, 1964.
Lowe, R. J., Falter, J. L., Bandet, M. D., Pawlak, G., and Atkinson, M. J.: Spectral wave dissipation over a barrier reef, J. Geophys. Res., 110, C04001, https://doi.org/10.1029/2004JC002711, 2005.
Lowe, R. J., Falter, J. L., Monismith, S. G., and Atkinson, M. J.: Wave-driven circulation of a coastal reef-lagoon system, J. Phys. Oceanogr., 39, 873–893, 2009a.
Lowe, R. J., Falter, J. L., Monismith, S. G., and Atkinson, M. J.: A numerical study of circulation in a coastal reef-lagoon system, J. Geophys. Res., 114, C06022, https://doi.org/10.1029/2008JC005081, 2009b.
Lowe, R. J., Hart, C., and Pattiaratchi C. B.: Morphological constraints to wave-driven circulation in coastal reef-lagoon systems: A numerical study, J. Geophys. Res., 115, C09021, https://doi.org/10.1029/2009JC005753, 2010.
Lugo-Fernandez, A., Roberts, H. H., and Suhayda, J. N.: Wave transformations across a Caribbean fringing-barrier Coral Reef, Cont. Shelf Res., 18, 1099–1124, 1998.
Maza, M., Lara, J. L., and Losada, I. J.: Tsunami wave interaction with mangrove forests: a 3-d numerical approach, Coast. Eng., 98, 33–54, 2015.
Mcadoo, B. G., Ah-Leong, J. S., Bell, L., Ifopo, P., Ward, J., Lovell, E., and Skelton, P.: Coral reefs as buffers during the 2009 South Pacific Tsunami, Upolu Island, Samoa, Earth-Sci. Rev., 107, 147–155, 2011.
Menon, S., Yeung, P. K., and Kim, W. W.: Effect of subgrid models on the computed interscale energy transfer in isotropic turbulence, Comput. Fluids, 25, 165–180, 1996.
Nwogu, O. and Demirbilek, Z.: Infragravity wave motions and run-up over shallow fringing reefs, J. Waterw. Port C., 136, 295–305, 2010.
OpenFOAM Foundation: OpenFOAM® User Guide, available at: http://www.openfoam.org (last access: 25 November 2016), 2013.
Péquignet, A. C., Becker, J. M., Merrifield, M. A., and Boc S. J.: The dissipation of wind wave energy across a fringing reef at Ipan, Guam, Coral Reefs, 30, 71–82, 2011.
Pope, S. B.: Turbulent flows, Cambridge University Press, Cambridge, UK, 2000.
Quataert, E., Storlazzi, C., Van Rooijen, A., Cheriton, O., and Van Dongeren, A.: The influence of coral reefs and climate change on wave-driven flooding of tropical coastlines, Geophys. Res. Lett., 42, 6407–6415, https://doi.org/10.1002/2015GL064861, 2015.
Roeber, V.: Boussinesq-type mode for nearshore wave processes in fringing reef environment, PhD Thesis, University of Hawaii at Manoa, Honolulu, HI, 2010.
Roeber, V. and Cheung, K. F.: Boussinesq-type model for energetic breaking waves in fringing reef environments, Coast. Eng., 70, 1–20, 2012.
Skotner, C. and Apelt, C. J.: Application of a Boussinesq model for the computation of breaking waves, Part 2: wave-induced setdown and set-up on a submerged coral reef, Ocean Eng., 26, 927–947, 1999.
Su, S. F. and Ma, G.: Modeling two-dimensional infragravity motions on a fringing reef, Ocean Eng., 153, 256–267, 2018.
Su, S. F., Ma, G., and Hsu, T. W.: Boussinesq modeling of spatial variability of infragravity waves on fringing reefs, Ocean Eng., 101, 78–92, 2015.
Synolakis, C. E.: The runup of solitary waves, J. Fluid Mech., 185, 523–545, 1987.
Tang, J., Causon, D., Mingham, C., and Qian, L.: Numerical study of vegetation damping effects on solitary wave run-up using the nonlinear shallow water equations, Coast. Eng., 75, 21–28, 2013.
Van Dongeren, A. V., Lowe, R., Pomeroy, A., Trang, D. M., Roelvink, D., Symonds, G., and Ranasinghe, R.: Numerical modeling of low-frequency wave dynamics over a fringing coral reef, Coast. Eng., 73, 178–190, 2013.
Willmott, C. J.: On the validation of models, Phys. Geogr., 2, 184–194, 1981.
Yao, Y., Huang, Z. H., Monismith, S. G., and Lo, E. Y. M.: 1DH Boussinesq modeling of wave transformation over fringing reefs, Ocean Eng., 47, 30–42, 2012.
Yao, Y., Du, R. C., Jiang, C. B., Tang, Z. J., and Yuan, W. C.: Experimental study of reduction of solitary wave run-up by emergent rigid vegetation on a beach, J. Earthq. Tsunami, 9, 1540003, https://doi.org/10.1142/S1793431115400035, 2015.
Yao, Y., Becker, J. M., Ford, M. R., and Merrifield, M. A.: Modeling wave processes over fringing reefs with an excavation pit, Coast. Eng., 109, 9–19, 2016.
Yao, Y., He, W. R., Du, R. C., and Jiang, C. B.: Study on wave-induced setup over fringing reefs in the presence of a reef crest, Appl. Ocean Res., 66, 164–177, 2017.
Yao, Y., He, F., Tang, Z. J., and Liu, Z. S.: A study of tsunami-like solitary wave transformation and run-up over fringing reefs, Ocean Eng., 149, 142–155, 2018.
Yao, Y., Zhang, Q. M., Chen, S. G, and Tang, Z. J.: Effects of reef morphology variations on wave processes over fringing reefs, Appl. Ocean Res., 82, 52–62, 2019.
Yoshizawa, A. and Horiuti, K.: A statistically-derived subgridscale kinetic energy model for the large-eddy simulation of turbulent flows, J. Phys. Soc. Jpn., 54, 2834–2839, 1985.
Young, I. R.: Wave transformations over coral reefs, J. Geophys. Res.-Oceans, 94, 9779–9789, 1989.


