the Creative Commons Attribution 4.0 License.
the Creative Commons Attribution 4.0 License.
 | 10 Nov 2021
EUNADICS-AV early warning system dedicated to supporting aviation in the case of a crisis from natural airborne hazards and radionuclide clouds
Nicolas Theys
Lieven Clarisse
Jeroen van Gent
Daniel R. Hurtmans
Sophie Vandenbussche
Nikolaos Papagiannopoulos
Lucia Mona
Timo Virtanen
Andreas Uppstu
Mikhail Sofiev
Luca Bugliaro
Margarita Vázquez-Navarro
Pascal Hedelt
Michelle Maree Parks
Sara Barsotti
Mauro Coltelli
William Moreland
Simona Scollo
Giuseppe Salerno
Delia Arnold-Arias
Marcus Hirtl
Tuomas Peltonen
Juhani Lahtinen
Klaus Sievers
Florian Lipok
Rolf Rüfenacht
Alexander Haefele
Maxime Hervo
Saskia Wagenaar
Wim Som de Cerff
Jos de Laat
Arnoud Apituley
Piet Stammes
Quentin Laffineur
Andy Delcloo
Robertson Lennart
Carl-Herbert Rokitansky
Arturo Vargas
Markus Kerschbaum
Christian Resch
Raimund Zopp
Matthieu Plu
Vincent-Henri Peuch
Michel Van Roozendael
Gerhard Wotawa
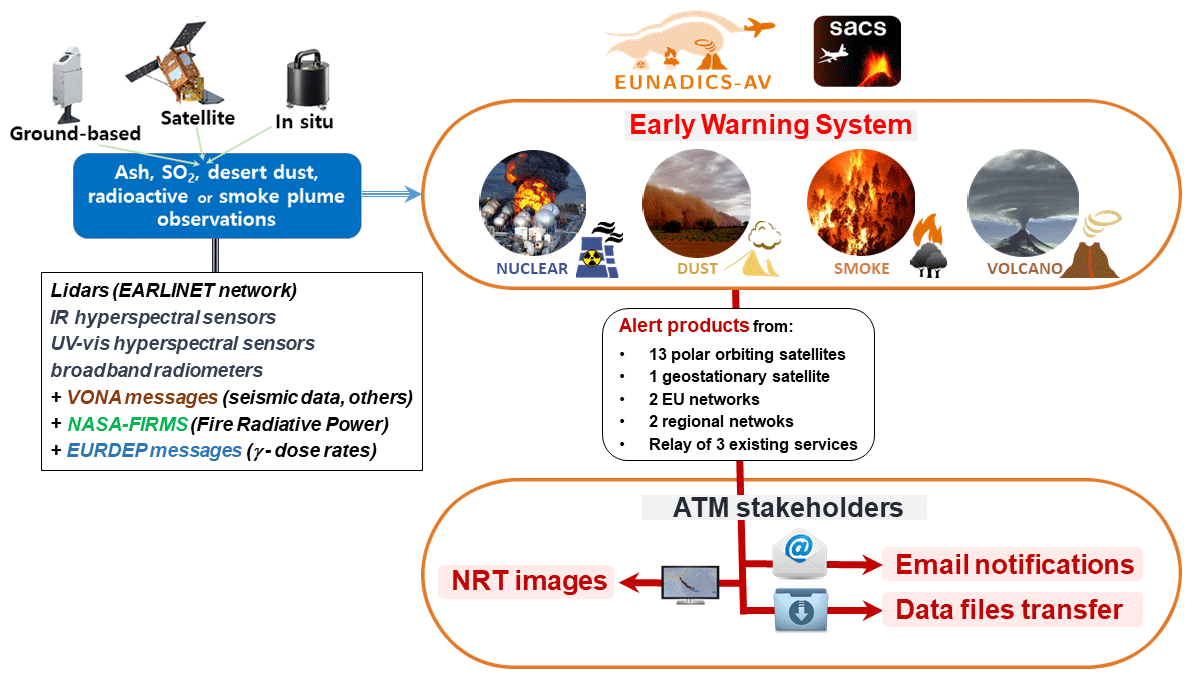
The purpose of the EUNADICS-AV (European Natural Airborne Disaster Information and Coordination System for Aviation) prototype early warning system (EWS) is to develop the combined use of harmonised data products from satellite, ground-based and in situ instruments to produce alerts of airborne hazards (volcanic, dust, smoke and radionuclide clouds), satisfying the requirement of aviation air traffic management (ATM) stakeholders (https://cordis.europa.eu/project/id/723986, last access: 5 November 2021). The alert products developed by the EUNADICS-AV EWS, i.e. near-real-time (NRT) observations, email notifications and netCDF (Network Common Data Form) alert data products (called NCAP files), have shown significant interest in using selective detection of natural airborne hazards from polar-orbiting satellites. The combination of several sensors inside a single global system demonstrates the advantage of using a triggered approach to obtain selective detection from observations, which cannot initially discriminate the different aerosol types. Satellite products from hyperspectral ultraviolet–visible (UV–vis) and infrared (IR) sensors (e.g. TROPOMI – TROPOspheric Monitoring Instrument – and IASI – Infrared Atmospheric Sounding Interferometer) and a broadband geostationary imager (Spinning Enhanced Visible and InfraRed Imager; SEVIRI) and retrievals from ground-based networks (e.g. EARLINET – European Aerosol Research Lidar Network, E-PROFILE and the regional network from volcano observatories) are combined by our system to create tailored alert products (e.g. selective ash detection, SO2 column and plume height, dust cloud, and smoke from wildfires). A total of 23 different alert products are implemented, using 1 geostationary and 13 polar-orbiting satellite platforms, 3 external existing service, and 2 EU and 2 regional ground-based networks. This allows for the identification and the tracking of extreme events. The EUNADICS-AV EWS has also shown the need to implement a future relay of radiological data (gamma dose rate and radionuclides concentrations in ground-level air) in the case of a nuclear accident. This highlights the interest of operating early warnings with the use of a homogenised dataset. For the four types of airborne hazard, the EUNADICS-AV EWS has demonstrated its capability to provide NRT alert data products to trigger data assimilation and dispersion modelling providing forecasts and inverse modelling for source term estimate. Not all of our alert data products (NCAP files) are publicly disseminated. Access to our alert products is currently restricted to key users (i.e. Volcanic Ash Advisory Centres, national meteorological services, the World Meteorological Organization, governments, volcano observatories and research collaborators), as these are considered pre-decisional products. On the other hand, thanks to the EUNADICS-AV–SACS (Support to Aviation Control Service) web interface (https://sacs.aeronomie.be, last access: 5 November 2021), the main part of the satellite observations used by the EUNADICS-AV EWS is shown in NRT, with public email notification of volcanic emission and delivery of tailored images and NCAP files. All of the ATM stakeholders (e.g. pilots, airlines and passengers) can access these alert products through this free channel.
- Article
(17819 KB) - Full-text XML
-
Supplement
(1024 KB) - BibTeX
- EndNote


Hazardous clouds can very often be a considerable threat to human society, especially for the life, health and properties of a population. Such a threat can come from gas and aerosol emissions in the vicinity of a volcano (Baxter et al., 1999; Forbes et al., 2003; Hansell et al., 2006), in the surrounding area of a desert (Tobias et al., 2019) or near a wildfire (Fowler, 2003) or due to a nuclear accident (Bennett et al., 2006). Due to atmospheric transport, airborne particle clouds may also travel to areas several thousand kilometres away from the source. Such airborne particles can impact atmospheric dynamics, making meteorological processes difficult to understand (Knippertz and Todd, 2012). It can also cause worrying implications and damage for aviation (Casadevall, 1994; Casadevall et al., 1996; Miller and Casadevall, 1999; Guffanti et al., 2010; Tulet and Villeneuve, 2011; AlKheder and AlKandari, 2020; Khaykin et al., 2020) and critical deposition (Panebianco et al., 2017; Easdale and Bruzzone, 2018; Ridley et al., 2012; Zheng et al., 2020; Smith and Clark, 1986; Persson et al., 1987). The transport of hazardous gas and aerosol clouds (e.g. SO2, ash, dust, smoke and radionuclide) is a challenge for modellers, especially when a mix of particles occurs (Koch et al., 2006; Evangeliou and Eckhardt, 2020). The use of satellite data (Prata, 2009; Prata et al., 2010; Theys et al., 2013, 2019; Clarisse et al., 2013, 2019; Christian et al., 2020; Khaykin et al., 2020) and ground-based networks (Ansmann et al., 2011, 2021; Pappalardo et al., 2013; D'Amico et al., 2015; Osborne et al., 2019; Hernández-Ceballos et al., 2020) is essential in the dispersion modelling process. It makes it possible, as it can provide information about the source of an emission; discriminate the type of particles; and provide the geolocation of the hazardous cloud, a crucial input for transport models.
1.1 Motivation
The infrastructures of the international operational meteorological communities play a critical role in the effort to strengthen disaster resilience. To address this particular responsibility in Europe, 31 members of the network of European national meteorological services (NMSs) have signed an agreement for the establishment of an economic interest grouping, defined as the EIG EUMETNET (https://www.eumetnet.eu/, last access: 5 November 2021), with the aim of developing this proposal. It is well recognised that hydrometeorological events constitute a large majority of all disasters that occur worldwide (WMO, 2020). In this area, a lot has been achieved under the EUMETNET umbrella, for example the establishment of the METEOALARM programme (https://meteoalarm.org, last access: 5 November 2021). Additional work, however, is needed with regard to a hazard category that we refer to as “airborne hazards” (environmental emergency scenarios), including volcanic eruptions, nuclear accidents, forest fires and desert dust events. Therefore, the logical next step is the expansion of EUMETNET activities into the emergency response coordination area. In terms of observations, EUMETNET has expanded its E-PROFILE programme with a dense network of automatic lidars and ceilometers providing qualitative aerosol information (ash, dust, smoke and pollution) in real time (https://www.eumetnet.eu/activities/observations-programme/current-activities/e-profile/, last access: 5 November 2021). In 2020, EUMETNET approved a business case for the further development of the E-PROFILE lidar network, which foresees the implementation of a processing chain for quantitative aerosol mass estimates by 2023. This service will increase EUMETNET's capabilities with regards to airborne hazards.
Aviation is one of the most critical pieces of infrastructure of the 21st century. Even comparably short interruptions can cause economic damage summing up to the range of billions of euros (IATA, 2010). As evident from the past, aviation shows certain vulnerability with regard to natural hazards. Safe flight operations, air traffic management and air traffic control is a shared responsibility of EUROCONTROL, national authorities, airlines and pilots. All stakeholders have one common goal, namely to warrant and maintain the safety of flight crews and passengers. Currently, however, there is a significant gap in the Europe-wide availability of real-time hazard measurement and monitoring information for airborne hazards describing “what, where and how much” in three dimensions, combined with a near-real-time (NRT) European data analysis and assimilation system. In practice, this gap creates circumstances where various stakeholders in the system may base their decisions on different data and information.
1.2 Overview of the EUNADICS-AV project
This work has been conducted within the framework of the EUNADICS-AV (European Natural Airborne Disaster Information and Coordination System for Aviation) project, which received funding from the European Union's Horizon 2020 (H2020) research programme (https://ec.europa.eu/programmes/horizon2020, last access: 5 November 2021). This European H2020 project was launched in October 2016. The project received funding for 3 years and was completed in September 2019 (https://knmiprojects.archiefweb.eu/?subsite=eunadics#archive, last access: 5 November 2021).
The main objective of EUNADICS-AV is to close this gap in data and information availability, enabling all stakeholders in the aviation system to obtain fast, coherent and consistent information. This would facilitate the work of all stakeholders in the system, on one hand the European Aviation Crisis Coordination Cell (EACCC) and the functions of air traffic management (ATM) and air traffic control (ATC) and on the other hand airline flight dispatching and individual flight planning. The idea of this prototype mechanism is to take into account and create input for existing national and international systems, including the Volcanic Ash Advisory Centres (VAACs), which deliver products for aviation in the case of a volcanic eruption, and Regional Specialised Meteorological Centres (RSMCs) designated by the World Meteorological Organization (WMO) with activity specialisation atmospheric transport modelling in charge of providing products in the case of a nuclear accident and emergency. The objective of EUNADICS-AV is driven by the strategic target as formulated in the communication from the European Commission to the institutions (COM 670, 2011), setting up an Aviation Safety Management System for Europe, i.e. by improving the quality of safety information, by sharing the information and the results of analysis, and by reaching agreement on those risks where coordinated action will bring the greatest benefits.
The technical objectives of EUNADICS-AV are the following:
-
to facilitate coherent pan-European risk and exposure assessments for aviation related to airborne hazards and to collect and consolidate requirements from the various stakeholders, with airborne hazards including (i) volcanic-ash/SO2 dispersion, (ii) nuclear emissions, (iii) forest fires and (iv) sand storms;
-
to integrate and harmonise existing observing systems and infrastructures in Europe, in particular aerosols, trace gases and radioactivity;
-
to improve the quality of data and related analysis products available in an emergency situation, most importantly by integrating vertical profile information for data assimilation and analysis;
-
to assure pan-European information accessibility for aviation stakeholders in a crisis situation by providing an interoperable pilot implementation of the EUNADICS-AV data and information system;
-
to validate/test such a system in a realistic framework.
The EUNADICS-AV system includes hazards from natural events, technical accidents and wilful acts, as long as these hazards have at least a mesoscale impact (>10 km).
The objectives of EUNADICS-AV have been achieved according to the following basic principles:
-
It is based on existing infrastructure, assignments and assets in Europe, including the International Civil Aviation Organization (ICAO)–WMO VAAC and WMO RSMC system.
-
Complementarity work has been established with other related EU projects and initiatives, in particular with the Copernicus Atmosphere Monitoring Service (CAMS; https://atmosphere.copernicus.eu, last access: 5 November 2021) and EURDEP (European Radiological Data Exchange Platform; https://remon.jrc.ec.europa.eu, last access: 5 November 2021) and other international services.
-
As the project will report to EUMETNET policy-making organs like the Science and Technology Advisory Committee (STAC) and subsequently the Assembly, a direct horizontal link and coordination mechanism on a technical level across European governments is assured.
-
NMS (national meteorological service) involvement assures a direct and pragmatic link to crisis responders, authorities, airlines, pilots and citizens, which has been exploited during the project.
-
Direct involvement of a service provider for flight scheduling, an air navigation service provider (ANSP) and the military in one EU member state (Austria) allowed for addressing issues of civil–military coordination with regard to airborne hazards.
It should also be mentioned here that it was not an objective of EUNADICS-AV to put in place a new pan-European forecast system for environmental hazards. Forecast systems do exist at the national level and under international frameworks and responsibilities, for example those operated by WMO RSMCs with activity specialisation in atmospheric transport modelling and by the VAACs, as described by Lechner et al. (2017). These centres, as well as NMSs, are users of our system, which assures that all national and international downstream users continue getting their products through established and tested channels.
The EUNADICS-AV consortium consists of 21 participating organisations from 12 different countries. It includes national meteorological services, monitoring data providers, volcanologists on duty, small- and medium-sized enterprises, a university institute, an air navigation service provider and a military organisation.
The activities of EUNADICS-AV are illustrated in the diagram of Fig. 1, with the following methodologies (blocs in brackets):
-
stakeholders requirements, hazard risk assessments and international cooperation (review of requirements);
-
measurements from ground-based networks, satellite data products and observations from observatories (data products);
-
data harvesting and dissemination (data portal);
-
warning mechanisms and alert product development (early warning system);
-
data dissemination (EUNADICS-AV portal);
-
multi-model integration, source terms and ensemble modelling (assimilation, forecasts and inverse modelling);
-
aviation product development, system testing and exercises (demonstration exercise).
The EUNADICS-AV project took place under the supervision of advisory and user boards, which included a representative from EUMETNET, CAMS, EUROCONTROL, ESA, WMO, EASA (European Union Aviation Safety Agency) and the European Cockpit Association.
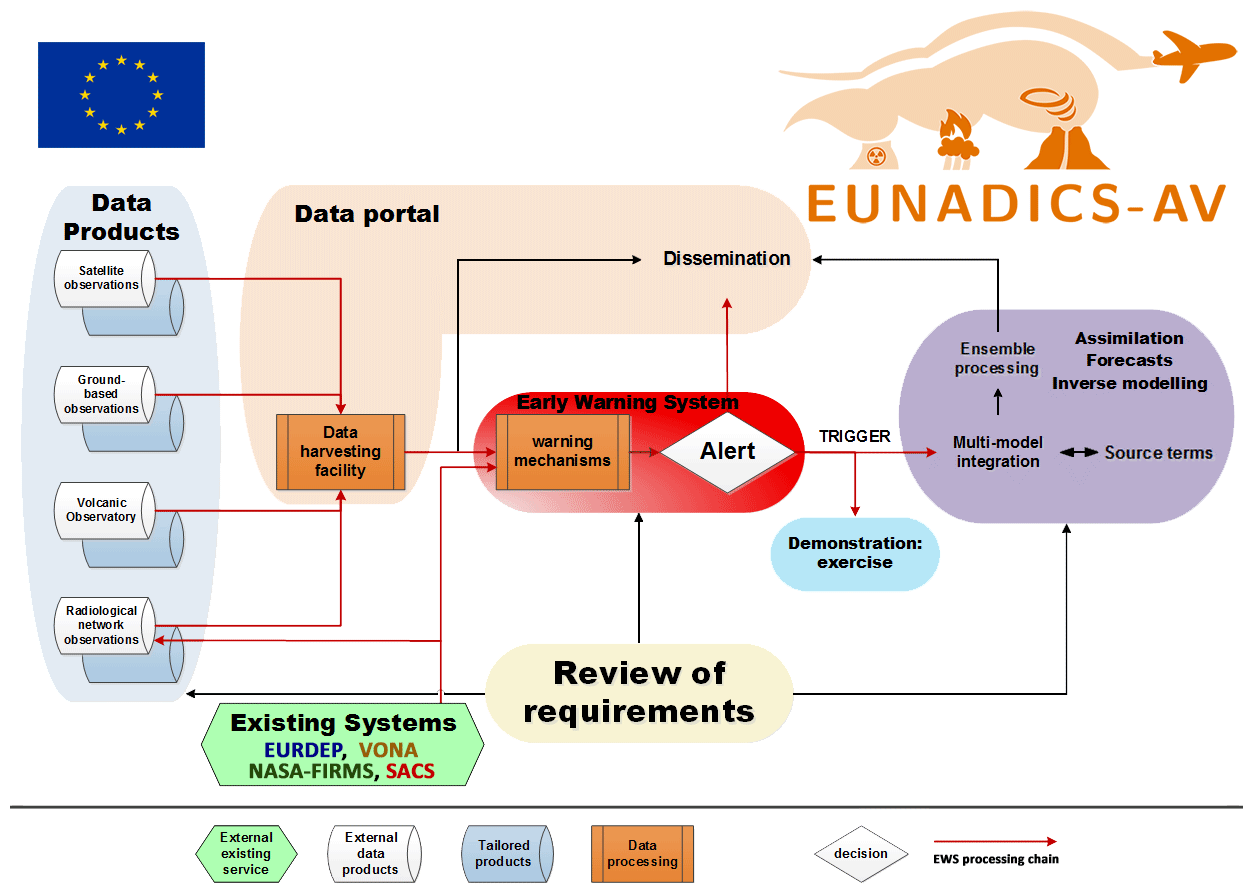
Figure 1Overview of EUNADICS-AV activities with separation into blocs. NASA FIRMS: Fire Information for Resource Management System. SACS: Support to Aviation Control Service. VONA: Volcano Observatory Notice for Aviation.
1.3 Role of this work in EUNADICS-AV
This study focusses on the EUNADICS-AV early warning system (EWS). This bloc/activity has a central role in the EUNADICS-AV system, as it acts as a trigger for the data integration of tailored observations in dispersion model forecasts, which can provide critical information in the resilience process for ATM decision-makers facing a crisis due to an airborne hazard. As shown by the processing chain in Fig. 1, the EWS depends on inputs of observations, carried out by the data harvesting facility that acts as a primordial phase of the hosting platform of the EUNADICS-AV EWS. After a presentation of the requirements (i.e. user requirements, observational-data inventories, and review of the input for the data integration and of the external reports), this study presents the concept and mechanism of the EUNADICS-AV EWS, with details about data products from satellite, ground-based and in situ platforms used to produce alerts. The pre-alerting mechanism and data provision is then described (with a service description, performance verification and cases studies). Finally, the conclusion and future developments are presented.
After an overview of requirement reports (from users, data inventories, data integration and other sources), which cover the activity blocs addressed by EUNADICS-AV, a summary of the requirements tackled by our EWS is presented.
2.1 Review of user requirements
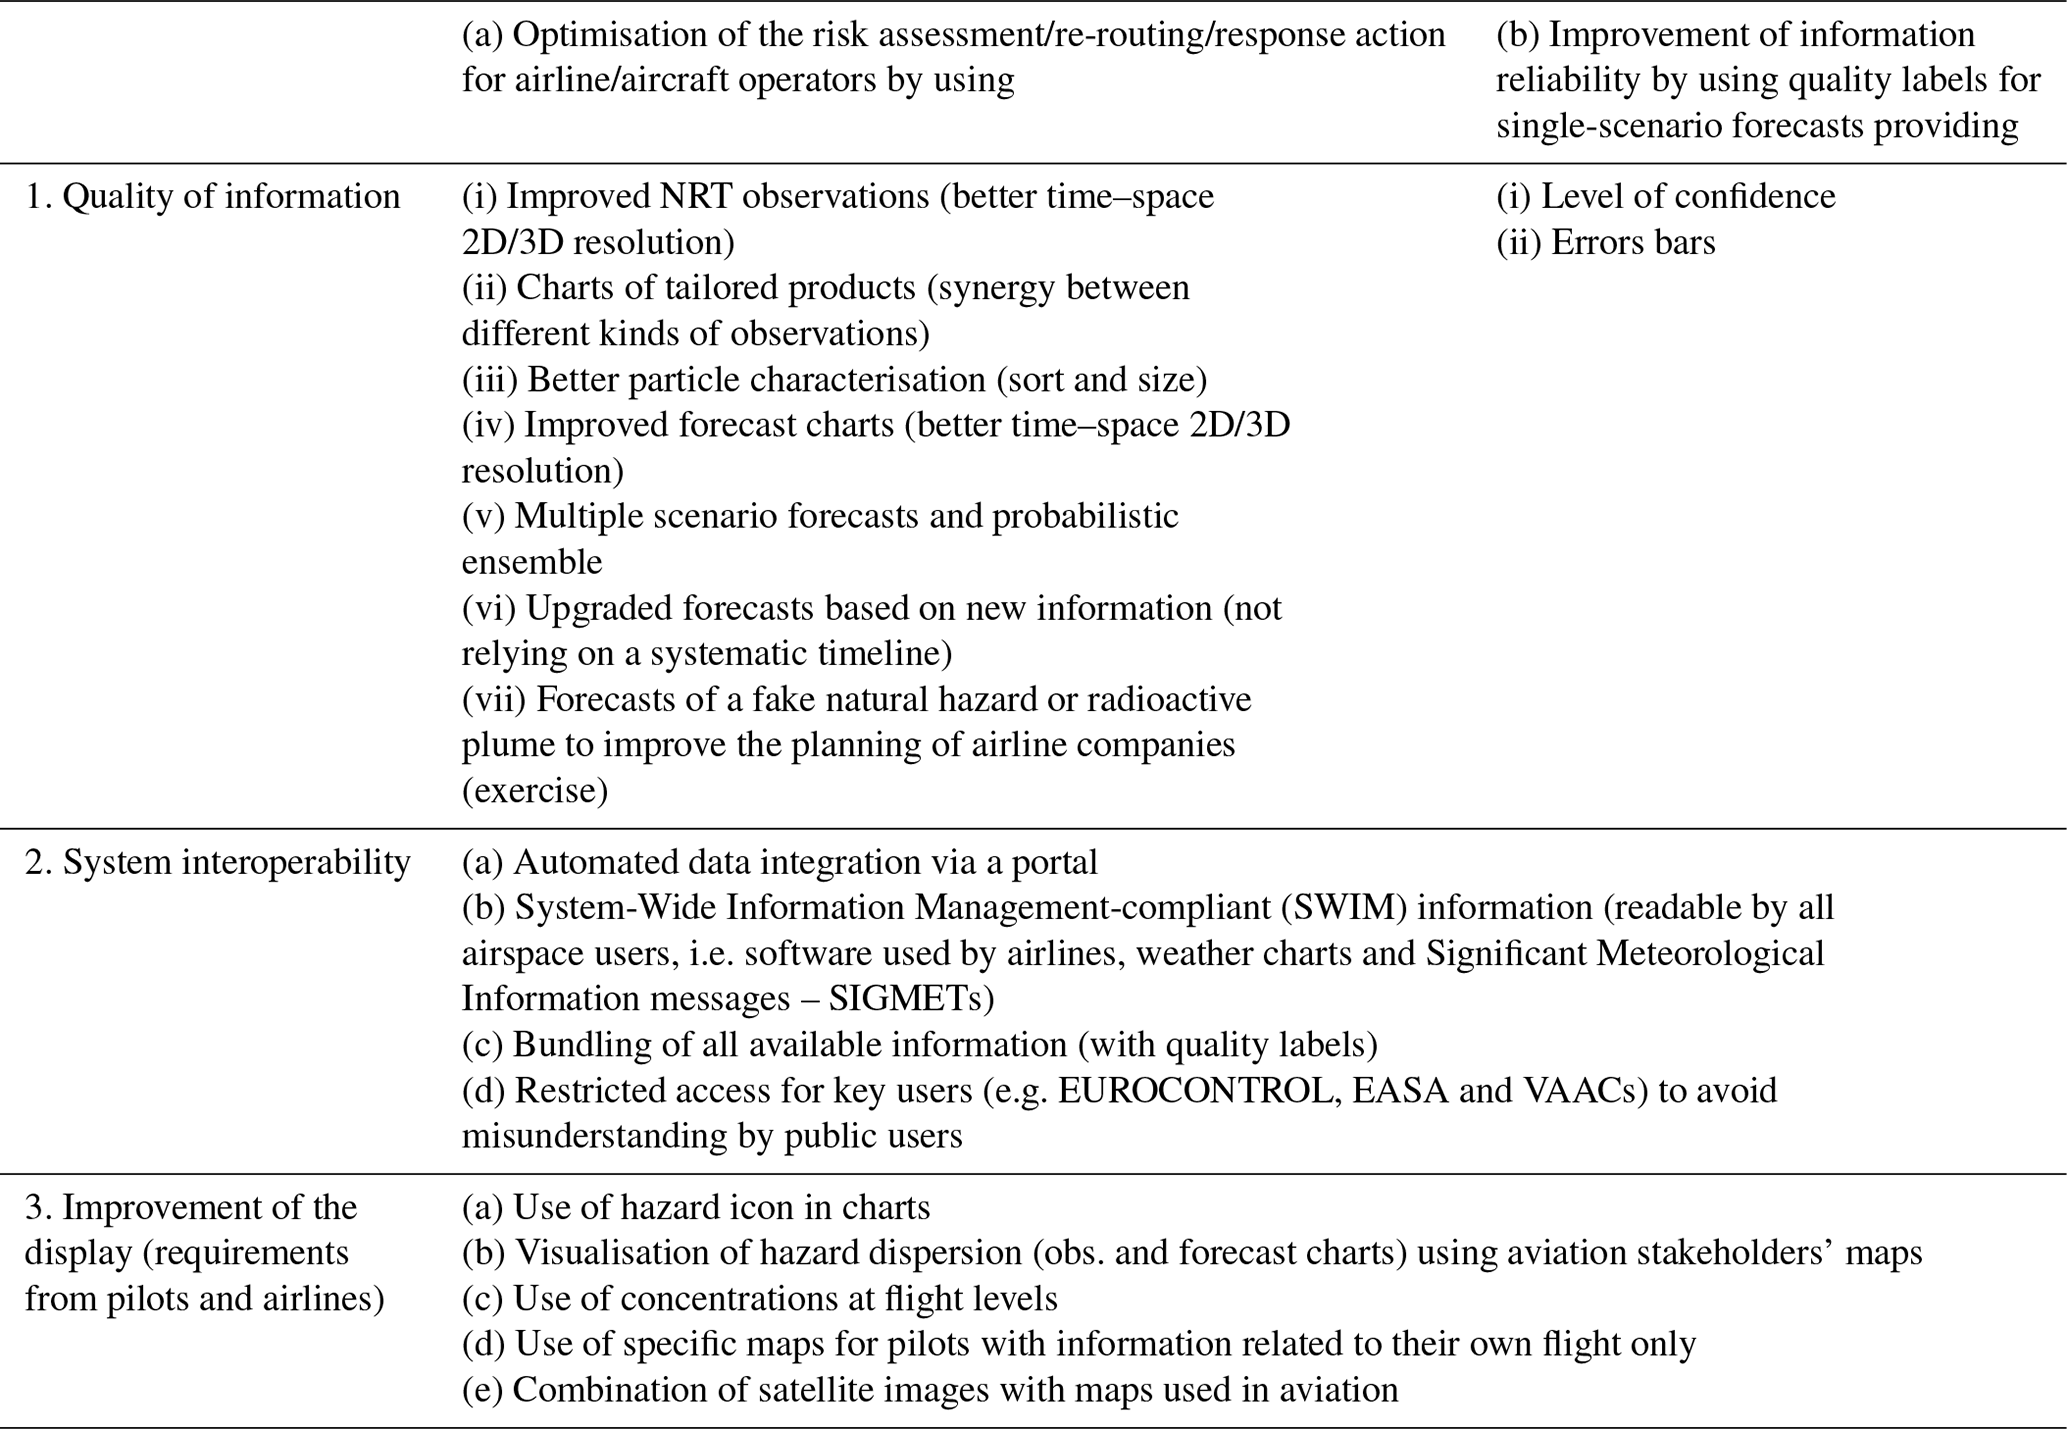
A substantial report of user requirements has been established by EUNADICS-AV partners. The main parties consulted were the VAACs, EUROCONTROL, ICAO, WMO, EASA, the airline companies, governmental institutions, and, primarily, the pilots and passengers. Table 1 presents a highlight of the three types of requirements identified from this report, i.e. quality of information, system interoperability and the improvement of display.
2.2 Review of observational-data inventories
Reviews of data inventories of satellite, ground-based and in situ products have been used to determine the most relevant products to be implemented in our EWS, according to user requirements presented in the previous section. We identified two types of products, i.e. existing NRT (or proven NRT) products and tailored products in development. Key products, allowing for NRT visualisation of natural airborne hazards and the implementation of them in the EUNADICS-AV EWS, have been investigated, showing added value to the current existing public system (in the late 2010s). Note that the observation of a nuclide cloud is more sensitive and inaccessible to classic users, as no data are public. After our review and the discussion with partners, a selection of observations has been determined with respect to the monitoring of European airspace facing a crisis related to airborne hazards. Tables 2 and 3 show, respectively, the inventory of the selected products from satellite, in situ and ground-based instrumentation to be considered by the EUNADICS-AV EWS.
Table 2Inventory of NRT satellite products. AIRES: Airborne Infrared Echelle Spectrometer. AIRS: Atmospheric Infrared Sounder. AOD: aerosol optical depth. BIRA (IASB): Royal Belgian Institute for Space Aeronomy. CNES: National Centre for Space Studies. DLR: German Aerospace Center. EUMETSAT: European Organisation for the Exploitation of Meteorological Satellites. GOME-2: Global Ozone Monitoring Experiment-2. IASI: Infrared Atmospheric Sounding Interferometer. KNMI: Royal Netherlands Meteorological Institute. MetOp: Meteorological Operational satellite. MSG/SEVIRI: Meteosat Second Generation Spinning Enhanced Visible and InfraRed Imager. OMI: Ozone Monitoring Instrument. SLSTR: Sea and Land Surface Temperature Radiometer. Suomi-NPP/OMPS: NASA/NOAA Suomi National Polar-orbiting Partnership Ozone Mapping and Profiler Suite. TROPOMI: TROPOspheric Monitoring Instrument. ULB: Université Libre de Bruxelles. VCD: vertical column density.
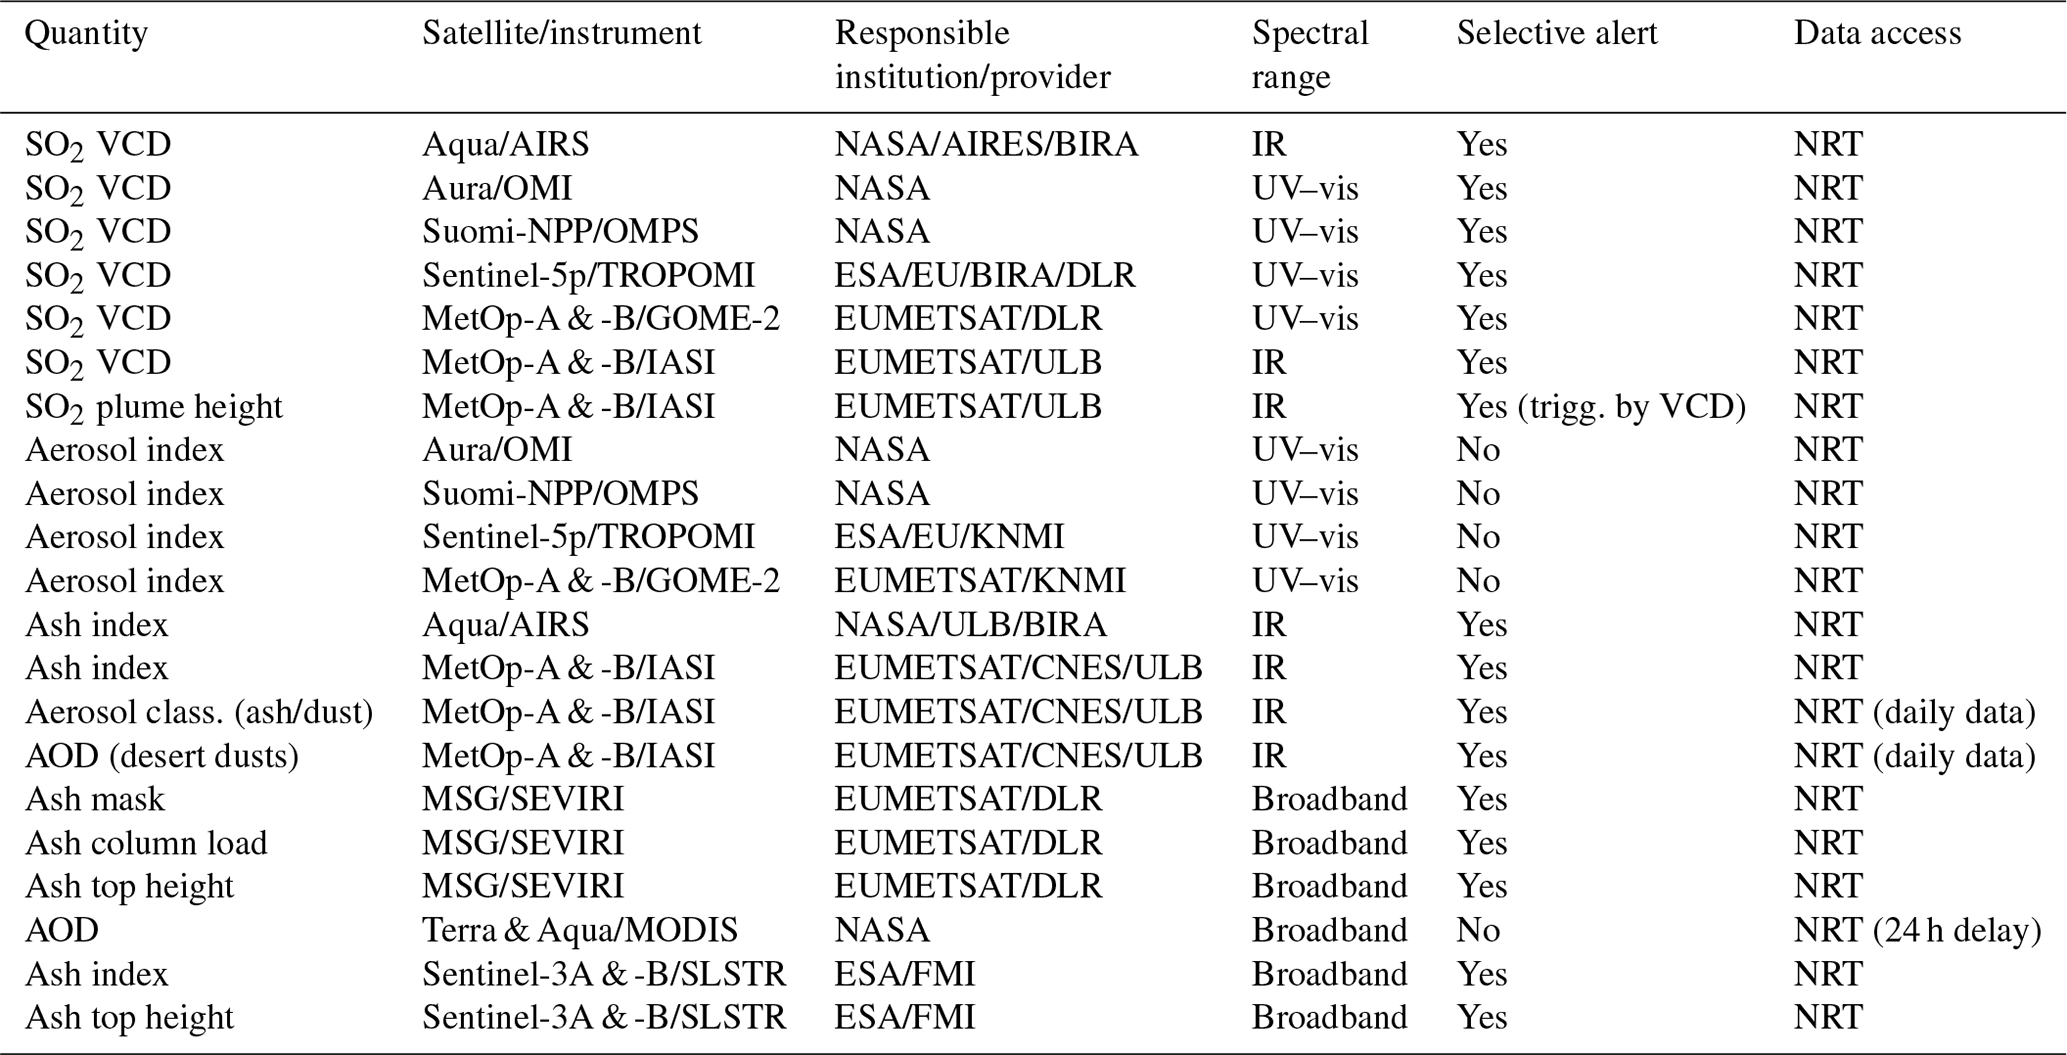
Table 3Inventory of NRT ground-based and in situ products. ACTRIS: Aerosol, Clouds and Trace Gases Research Infrastructure. EARLINET: European Aerosol Research Lidar Network. IMO: Icelandic Meteorological Office. INGV-OE: Italian National Institute of Geophysics and Volcanology Etna Observatory. SIL: South Iceland Lowland.

For the implementation in the EUNADICS-AV EWS, we consider that each selected product can be characterised by four categories of information: the basic information (quantity, instrument/platform, responsible institute/provider and units), the time–space resolution (temporal resolution and spatial/vertical resolution), the data availability information (spatial coverage for satellite and in situ instruments, temporal coverage for in situ instruments, overpass time at the Equator for satellite instruments, time delay for delivery, measurement schedule for ground-based instruments, processing level for satellites, data format, data volume, access, link to product overview and dissemination/link to data), and the implementation information for data integration and decision making (alert/notification and visualisation system). Tables 2 and 3 present a subset of all the characterisations established for these products.
2.3 Requirements for data integration and harmonisation
Information gathered during the EUNADICS-AV stakeholders' workshop (Cologne, October 2017) and discussions with the VAACs at the AeroMetSci (WMO Aeronautical Meteorology Scientific) conference (Toulouse, November 2017) have brought a precise definition of the automated products needed from models that can be relevant for flight planning and management. A review of the inputs on data integration and harmonisation required by atmospheric transport and dispersion model has been established to determine the most relevant product information/format/parameters to be implemented in our EWS. The list of information/format/parameters is the following: satellite and ground-based aerosol optical depth (AOD; from different platforms), satellite and ground-based lidar attenuated backscatter, ground-based measurements of particulate matter, volcanic-ash plume height (from radars and camera and volcano observatories), volcanic-ash total column mass density and plume-height from satellites, aircraft measurements of particulate matter, lidar aerosol layer altitude, ground-based measurements of SO2, satellite SO2 column with averaging kernel and error estimates, aircraft measurements of SO2, satellite SO2 plume height, SO2 profiles by ground-based spectrometers (observatories), nuclide concentrations from air sampler networks, and external dose rates from radiation monitoring networks. This list has been used to obtain the inventories of observations in Tables 2 and 3.
2.4 Review of external reports
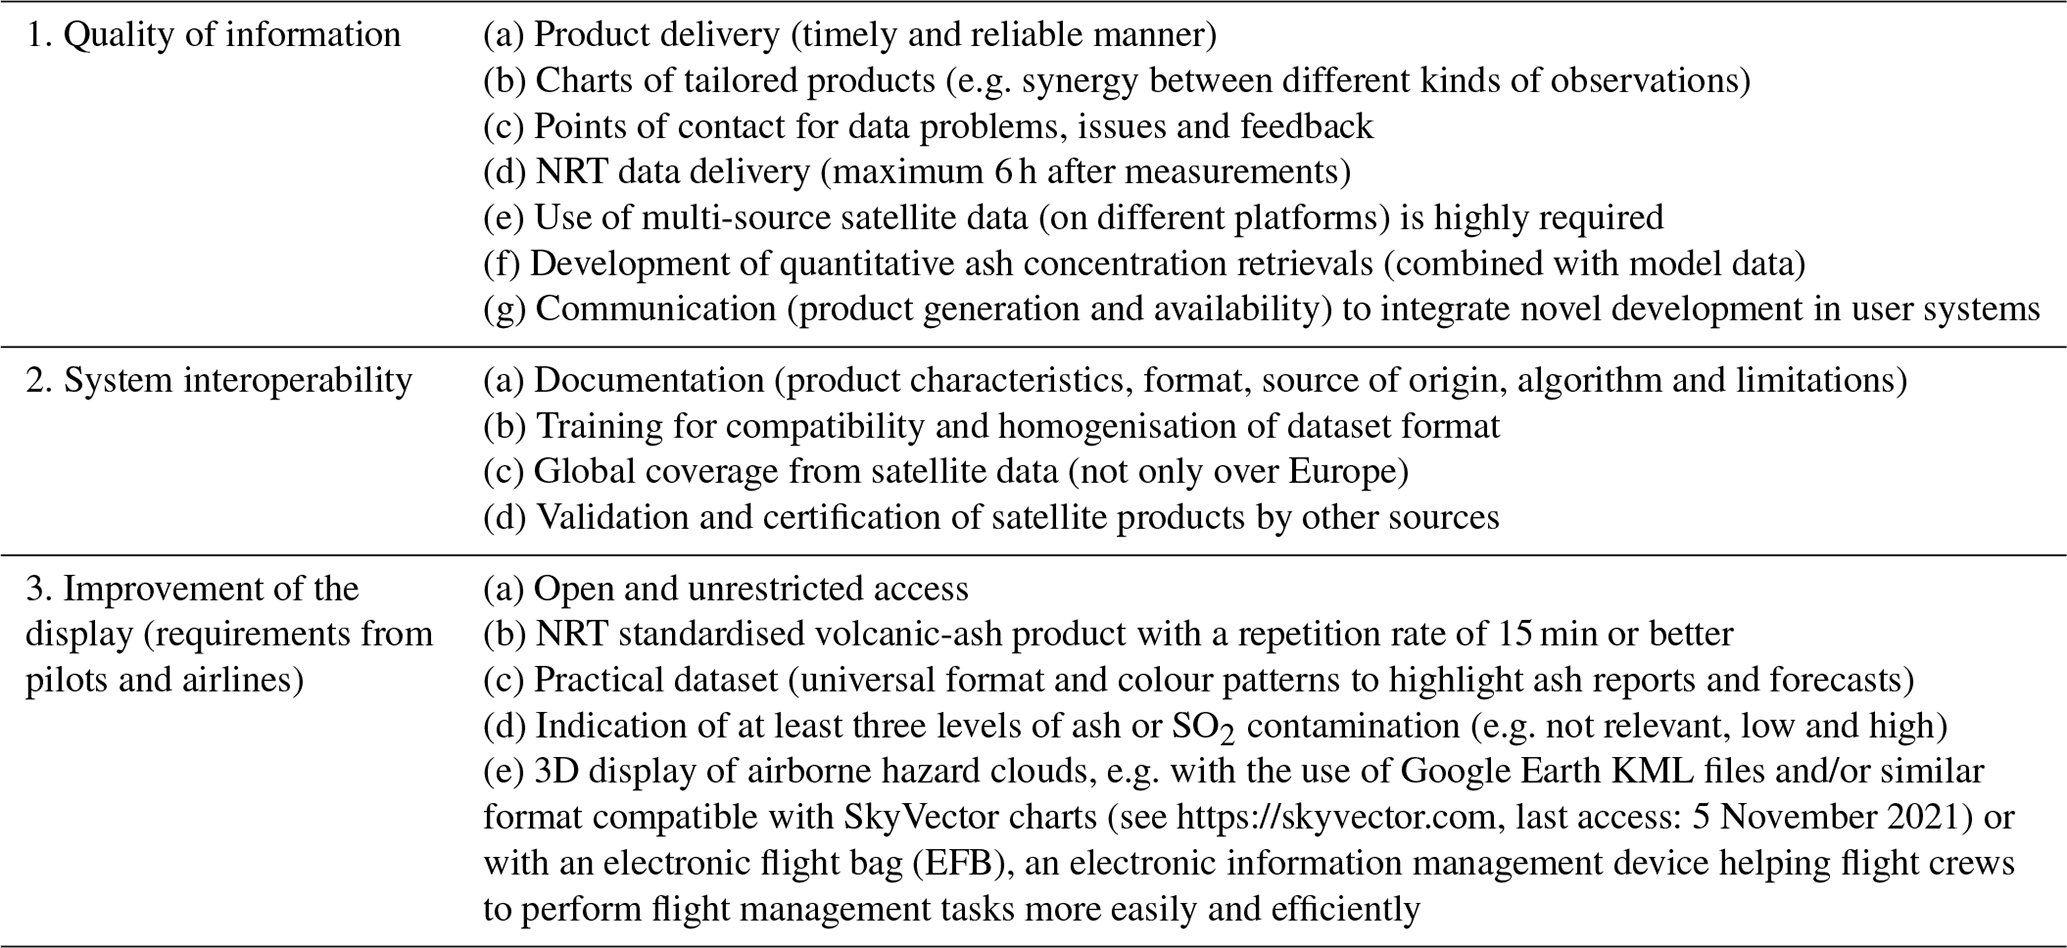
We reviewed external reports (Zehner, 2010; ESA, 2013; WMO, 2017; Inter Pilot Magazine, 2018) to determine the key development of the EWS and the most relevant products that would fulfil the requirement of the users. The same three types of requirements as in Sect. 4.2 have been identified and are presented in Table 4. Requirements for the data integration (Sect. 2.3) have been considered to define a list of data product candidates (Tables 1 and 2) from inventories of satellite, in situ and ground-based observations (Sect. 2.2).
Table 4Overview of user requirements from external sources. KML: Keyhole Markup Language.
Considering user requirements from Sect. 2.1 and 2.4, the requirements tackled by the EUNADICS-AV EWS concern the following:
-
the improvement of the quality of information by optimising risk assessment (using reliable and fast NRT observations, providing a level of confidence and errors bars if available, and implementing tailored products), by the use of quality labels to increase the reliability of information, by providing a point of contact and communicating about the data product version and availability with respect to data integration (points 1ai., 1aii and 1b in Table 1 and all points of 1 in Table 4);
-
a contribution to the system interoperability by bundling the maximum amount of available information about selective detection of airborne hazards, by implementing compatible and homogenised information with global coverage, and by providing restricted access for key users to avoid misunderstanding by public users (points 2c and 2d in Table 1 and all points of 1 in Table 4);
-
the improvement of the display of information by the visualising observations of hazard dispersion (point 3b in Table 1 and points 3b and 3e in Table 4).
Note that documentation (with product characteristics, format, source of origin, algorithm, validation and limitation of the selected data products by our EUNADICS-AV EWS) has been provided by partners and the EUNADICS-AV consortium (requirements 2a and 2e of Table 4).
3.1 Example of systems related to volcanic emission
A primordial source of information about volcanic activity is in the hand of the volcano observatories, such as the Icelandic Volcano Observatory which operates within the Icelandic Meteorological Office (IMO; https://en.vedur.is, last access: 5 November 2021) and the Etna Observatory in Catania operated by the Italian National Institute of Geophysics and Volcanology (INGV-OE; https://www.ct.ingv.it, last access: 5 November 2021). The IMO and INGV-OE are both partners of EUNADICS-AV. These observatories are equipped with ground-based instruments for providing as much information as quickly and precisely as possible concerning active volcanoes. Volcanic activity is monitored by observatories using a combination of fixed instruments (e.g. seismometers, infrasound arrays, continuous GNSS – global navigation satellite system – stations, strainmeters, gas detectors, river monitors and radars) in addition to mobile instruments (e.g. mobile radars and lidars). Such instrumentation can stream live data from the field to the office, bringing critical information to the control cells. During episodes of volcanic unrest or eruption, observatories provide information to civil-protection authorities and local populations and notifications to the VAACs. This procedure was established by ICAO for providing crucial information during volcanic eruptions to the aviation sector, and both IMO and INGV-OE are using it. Volcano observatories provide a notification of eruptive activity using Volcano Observatory Notice for Aviation (VONA) messages that are issued according to ICAO Doc 9766-AN/968, “Handbook on the International Airways Volcano Watch (IAVW)” (ICAO, 2012, 2014, 2019; Lechner et al., 2017). The VONA messages are aimed at dispatchers, pilots and air traffic controllers to inform them about volcanic unrest and eruptive activity that could produce ash cloud hazards. As an example, for the Etna volcano, the VONA messages are sent by the Control Room of INGV-OE, which operates on a basis, and they can be downloaded, together with other bulletins, reports, tremor graphs, images from video surveillance network, volcanic-ash dispersal, etc. For the monitoring of Icelandic volcanoes, a network of UV spectrometers is used. This means that, for an event for which an increase in SO2 is deemed to be related to magma movement, an alert is issued by the VONA. The same is applied to the seismicity; i.e. if there is a significant increase in seismicity (intense seismic swarms) or seismic tremors, this is outlined in the VONA and relayed through the EWS. Regarding regional monitoring, there is the Kamchatka Branch of the Geophysical Survey (of the Russian Academy of Sciences) and the Kamchatka Volcano Eruption Response team (KVERT). A web interface allows for showing the activity in this region (https://glob.emsd.ru/, last access: 5 November 2021). Information about the plume height are retrieved in NRT using cameras and satellites (estimations are added in the VONA messages by volcanologist on duty during our surveillance activity using a system implemented in Scollo et al., 2019), and email notification are sent to the VAACs and researchers.
Concerning specific support to aviation with a global coverage of possible volcanic emission, as far as we know, we can mention three existing EWSs. The NOAA CIMSS (US National Oceanic and Atmospheric Administration Cooperative Institute for Meteorological Satellite Studies) Volcanic Cloud Analysis Toolkit (VOLCAT) web site features NRT processing of many geostationary and low-earth orbit satellites covering much of the globe (https://volcano.ssec.wisc.edu, last access: 5 November 2021). VOLCAT includes a collection of sensor-agnostic algorithms for detecting, tracking and characterising volcanic ash and SO2 (e.g. Pavolonis et al., 2015a, b, 2018, 2020; Hyman and Pavolonis, 2020), and the products are utilised by many of the VAACs. The VOLCAT products are scheduled to achieve full operational status at NOAA in 2023. The alerting service consists of four categories of alerts: sudden changes in thermal output (hotspots), newly detected ash emissions, newly detected rapidly developing clouds near known volcanic vents and newly detected SO2 emissions. Users can subscribe and configure alert subscriptions using a web interface (https://volcano.ssec.wisc.edu/alert, last access: 5 November 2021). Alerts are shown on an event dashboard. Access to the alerts and event dashboard is currently restricted to VAACs, meteorological watch offices (MWOs), volcano observatories and research collaborators, as these are considered pre-decisional products. On the other hand, the SACS EWS is a highly successful system used by agencies worldwide (Brenot et al., 2014). This system, hosted by one of the EUNADICS-AV partners (BIRA; http://sacs.aeronomie.be, last access: 5 November 2021), was initiated by the European Space Agency with the goal of supporting the VAACs, i.e. Toulouse and London VAACs. NRT data of SO2 and volcanic ash are derived from hyperspectral sensors on board polar-orbiting satellites, in the UV–vis range with OMI, GOME-2B, GOME-2C, OMPS and TROPOMI (TROPOspheric Monitoring Instrument) and in the infrared (IR) range with AIRS, IASI-A and IASI-B. The SACS multi-sensor system automatically addresses the worldwide detection of volcanic plumes of SO2 and ash notifications, sending an alert by email to interested parties (https://sacs.aeronomie.be/alert, last access: 5 November 2021). Finally, continuous analysis and systematic surveillance are in operation at the Université Libre de Bruxelles (ULB) in order to detect a possible anomalous threshold of SO2 caused by a volcanic eruption. This automatic system, based on IASI data (on board MetOp-A, MetOp-B and MetOp-C), sends email alerts to the VAACs and key users when high SO2 levels are detected (http://cpm-ws4.ulb.ac.be/Alerts, last access: 5 November 2021). Information about SO2 column density and layer height is provided. This IASI detection system automatically provides inputs of SO2 (and ash) products to the SACS system, aiming at providing NRT SO2 and ash measurements related to volcanic emissions.
3.2 Example of systems related to dust and sandstorms
The monitoring of extreme dust events is critical for aviation. Within the existing system, we can mention the WMO Sand and Dust Storm Project, initiated in 2004, and its Sand and Dust Storm Warning Advisory and Assessment System (SDS-WAS), launched by the Fifteenth World Meteorological Congress in 2007. SDS-WAS enhances the ability of countries to deliver timely, quality sand and dust storm forecasts, observations, information and knowledge to users through an international partnership of research and operational communities. This service is divided into three regional centres. The WMO SDS-WAS regional centre for northern Africa, the Middle East and Europe (https://sds-was.aemet.es, last access: 5 November 2021) is coordinated by a regional centre in Barcelona, Spain, and hosted by the State Meteorological Agency (AEMET) and the Barcelona Supercomputing Center (BSC). The WMO SDS-WAS regional centre for Asia (http://www.asdf-bj.net, last access: 5 November 2021) is coordinated by a regional centre in Beijing, China, and hosted by the China Meteorological Administration (CMA). The WMO SDS-WAS regional centre for the Americas (http://sds-was.cimh.edu.bb, last access: 5 November 2021), established in the USA with a possible regional centre hosted by the Caribbean Institute for Meteorology and Hydrology (CIMH) in Barbados, focusses on the health implications of airborne dust. The prime objective of the three SDS-WAS regional centres is to lead the development and implementation in the region of a comprehensive system for mineral dust observation and forecast, with special emphasis on extreme sand and dust events. These observational systems focus on continuous dust monitoring, validation, and verification of forecast products and data assimilation into numerical models. SDS-WAS models use ground observations (particulate matter measurements progressively becoming available in NRT, indirect information from regular weather reports and remote-sensing retrievals from sun photometers or vertical profilers) and satellite products (single-band images and qualitative multi-band products designed to improve dust identification or quantitative retrievals). Currently, the WMO SDS-WAS regional centre for northern Africa, the Middle East and Europe provides a multi-model platform with analysis and +54 h forecasts for 12 dispersion models (Nickovic et al., 2001; Woodward, 2001; Zakey et al., 2006; Benedetti et al., 2009; Morcrette et al., 2009; Colarco et al., 2010; Pérez et al., 2011; Haustein et al., 2012; Basart et al., 2012, 2020; Lu et al., 2016; Yang et al., 2007). SDS-WAS contributes to the International Cooperative for Aerosol Prediction (ICAP), an unfunded international forum for aerosol forecast centres, remote-sensing data providers and lead system developers, which coordinates the first global multi-model ensemble for aerosol forecasts, as described in Sessions et al. (2015). The use of the multi-model system is overall better than any individual model. Over specific regions, combining several models leads to better forecasts than the best individual model even when number of ensemble members is small.
3.3 Example of systems related to smoke from wildfires and biomass burning
NASA provides a global EWS related to fire detection from its Fire Information for Resource Management System (FIRMS). It provides fire radiative power (FRP) from low-earth orbit (LEO) satellites sensors, i.e. MODIS instruments on board the Terra and Aqua satellites (Kaufman et al., 1998; Giglio et al., 2003; Justice et al., 2011) and the VIIRS (Visible Infrared Imaging Radiometer Suite) sensor on board Suomi-NPP (Csiszar et al., 2014). FIRMS focuses and objectives include providing quality resources for fire data on demand, working with end users to enhance critical applications assisting global organisations in fire analysis efforts, delivering effective data presentation and management (https://firms.modaps.eosdis.nasa.gov/alerts, last access: 5 November 2021). On the other hand, CAMS has developed a monitoring system, which provides observations of fire detection and forecasts of smoke dispersion. By using NRT observations of the location and intensity of active wildfires, i.e. an FRP product based on SEVIRI (Roberts et al., 2015) from the EUMETSAT LSA-SAF (Land Surface Analysis Satellite Application Facility; http://landsaf.meteo.pt, last access: 5 November 2021), CAMS estimates the emissions of aerosols and pollutants. This is done through its Global Fire Assimilation System (GFAS). This allows for active fires to be monitored and their estimated emissions to be used in the CAMS forecasts to predict the transport of the resulting smoke in the atmosphere (https://atmosphere.copernicus.eu/fire-monitoring, last access: 5 November 2021). The forecasts are used in air quality apps to help people limit their exposure to pollution and by policymakers and local authorities to manage the impact of fires. The Copernicus Emergency Management Service (EMS) has developed the European Forest Fire Information System (EFFIS; http://effis.jrc.ec.europa.eu, last access: 5 November 2021; see EFFIS, 2018). This system supports the services in charge of the protection of forests against fires in the EU and neighbouring countries and provides the European Commission with services and the European Parliament with updated and reliable information on wildland fires in Europe.
3.4 Example of systems related to radionuclide clouds
This fourth type of system addresses the monitoring of nuclear accidents and radionuclide plumes. The development of such system is quite sensitive, and the dissemination of information is confidential. Most European dose rate results are recorded at the European Radiological Data Exchange Platform (EURDEP) web site (https://eurdep.jrc.ec.europa.eu, last access: 5 November 2021), but accessing the site and downloading data requires agreements. A collaboration with the Joint Research Centre of the European Commission (JRC) is required to establish NRT or archive access to data (including historical data). Individual countries can provide their own data (i.e. providing gamma dose rates, including spectrometric data, and activity concentrations in air). For selected case studies and research, airborne activity concentration measurements of radionuclide-bound aerosols may be provided by selected laboratories. EMERCON (Emergency Convention) messages are also produced by the International Atomic Energy Agency (IAEA) through the WMO RSMCs. An EMERCON message is a descriptor referring to the official system for issuing and receiving notifications, information exchange, and assistance provision through the IAEA's Emergency Response Centre in the event of a nuclear or radiological emergency. The ICAO system allows for the issuance of a SIGMET (Significant Meteorological Information message) for radioactivity, from the ground to unlimited flight level (FL), up to 30 km radius from the release site. Since 2020, the Russian Federal Environmental Emergency Response Centre (FEERC) has had an operational system that provides public concentration charts for use in aviation (http://aviamettelecom.ru/activity/methodical, last access: 5 November 2021). Such charts are issued in the case of a hazardous radioactive release according the “Guidance material on the dissemination of information on accidental release of radioactive material into the atmosphere” (FEERC, 2019). An example of a chart (from a radioactivity advisory) showing airspace aviation FL contaminations based on conditional data (e.g. from a radionuclide cloud at Fukushima Daiichi, on 28 May 2019), can be found in the additional material.
4.1 Detection of airborne hazards using satellites
4.1.1 Selective detection of volcanic SO2
The impact of the SO2 exposure and the sulfur damage to engines has affected hundreds of flights in the last decade. Sulfidation mechanisms can cause damage to the engine through a solid diffusion process or corrosion fatigue. A flight through a volcanic plume and the exposure to SO2 is a problem for passengers and aviation stakeholders, as it is a threat to safety and health, and it requires turbine maintenance. The detection of SO2 from satellites is straightforward (see Fig. 2) and of great interest for aviation. Generally, when SO2 clouds reach the free troposphere up to the upper stratosphere, it is a good indicator of volcanic activity. Eight satellite sensors are considered by the EUNADICS-AV EWS for the SO2 detection that is retrieved by OMI, GOME2-B, OMPS and TROPOMI in the UV–vis (Rix et al., 2009, 2012; Li et al., 2017; Niu et al., 2021; Theys et al., 2017, 2019) and AIRS, IASI-A and IASI-B in the IR range (Prata and Bernardo, 2007; Clarisse et al., 2008, 2012; Clerbaux et al., 2009). Details about the detection and the limitation of these products can be find in Brenot et al. (2014). Note that a very fast delivery of OMI and OMPS data retrievals (time delivery of ∼45 min for the northern region, i.e. near Europe and Alaska) is provided by the Finnish Meteorological Institute (FMI) and the Geographic Information Network of Alaska (GINA), as satellite data are received at Sodankylä, Finland, and Fairbanks, Alaska (see https://sampo.fmi.fi, last access: 5 November 2021).
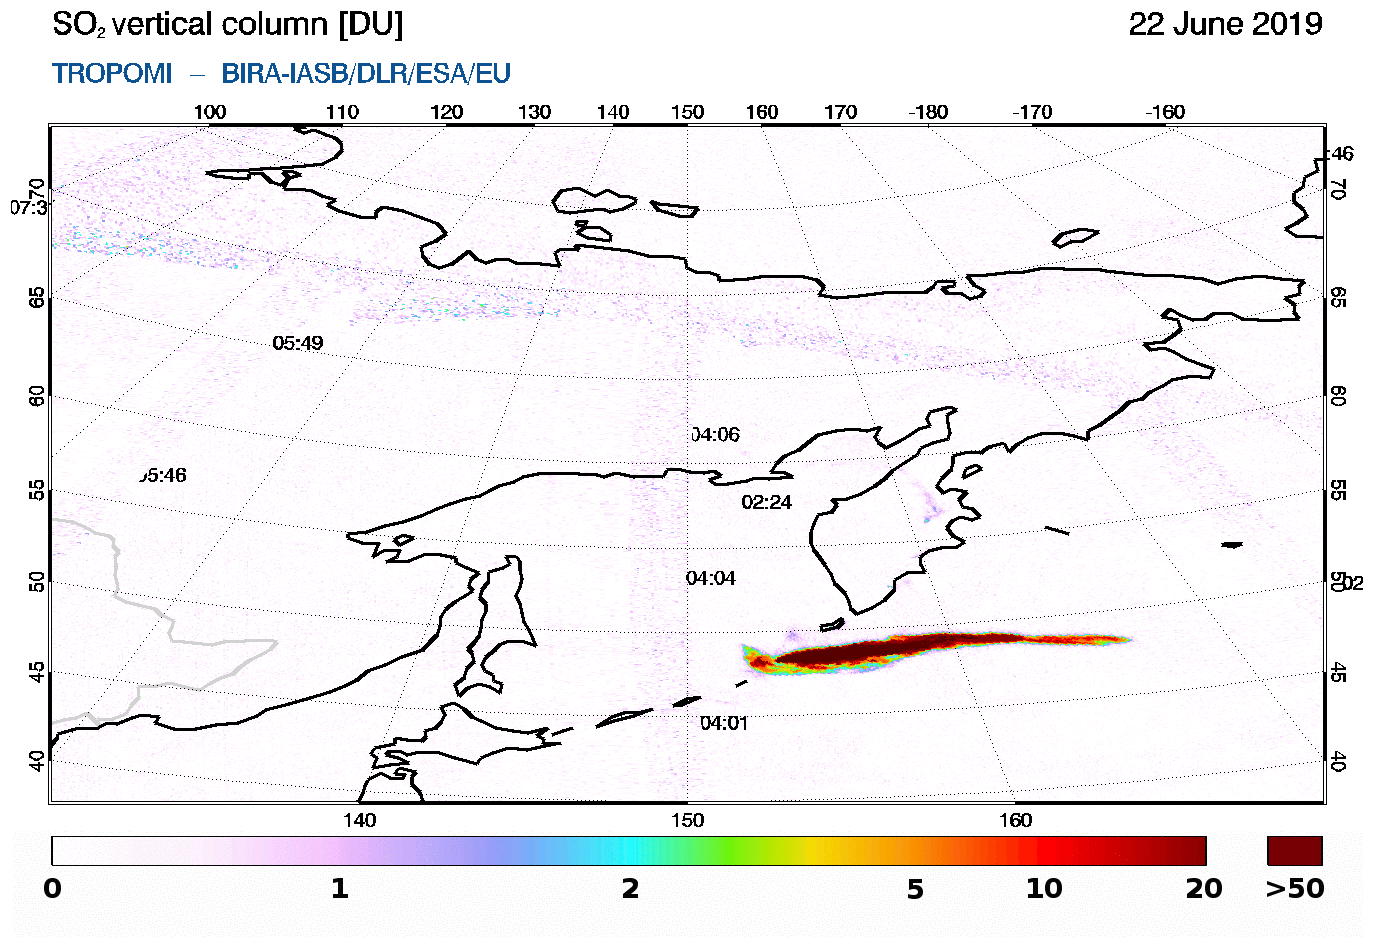
Figure 2SO2 detection from TROPOMI on 22 June 2019 (Raikoke eruption, Kuril Islands).
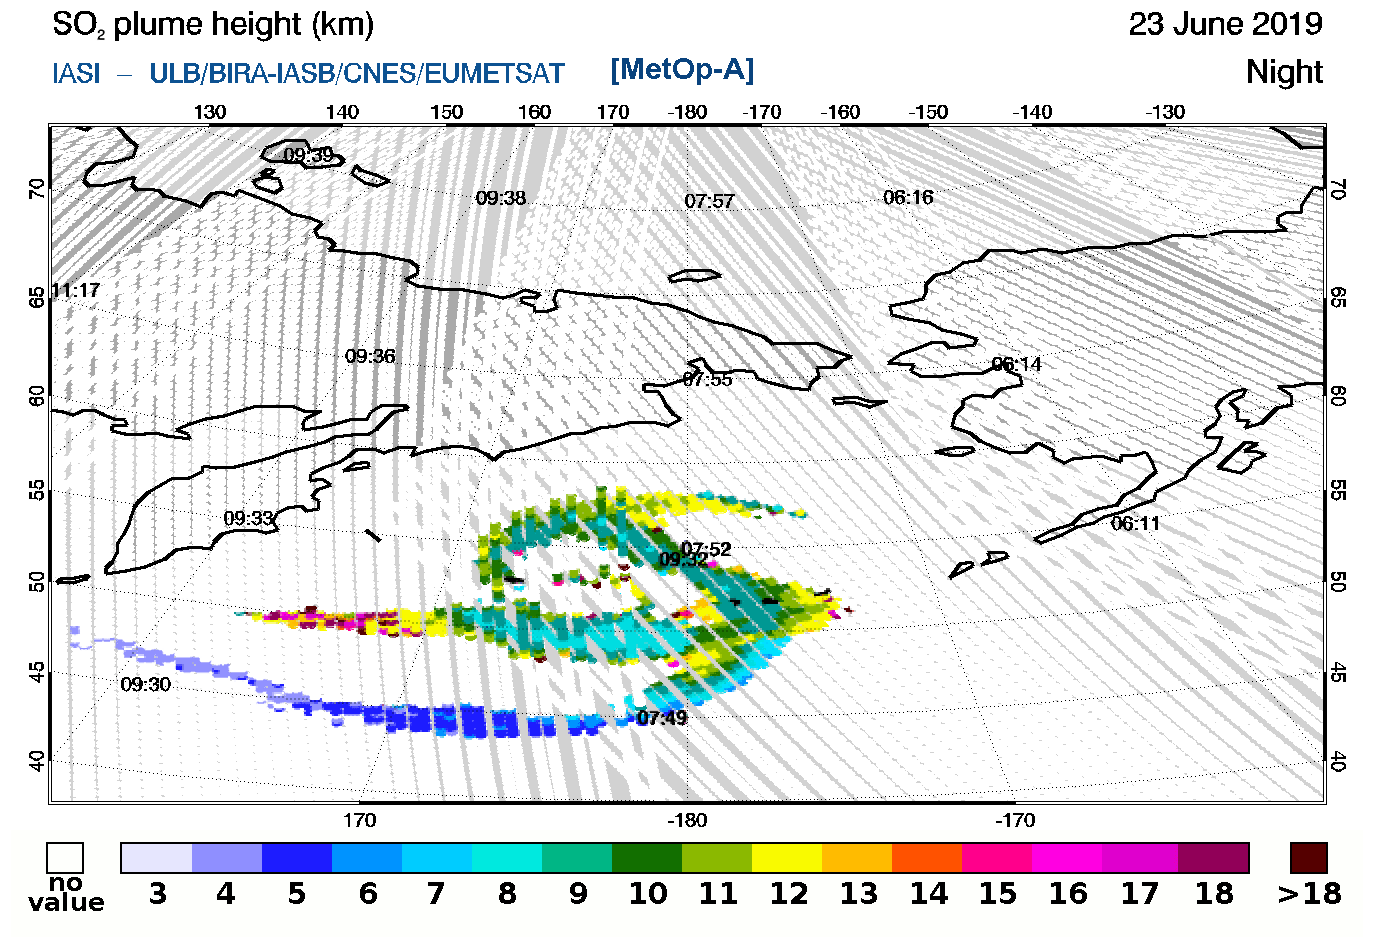
Figure 3Characterisation of Raikoke plume by SO2 layer height from IASI-A on 23 June 2019.
Satellite IR sensors considered by EUNADICS-AV (IASI-A and IASI-B) can measure the SO2 layer height (SO2LH) using optimal estimation algorithms (Clarisse et al., 2014). The SO2LH retrieval is very fast, with an accuracy of 1–2 km, which can be obtained even for a low SO2 column (under 1 DU; 1 Dobson unit = 2.6867×10²⁰ molec. m−2). SO2LH results are obtained for estimates between 3 and 21 km, with low performance for heavily saturated plumes. Figure 3 shows SO2LH from IASI-A on 23 June after the Raikoke eruption.
4.1.2 Selective detection of ash
The volcanic-ash detection from satellites is far from trivial but is essential for aviation, as it can cause severe damage to turbine engines (Clarkson et al., 2016). Differential absorption by ash between two channels, e.g. by using the brightness temperature (BT) difference (BTD) between the 11 and 12 µm channels for the SLSTR instrument, can be used to detect volcanic plume, as illustrated in Fig. 4. BTD results from SLSTR are expressed in degrees Kelvin (K). A negative value of −2 K issues an alert for a data granule (three granules with data for a time duration of about 3 min are shown in blue in Fig. 4).
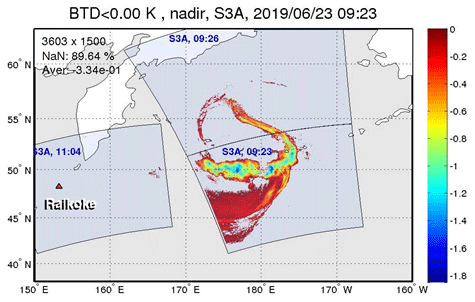
Figure 4Ash index (brightness temperature difference, in K) from the SLSTR sensor on board Sentinel-3A on 23 June 2019. Please note that the date format in this figure is yyyy/mm/dd.
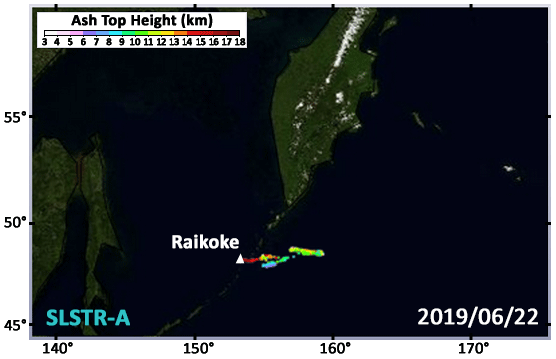
Figure 5Characterisation of Raikoke plume by ash top height (in km) from SLSTR-A on 22 June 2019 (acknowledgement to NASA's Global Imagery Browse Services – GIBS – for providing imagery used as a background). Please note that the date format in this figure is yyyy/mm/dd.
The BTD technique can yield a false detection in the presence of absorbing aerosols other than ash (e.g. desert dust). However, using SLSTR sensors (on board Sentinel-3A and Sentinel-3B), combining automated aerosol detection, the algorithm of Virtanen et al. (2014) can provide an ash/dust height estimate (Fig. 5). This algorithm is based on matching top-of-the-atmosphere reflectances and brightness temperatures of the nadir and 55 forward views and using the resulting parallax to obtain the height estimate (stereoscopic technique).
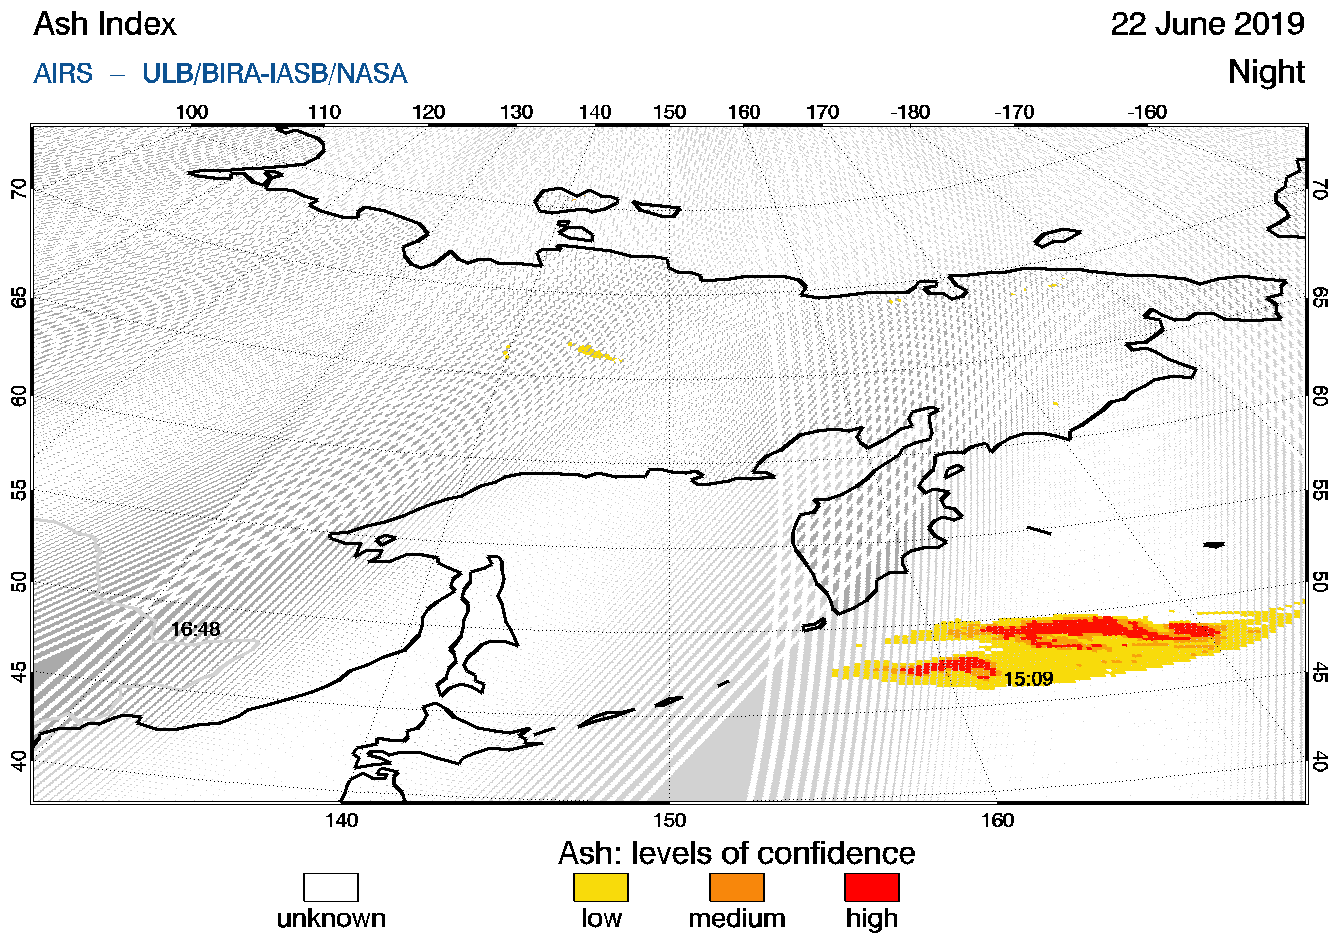
Figure 6Ash detection from AIRS on 22 June 2019 (Raikoke eruption, Kuril Islands).
The absorption signatures of ash can be discriminated from other types of absorbing aerosols using hyperspectral thermal infrared sensors (Clarisse et al., 2010). The IASI-A and IASI-B and AIRS ash index products used in the EUNADICS-AV EWS are based on a three-step process (Clarisse et al., 2013), which provides ash detection with levels of confidence. Four colour codes are used to define the level of confidence of pixel ash detection. High-level detection appears in red (ash is almost certainly present with less than 1 % of false alerts; this issues an alert), and medium-level detection is in orange (ash detection with high confidence nevertheless; no alert is issued). Low-level detection is in yellow (mineral aerosol signature observed in spectra and proximity to a high-confidence detection), meaning the volcanic-ash detection is highly probable, but false detections can still occasionally occur. The unknown detection appears in white (no ash detected by the algorithm). Figure 6 illustrates a selective detection of ash from AIRS a few hours after the start of the Raikoke eruption.
For the dedicated EU area, fast ash detection from a geostationary satellite is considered by the EUNADICS-AV EWS, i.e. the ash mask, column load (in kg m−2) and top height (in km) products from SEVIRI (on board MSG). The VADUGS (Volcanic Ash Detection Utilising Geostationary Satellites) algorithm used to retrieve these products is based on a backpropagation neural network which combined the BTD technique with a mask of high clouds and atmospheric model lookup tables for a broad range of particle concentrations for different ash types in various layers (Kox, 2012; Kox et al., 2013; Graf et al., 2015; Bugliaro et al., 2021). Figure 7 presents ash column load on 13 May 2010 (Eyjafjallajökull eruption, Iceland). An ad hoc version of this algorithm tailored for Himawari has also been developed and applied to the Sinabung 2018 eruption (de Laat et al., 2020).
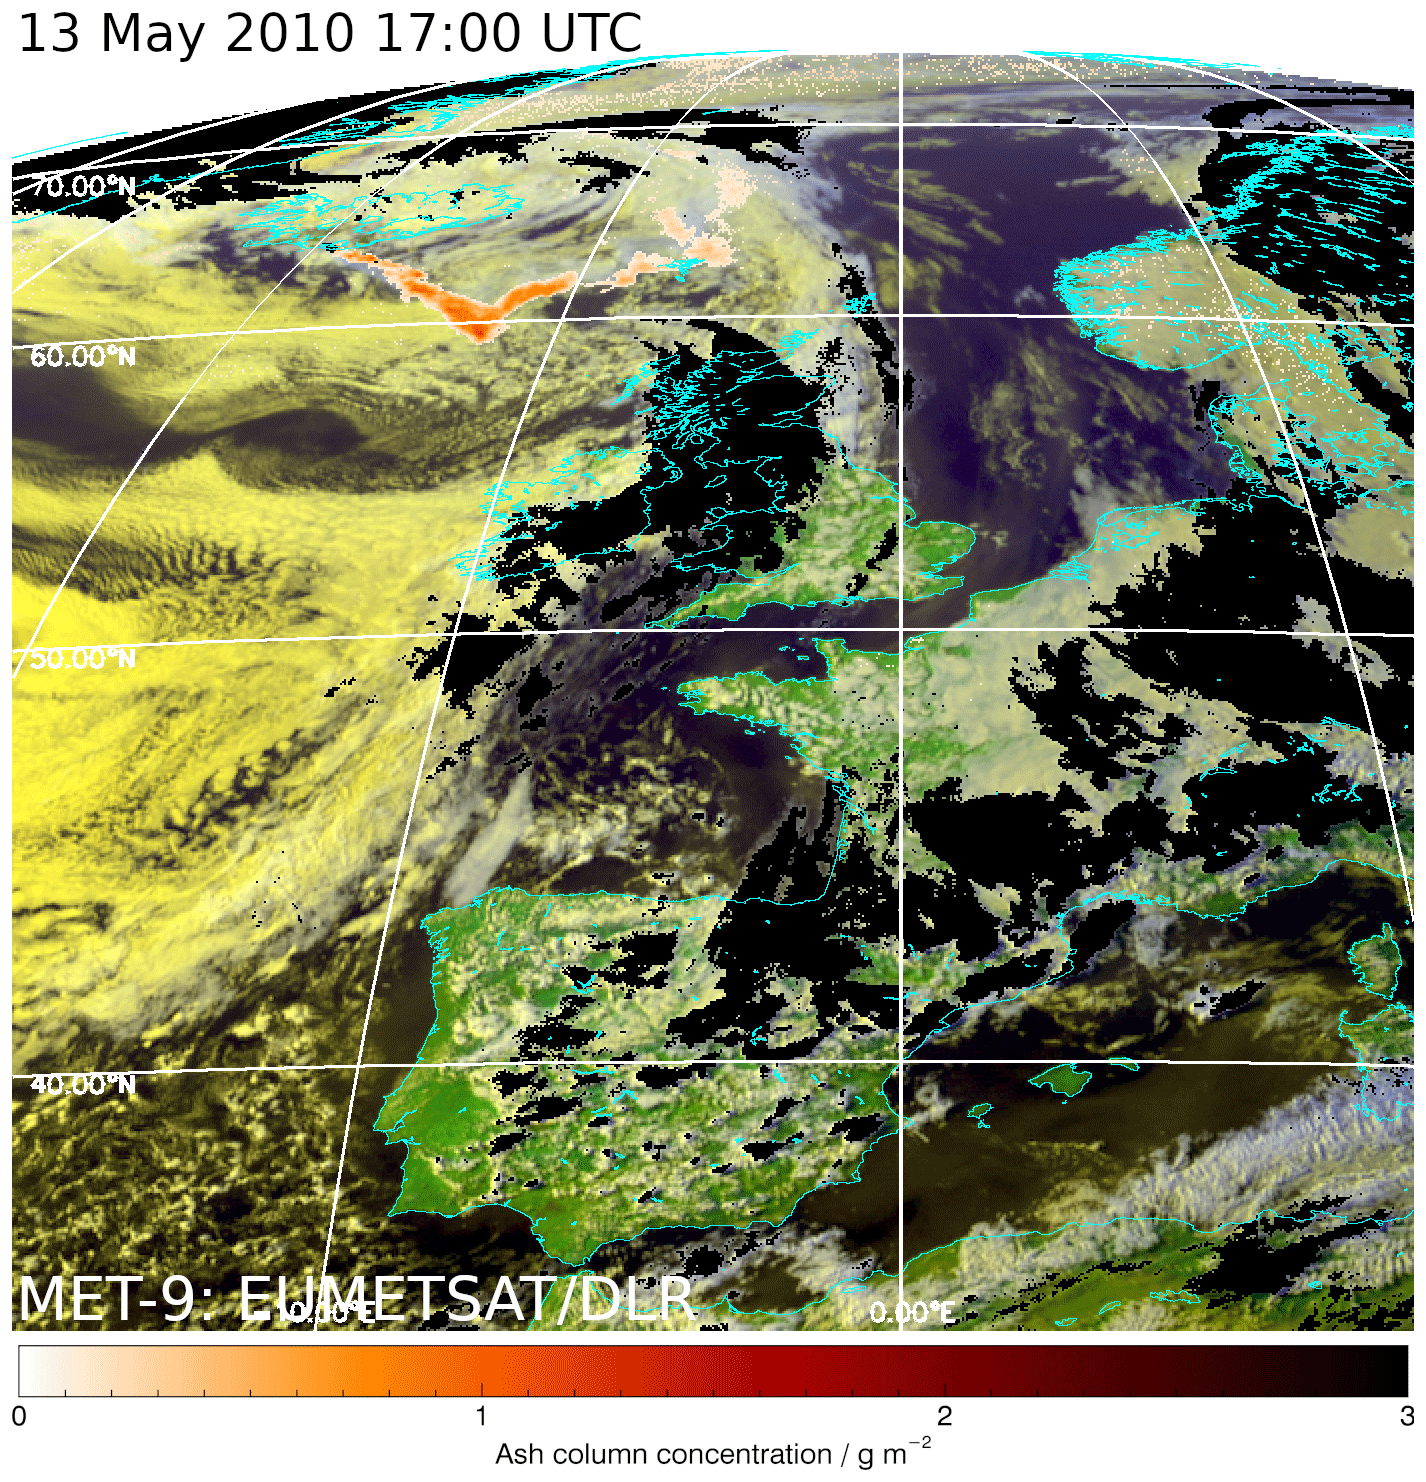
Figure 7Ash column concentration from SEVIRI on 13 May 2010 (Eyjafjallajökull eruption, Iceland). Orange–red: ash detection (column concentration); black: cirrus mask.
4.1.3 Selective detection of dust
Clarisse et al. (2010, 2013) have demonstrated the potential of hyperspectral thermal infrared sounders to detect volcanic ash with a high sensitivity and differentiate it from other airborne aerosol (including windblown sand), as illustrated in Fig. 8.
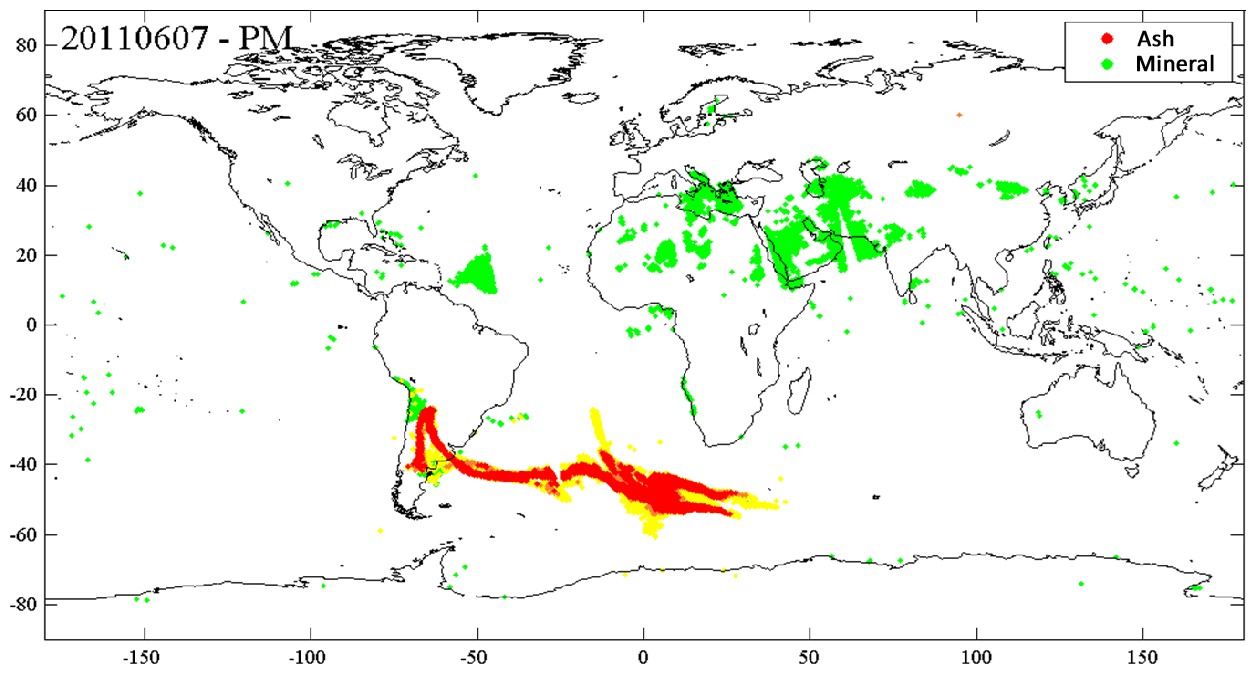
Figure 8IASI-A detection of volcanic ash (Puyehue–Cordón Caulle eruption) and mineral dust (windblown desert sands) on 7 June 2011 (afternoon). Please note that the date format in this figure is yyyymmdd.
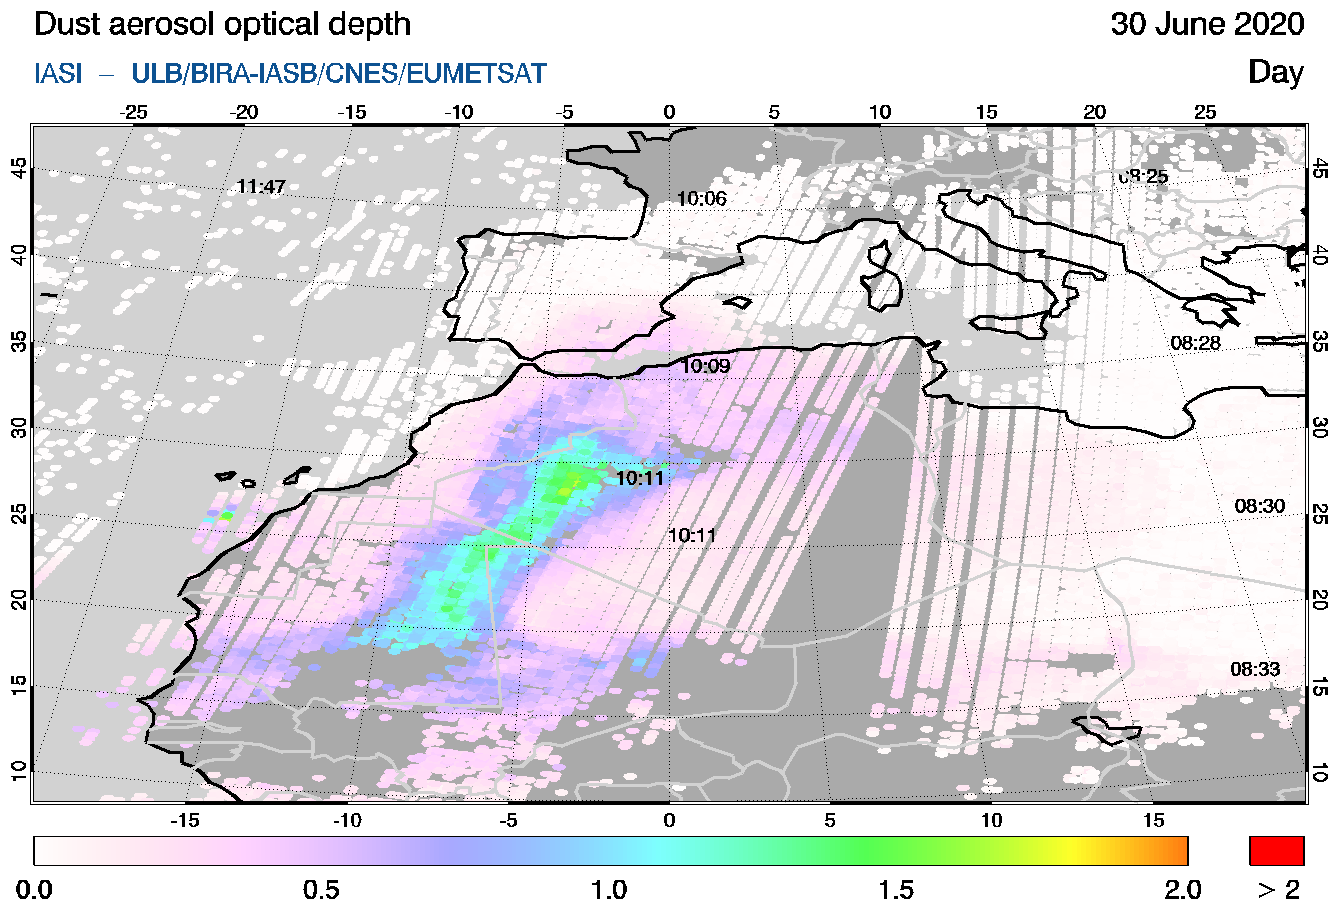
Figure 9Saharan dust AOD observed by IASI-C on 30 June 2020.
Clarisse et al. (2019) have recently presented a new algorithm for estimating atmospheric dust optical depth (dust AOD) and associated retrieval uncertainties. This AOD retrieval, specific to dust, is based on the calculation of a dust index and on a neural network trained with synthetic IASI spectra. It has an inherent high sensitivity to dust and efficiently discriminates mineral dust from other aerosols, as shown in Fig. 8 (see Clarisse et al., 2013, 2019). The EUNADICS-AV EWS considers a dust flag and dust AOD from IASI (on board MetOp-A, MetOp-B and MetOp-C). As an example, Saharan dust AOD is observed by IASI-B on 30 June 2020 (Fig. 9).
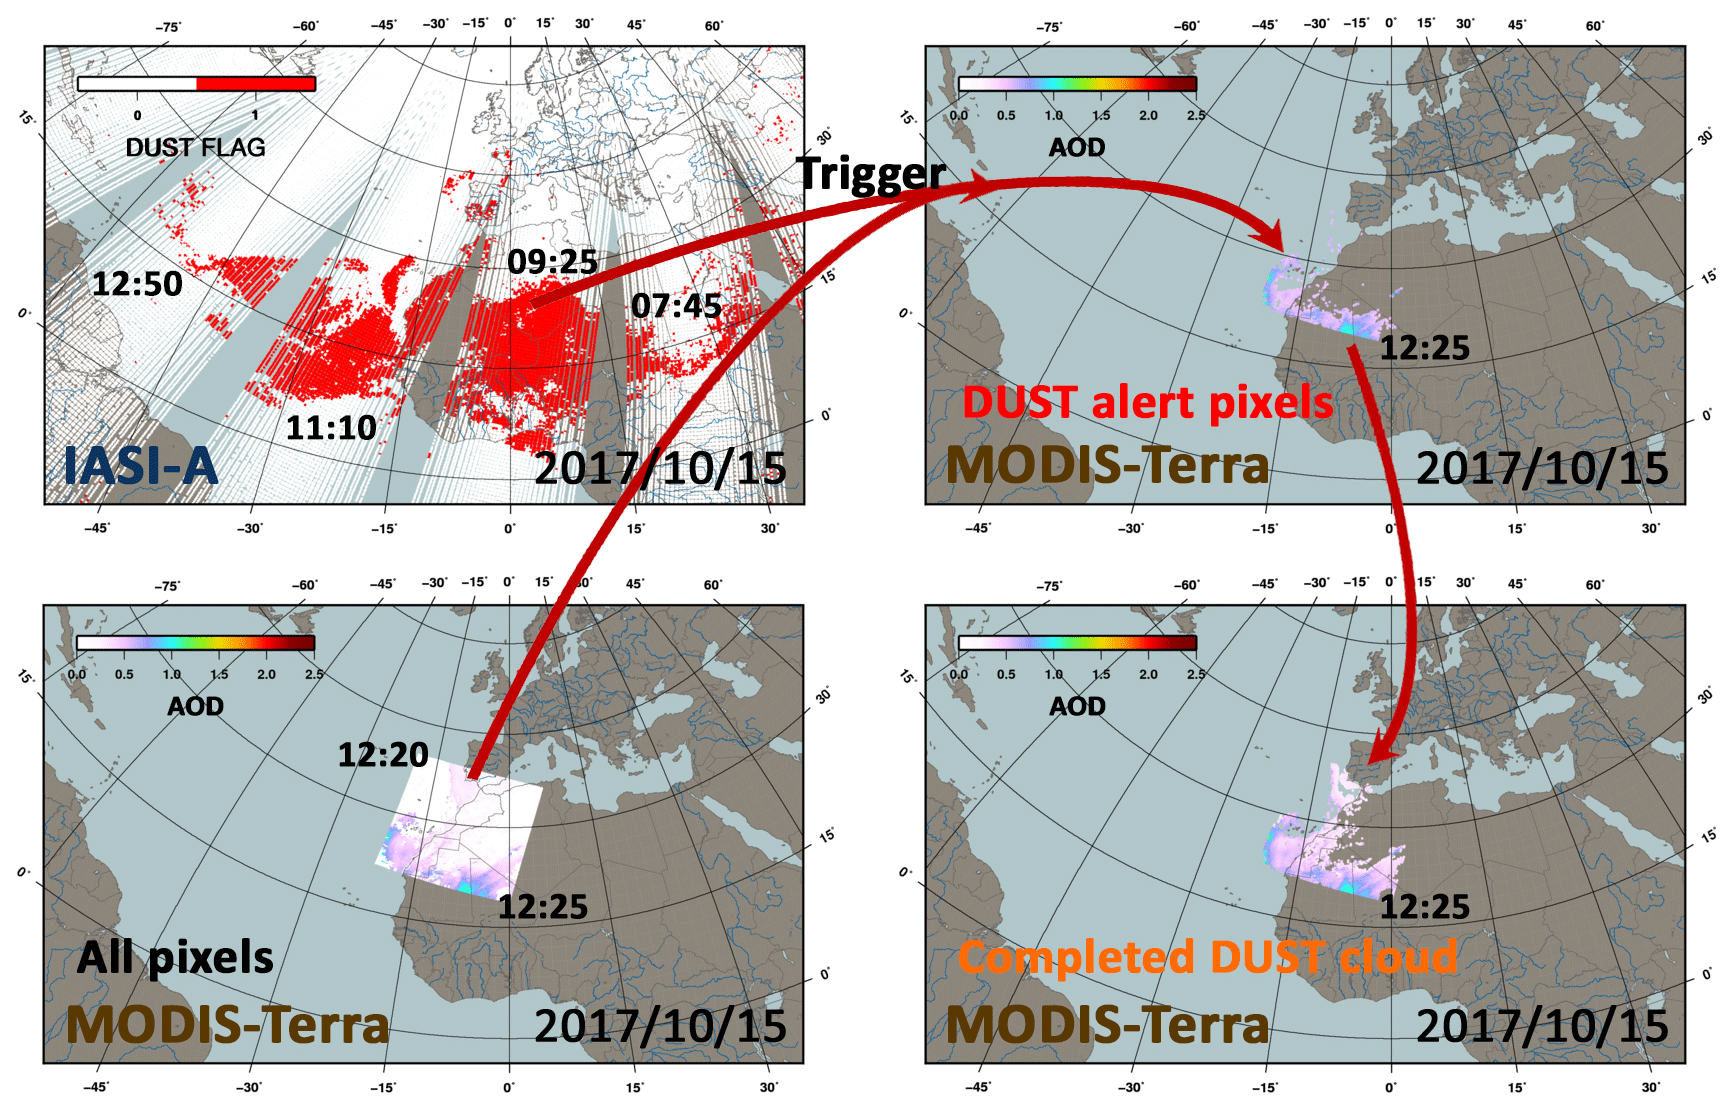
Figure 10Illustration of the triggered approach to isolate MODIS Terra AOD pixels related to desert dust (15 October 2017) using dust flag from IASI-A. Completed AOD data related to the dust cloud can be retrieved. Please note that the date format in this figure is yyyy/mm/dd.
4.1.4 Triggered detection of dust or smoke
This approach essentially relies on the collocation (or near collocation) of a selective product with a non-selective product to trigger (and propagate) alerts. Figure 10 illustrates the triggered approach applied by the EUNADICS-AV EWS to obtain detection of dust from the combined Dark Target and Deep Blue AOD products from MODIS Terra (Levy et al., 2015) using selective detection of dust from IASI-A (colour code red for dust flag = 1). This figure shows all of the AOD pixel values from MODIS (for a data granule measuring between 11:20 and 11:25 UTC on 15 October 2017). A threshold value is used to select the AOD from MODIS (threshold of 0.7) for testing geographic matching (critical distance of 200 km) with alert pixels (from IASI-A). These alert data pixels have been obtained from a previous AOD alert from IASI-A and are stored by the EUNADICS-AV EWS as active dust alert pixels (defining the pool of dust alerts). Each pixel of this pool is characterised by a position and a time. An alert pixel of the dust pool stays active for 12 h. If a match is obtained between selected MODIS AOD pixels and the alert pixels from the dust pool, the MODIS AOD pixel is determined as an alert pixel (which joins the dust pool). A completion of the dust cloud from MODIS AOD is obtained by looking at the neighbouring pixels (with an AOD value over 0.5) of all the newly obtained dust alerts (completed cloud in Fig. 10).
On 15 October 2017, Hurricane Ophelia reached Ireland (downgraded to storm) and during its northward movement brought desert dust particles and smoke particles from raging fires over the Iberian Peninsula in Europe (Osborne et al., 2019). During this twin event, the OMPS instrument measured high values of AAI (aerosol absorbing index; between 12:50 and 14:40 UTC) due to dust from Africa's Sahara and smoke from wildfires in Spain and Portugal. Figure 11 illustrates the triggered approach applied to obtain selective detection of dust and smoke clouds from OMPS AAI using, respectively, the pools of dust alerts (fed by IASI-A and MODIS Terra alerts) and smoke alerts. The active pool related to smoke is fed by the NRT fire localisation from NASA FIRMS, i.e. thermal anomaly and FRP data from the VIIRS sensor, in the present case.
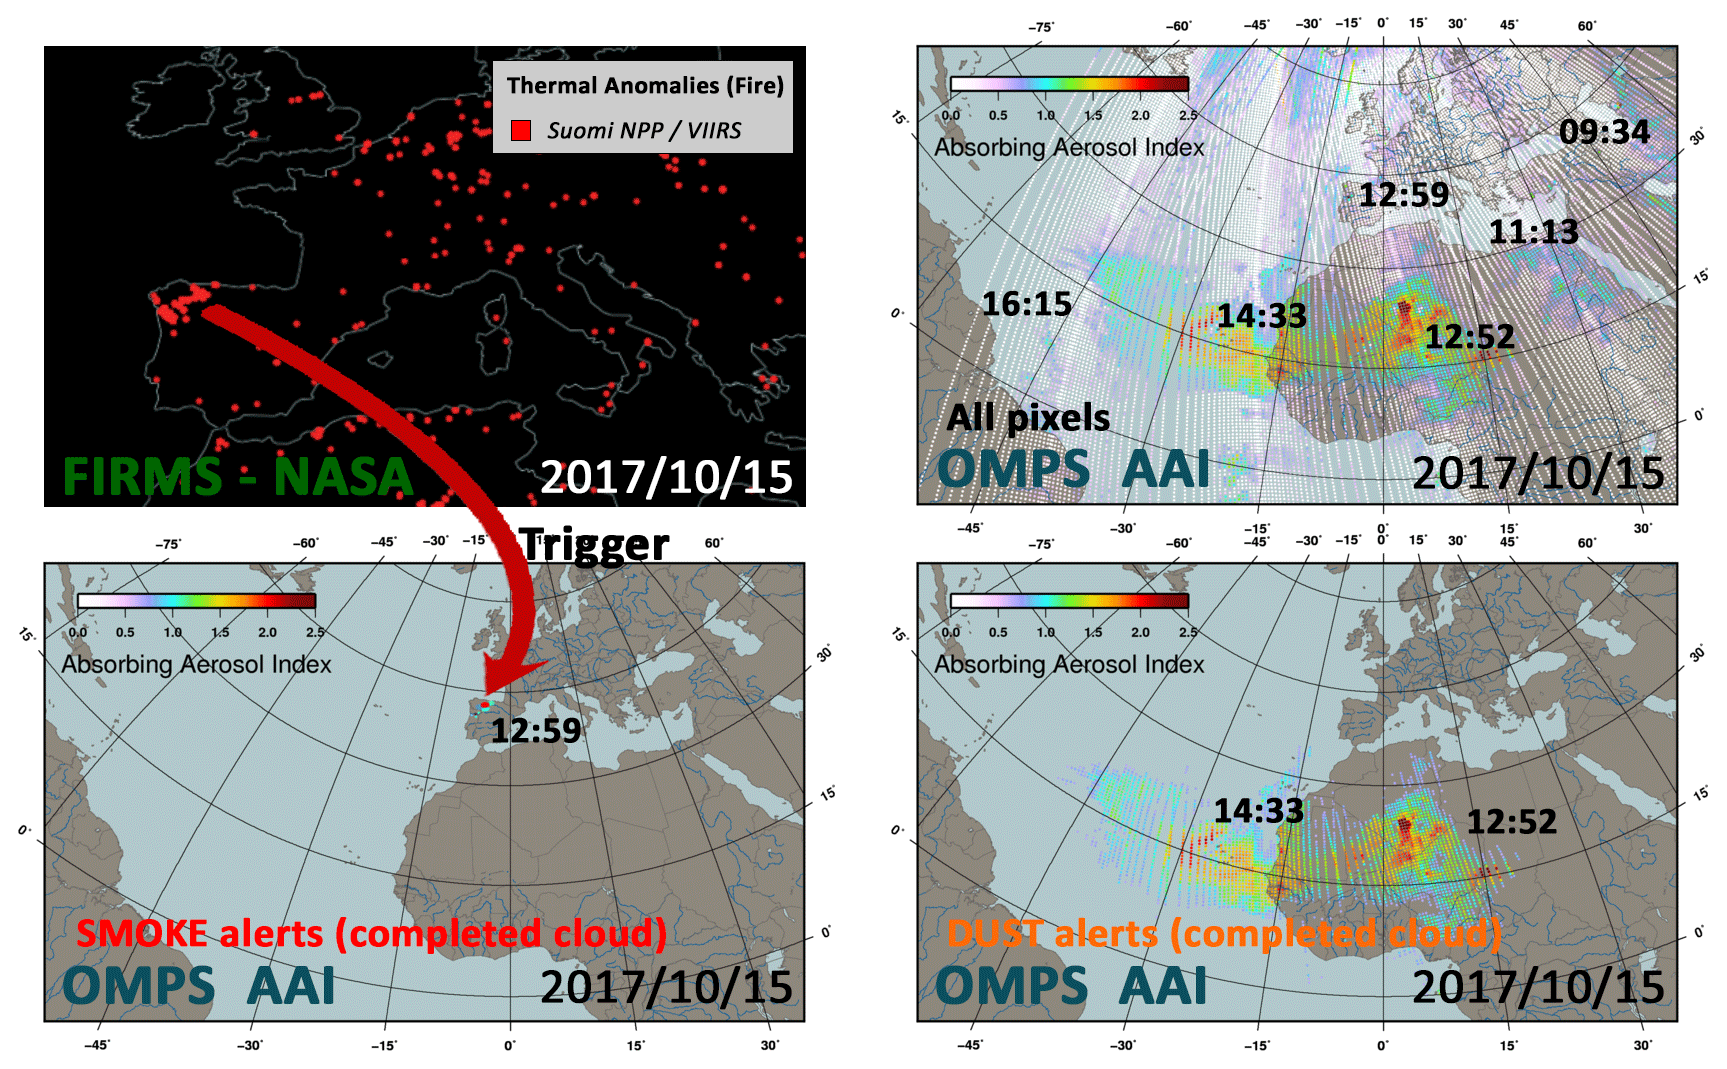
Figure 11Illustration of the triggered approach to isolate OMPS AAI pixels related to smoke and dust (15 October 2017). Please note that the date format in this figure is yyyy/mm/dd.
The EUNADICS-AV EWS identifies smoke alerts from OMPS on 15 October 2017 (Fig. 11). These alert pixels remain active for 24 h in our system. On 16 October, the smoke pool triggers new OMPS smoke alerts, which are observed over France and the UK (Fig. 12). At the same time, the system isolates dust alerts from OMPS, which are located over the Sahara and the Atlantic Ocean. Using both alert pools (dust and smoke), the displacement of the two hazardous clouds (on 16 and 17 October 2017) is shown in Fig. 12. On 17 October, the smoke plume and the respective OMPS alert pixels are retrieved over northern Europe. At the same time, dust alert pixels are still observed over the Sahara and the Atlantic Ocean.
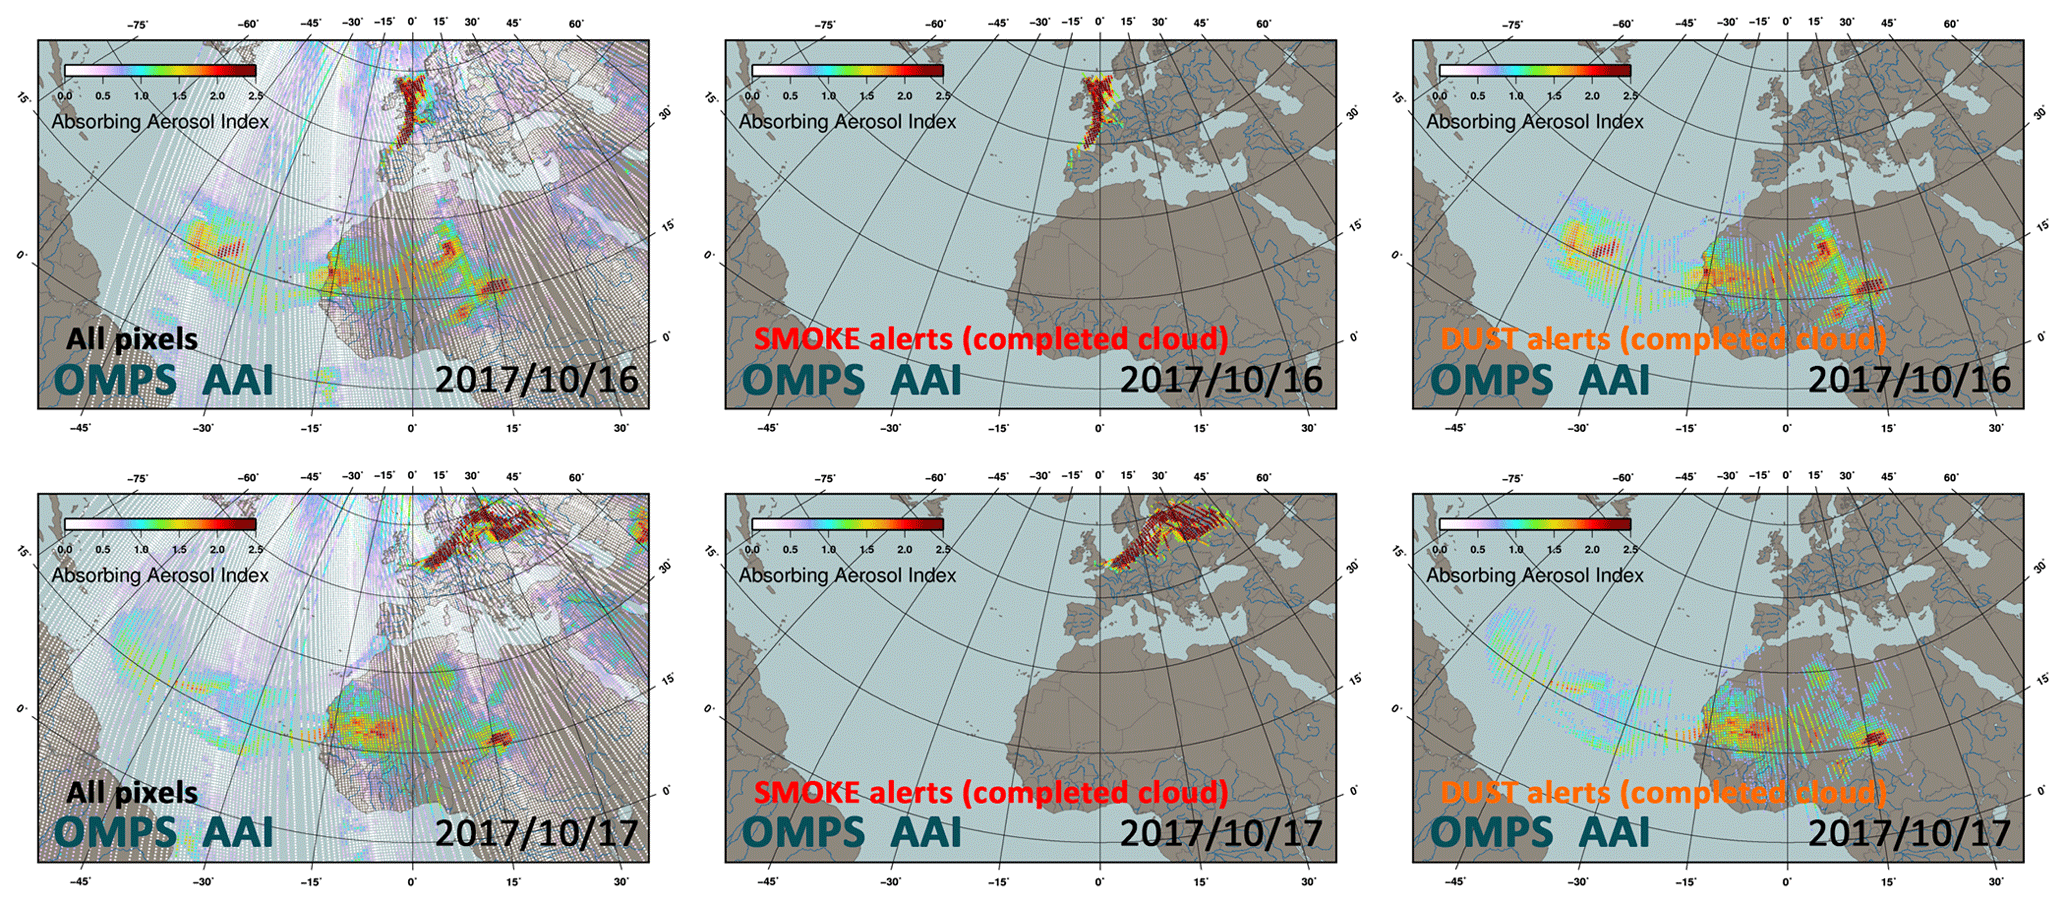
Figure 12Isolated OMPS AAI pixels related to dust and smoke on 16 and 17 October 2017. Please note that the date format in this figure is yyyy/mm/dd.
4.2 Detection of airborne hazards using a ground-based network
4.2.1 Selective detection of aerosol hazards using the EARLINET network
A tailored alerting product from the European Aerosol Research Lidar Network (EARLINET; https://www.earlinet.org, last access: 5 November 2021) was developed during the EUNADICS-AV project (Papagiannopoulos et al., 2020). It was designed for NRT EWS applications. Using a stand-alone lidar-based method for detecting airborne hazards (volcanic ash and desert dust; no discrimination), this product is based on the EARLINET Single Calculus Chain (version 5.1) that provides temporally highly resolved, calibrated attenuated backscatter and volume depolarisation ratio (at 532 nm) and a cloud mask. The vertical resolution is 7.5 m, and the temporal resolution is 30 s. From these calibrated data, further particle products (particle backscatter coefficient and particle depolarisation ratio) can be retrieved that act as the basis of the tailored product. The final product (to be used by the EUNADICS-AV EWS) is the aviation alert for desert dust/volcanic ash with three colour codes. This alert product uses particle mass concentration (pmc) based on backscatter coefficient thresholds. High-level detection appears in red (almost certain detection of ash or dust aerosol with pmc ≥ 4 mg m−3), and medium-level detection is in orange (4 mg m−3 > pmc ≥ 2 mg m−3). Low-level detection is in yellow (2 mg m−3 > pmc ≥ 0.2 mg m−3). An example of an alert from EARLINET is shown in Fig. 13. On 21–22 March 2018, the eastern Mediterranean, in particular the island of Crete, was under extreme effects of warm southerly winds pushing enormous amounts of Saharan dust – and hot air – northwards. The desert dust storm caused the closure of Heraklion airport (Crete, Greece) on 22 March 2018 and was detected by the ground-based lidar from EARLINET.
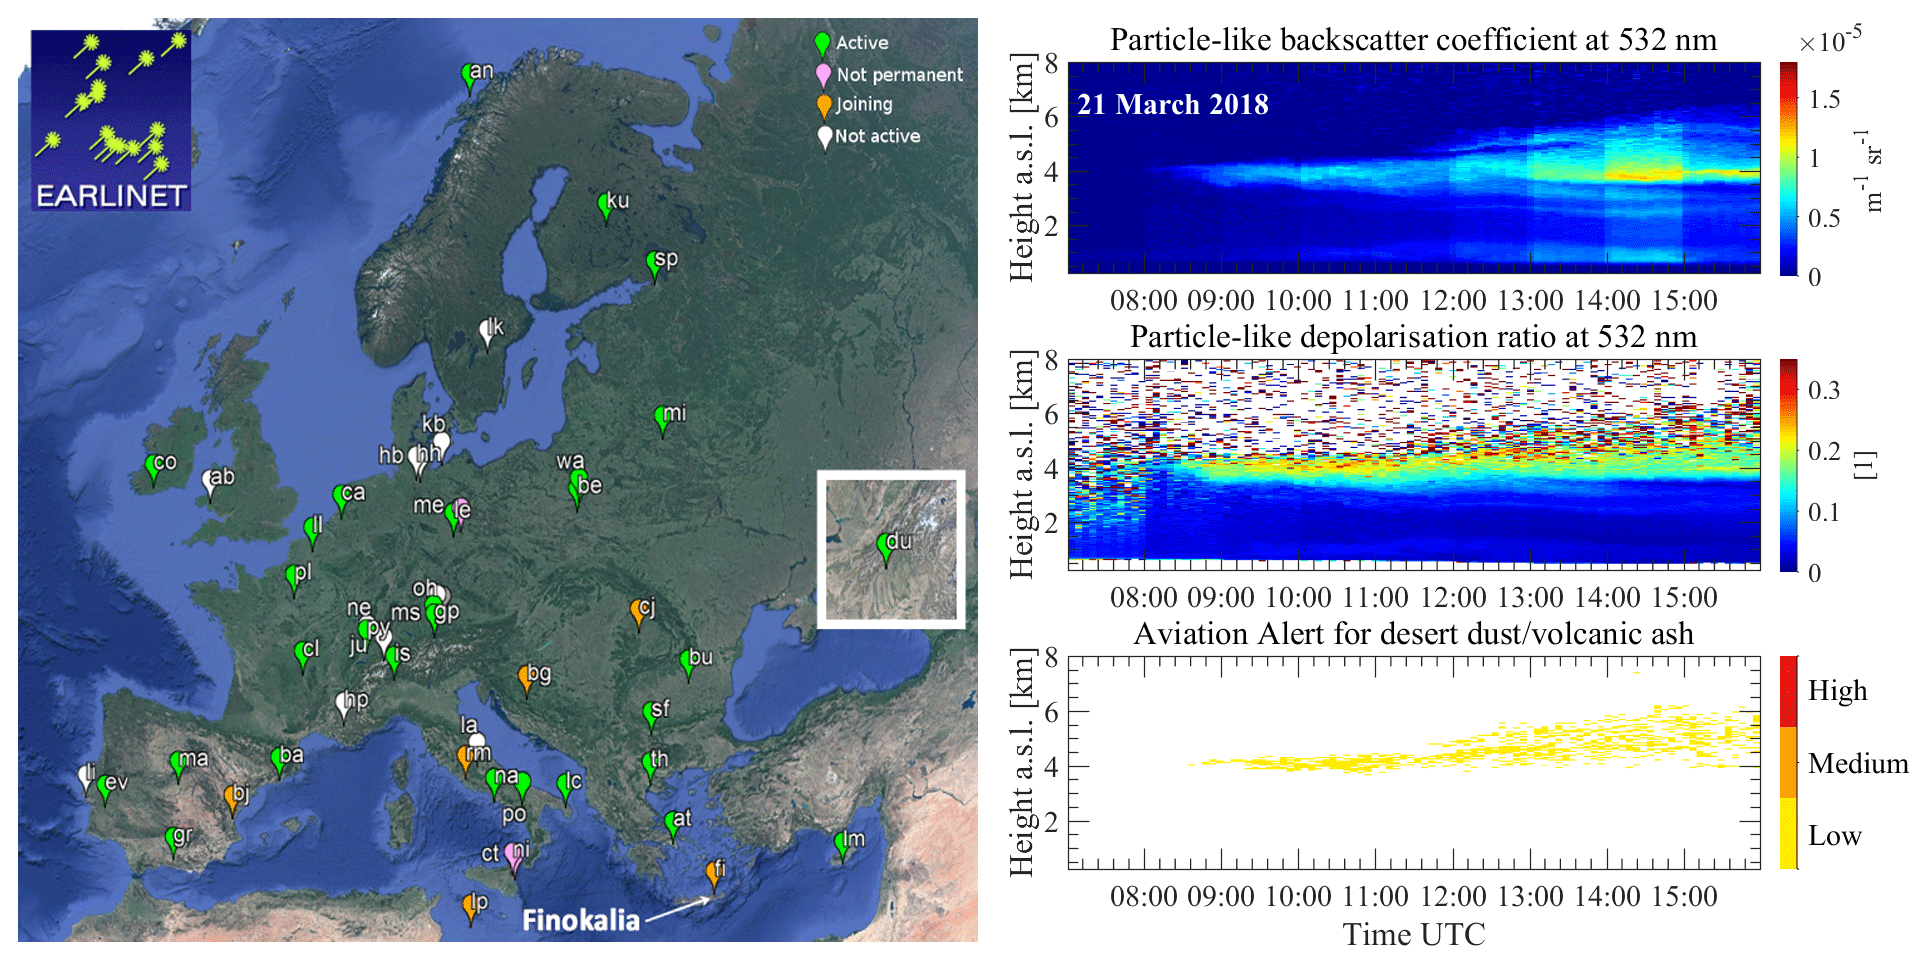
Figure 13Left panel: map of the EARLINET network (from https://www.earlinet.org, last access: 5 November 2021). Right panels: illustration of desert dust/volcanic-ash alerts (station Finokalia) during a desert dust storm on 21 March 2018 (particle backscatter coefficient at 532 nm, particle depolarisation ratio at 532 nm and alert for aviation).
4.2.2 Quicklook images from the E-PROFILE network
In addition to the NRT distribution of its observation data in the netCDF (Network Common Data Form) format, the E-PROFILE network from EUMETNET provides an interactive geographical overview of observations. Quicklooks and interactive plots of aerosols and clouds from the network of automatic lidars and ceilometers (ALC, currently 345 units in continuous operation) as well as of wind profile observations from radar wind profilers (40 units in continuous operation) and from precipitation radars (96 units) can freely be accessed at https://e-profile.eu (last access: 5 November 2021) (Haefele et al., 2016). An example is given in Fig. 14 showing the time series of attenuated backscatter profiles for 4 June 2019 over a region of the United Kingdom, France, Belgium, the Netherlands, Germany and the Czech Republic. On this day smoke originating from North American wildfires was present in the region. Besides the aerosols of the planetary boundary layer, the smoke plumes in the free troposphere between 2000 and 6000 m are clearly visible. Here, an example of smoke is shown because such large-scale ash advections have not been observed since the establishment of the network. However, all aerosols, including ash (some smaller Etna cases exist, not shown), can be observed by these instruments. Thanks to the continuous monitoring of ALC and the geographical density of stations in E-PROFILE, such events are easily captured when the plume passes over the observation sites. The event of 4 June 2019 nicely demonstrates the value of this network for monitoring the exact altitude and timing of plumes of ash and other hazardous aerosols over Europe in NRT.
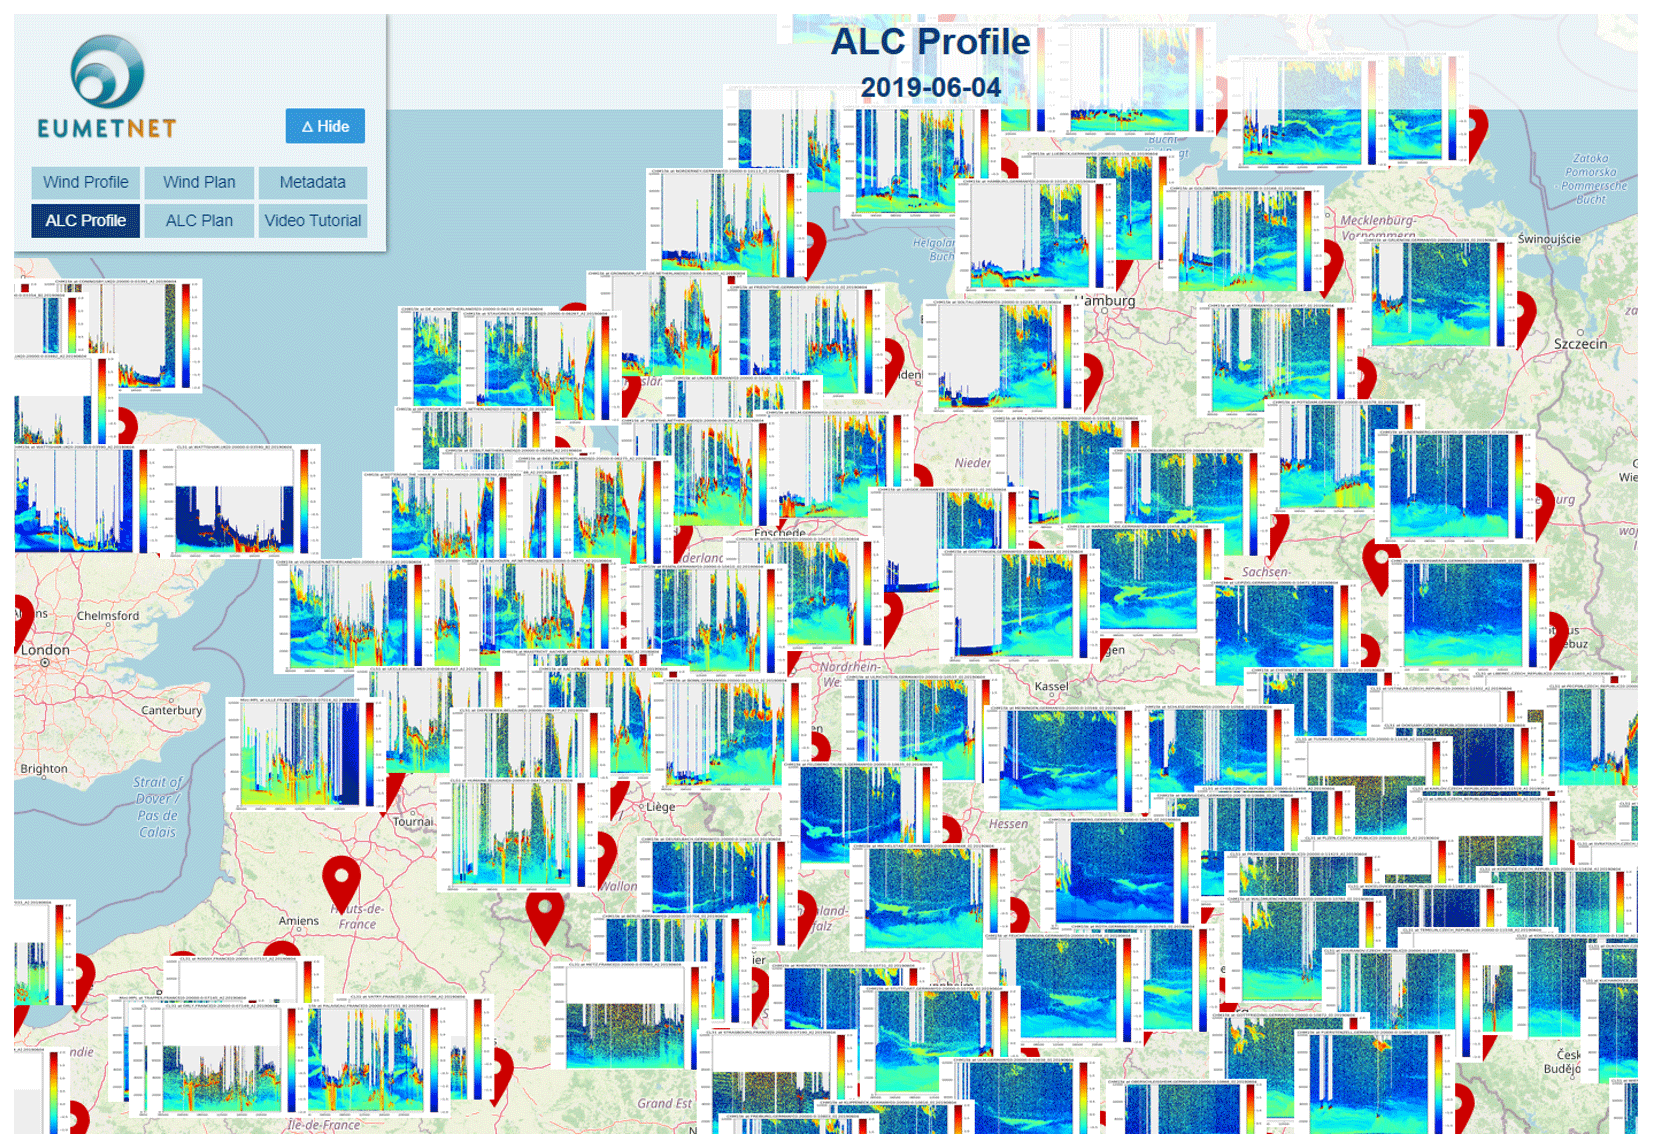
Figure 14The E-PROFILE ALC network with quicklooks of attenuated backscatter observations from https://e-profile.eu (last access: 5 November 2021). The quicklooks have the time (00:00–24:00 UTC) on their x axis and altitude above sea level (0–12 km) on their y axis. The high values of attenuated backscatter correspond to clouds (orange and red) and aerosols (light blue, green and yellow). Low- and mid-level clouds usually completely attenuate the signal above so that no observations above can be reported what is seen by the white areas in the quicklooks. Please note that the date format in this figure is yyyy-mm-dd.
4.2.3 Detection from regional networks
Essential information about volcanic plumes is provided by region networks. The EUNADICS-AV EWS is fed by NRT tailored products from two volcano observatories: IMO in Reykjavik (https://en.vedur.is, last access: 5 November 2021) and INGV-OE in Catania (https://www.ct.ingv.it, last access: 5 November 2021). Precursors of volcanic eruptions and selective detections characterising ongoing events are provided to the EUNADICS-AV system. Relevant information from ground-based and in situ instrumentations (e.g. seismic networks, UV and IR cameras, webcams, radars, UV spectrometers, lidars, and gas sampling) and satellite products (e.g. UV and IR sensors and broadband imagers) are used by IMO and INGV-OE to create and send messages, the so-called VONA, and reports sent to the national civil-protection authorities. The EUNADICS-AV system ingests the information from VONA to characterise the source of the natural airborne hazard (volcano). Figure 15 shows an example of a VONA message created by INGV-OE. The volcano observatories use different types of cameras (visible, thermal or UV cameras) and provide information about the source of the ongoing volcanic eruption (e.g. height and opacity of the plume and quantity of gas emitted). This takes into account information from the INGV-OE seismic network (near the Etna and Stromboli volcanoes). This infrastructure of mobile and permanent seismometers has an important number of permanent seismic stations operating in the Etna area (more than 40 stations, with 18 stations located at a medium–high volcano) to ensure adequate coverage even of low-magnitude seismicity and for the detection of seismic–volcanic events. This also considers the automated scanning FLAME (FLux Automatic MEasurements) network of nine UV scanning spectrometers, which are installed on the flanks of Mt Etna, delivering continuous SO2 concentrations and fluxes (Salerno et al., 2009). IMO provides to our EWS a selection of links (images from webcams) for each monitored site (about 30). Cameras are shown in NRT, with a few minutes of delay, with snapshots (with scale of height) for several active volcanoes. IMO also provides links to quicklooks from satellites. The focus area is Iceland and surroundings. Animations from the SEVIRI (on board Meteosat-11) geostationary sensor and the AVHRR (Advanced Very High Resolution Radiometer; NOAA-19 and MetOp-A), VIIRS (Suomi-NPP) and MODIS (Terra) polar-orbiting sensors are available in NRT.
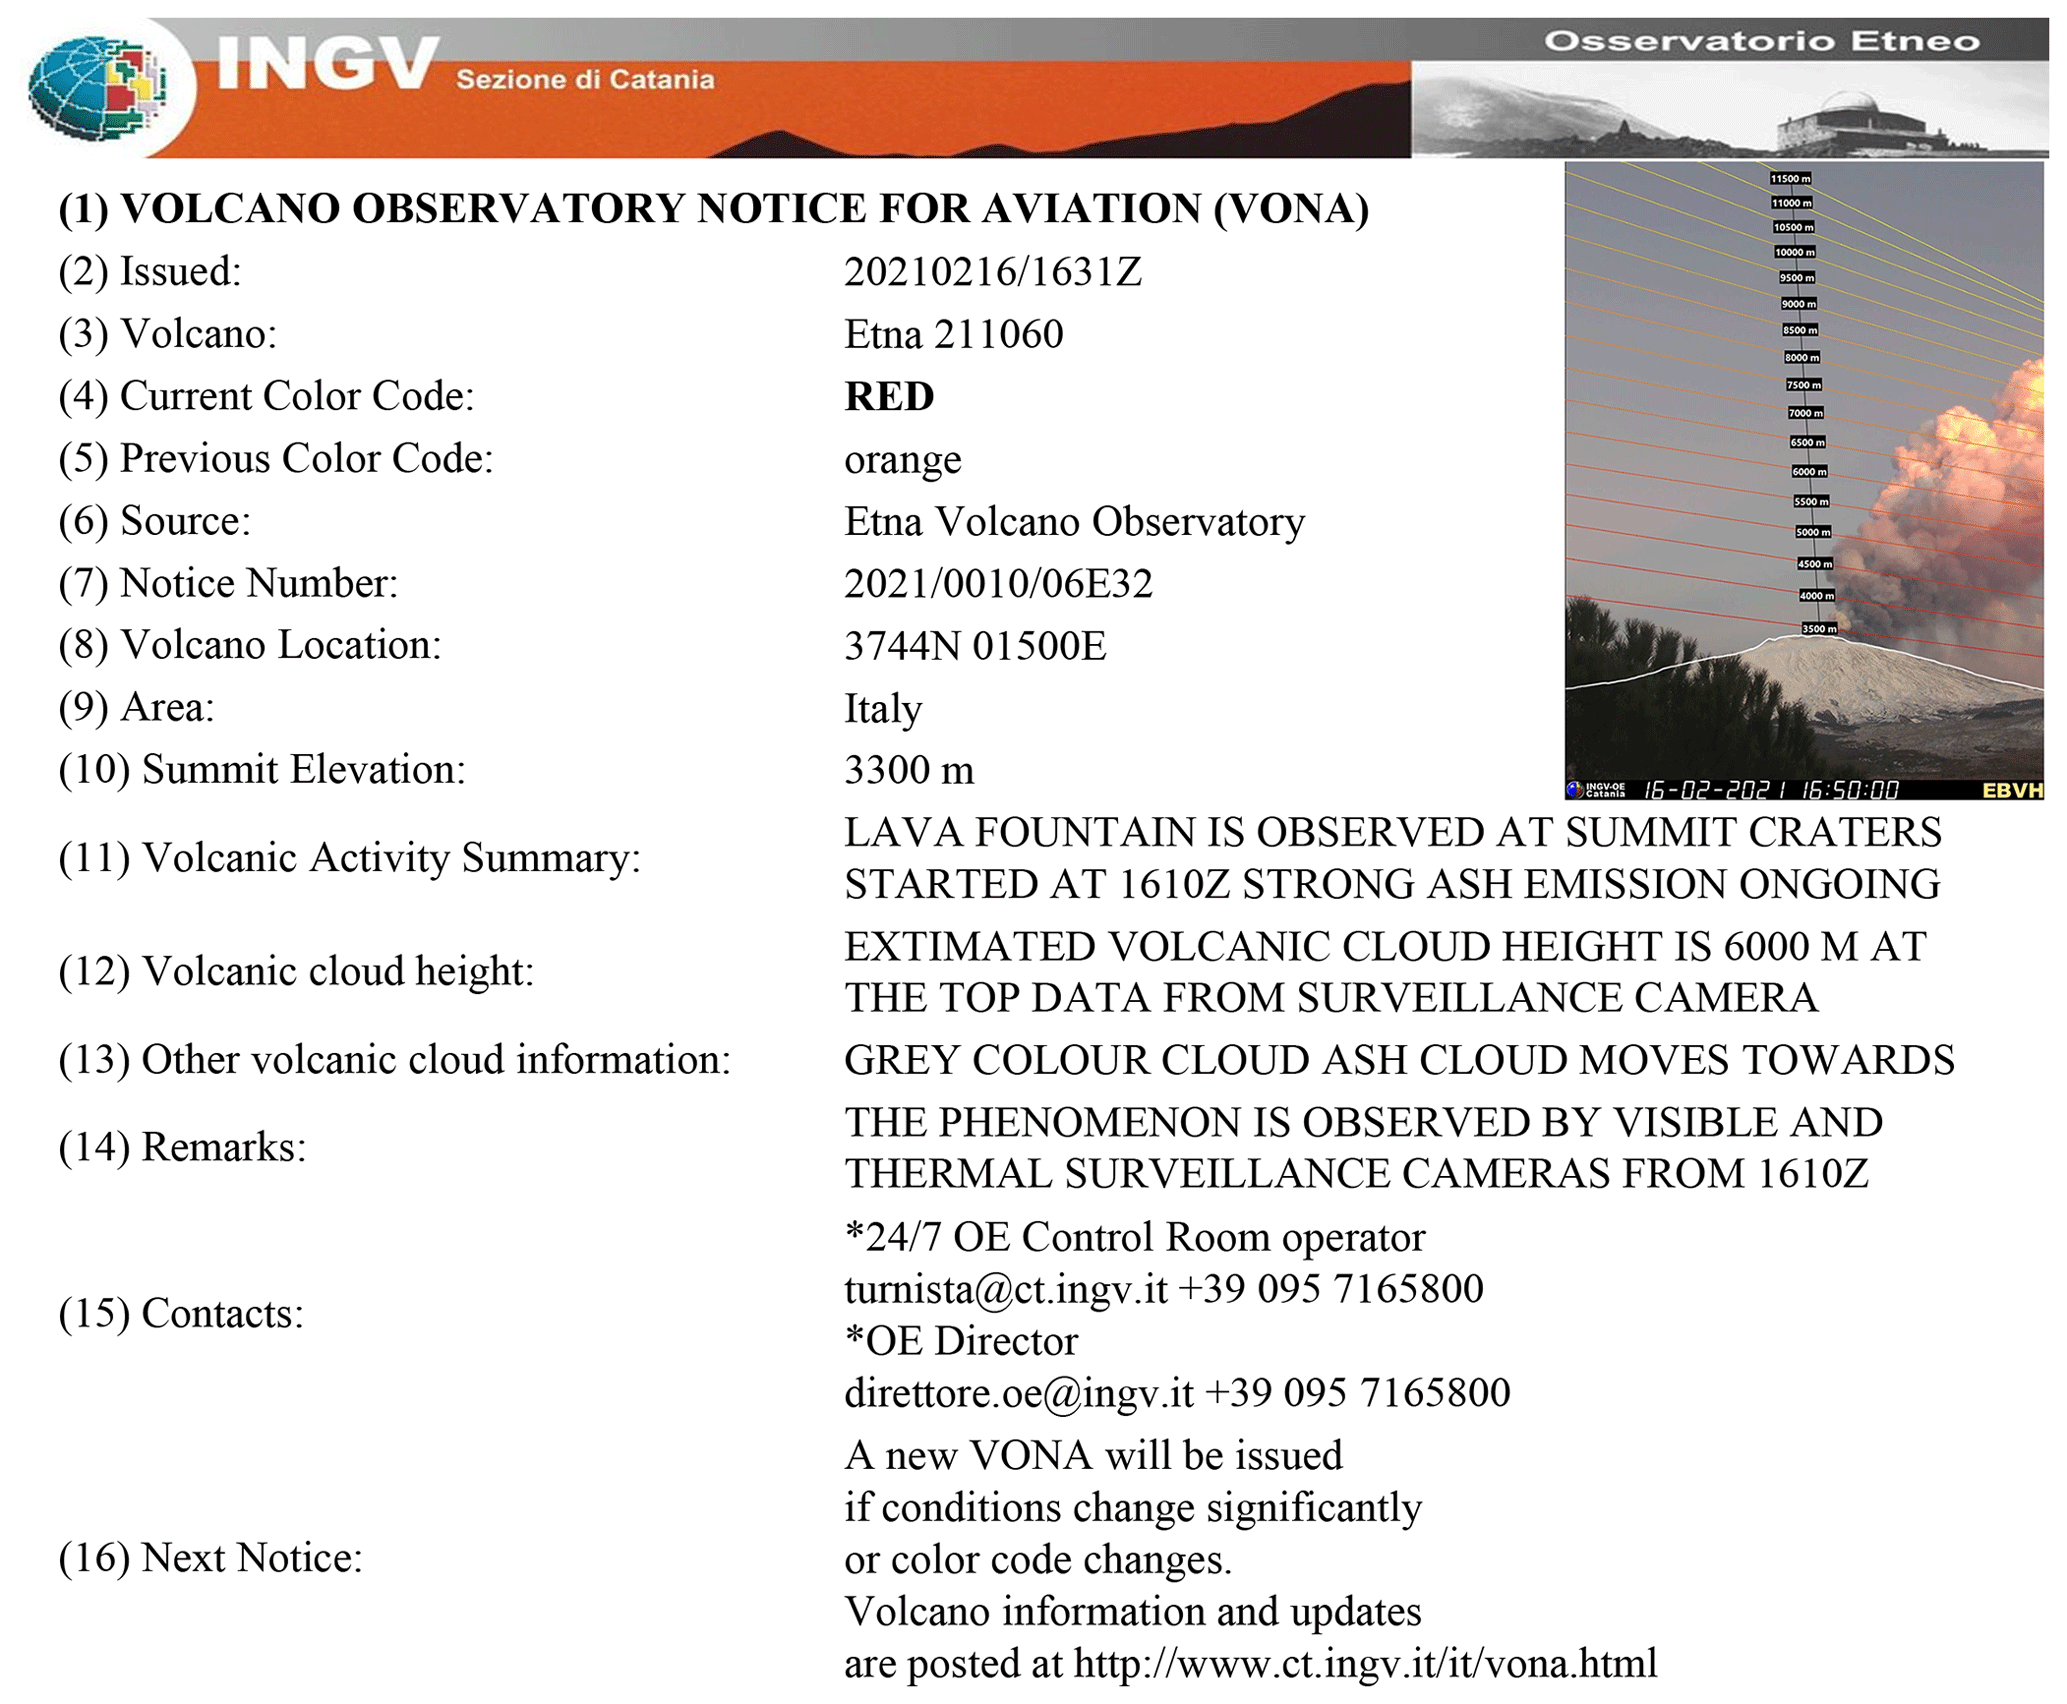
Figure 15VONA message for Etna activity (RED) on 16 February 2021 (at the start of a paroxysm episode). An image from a visible camera shows the procedure used to estimate the plume height (see Scollo et al., 2019).
The IMO volcano observatory has recently improved the VESPA (Volcanic Eruptive Source Parameters Assessment) system. In the case of an ongoing eruption, information about the plume height and mass eruption rate from weather radars (mobile C-band and X-band radar; http://brunnur.vedur.is/radar/vespa, last access: 5 November 2021) is provided to the EUNADICS-AV EWS, which ingests such information (links to quicklooks of the top height of volcanic plume; i.e. 2D images and time series). An example of the ash plume detected by a mobile X-band radar, during the Grímsvötn 2011 eruption, is displayed in Fig. 16. Data files describing the plume height are also available in NRT, providing the height of the highest point where a significant radar reflection is detected within 10 km distance of the volcano and the height of the next radar elevation angle above the volcano where plume was not detected. Arason et al. (2011) and Petersen et al. (2012) present more details about the radar and webcam products.
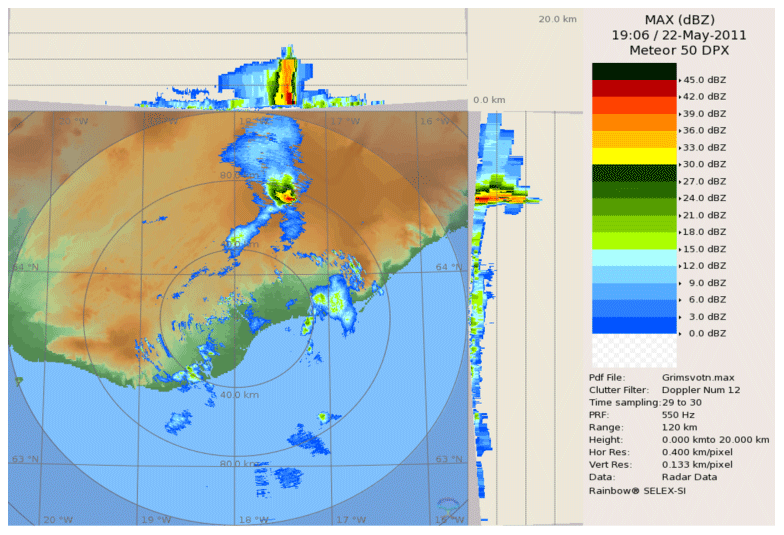
Figure 16Radar reflectivity plot displaying ash dispersal during the Grímsvötn 2011 eruption in Iceland.
4.3 Nuclear hazard and EU network
Several sources of radioactivity monitoring data are available, and to obtain robust, harmonised and real-time data is a challenge for the nuclear events. Although not validated, gamma dose rate (GDR) radiological monitoring data from most European countries are available in NRT from the EURDEP system (European Radiological Data Exchange Platform; https://eurdep.jrc.ec.europa.eu, last access: 5 November 2021); the usage of such data inside an automatic notification system common in all the European domain is not done. However, EUNADICS-AV, with view of a future operationalisation, requires access to real-time well-established data and data channels. Providing NRT availability and accessibility to such data is complex. The monitoring information is collected from automatic surveillance systems in 39 European countries. Without a radiological event, these data provide information on background radioactivity and its variability. However if a nuclear accident with gamma-emitting radionuclides occurs (e.g. anomalous GDR values over 0.5 µSv h−1 recorded), the network must be able to capture the existence and the geographical distribution/evolution of the event within the limitations of the network.
The approach taken to design and implement a notification system for nuclear events has largely relied on already existing capacities of the two main contributors to the current work, i.e. STUK (Radiation and Nuclear Safety Authority of Finland) and ZAMG (Central Institution for Meteorology and Geodynamics of Austria). By making use of their national and international mandates and capacities, STUK and ZAMG design the interfaces from monitoring data to notification and posterior alerting. As illustrated in Fig. 17, the current approach is based on both EURDEP data and the EMERCON (Emergency Convention) messages produced by IAEA through the WMO Regional Specialised Meteorological Centres (RSMCs). Both data sources are ultimately released by STUK after filtering the EURDEP data and collecting the EMERCON information (from ZAMG). STUK finally provides the information to the automatic alerting system developed in EUNADICS-AV.

Figure 17Approach taken for the interface between radiological data and the final notification to end users.
Following its national responsibilities, STUK has implemented elevated GDR alerting software based on measurements available in the EURDEP system. It consists of separate Python scripts that handle data collection, alerting and database maintenance functions. This work at the national level has been further extended to fit the purpose of the EUNADICS-AV EWS. The alerting condition is checked in 10 min intervals. A nuclear threat is declared and an alert is created if two nearby measurements show dose rate values higher than the calculated background. Alerting based on a single measurement is not advisable because very often there are high dose rate values caused by other factors, such as broken Geiger–Müller tubes, for instance. When an alert in GDR data is identified, a text message file is created. This alert message is transferred to a ZAMG-hosted FTP (File Transfer Protocol) server, and an email notification is sent to the hosting platform of the EUNADICS-AV EWS at BIRA. This message transfers data information and a link to an HTML (Hypertext Markup Language) page, which points to an interactive map automatically zoomed to the alerting stations. An example of the EURDEP notification, taken from the EUNADICS-AV March 2019 exercise (cf. the example of the Etna eruption exercise of Hirtl et al., 2020a) is shown in Fig. 18.
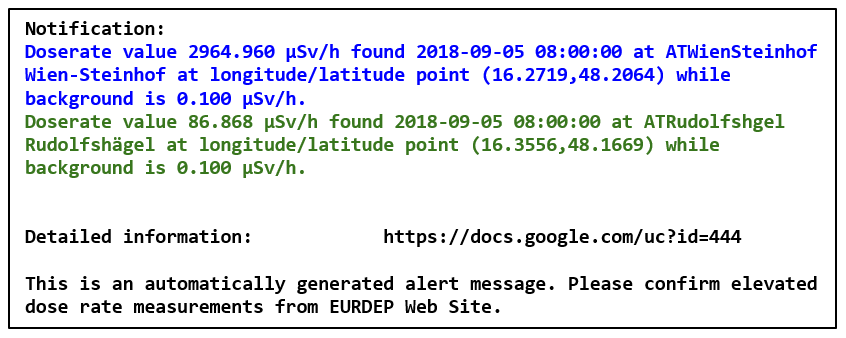
The detailed information link leads to an HTML web page containing the map with zoom and pan features (Fig. 19). The map contains current real online measurements of the EURDEP network. However, and as a note of caution, currently in the EURDEP system, most European countries do not share validated radiological monitoring data in NRT, and gaps may appear per country or time window. In the case of a GDR alert, an alert data product is created by the EUNADICS-AV EWS, in a homogenised format (see Sect. 4.4.3).
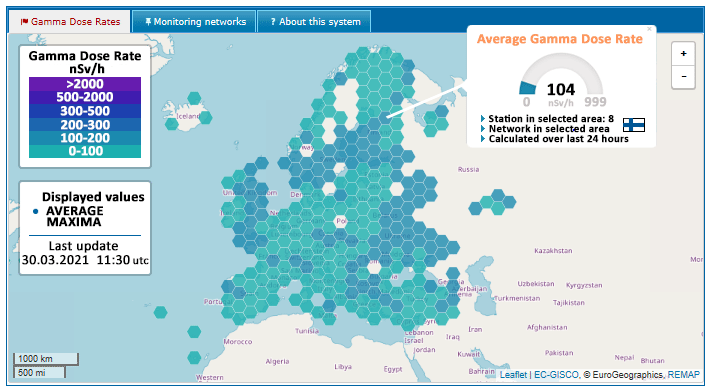
Figure 19Link to EURDEP network measurements (gamma dose rates) from an EMERCON message.
4.4 Overview of the EUNADICS-AV EWS
The EUNADICS-AV EWS is built on the SACS system (Brenot et al., 2014), which provides NRT satellite data products (SO2 columns and ash and aerosol index) to aviation stakeholders in the form of maps and email notifications. The SACS system (https://sacs.aeronomie.be, last access: 5 November 2021) is dedicated to volcanic hazards. The development achieved by EUNADICS-AV concerned an upgrade of the SACS system (volcanic emission) and the extension to other airborne hazard (dust, smoke and radionuclide clouds), with the creation of new alert products.
The EUNADICS-AV EWS is a prototype multi-hazard system which has expanded the SACS system and creates new functionalities (based on existing mechanisms of SACS) by using the following: (1) key satellite products from IASI/MetOp-A, IASI/MetOp-B and IASI/MetOp-C; SEVIRI/MSG-9; TROPOMI/Sentinel-5 Precursor; SLSTR/Sentinel-3A and SLSTR/Sentinel-3B; and MODIS Terra and Aqua sensors; (2) ground measurements from EU networks (EARLINET and E-PROFILE) and regional networks from volcano observatories (IMO and INGV-OE); and (3) existing services (VONA messages, EURDEP, RSMC EMERCON messages and NASA FIRMS). A new functionality obtained by the EUNADICS-AV prototype EWS is (4) the creation of netCDF alert data products (NCAP files) dedicated to the integration in the dispersion model and the interest for ATM stakeholders.
The development of the pre-alerting mechanism is based on email notifications (volcanic and radionuclide cloud hazards only) and the creation of homogenised tailored data alert products and alert maps, as illustrated in Fig. 20. Initially, the SACS system was built integrating NRT data products (SO2 columns and aerosols/ash indexes) from seven polar-orbiting instruments (OMI, OMPS, GOME-2A, GOME-2B, AIRS, IASI-A and IASI-B) in a single monitoring and alerting system for volcanic eruptions. This system considers only satellite instruments on board polar-orbiting satellites. Figure 20 shows the new additional data information ingested by the EUNADICS-AV EWS.
NRT products from satellite, ground-based and in situ platforms/instruments are provided by EUNADICS-AV partners and external data sources (Tables 2 and 3) and transferred to the EWS. The blue block in Fig. 20 indicates the multi-source input data (ash, SO2, dust, radioactive and smoke cloud observations). The structure and the choice of the data products considered in the EUNADICS-AV EWS relies on the user requirements and risk assessments presented in Sect. 2. The automated EWS (including routine data products) applies its own mechanisms to create NRT images and to issue alerts. The development of the EUNADICS-AV EWS uses inputs from an existing EWS addressing continuous monitoring of volcanic ash and SO2 plumes (messages from VONA) and the detection of fires (NASA FIRMS) and radioactive plume (EURDEP) from NRT observational-data portals. In the case of the detection of exceptional concentrations (possibly threatening aviation), notifications are received by the EUNADICS-AV EWS, relaying these existing systems.
4.5 EWS mechanism
The implementation of alert notifications and data products requires a two-step approach. First, a specific establishment of warning criteria for the different sensors (satellite, ground-based and in situ) and for the different types of alerts (i.e. issued from the detection of volcanic, sand/dust storms, smoke from fire and radionuclide plumes) is required. Particular attention is given to the avoidance of false notifications (e.g. due to noise or retrieval failures) or overly frequent/redundant notifications (caused by highly dispersed plumes). As a baseline, the ash/SO2 alert criteria of some of the satellite products used in SACS (see Brenot et al., 2014) and considered by the EUNADICS-AV EWS are summarised in Table 5. This includes the name of the products, the type of instruments and the platform for satellite sensors, the criteria of alerts and their limitations, and the availability and access of data (off-line or NRT). The other products and criteria used by the EUNADICS-AV EWS are also listed in Table 5. The second step is to combine the information from all the products into one multi-sensor system. The EWS relies on pre-defined geographical regions and notifies interested parties to the start of an event (volcanic and radionuclides clouds only) as soon as a new airborne hazard plume is detected. If within a period of 24 h a plume is detected again in the same region (for the same quantity product), no new notification is generated (to avoid sending redundant information). An illustration of this two-step approach of the EUNADICS-AV multi-sensor EWS is presented in Fig. 21.
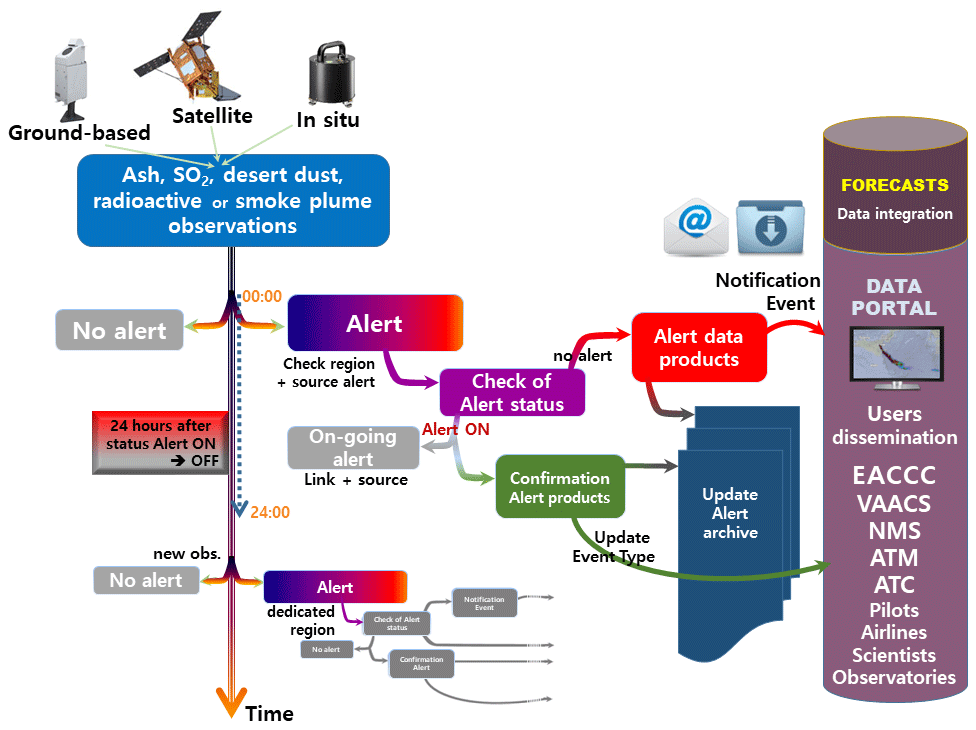
Table 5Overview of EUNADICS-AV alert products from ground-based (GB), satellite (SAT) and in situ (IS) instruments. DOAS: differential optical absorption spectroscopy. OPGC: Observatoire de Physique du Globe de Clermont-Ferrand. S5P: Sentinel-5 Precursor. TIR: thermal infrared.
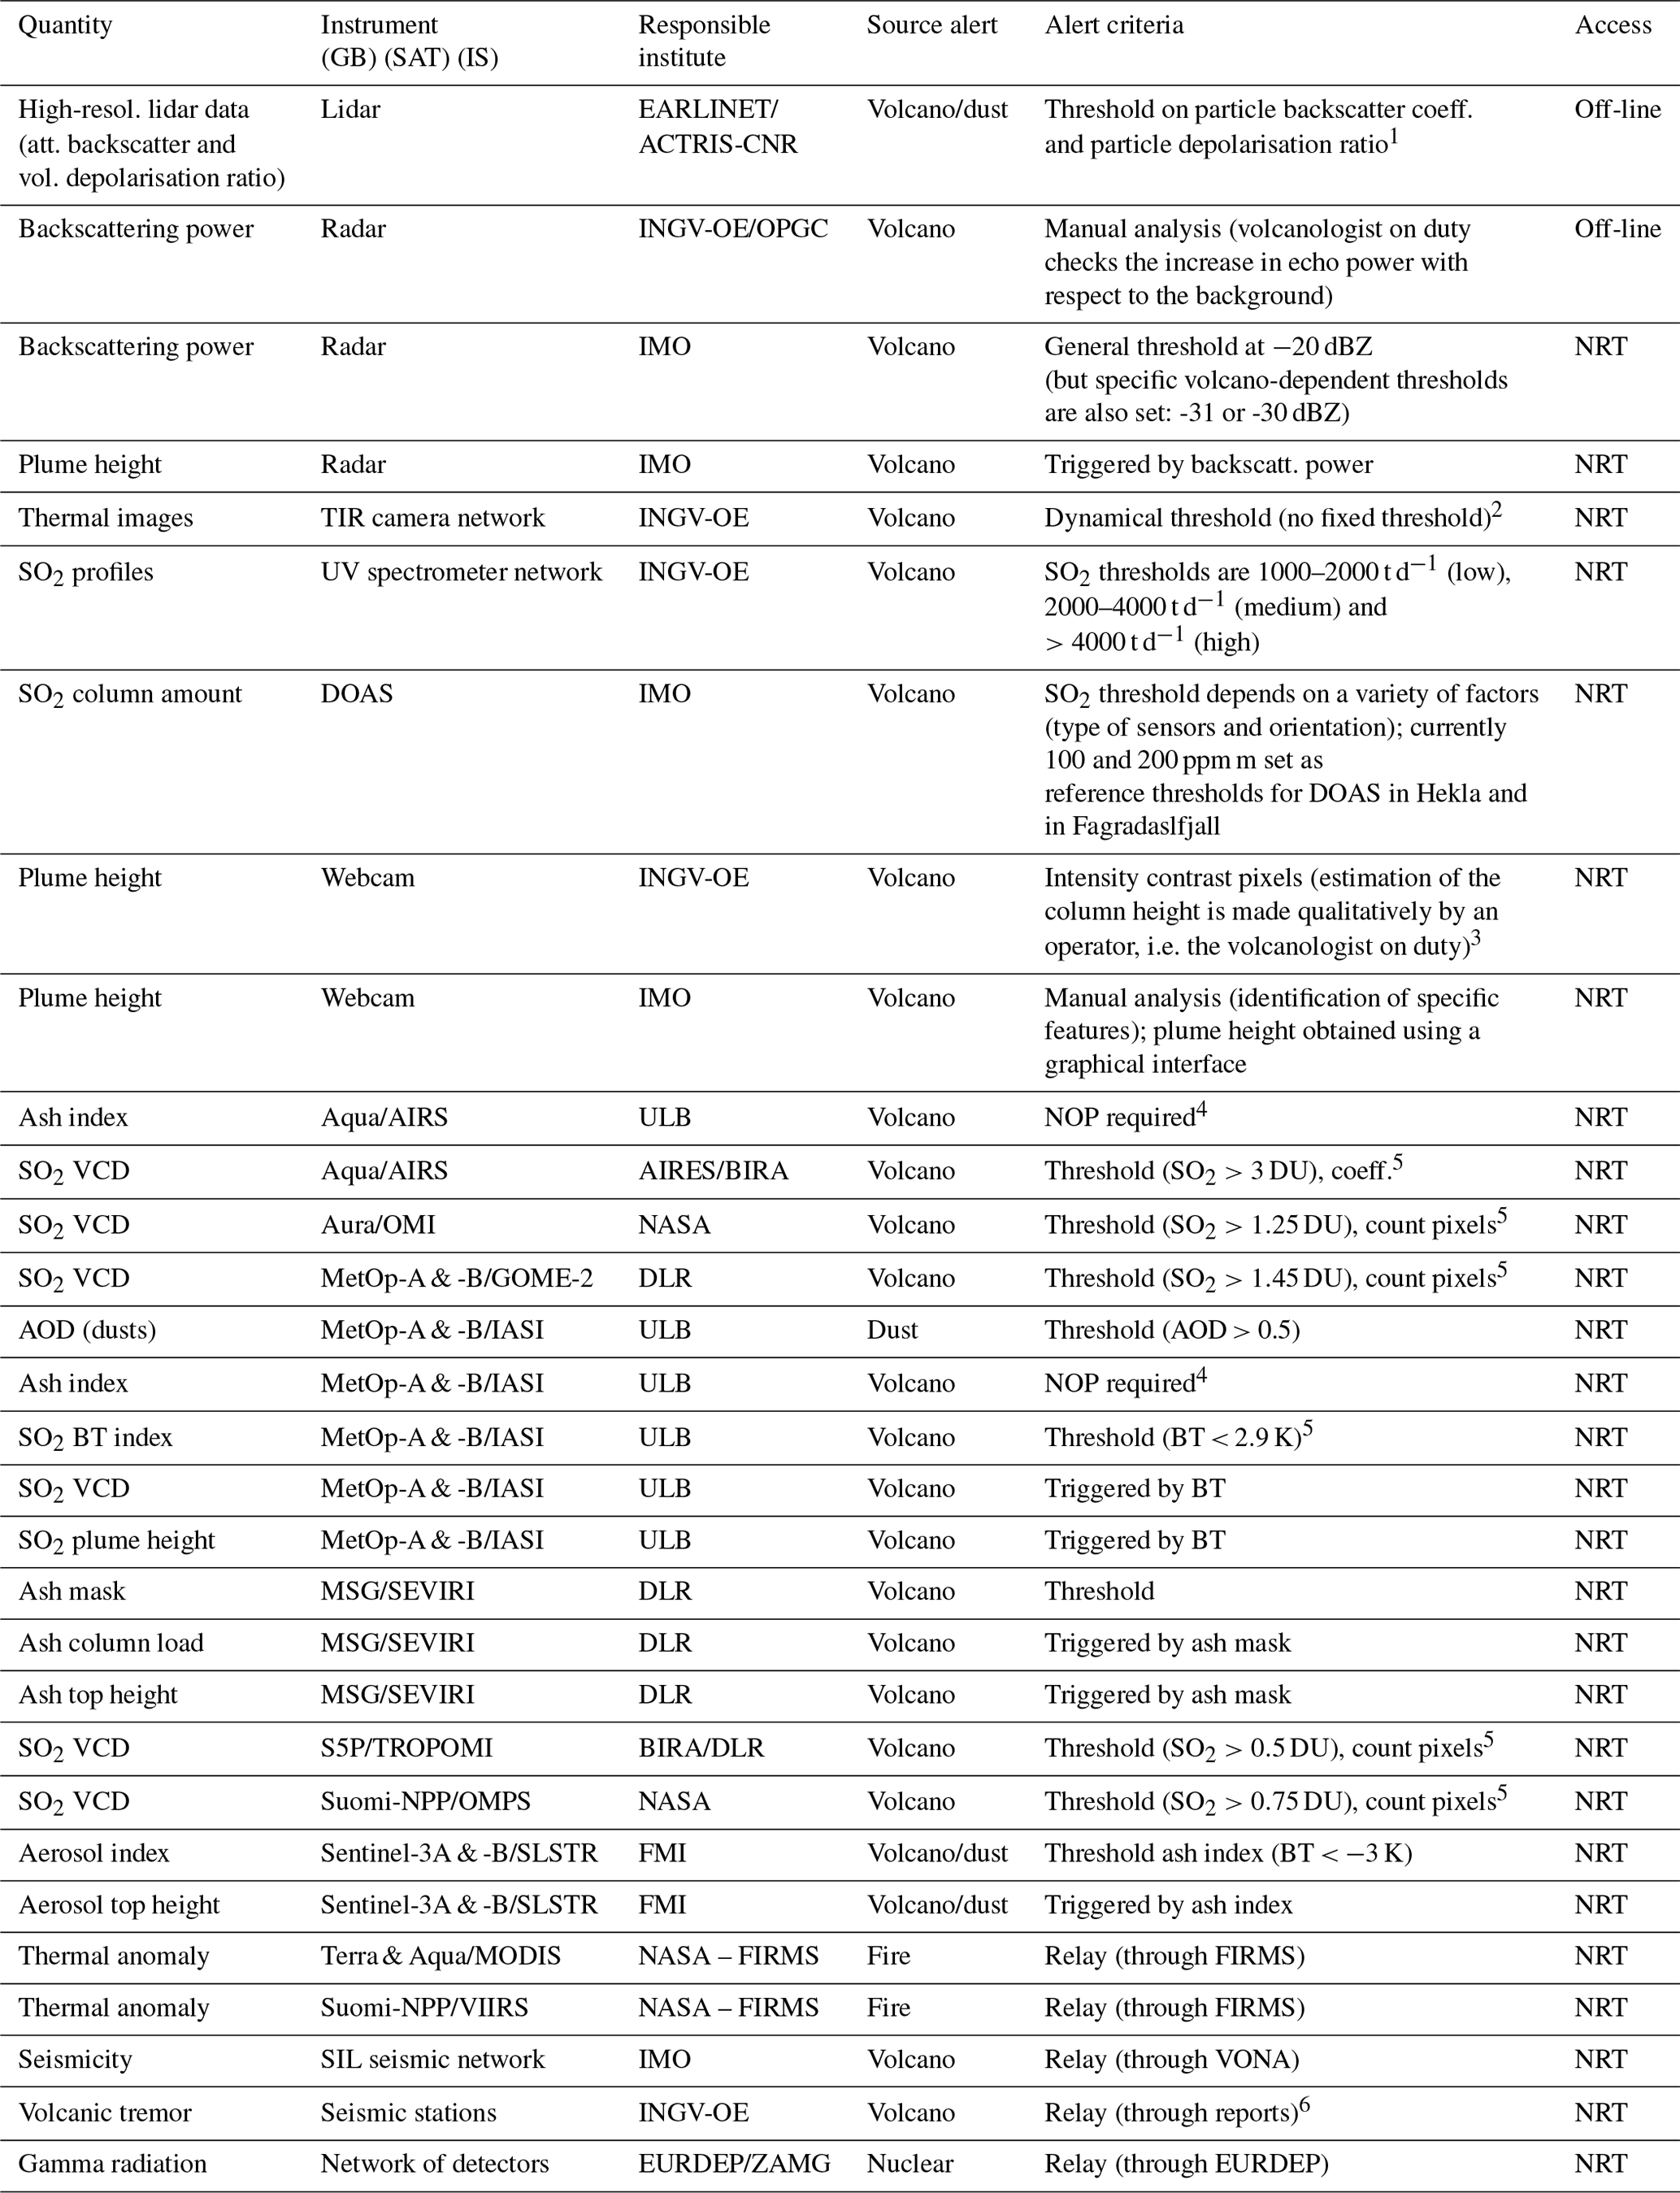
1 See Papagiannopoulos et al. (2020) for more details. 2 See Behncke et al. (2009) for more details. 3 The uncertainty due to a different operator is less than 2 % (Scollo et al., 2019). 3 The uncertainty in the column height is instead ±0.5 km (see Scollo et al., 2014, 2019). 4 Number of medium or high LOC (level of confidence) pixels in the area in the threshold radius; see Brenot et al. (2014) for more details. 5 See Brenot et al. (2014) for more details. 6 Reports are sent to the Italian Civil Protection during the volcanic crisis and available at the INGV-OE website (https://www.ct.ingv.it/index.php/monitoraggio-e-sorveglianza/prodotti-del-monitoraggio/comunicati-attivita-vulcanica, last access: 5 November 2021); see D'Agostino et al. (2013) for more details about the alert of volcanic tremor based on RMS amplitude.
The description of the successive processes, related to the first (definition of alert) and the second step (combination of all data and avoidance of redundant information), is the following:
-
The first step is the analysis of the data using the alert criteria defined in Table 5. This takes place as soon as the EWS harvests new observations. After the detection of airborne emission (from a natural hazard or a nuclear source) and the start of an event, there are potentially multiple warnings generated by the system. For this reason, it has been decided to consider a set of world regions of 30∘ by 30∘ plus two polar regions poleward of 75∘ in latitude. Each region is associated with a name/number for a total of 62 regions (see Fig. 9 of Brenot et al., 2014). As soon as a notification is issued, the related region is flagged as “ON”.
-
The second step is to check the “warning status” of this region. If there is no ongoing notification for this region (meaning no notification for the last 24 h), the warning status can possibly become ON. The system compares the time of observations with the processing time. If there is a delay of less than 8 h, a notification is issued. Then, alert data products are created and archived. If the “warning status” is already ON (i.e. ongoing event determined using existing pool of active alert pixels; see Sect. 4.1.4), no notification is issued, but an update of the event is noted in the alert data archive.
This set-up allows for providing timely information to the users and also to avoid issuing too many notifications (maximum one notification per region per 24 h).
When an alert is issued by the system, the first step is to check whether this represents a new event (start of natural airborne hazard – SNH) or it is linked (LNK) to an ongoing event. At this stage, a characterisation of the source of the hazard can be obtained (a) directly from the alerting process (e.g. the name and the height of the plume of a volcanic eruption, as provided by a VONA message, or the name and location of a nuclear plant facing an incident) or (b) by the “mother alert”. In fact, if the new alert is linked to a previous event (i.e. proximity of the new alert pixels with previous alert pixels of an ongoing event), the source of the hazard can be transferred. To obtain the LNK status, a proximity, in space and time (between new alert pixels and previous ones), is required to link two alerts together; see the description of alert products in Sect. 4. The proximity setting is specific to each type of event (volcano, dust, smoke or nuclear) and the observational technique of each instrument. Generally, the distance criteria range between 500 to 1000 km (respectively, for a time threshold of 14 or 26 h). This depends on the mean revisiting time of each region, i.e. the frequency of observations for the same region. Note that sometimes the source cannot be determined and is considered “unknown”.
The EUNADICS-AV EWS is based on the detection of volcanic ash/SO2, sand/dust storms, smoke plumes and nuclear accidents. If new alert pixels drive the start of a new event (SNH status), our EWS creates a log file and an internal specific notification. This triggers the sending of an email to stakeholders or public users (currently only in the case of volcanic hazards) or simply the sending of an email to the management of the EUNADICS-AV EWS (prototype status/check). A notification is associated with the creation of a dedicated web page related to the event. If a new alert is linked to an ongoing event, a confirmation of an alert is established with the creation of new mass, alert products and an update to the alert web page (see Sect. 4.6.2). A new detection of alert pixels (status SNH or LNK) is associated with the implementation of an event, which includes the reference number (date of the first alert) associated with alert products and links to quicklooks from EARLINET, E-PROFILE or other observations from the volcano observatories. The collection of netCDF alert data products (NCAP files) and the associated data directory of an event type (ASH, SO2, DST, SMO or NUC, respectively, for ash, SO2, dust, smoke and radionuclide clouds) is created, with the objective of triggering dispersion model. Access to EUNADICS-AV partners and key users is assured via FTP or HTTPS (Hypertext Transfer Protocol Secure) connection.
4.6 Alert products
For each alert/event issued by the EUNADICS-AV EWS, the associated event type is created/updated, and the alert archive is completed. Figure 22 shows the three kinds of alerting production related to an event.
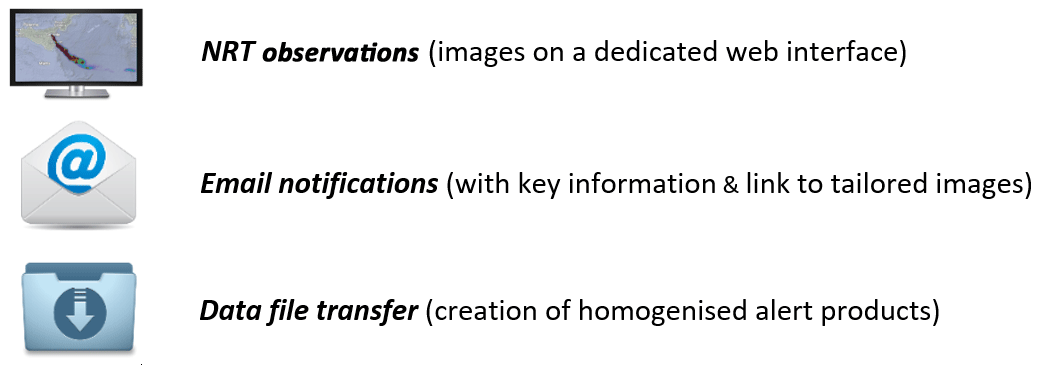
Figure 22Overview of the three types of alert products developed by the EUNADICS-AV EWS.
The diagram in Fig. 1 shows the links between the blocs of activities of EUNADICS-AV, and the red arrows characterise the specific EWS processing chain (see also Fig. 20), from observation retrievals, data harvesting and triggering with the implementation of alerts to the delivery of alert data products for modelling integration and ATM stakeholders.
4.6.1 NRT observations
NRT observations (from satellite, ground-based and in situ platforms/instruments are provided by EUNADICS-AV partners, external data sources or agreements; see Tables 2 and 3). A prototype data portal has been implemented in a demonstration phase of the EUNADICS-AV project (see the exercise study of Hirtl et al., 2020a). In the case of a future operationalisation of EUNADICS-AV activity for TRL (technology readiness level; see H2020, Annex G of the General Annexes) of 5 and higher, i.e. system prototype validation and demonstration in operational environment, all the NRT observations will be visible on the EUNADICS-AV data portal.
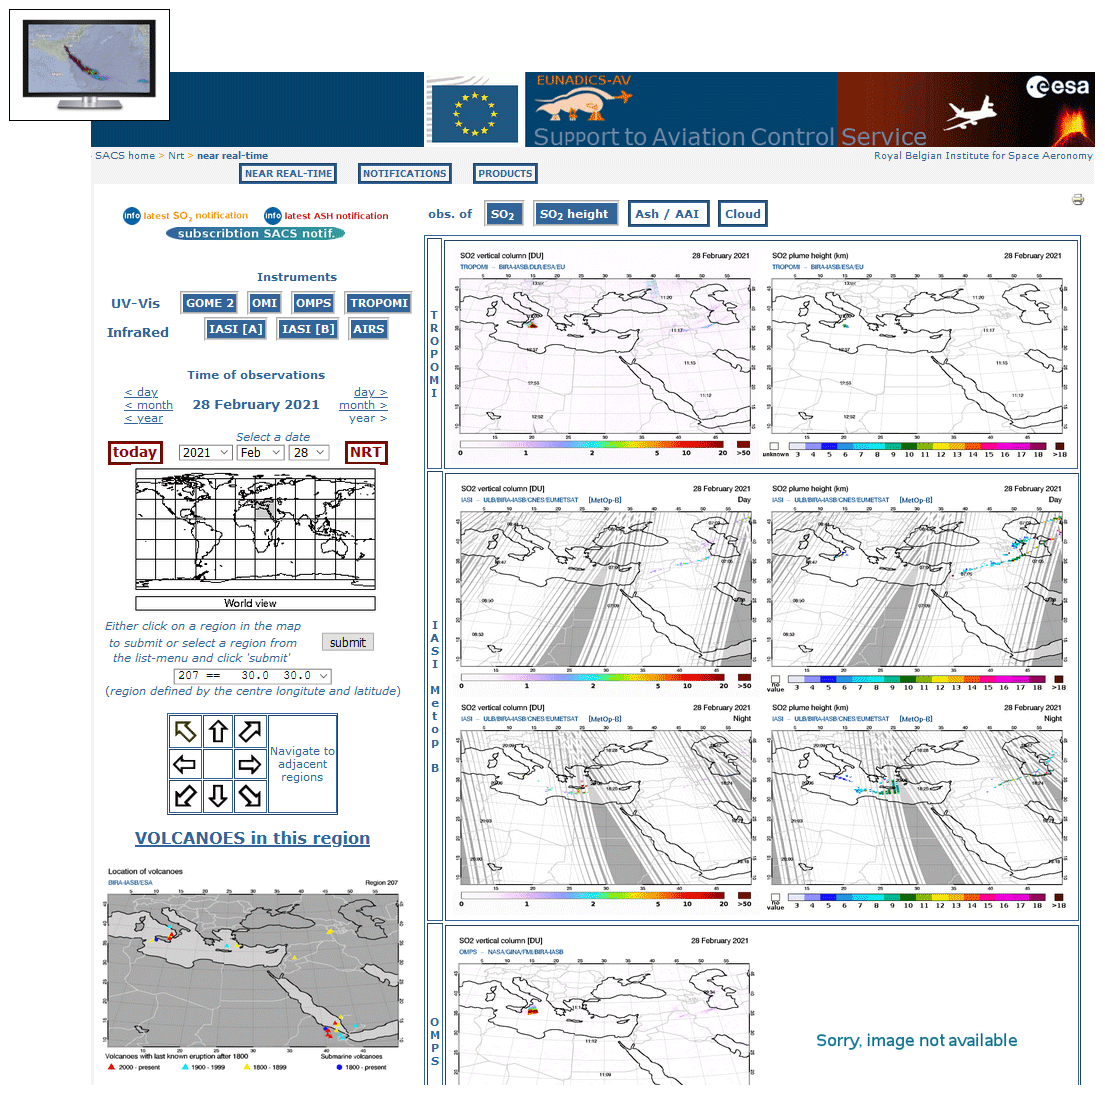
Figure 23NRT observations on 28 February 2021 during a paroxysm of Etna. Snapshot from the SACS web interface (https://sacs.aeronomie.be/nrt/index.php?Year=2021&Month=02&Day=28, last access: 5 November 2021).
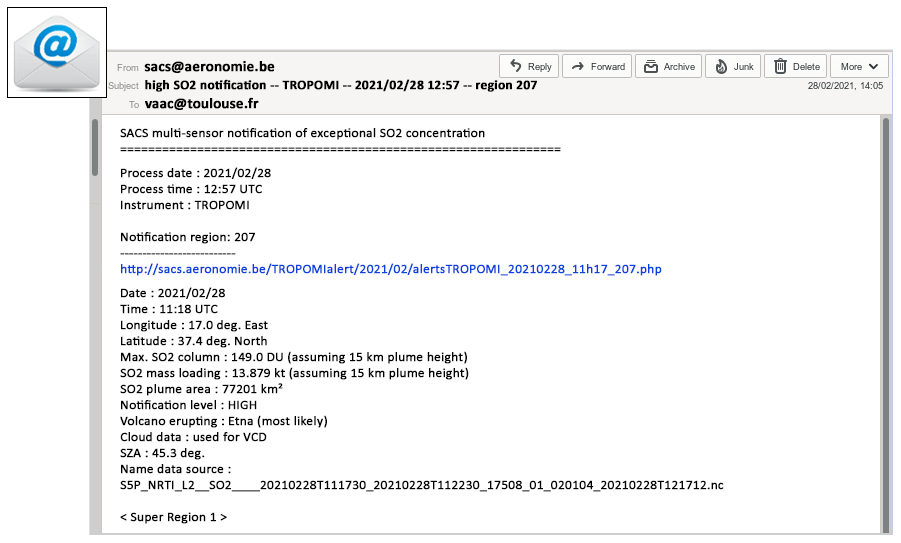
Figure 24TROPOMI notification after a paroxysm from Etna on 28 February 2021. A link to an alert web page is provided (http://sacs.aeronomie.be/TROPOMIalert/2021/02/alertsTROPOMI_20210228_11h17_207.php, last access: 5 November 2021).
The routine data products, based on NRT products from eight satellite hyperspectral sensors (i.e. OMI, OMPS, GOME-2B, GOME-2C and TROPOMI in the UV–vis and AIRS, IASI-A and IASI-B in the IR range), related to the detection of volcanic eruptions, sandstorms or smoke from wildfires and can be consulted and monitored through the EUNADICS-AV–SACS web interface. The currently operational SACS website (https://sacs.aeronomie.be, last access: 5 November 2021) is a self-contained system that allows for the visualisation of NRT satellite data and provides alerts to subscribed users in the case of the detection of elevated amounts or concentration of volcanic emissions. Within the EUNADICS-AV project, the development of a new SACS interface has started. This work in progress is based on modern visualisation methods and the handling of geophysical data. It is currently in the development phase and allows for monitoring user-selected satellite sensors and products in the form of zoomable/pannable maps, using GeoTiff, GeoServer and Web Map Service (WMS) facilities for serving geographical data. At the moment, all NRT observations linked to the EUNADICS-AV EWS rely on the current SACS web interface. Figure 23 shows NRT observations of a volcanic cloud from an eruption (paroxysm at Etna on 28 February 2021). Note that currently the NRT images from GOME-2 correspond to GOME-2B images for SO2 and cloud cover and to composite images of GOME-2B and GOME-2C for the aerosol absorbing index (AAI) images.
4.6.2 Email notifications
Currently email notifications from the EUNADICS-AV EWS for public or governmental users take only place after volcanic and radionuclide cloud hazard detection. Data products are collected by the EUNADICS-AV data harvesting facility and transferred in NRT for analysis by our EWS. The automated EWS not only applies specific mechanisms to issue selective detection (extension of the SACS system to other kinds of alerts and instruments) but also takes into account inputs from existing systems, like NASA FIRMS, VONA messages and EURDEP/EMERCON messages. In the case of the detection of a natural airborne hazard in a specific SACS region (see Sect. 4.5), a notification is sent internally to EUNADICS-AV partners (one notification per affected region). In the case of detection of an exceptional SO2/ash concentration, a notification is sent to stakeholders (email) with relevant information (e.g. time, position and highest value detected) and a link to a dedicated web page (see Fig. 24). The SACS system currently has about 300 users (from the VAACs, NMS, scientific institutions, airlines, pilots, other ATM institutions and other public users).
On this web page, images of volcano observations (e.g. ash, SO2 vertical column and SO2 layer height if available for the instrument in alert) are shown. Additional links to other images are provided (i.e. links to an interpolated plot and Google Earth file), as illustrated in Fig. 25 after a paroxysm at Etna on 28 February 2021. This TROPOMI SO2 notification contains information about the time of observations, the lat and long position and the value (in DU) of the highest-alert pixel detected (in the dedicated SACS region), the SO2 mass loading (in kt) of the data granule used to issue the alert, the size of SO2 plume area (in km2), the notification level (LOW or HIGH), the name of the most likely volcano source of emission (if identified), information about the use of cloud data in SO2 vertical column density (VCD), the solar zenith angle (SZA in ∘; high SZA values are filtered by our system, as they can show artefact SO2 VCD values), and the name of the alert data product (SO2 NCAP files) created by the EUNADICS-AV EWS (see Sect. 4.6.3). More details about the notification information can be find in Sect. 4.6.3, in particular the definition of the completed plume considered, the notification level and the characterisation of the source. Note that if two SACS regions are affected by an eruption, the SO2 mass can be provided in two successive SO2 notifications related to two different regions (however the “regional” maximum values are different). Figure 25 shows an illustration of the tailored visualisation (of an SO2 alert from TROPOMI) available from the alert web page created by the EUNADICS-AV EWS. The link to this web page is provided in the email SO2 notification (Fig. 24).
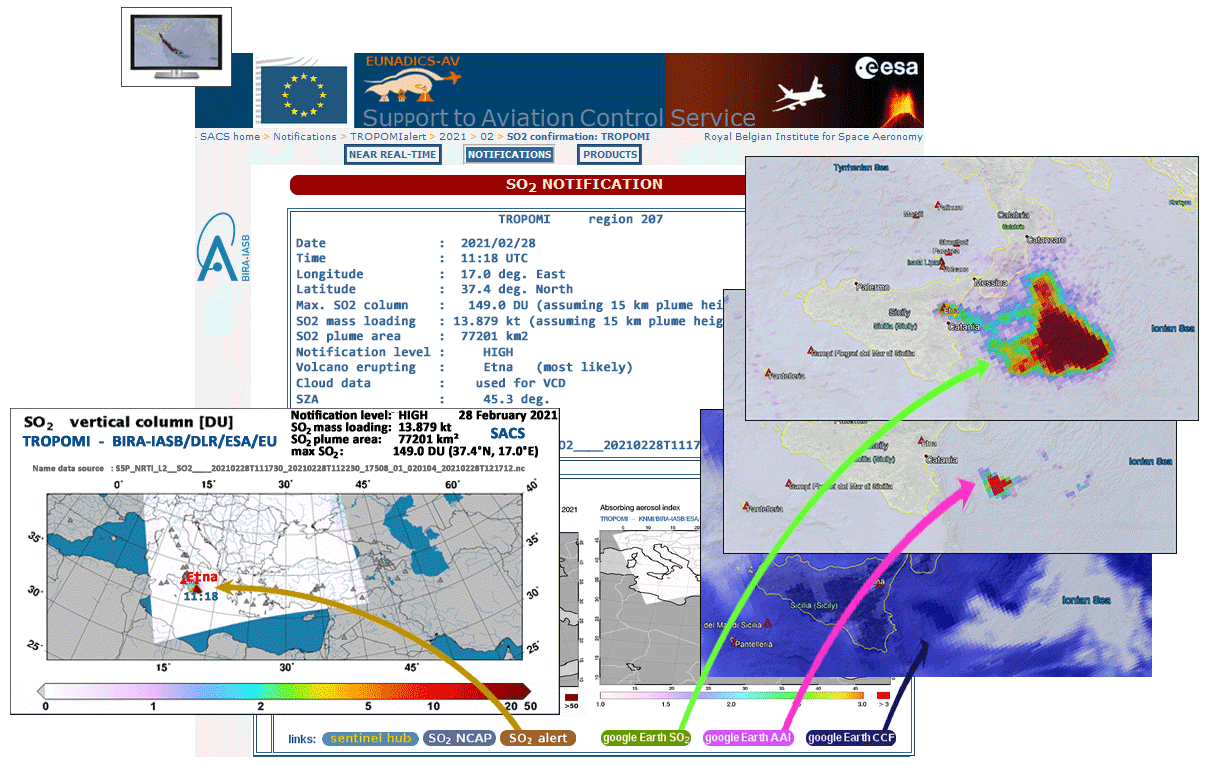
Figure 25Example of an alert web page with illustration of visualisations offered for a paroxysm at Etna on 28 February 2021, i.e. notification information, SO2 alert image, SO2, aerosol absorbing index (AAI) and cloud cover fraction (CCF) © Google Earth images.
Notification information is also shown on this page. A link to a tailored SO2 alert image is provided. This image contains key information (in the legend) and shows the SO2 images with the time of alert (near the maximum value) and the name/position of the identified volcano source (shown by a red triangle). There links to Google Earth images (SO2, AAI and CCF) are indicated. We can see precisely the SO2 plume, the possible ash aerosol and the cloud cover situation. This last piece of information about the cloud cover is essential to know if the SO2 observation is optimal. Indeed, the vertical SO2 columns measured by UV–vis satellite sounders only consider the SO2 amount above the cloud and underestimate the possible concentration inside or under the cloud (see the limitations presented by Brenot et al., 2014). It is also important to mention the role of the cloud in the AAI estimates. Kooreman et al. (2020) revealed that several structural features can be distinguished in the TROPOMI AAI (i.e. cloud bow, viewing zenith angle dependence, sunglint, and unexplained increase in AAI values at extreme viewing and solar geometries). In the case study shown in Fig. 25, the high AAI values are not due to the sunglint effect. We can see that the delimitation of the AAI cloud corresponds precisely to the occurrence of high CCF values (the Google Earth facility is quite convenient for this kind of investigation). This leads us to think that the ash cloud (observed by AAI in clear-sky conditions and highlighted in Fig. 25) is probably not observed under the cloud/aerosol structure (area shown with high CCF). The AAI pattern observed here probably reduces the real size of the ash cloud at a low altitude (under the cloud cover). Note that the sunglint effect is systematically flagged (and avoided) in the NRT TROPOMI AAI images available from SACS website. However, the AAI Google Earth images do not use this flag. This is a way to see the whole scene (eventually not only with artefact AAI high values but also with natural airborne aerosol observations dismissed by the sunglint flag).
If a nuclear accident takes place, the EUNADICS-AV EWS sends a notification to authorities (restricted dissemination of the information). An example of an EMERCON message is shown in Sect. 4.3 (Fig. 18).
4.6.3 Data file transfer
The data integration in dispersion models is essential in the resilience and the decision-making process after a crisis in aviation related to airborne hazards. It is also critical for the ATM stakeholders to receive homogenised and easy-to-read data to have a fast and clear view of the scene during such a crisis (Bolić and Sivčev, 2011, 2012). This is why one of EUNADICS-AV objectives was the implementation of alert data products (with metadata, key information about the alert, flags and gridded data), allowing for a good dissemination of information.
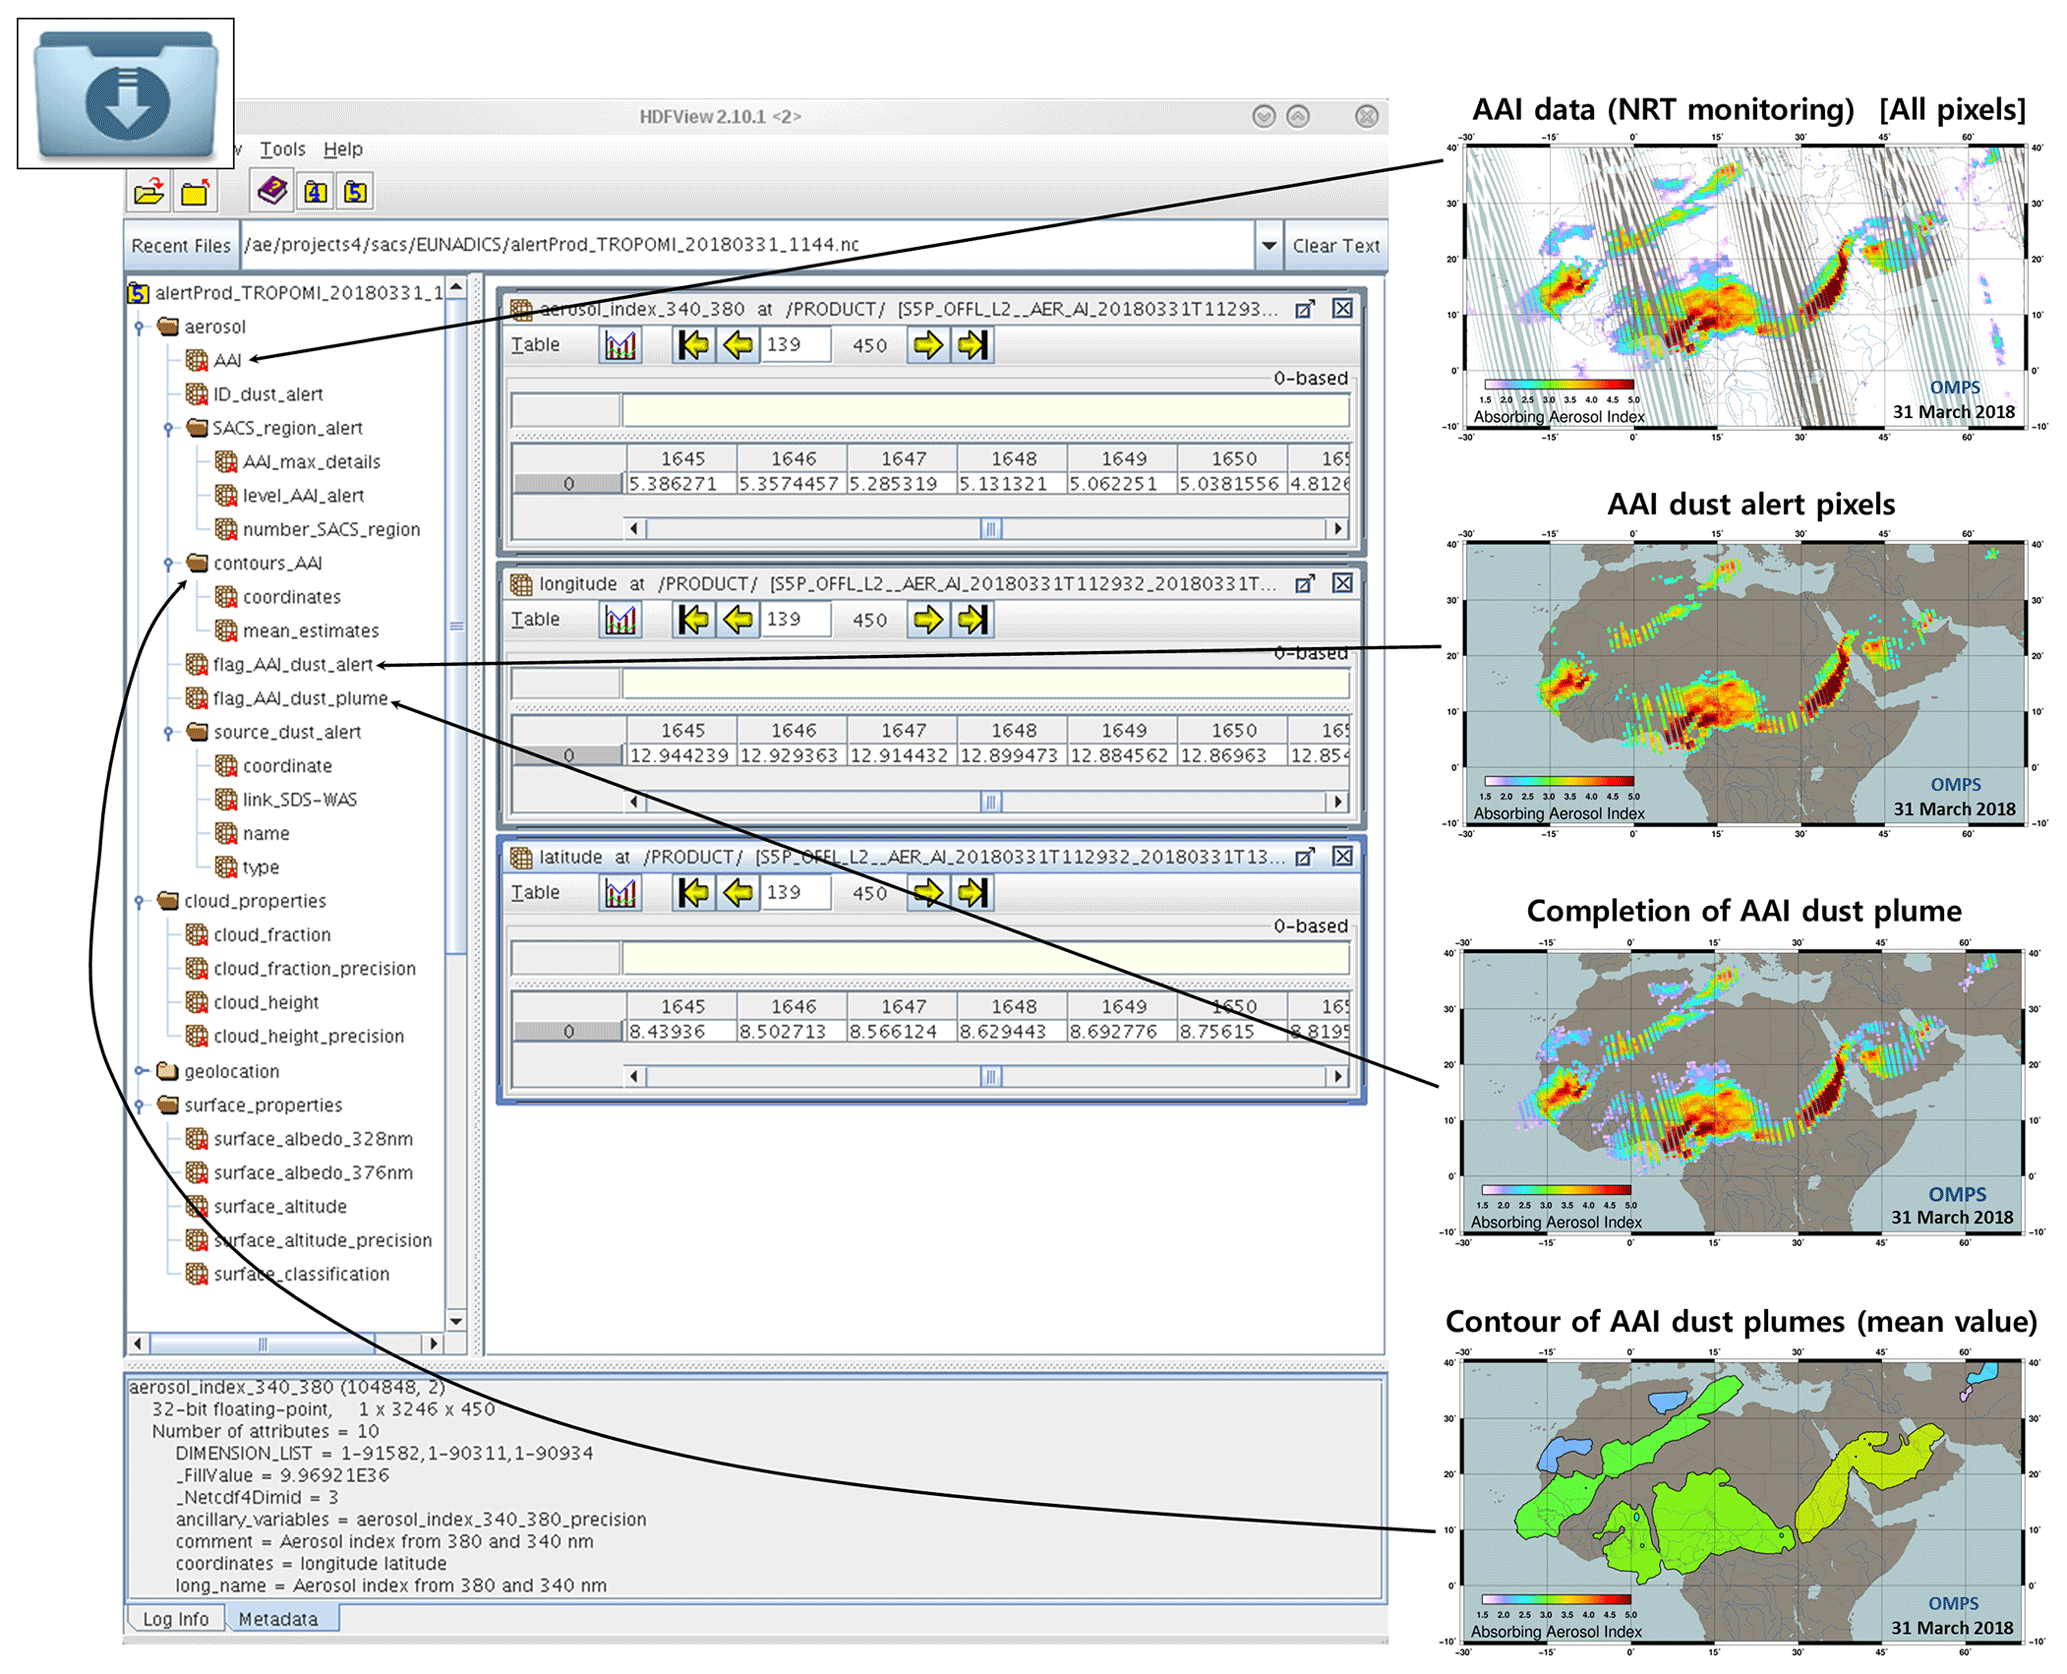
Figure 26Illustration about the content of a netCDF alert product (NCAP files) related to the Saharan sandstorm detection from OMPS on 31 March 2018.
The data file transfer established by the EUNADICS-AV EWS consists of the creation of alert products in a homogenised, standardised format (netCDF), so-called NCAP files. The netCDF format has been chosen because this is a very common and convenient format (easy access), with relevant metadata information for users. A routine alert product is implemented using a Python script that handle data collection, alerting and database maintenance functions.
The content of the alert products is the following:
-
data (all pixels from satellite, ground-based or in situ products),
-
tailored products:
-
alert pixels (position, values/columns densities/index and height),
-
level of severity (LOW and HIGH),
-
extended plume of hazard (completion of the hazardous plume),
-
surface and mass loading,
-
gridded data,
-
contours (surface, mean, maximum and mass),
-
information about the source, SACS region and maximum values,
-
traceability and tracking of event (START → END),
-
links (SACS images, SACS notification and quicklooks from EU or regional network).
-
More details about the description of the content of the NCAP files is presented in Appendix A.
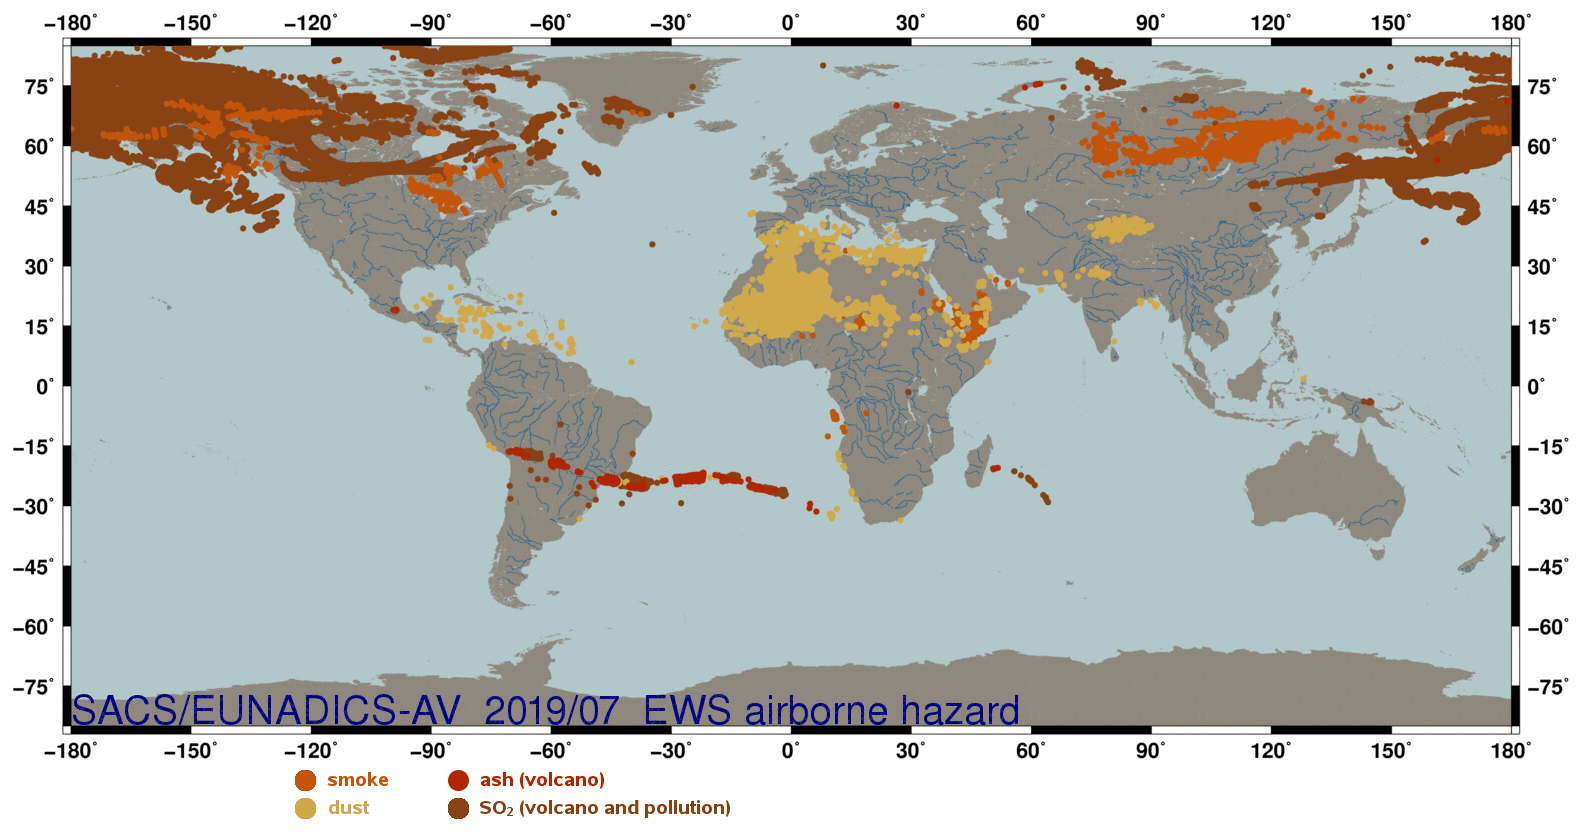
Figure 27Selective detections of natural airborne hazards from the EUNADICS-AV EWS in July 2019 (Raikoke and Ubinas volcanic eruption, dust storms in the Sahara and Gobi deserts, and forest fires in Russia and Canada). Please note that the date format in this figure is yyyy/mm.
Figure 26 illustrates an example of a NCAP file (dust from OMPS). A snapshot of an overview of a NCAP file using the HDFView (Hierarchical Data Format) tool is shown. Arrows in black show the associated data field with images (all pixels, dust alert pixels, extended dust cloud and the contours identified with mean values). See Sect. 4.1.4 for more details about this triggered detection of dust using the OMPS AAI product. The inventory of the NCAP implementation in the EUNADICS-AV EWS is presented in Table 6.
Table 6Inventory of selective detection and alerting products (NCAP files).
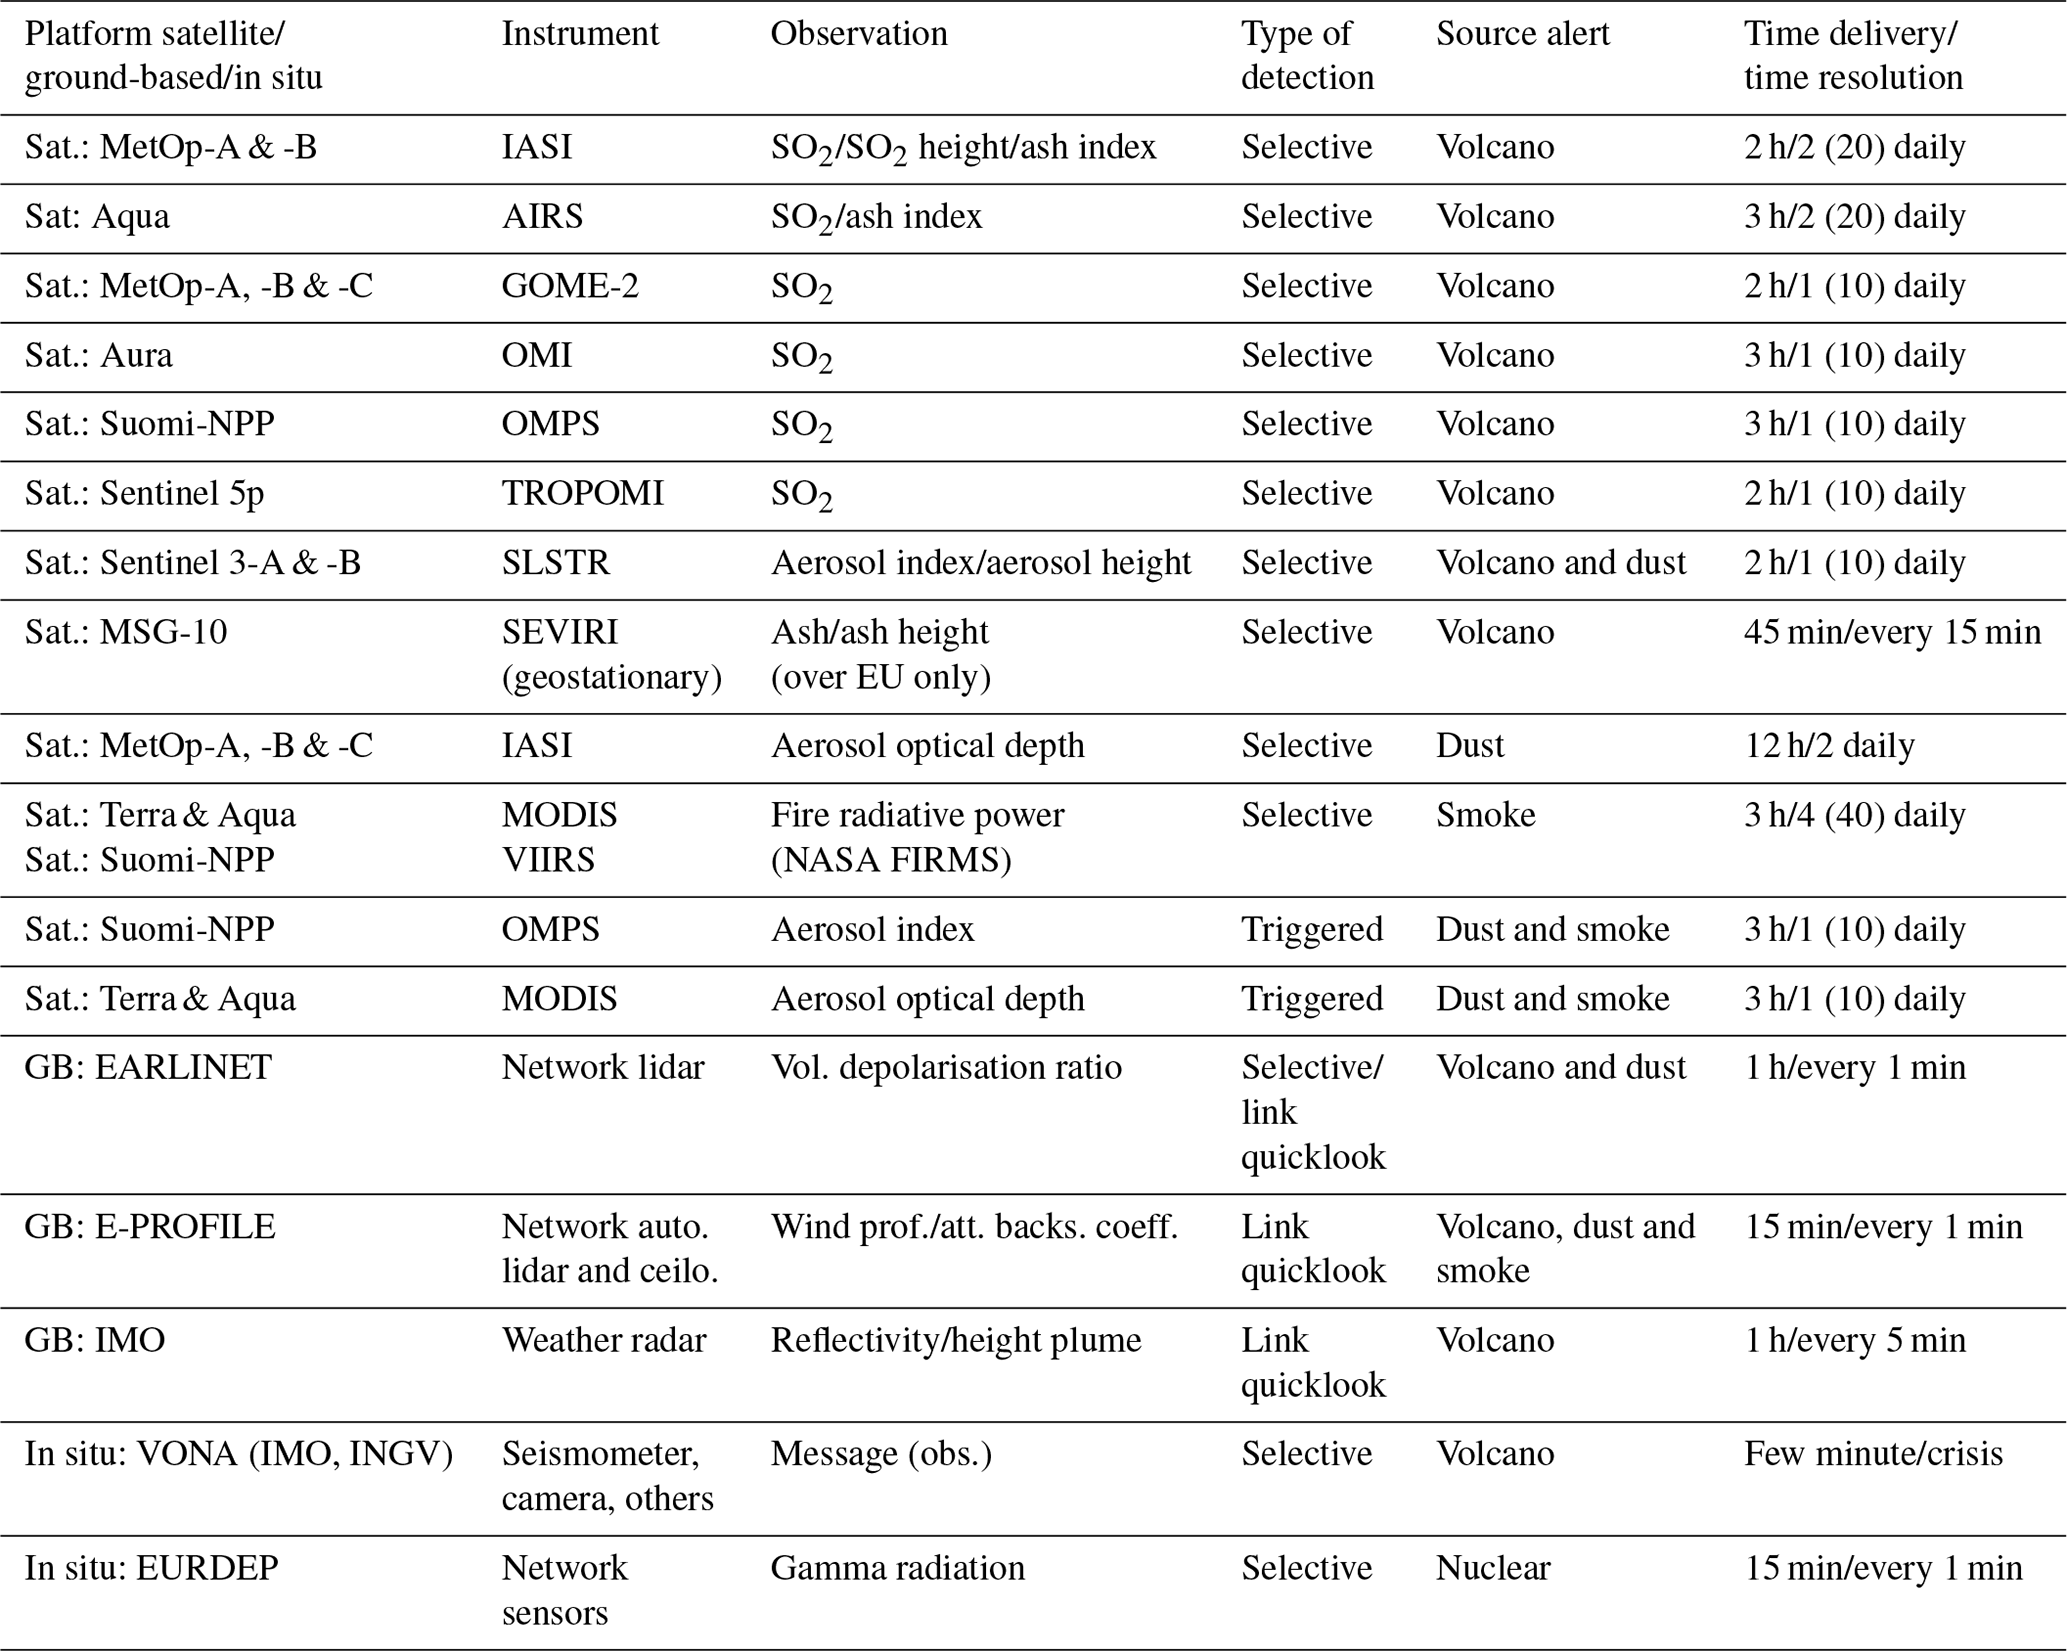
Public access to NCAP files is currently possible via a link in SACS notifications (related to volcanic activity only); https://sacs.aeronomie.be/alert/SO2_202102241052_202102281322_LNK_TROPOMI.nc (last access: 5 November 2021) is the link to the NCAP file provided in the alert web page (Fig. 25) of the notification (Fig. 24) result of the paroxysm at Etna on 28 February 2021. Access to other EUNADICS-AV NCAP data based is currently restricted to key stakeholders, i.e. VAACs, MWOs, volcano observatories and research collaborators.
Within the system definition and design of the EUNADICS-AV EWS, a review of system requirements has been considered (see Sect. 2). As part of our EWS, an assessment of the NRT capability of the system has been undertaken for all products implemented in the EUNADICS-AV system (monitoring and alerting production from satellite and ground-based instruments related to the detection and situational awareness of natural hazards, i.e. sandstorms, volcanic eruption and wildfires). The performance of the alerting approach developed within the EWS is illustrated in Fig. 27 (month of July 2019). For 4 months in 2019 (May to August; only July is shown; see additional materials for the 3 other months), the selective detections of airborne hazards are schematically depicted in the form of maps (one for each month). Each detection is represented by a colour-coded dot (smoke, dust, ash and SO2). A number of events can easily be identified: the eruptions of Raikoke (Russia), Ulawun (Papua New Guinea) and Ubinas (Peru); wildfires in Canada, Amazonia and Russia; and desert dust plumes (every month).
EUNADICS-AV is supporting SESAR (Single European Sky ATM Research; https://www.sesarju.eu, last access: 5 November 2021). The development, verification and validation of products and its EWS were designed with the goal of potential future deployment. EUNADICS-AV passed maturity phase V1, and we can now target maturity phase V2 with regard to the seven-phase concept as introduced by the European Operational Concept Validation Methodology (E-OCVM, 2010). Tests with human factors, safety, business, environmental and standards cases are still required for EUNADICS-AV products to reach maturity phase V2 and show the feasibility of the EUNADICS-AV prototype service, according to E-OCVM. The EUNADICS-AV EWS has developed some work of validation of the alert products (TRL 4), as shown in Fig. 27. A validation of the global concept of EUNADICS-AV and its potential benefits has also been demonstrated during the EUNADICS-AV exercise (Hirtl et al., 2020a), showing the benefits in a limited framework.
The development achieved in the EUNADICS-AV EWS shows the significant interest in using selective detection of natural airborne hazards from polar-orbiting satellites. The combination of several sensors inside a single global system demonstrates the advantage of using a triggered approach to obtain selective detection from observations, which cannot initially discriminate the different aerosol types. Satellite products from hyperspectral UV and IR sensors (e.g. TROPOMI, IASI and SEVIRI) and retrievals from ground-based networks (e.g. EARLINET, E-PROFILE and the regional network from volcano observatories) are combined by our system to create tailored alert products (e.g. selective ash detection, SO2 column and plume height, dust clouds and smoke from wildfires), with identification and traceability of extreme events.
To conclude, the EUNADICS-AV EWS has developed new tailored alert products for aviation, i.e. NRT observations, notifications and the implementation of netCDF alert data products (NCAP files). The EUNADICS-AV EWS achievements include the following:
-
the improvement of NRT discrimination between volcanic ash and other aerosols (dust or smoke) or meteorological clouds;
-
NRT retrievals of plume height (ash and SO2);
-
NRT retrievals of volcanic-ash mass loadings with use of SEVIRI on board a geostationary platform;
-
the use of polar-orbiting NRT measurements with high spatial resolution (under 10 km);
-
the use of key measurements from the ground-based network, in particular lidars and ceilometers measurements, as well as near-source parameters from volcano observatories.
Only one aspect of EUNADICS-AV related to our early warning system is presented in this study. The better characterisation of the source obtained by the EUNADICS-AV EWS is complementary and beneficial for other developments of the EUNADICS-AV consortium. With a demonstration exercise, Hirtl et al. (2020a) shows the usefulness of using the EUNADICS-AV system in the route optimisation of European airspace during a volcanic eruption of Etna. The EUNADICS-AV utility for assimilation, forecasting and inverse modelling and the characterisation and the impact of the source term in dispersion modelling are presented by Hirtl et al. (2020b) and the two recently submitted studies from Plu et al. (2021a, b).
The EUNADICS-AV consortium will now target an operationalisation of its activity with the objective of completing TRL 5 (validation in a relevant environment) and TRL 6 (demonstration in a relevant environment) in the framework of SESAR H2020. The EUNADICS-AV EWS passes with success the performance verification in a limited environment (TRL 4). Concerning future plans with regard to natural airborne hazards, collaborations are ongoing not only with key stakeholders in charge of implementing data integration in dispersion model and providing advisories for aviation (i.e. VAACs and NMS) but also in collaboration with WMO SDS-WAS, in the frame of the inDUST (International Network to Encourage the Use of Monitoring and Forecasting Dust Products) COST (European Cooperation in Science and Technology) action (https://cost-indust.eu, last access: 5 November 2021) with the use of EUNADICS-AV dust alert products. The functionality of the EUNADICS-AV EWS is also currently evolving thanks to Engage KTN (Knowledge Transfer Network) catalyst funding (https://engagektn.com/cf-summaries, last access: 5 November 2021). The bridge between EUNADICS-AV development and SWIM (System-Wide Information Management) has started. Indeed, the registry of OPAS (operational alert product for ATM via SWIM) as Yellow Profile SWIM, i.e. as a notification service of volcanic SO2 height, has been active since January 2021 (see https://eur-registry.swim.aero/services, last access: 5 November 2021). SO2 layer height from TROPOMI is now available in SACS monitoring system, with notifications. A validation of this new product (from BIRA) is a work in progress (Hyman and Pavolonis, 2020; Corradini et al., 2020; Hedelt et al., 2019). In addition, the development of the EUNADICS-AV EWS is also used and contributes to the recent SESAR H2020 project, which has the objective of upgrading the EUNADICS-AV prototype EWS with other hazards to aviation. In addition to natural airborne hazards (volcanoes, dust and smoke), the ALARM project (multi-hAzard monitoring and earLy wARning system; https://alarm-project.eu, last access: 5 November 2021) plans to develop early warning and NCAP files with respect to space weather, severe weather and environmental hotspots with risk to aviation. This new activity of the EUNADICS-AV–ALARM EWS might join the ARISTOTLE consortium basis (All Risk Integrated System TOwards Trans-boundary hoListic Early-warning; http://aristotle.ingv.it, last access: 5 November 2021) in the future.
Concerning the operationalisation of EUNADICS-AV with regard to nuclear accidents, a European network of experts, called the Ring of Five (Ro5), will also be approached so that their mailing distribution system is used whenever one of the Ro5 laboratories detect something anomalous in their measurement networks. Although in this case, unlike with the EURDEP data, the data will not be harmonised, they can be used as a triggering system or, at least, as an awareness system potentially for such events for which the gamma dose rate monitoring may not provide useful information (for very far-away sources or radionuclides that are pure beta emitters, for instance). We can clearly see the interest of the EUNADICS-AV consortium in proceeding with a future relay of radiological data (gamma dose rate and radionuclide concentrations in ground-level air), creating early warnings using homogenised critical dataset and being used to trigger data assimilation/inverse modelling for source term estimates.
All the data pixels provided in a NCAP file correspond to all the data information relevant for data integration (for example from IASI and TROPOMI satellite sensors information about the uncertainty of measurements is provided; e.g. SO2 VCD for eight altitudes from IASI and the averaging kernel from TROPOMI; see Clarisse et al., 2011, 2012, 2014; Theys et al., 2017, 2019). For the lidar data, all the data observations correspond to the backscattered coefficient of the whole profile (the same for the alert is a flag value along the profile with low-, medium- and high-alert status). For the radionuclide data, it corresponds to all the gamma radiation data from the EURDEP network.
Regarding the level of severity (LOW and HIGH), for an SO2 alert the HIGH level is obtained if the mass loading is over 5 kt. For other satellite alerts, we have defined the level of severity considering the area affected by alert pixels (if this area is over 100 000 km2, this brings a HIGH level). For EARLINET, the criterion is based on the number of high-alert pixels. If this number is over 10, the level is HIGH. The criterion for the level of severity is an arbitrary choice of our system, which can be easily changed if we find this is not appropriate. For example for the SO2, email notifications are only sent if the level of severity/notification is HIGH. Initially, we choose a threshold of 10 kt (for a plume high altitude assumed at 15 km). This threshold has been moved to 5 kt. For a nuclear incident, if an EMERCON message is sent, this is automatically HIGH; there is no LOW level.
The extended plume of a hazard is determined by using a lower threshold applied for the neighbouring pixels of an alert (see Sect. 4.1.4). For example, if the threshold of an SO2 alert for a sensor is 2 DU. We can extend the plume with the neighbouring pixels with lower SO2 values (e.g. up to 0.5 DU). Details of the plume extension is provided in the metadata.
Regarding the information of source of an airborne hazard, for gamma radiation, this information is generally provided in the EMERCON message. For alerts related to volcanic activity, VONA messages are ingested by the EUNADICS-AV EWS and used for determining the name of the erupting volcano, the source of the detected volcanic emission. We also use information from the Volcano Discovery (https://www.volcanodiscovery.com, last access: 5 November 2021) and MIROVA systems (Middle InfraRed Observation of Volcanic Activity; https://www.mirovaweb.it, last access: 5 November 2021) to highlight the activity of worldwide volcanoes. If there is no active volcano provided by VONA messages (or other system) close to a volcanic plume detected, our system tries to determine if there is a most likely candidate volcano which can be identified as the source of the emission. If the ID (identity) of a source is successful (60 % of the highest values are located close to the same volcano), our NCAP file provides all the information about this volcano, i.e. its name, latitude, longitude, elevation, type (e.g. stratovolcano), country and rock (e.g. basaltic/andesite basaltic). This information comes from the Global Volcanism Program (GVP; https://volcano.si.edu, last access: 5 November 2021), and a link to GVP web page of the identified volcano is provided in the NCAP file. The ID of the source is sometimes wrong (generally when the plume is far from the source), and we still need to investigate this aspect to avoid ID errors as much as possible. The use of a constellation of several satellites is a way to avoid this problem. Indeed, the pool of active alert pixels is defined by a volcano ID and should be able to keep the good ID, even for a plume detected far from its source (what we call the traceability of an event, in time and space). For other natural hazards, we plan to use information about the nature of the neighbouring ground using ESA CCI (Climate Change Initiative) land cover information. This is not yet considered by the EUNADICS-AV EWS.
In the case of an ongoing airborne hazard event affecting European airspace, the EUNADICS-AV EWS creates a link to quicklook images in the NCAP files (e.g. links to E-PROFILE, with quicklooks of aerosol, cloud and wind observations from the network of automatic lidars and ceilometers; see Sect. 4.2 for more details about the available observations from EU and regional ground-based networks).
The generic name of a netCDF alert product (NCAP files) is the following: XXX_YYYYMMDDHHMM_yyyymmddhhmm_ ZZZ_SENSOR.nc.
Here are some examples of names:
SO2_201105221029_201105221152_SNH_ GOME2-A.nc
SO2_201105221029_201105231810_LNK_ GOME2-A.nc
SO2_201105221029_201105292344_END_ GOME2-A.nc.
XXX (three digits) refers to the parameter used for issuing an alert:
-
SO2 for volcanic SO2 (based on SO2 column),
-
ASH for volcanic ash (based on ash index or column),
-
DST for desert dust (based on AOD, AAI or attenuated backscattered coefficient),
-
SMO for smoke from forest fire and biomass burning (based on AOD or AAI),
-
NUC for gamma radiation from a radionuclide cloud (based on gamma dose rate).
YYYYMMDDHHMM (12 digits; year month day hour minute) refers to the UTC time of the first alert (maximum values) detected for an event.
yyyymmddhhmm (12 digits; year month day hour minute) refers to the processing time (UTC) of this alert product.
ZZZ (three digits) is the code of the natural airborne hazard of this event type and alert product:
-
SNH is the start of a natural hazard.
-
LNK is an alert product linked to a previous SNH alert product.
-
END is an alert product ending an event (file is empty; this is issued if no more alert products are linked 26 h after the last LNK products).
SENSOR (from 3 to 11 digits) refers to the name of sensors (or ground-based network) used for issuing the alert:
-
GOME2-B,
-
GOME2-C,
-
IASI-A,
-
IASI-B,
-
IASI-C,
-
OMI,
-
OMPS,
-
AIRS,
-
TROPOMI,
-
SLSTR-A,
-
SLSTR-B,
-
SEVIRI,
-
MODIS Aqua,
-
MODIS Terra,
-
EARLINET,
-
EURDEP.
-
Case 1: Ophelia event of 15–17 October 2017 (http://sacs.aeronomie.be/EUNADICS/NCAP_201710_Ophelia.zip, last access: 5 November 2021).
Case 1 is an illustration of the so-called Ophelia event. During the 15–17 October 2017 period, Hurricane Ophelia in the Atlantic Ocean entrained Saharan dust and smoke particles (from Portuguese fires) over large parts of Europe leading to unusual visibility conditions. This event had implications on aviation (several flights were cancelled).
Products:
-
IASI-A: AOD and dust flag (provided by ULB),
-
OMPS: AAI (provided by NASA),
-
VIIRS/MODIS FIRMS flag (provided by NASA).
-
-
Case 2: Eyjafjallajökull eruption of 13 May 2010 (http://sacs.aeronomie.be/EUNADICS/NCAP_201005_Eyjafjallajokull.zip, last access: 5 November 2021).
Case 2 gives an example of satellite products for the 2010 Icelandic eruption of Eyjafjallajökull. Unusual meteorological conditions brought volcanic-ash clouds over Europe, causing enormous disruption to air traffic across western and northern Europe. The transport of ash can be visualised using geostationary satellite products.
Product:
-
SEVIRI: ash column (provided by DLR).
-
-
Case 3: Grímsvötn eruption of 23 May 2011 (http://sacs.aeronomie.be/EUNADICS/NCAP_201105_Grimsvotn.zip, last access: 5 November 2021).
Case 3 gives an example of satellite products for the 2011 Icelandic eruption of Grímsvötn with SO2 and volcanic ash emitted at different heights. The transport of SO2 and ash can be visualised using a suite of satellite products.
Products:
-
IASI-A: SO2 column and ash index (provided by ULB and BIRA),
-
AIRS: SO2 column and ash index (provided by BIRA, AIRES and ULB).
-
-
Case 4: Raikoke eruption of 22–26 June 2019 (http://sacs.aeronomie.be/EUNADICS/NCAP_201906_Raikoke.zip, last access: 5 November 2021).
Case 4 is for the Raikoke volcano (Russia) that erupted explosively on 21 June 2019 and emitted copious amounts of SO2 and ash in the upper troposphere and lower stratosphere. Many instruments could detect SO2 and ash from Raikoke.
Products:
-
IASI-B: SO2 column and ash index (provided by ULB and BIRA),
-
AIRS: SO2 column and ash index (provided by BIRA and ULB),
-
TROPOMI: SO2 column (provided by BIRA),
-
SLSTR-A and SLSTR-B: ash index and ash height (provided by FMI).
-
-
Case 5: Desert dust storm of 21–22 March 2018 (http://sacs.aeronomie.be/EUNADICS/NCAP_201906_Raikoke.zip, last access: 5 November 2021).
Case 5 illustrates a strong desert dust storm that lead to the closure of Heraklion International Airport in Crete, Greece, on 22 March 2018.
Products:
-
EARLINET: EWS flag (provided by CNR),
-
IASI-A: AOD and dust flag (provided by ULB),
-
OMPS: AAI (provided by NASA).
-
A description of the data used by EUNADICS-AV EWS is presented in Tables 2, 3, 5 and 6. Some data are publicly available. Some data have restricted access, as mentioned in the Abstract and in Sect. 4.6.
The supplement related to this article is available online at: https://doi.org/10.5194/nhess-21-3367-2021-supplement.
HB and NT were responsible for conceptualisation, methodology, implementation and work coordination. HB, NT, LC, DH, SV, TV, AU, LB, MVN, PH and JdL performed satellite data processing. NP, LM, MMP, SB, MC, WM, SS, GS, DAA, TP, JL, RR, AH, MH and AA performed ground based data processing. FL, KS and HB established user requirements. HB, NT and JvG performed data analysis. HB prepared the original draft preparation, and all co-authors reviewed the final paper.
The authors declare that they have no conflict of interest.
Publisher's note: Copernicus Publications remains neutral with regard to jurisdictional claims in published maps and institutional affiliations.
This article is part of the special issue “Analysis and prediction of natural airborne aviation hazards”. It is not associated with a conference.
We thank Mike Pavolonis and the VOLCAT team for providing detailed information about the status of their early warning system related to volcanoes. We thank Ruslan Borodin for providing an illustration of a chart (radioactivity advisory based on conditional data), as provided by the Federal Environmental Emergency Response Centre (FEERC) of Russia.
This work has been conducted within the framework of the EUNADICS-AV project, which received funding from the European Union's Horizon 2020 research programme for societal challenges – Smart, Green and Integrated Transport – under grant agreement no. 723986.
This paper was edited by Matthias Themessl and reviewed by Tatjana Bolic and one anonymous referee.
AlKheder, S. and AlKandari, A.: The impact of dust on Kuwait International Airport operations: a case study, Int. J. Environ. Sci. Technol., 17, 3467–3474, https://doi.org/10.1007/s13762-020-02710-3, 2020.
Ansmann, A., Tesche, M., Seifert, P., Groß, S., Freudenthaler, V., Apituley, A., Wilson, K. M., Serikov, I., Linné, H., Heinold, B., Hiebsch, A., Schnell, F., Schmidt, J., Mattis, I., Wandinger, U., and Wiegner, M.: Ash and fine-mode particle mass profiles from EARLINET-AERONET observations over central Europe after the eruptions of the Eyjafjallajökull volcano in 2010, J. Geophys. Res., 116, D00U02, https://doi.org/10.1029/2010JD015567, 2011.
Ansmann, A., Ohneiser, K., Mamouri, R.-E., Knopf, D. A., Veselovskii, I., Baars, H., Engelmann, R., Foth, A., Jimenez, C., Seifert, P., and Barja, B.: Tropospheric and stratospheric wildfire smoke profiling with lidar: mass, surface area, CCN, and INP retrieval, Atmos. Chem. Phys., 21, 9779–9807, https://doi.org/10.5194/acp-21-9779-2021, 2021.
Arason, P., Petersen, G. N., and Bjornsson, H.: Observations of the altitude of the volcanic plume during the eruption of Eyjafjallajökull, April–May 2010, Earth Syst. Sci. Data, 3, 9–17, https://doi.org/10.5194/essd-3-9-2011, 2011.
Basart, S., Pérez, C., Nickovic, S., Cuevas, E., and Baldasano, J. M.: Development and evaluation of the BSC-DREAM8b dust regional model over Northern Africa, the Mediterranean and the Middle East, Tellus B, 64, 18539, https://doi.org/10.3402/tellusb.v64i0.18539, 2012.
Basart, S., Pérez García-Pando, C., Jorba, O., Benincasa, F., Olid, M., Serradell, K., Montanyé, G., and Werner, E.: Upgrading the MONARCH Operational Forecast: Deployment Protocol And Dust Emission Upgrades over NAMEE, Technical Report, BDRC-2020-001, Barcelona, 38 pp., available at: https://dust.aemet.es/about-us/monarch_upgrade_2020/view (last access: 5 November 2021), 2020.
Baxter, P. J., Bonadonna, C., Dupree, R., Hards, V. L., Kohn, S. C., Murphy, M. D., Nichols, A., Nicholson, R. A., Norton, G., Searl, A., Sparks, R. S. J., and Vickers, B. P.: Cristobalite in volcanic ash of the Soufriere Hills Volcano, Montserrat: Hazards implications, Science, 283, 1142–1145, https://doi.org/10.1136/oem.59.8.523, 1999.
Behncke, B., Falsaperla, S., and Pecora, E.: Complex magma dynamics at Mount Etna revealed by seismic, thermal, and volcanological data, J. Geophys. Res., 114, B03211, https://doi.org/10.1029/2008JB005882, 2009.
Benedetti, A., Morcrette, J.-J., Boucher, O., Dethof, A., Engelen, R. J., Fisher, M., Flentjes, H., Huneeus, N., Jones, L., Kaiser, J. W., Kinne, S., Mangold, A., Razinger, M., Simmons, A. J., Suttie, M., and the GEMS-AER team: Aerosol analysis and forecast in the ECMWF Integrated Forecast System. Part II: Data assimilation, J. Geophys. Res., 114, D13205, https://doi.org/10.1029/2008JD011115, 2009.
Bennett, B., Repacholi, M., and Carr, Z.: Health effects of the Chernobyl accident and special health care programmes, Report of the UN Chernobyl Forum Expert Group `Health', World Health Organization, Geneva, available at: https://dust.aemet.es/about-us/monarch_upgrade_2020/view (last access: 5 November 2021), 2006.
Bolić, T. and Sivčev, Ž.: Eruption of Eyjafjallajökull in Iceland: Experience of European air traffic management, Transport. Res. Rec., 2214, 136–143, 2011.
Bolić, T. and Sivčev, Z.: Air Traffic Management in Volcanic Ash Events in Europe: a Year After Eyjafjallajökull Eruption, No. 12-3009, in: Transportation Research Board 91st Annual Meeting, 22–26 January 2012, Washington, DC, USA, available at: https://trid.trb.org/view/1130074 (last access: 12 June 2020), 2012.
Brenot, H., Theys, N., Clarisse, L., van Geffen, J., van Gent, J., Van Roozendael, M., van der A, R., Hurtmans, D., Coheur, P.-F., Clerbaux, C., Valks, P., Hedelt, P., Prata, F., Rasson, O., Sievers, K., and Zehner, C.: Support to Aviation Control Service (SACS): an online service for near-real-time satellite monitoring of volcanic plumes, Nat. Hazards Earth Syst. Sci., 14, 1099–1123, https://doi.org/10.5194/nhess-14-1099-2014, 2014.
Bugliaro, L., Piontek, D., Kox, S., Schmidl, M., Mayer, B., Müller, R., Vázquez-Navarro, M., Peters, D. M., Grainger, R. G., Gasteiger, J., and Kar, J.: Combining radiative transfer calculations and a neural network for the remote sensing of volcanic ash using MSG/SEVIRI, Nat. Hazards Earth Syst. Sci. Discuss. [preprint], https://doi.org/10.5194/nhess-2021-270, in review, 2021.
Casadevall, T. J.: The 1989/1990 eruption of Redoubt Volcano Alaska: impacts on aircraft operations, J. Volcanol. Geoth. Res., 62, 301–316, https://doi.org/10.1016/0377-0273(94)90038-8, 1994.
Casadevall, T. J., Delos Reyes, P. J., and Schneider, D. J.: The 1991 Pinatubo eruptions and their effects on aircraft operations, in: Fire and mud: eruptions and lahars of Mount Pinatubo, Philippines, edited by: Newhall, C. G. and Punongbayan, R. S., Philippines Institute of Volcanology and Seismology, Quezon City, University of Washington Press, Seattle, 625–636, 1996.
Christian, K., Yorks, J., and Das, S.: Differences in the Evolution of Pyrocumulonimbus and Volcanic Stratospheric Plumes as Observed by CATS and CALIOP Space-Based Lidars, Atmosphere, 11, 1035, https://doi.org/10.3390/atmos11101035, 2020.
Clarisse, L., Coheur, P. F., Prata, A. J., Hurtmans, D., Razavi, A., Phulpin, T., Hadji-Lazaro, J., and Clerbaux, C.: Tracking and quantifying volcanic SO2 with IASI, the September 2007 eruption at Jebel at Tair, Atmos. Chem. Phys., 8, 7723–7734, https://doi.org/10.5194/acp-8-7723-2008, 2008.
Clarisse, L., Prata, F., Lacour, J.-L., Hurtmans, D., Clerbaux, C., and Coheur, P.-F.: A correlation method for volcanic ash detection using hyperspectral infrared measurements, Geophys. Res. Lett., 37, L19806, https://doi.org/10.1029/2010GL044828, 2010.
Clarisse, L., Coheur, P.-F., Chefdeville, S., Lacour, J. L., Hurtmans, D., and Clerbaux, C.: Infrared satellite observations of hydrogen sulfide in the volcanic plume of the August 2008 Kasatochi eruption, Geophys. Res. Lett., 398, L10804, https://doi.org/10.1029/2011GL047402, 2011.
Clarisse, L., Hurtmans, D., Clerbaux, C., Hadji-Lazaro, J., Ngadi, Y., and Coheur, P.-F.: Retrieval of sulphur dioxide from the infrared atmospheric sounding interferometer (IASI), Atmos. Meas. Tech., 5, 581–594, https://doi.org/10.5194/amt-5-581-2012, 2012.
Clarisse, L., Coheur, P.-F., Prata, F., Hadji-Lazaro, J., Hurtmans, D., and Clerbaux, C.: A unified approach to infrared aerosol remote sensing and type specification, Atmos. Chem. Phys., 13, 2195–2221, https://doi.org/10.5194/acp-13-2195-2013, 2013.
Clarisse, L., Coheur, P.-F., Theys, N., Hurtmans, D., and Clerbaux, C.: The 2011 Nabro eruption, a SO2 plume height analysis using IASI measurements, Atmos. Chem. Phys., 14, 3095–3111, https://doi.org/10.5194/acp-14-3095-2014, 2014.
Clarisse, L., Clerbaux, C., Franco, B., Hadji-Lazaro, J., Whitburn, S., Kopp, A. K., Hurtmans, D., and Coheur, P.-F.: A decadal data set of global atmospheric dust retrieved from IASI satellite measurements, J. Geophys. Res.-Atmos., 124, 1618–1647, https://doi.org/10.1029/2018JD029701, 2019.
Clarkson, R. J., Majewicz, E. J. E., and Mack, P.: A re-evaluation of the 2010 quantitative understanding of the effects volcanic ash has on gas turbine engines, P. I. Mech. Eng. G-J. Aer., 230, 2274–2291, https://doi.org/10.1177/0954410015623372, 2016.
Clerbaux, C., Boynard, A., Clarisse, L., George, M., Hadji-Lazaro, J., Herbin, H., Hurtmans, D., Pommier, M., Razavi, A., Turquety, S., Wespes, C., and Coheur, P.-F.: Monitoring of atmospheric composition using the thermal infrared IASI/MetOp sounder, Atmos. Chem. Phys., 9, 6041–6054, https://doi.org/10.5194/acp-9-6041-2009, 2009.
Colarco, P. R., da Silva, A., Chin, M., and Diehl, T.: Online simulations of global aerosol distributions in the NASA GEOS-4 model and comparisons to satellite and ground-based aerosol optical depth, J. Geophys. Res., 115, D14207, https://doi.org/10.1029/2009JD012820, 2010.
COM 670: Communication from the Commission to the Council and the European Parliament, setting up an Aviation Safety Management System for Europe, available at: https://ec.europa.eu/transparency/regdoc/rep/1/2011/EN/1-2011-670-EN-F1-1.pdf (last access: 5 November 2021), 2011.
Corradini, S., Guerrieri, L., Stelitano, D., Salerno, G., Scollo, S., Merucci, L., Prestifilippo, M., Musacchio, M., Silvestri, M., Lombardo, V., and Caltabiano, T.: Near Real-Time Monitoring of the Christmas 2018 Etna Eruption Using SEVIRI and Products Validation, Remote Sens., 12, 1336, https://doi.org/10.3390/rs12081336, 2020.
Csiszar, I., Schroeder, W., Giglio, L., Ellicott, E., Vadrevu, K. P., Justice, C. O., and Wind, B.: Active fires from the Suomi NPP Visible Infrared Imaging Radiometer Suite: Product status and first evaluation results, J. Geophys. Res.-Atmos., 119, 803–816, https://doi.org/10.1002/2013JD020453, 2014.
D'Agostino, M., Di Grazia, G., Ferrari, F., Langer, H., Messina, A., Reitano, D., and Spampinato, S.: Volcano Monitoring and Early Warning on MT Etna, Sicily based on Volcanic Tremor – Methods and Technical Aspects, in: chap. 4, book “Complex Monitoring of Volcanic Activity”, edited by: Zobin, V. M., Nova Science Publishers, New York, ISBN 978-1-62417-985-3, 2013.
D'Amico, G., Amodeo, A., Baars, H., Binietoglou, I., Freudenthaler, V., Mattis, I., Wandinger, U., and Pappalardo, G.: EARLINET Single Calculus Chain – overview on methodology and strategy, Atmos. Meas. Tech., 8, 4891–4916, https://doi.org/10.5194/amt-8-4891-2015, 2015.
de Laat, A., Vazquez-Navarro, M., Theys, N., and Stammes, P.: Analysis of properties of the 19 February 2018 volcanic eruption of Mount Sinabung in S5P/TROPOMI and Himawari-8 satellite data, Nat. Hazards Earth Syst. Sci., 20, 1203–1217, https://doi.org/10.5194/nhess-20-1203-2020, 2020.
Easdale, M. H. and Bruzzone, O.: Spatial distribution of volcanic ash deposits of 2011 Puyehue-Cordón Caulle eruption in Patagonia as measured by a perturbation in NDVI temporal dynamics, J. Volcanol. Geoth. Res., 353, 11–17, https://doi.org/10.1016/j.jvolgeores.2018.01.020, 2018.
EFFIS: User Guide 1.0: User Guide for EFFIS Current Situation and Fire History applications, available at: http://effis.jrc.ec.europa.eu/reports-and-publications/effis-related-publications (last access: 5 November 2021), 2018.
E-OCVM: Volume I – version 3, available at: https://www.eurocontrol.int/sites/default/files/2019-08/e-ocvm-version-3.0-volume-1.pdf (last access: 30 March 2021), 2010.
ESA: VAST user requirements document, version 0.4, available at: http://vast.nilu.no/media/documents/2013/09/03/nilu-esa-vast-urd-v0.4.pdf (last access: 5 November 2021), 2013.
Evangeliou, N. and Eckhardt, S.: Uncovering transport, deposition and impact of radionuclides released after the early spring 2020 wildfires in the Chernobyl Exclusion Zone, Sci. Rep., 10, 10655, https://doi.org/10.1038/s41598-020-67620-3, 2020.
FEERC: Guidance material on the dissemination of information on accidental release of radioactive material into the atmosphere, available at: http://aviamettelecom.ru/upload/docs/20191111_instruction_583.pdf (last access: 30 March 2021), 2019.
Forbes, L., Jarvis, D., Potts, J., and Baxter, P. J.: Volcanic ash and respiratory symptoms in children on the island of Montserrat, British West Indies, Occup. Environ. Med., 60, 207–211, 2003.
Fowler, C. T.: Human Health Impacts of Forest Fires in the Southern United States: A Literature Review, J. Ecol. Anthropol., 7, 39–63, 2003.
Giglio, L., Randerson, J. T., and van der Werf, G. R.: Analysis of daily, monthly, and annual burned area using the fourth-generation global fire emissions database (GFED4) J. Geophys. Res.-Biogeo., 118, 317–328, https://doi.org/10.1002/jgrg.20042, 2013.
Graf, K., Kox, S., Schmidl, M., and Gasteiner, J.: the VADUGS algorithm, Volcanic Ash Detection using Geostationary Satellites, in: WMO Intercomparison Workshop, 29 June–2 July 2015, Madison, Wisconsin, USA, available at http://cimss.ssec.wisc.edu/meetings/vol_ash15/PDFs/20150630/Item2.10_20150630_WMO_Madison_Graf.pdf (last access: 30 March 2021), 2015.
Guffanti, M., Casadevall, T. J., and Budding, K.: Encounters of aircraft with volcanic ash clouds: A compilation of known incidents, 1953–2009, US Geological Data Series 545, ver. 1.0, p. 12, plus 4 appendixes including the compliation database, Technical Report, available at: http://pubs.usgs.gov/ds/545 (last access: 5 November 2021), 2010.
Haefele, A., Hervo, M., Turp, M., Lampin, J.-L., Haeffelin, M., and Lehmann, V.: The E-PROFILE network for the operational measurement of wind and aerosol profiles over Europe, in: Proceeding of TECO, Madrid, Spain, available at: https://www.eumetnet.eu/wp-content/uploads/2016/10/E-PROFILE_TECO_Madrid_2016.pdf (last access: 30 March 2021), 2016.
Hansell, A. L., Horwell, C. J., and Oppenheimer, C.: The health hazards of volcanoes and geothermal areas, Occup. Environ. Med., 63, 149–156, https://doi.org/10.1136/oem.2005.022459, 2006.
Haustein, K., Pérez, C., Baldasano, J. M., Jorba, O., Basart, S., Miller, R. L., Janjic, Z., Black, T., Nickovic, S., Todd, M. C., Washington, R., Müller, D., Tesche, M., Weinzierl, B., Esselborn, M., and Schladitz, A.: Atmospheric dust modeling from meso to global scales with the online NMMB/BSC-Dust model – Part 2: Experimental campaigns in Northern Africa, Atmos. Chem. Phys., 12, 2933–2958, https://doi.org/10.5194/acp-12-2933-2012, 2012.
Hedelt, P., Efremenko, D. S., Loyola, D. G., Spurr, R., and Clarisse, L.: Sulfur dioxide layer height retrieval from Sentinel-5 Precursor/TROPOMI using FP_ILM, Atmos. Meas. Tech., 12, 5503–5517, https://doi.org/10.5194/amt-12-5503-2019, 2019.
Hernández-Ceballos, M. A., Sangiorgi, M., García-Puerta, B., Montero, M., and Trueba, C.: Dispersion and ground deposition of radioactive material according to airflow patterns for enhancing the preparedness to N/R emergencies, J. Environ. Radioact., 216, 106178, https://doi.org/10.1016/j.jenvrad.2020.106178, 2020.
Hirtl, M., Arnold, D., Baro, R., Brenot, H., Coltelli, M., Eschbacher, K., Hard-Stremayer, H., Lipok, F., Maurer, C., Meinhard, D., Mona, L., Mulder, M. D., Papagiannopoulos, N., Pernsteiner, M., Plu, M., Robertson, L., Rokitansky, C.-H., Scherllin-Pirscher, B., Sievers, K., Sofiev, M., Som de Cerff, W., Steinheimer, M., Stuefer, M., Theys, N., Uppstu, A., Wagenaar, S., Winkler, R., Wotawa, G., Zobl, F., and Zopp, R.: A volcanic-hazard demonstration exercise to assess and mitigate the impacts of volcanic ash clouds on civil and military aviation, Nat. Hazards Earth Syst. Sci., 20, 1719–1739, https://doi.org/10.5194/nhess-20-1719-2020, 2020a.
Hirtl, M., Scherllin-Pirscher, B., Stuefer, M., Arnold, D., Baro, R., Maurer, C., and Mulder, M. D.: Extension of the WRF-Chem volcanic emission preprocessor to integrate complex source terms and evaluation for different emission scenarios of the Grimsvötn 2011 eruption, Nat. Hazards Earth Syst. Sci., 20, 3099–3115, https://doi.org/10.5194/nhess-20-3099-2020, 2020b.
Hyman, D. M. and Pavolonis, M. J.: Probabilistic retrieval of volcanic SO2 layer height and partial column density using the Cross-track Infrared Sounder (CrIS), Atmos. Meas. Tech., 13, 5891–5921, https://doi.org/10.5194/amt-13-5891-2020, 2020.
IATA: Press Release: Volcano Crisis Cost Airlines $1.7 Billion in Revenue – IATA Urges Measures to Mitigate Impact, available at: https://www.iata.org/en/pressroom/2010-press-releases/2010-04-21-01/ (last access: 5 November 2021), 2010.
ICAO – International Civil Aviation Organization: Doc 9974 – Flight Safety and Volcanic Ash (Advance edition), International Civil Aviation Authority, available at: https://www.icao.int/publications/Documents/9974_en.pdf (last access: 5 November 2021), 2012.
ICAO – International Civil Aviation Organization: International airways volcano watch operations group eighth meeting Melbourne, Australia, Roadmap for international airways volcano watch (IAVW) in Support of International Air Navigation, available at: https://www.icao.int/safety/meteorology/iavwopsg/IAVWOPSG Meetings Metadata/IAVWOPSG.8.WP.014.5.en.pdf (last access: 5 November 2021), 2014.
ICAO – International Civil Aviation Organization: Doc 9766 — Handbook on the international airways volcano watch (IAVW), available at: https://www.icao.int/airnavigation/METP/MOGVA Reference Documents/IAVW Roadmap.pdf (last access: 5 November 2021), 2019.
Inter Pilot Magazine: Issue 1. IFALPA, Montreal, available at: https://interpilot.ifalpa.org/issues/2018-Issue1/index.html (last access: 5 November 2021), 2018.
Justice, C. O., Giglio, L., Roy, D., Boschetti, L., Csiszar, I., Davies, D., Korontzi, S., Schroeder, W., O'Neal, K., and Morisette, J.: MODIS-Derived Global Fire Products, in: Land Remote Sensing and Global Environmental Change, edtited by: Ramachandran, B., Justice, C. O., and Abrams, M. J., Springer, New York, 661–679, https://doi.org/10.1007/978-1-4419-6749-7_29, 2011.
Kaufman, Y. J., Justice, C. O., Flynn, L. P., Kendall, J. D., Prins, E. M., Giglio, L., Ward, D. E., Menzel, W. P., and Setzer, A. W.: Potential global fire monitoring from EOS-MODIS, J. Geophys. Res., 103, 32215–32238, https://doi.org/10.1029/98JD01644, 1998.
Khaykin, S., Legras, B., Bucci, S., Sellitto, P., Isaksen, L., Tencé, F., Bekki, S., Bourassa, A., Rieger, L., Zawada, D., Jumelet, J., and Godin-Beekmann, S.: The 2019/20 Australian wildfires generated a persistent smoke-charged vortex rising up to 35 km altitude, Commun. Earth Environ., 1, 22, https://doi.org/10.1038/s43247-020-00022-5, 2020.
Knippertz, P. and Todd, M. C: Mineral dust aerosols over the Sahara: Meteorological controls on emission and transport and implications for modeling, Rev. Geophys., 50, RG1007, https://doi.org/10.1029/2011RG000362, 2012.
Koch, D., Schmidt, G. A., and Field, C. V.: Sulfur, sea salt, and radionuclide aerosols in GISS ModelE, J. Geophys. Res., 111, D06206, https://doi.org/10.1029/2004JD005550, 2006.
Kooreman, M. L., Stammes, P., Trees, V., Sneep, M., Tilstra, L. G., de Graaf, M., Stein Zweers, D. C., Wang, P., Tuinder, O. N. E., and Veefkind, J. P.: Effects of clouds on the UV Absorbing Aerosol Index from TROPOMI, Atmos. Meas. Tech., 13, 6407–6426, https://doi.org/10.5194/amt-13-6407-2020, 2020.
Kox, S.: Remote sensing of the diurnal cycle of optically thin cirrus clouds, PhD Thesis, Ludwig-Maximilians-Universität, Munich, 2012.
Kox, S., Schmidl, M., Graf, K., Mannstein, H., Buras, R., and Gasteiner, J.: A new approach on the detection of volcanic ash clouds, Eumetsat-media, available at: https://www-cdn.eumetsat.int/files/2020-04/pdf_conf_p_s11_06_kox_v.pdf (last access: 30 March 2021), 2013.
Lechner, P., Tupper, A., Guffanti, M., Loughlin, S., and Casadevall, T.: Volcanic Ash and Aviation – The Challenges of Real-Time, Global Communication of a Natural Hazard, in: Chapter of the book: Observing the Volcano World: Volcano Crisis Communication, edited by: Fearnley, C. J., Bird, D. K., Haynes, K., McGuire, W. J., and Jolly, G., Springer International Publishing, New York, 51–64, https://doi.org/10.1007/11157_2016_49, 2017.
Levy, R., Hsu, C., et al.: MODIS Atmosphere L2 Aerosol Product, NASA MODIS Adaptive Processing System, Goddard Space Flight Center, USA, https://doi.org/10.5067/MODIS/MOD04_L2.006, 2015.
Li, C., Krotkov, N. A., Carn, S., Zhang, Y., Spurr, R. J. D., and Joiner, J.: New-generation NASA Aura Ozone Monitoring Instrument (OMI) volcanic SO2 dataset: algorithm description, initial results, and continuation with the Suomi-NPP Ozone Mapping and Profiler Suite (OMPS), Atmos. Meas. Tech., 10, 445–458, https://doi.org/10.5194/amt-10-445-2017, 2017.
Lu, C.-H., da Silva, A., Wang, J., Moorthi, S., Chin, M., Colarco, P., Tang, Y., Bhattacharjee, P. S., Chen, S.-P., Chuang, H.-Y., Juang, H.-M. H., McQueen, J., and Iredell, M.: The implementation of NEMS GFS Aerosol Component (NGAC) Version 1.0 for global dust forecasting at NOAA/NCEP, Geosci. Model Dev., 9, 1905–1919, https://doi.org/10.5194/gmd-9-1905-2016, 2016.
Miller, T. P. and Casadevall, T. J.: Volcanic ash hazards to aviation, in: Encyclopedia of Volcanoes, edited by: Sigurdsson, H., Houghton, B., McNutt, S. R., Ryman, H., and Stix, J., Academic Press, San Diego, 915–930, 1999.
Morcrette, J.-J., Boucher, O., Jones, L., Salmond, D., Bechtold, P., Beljaars, A., Benedetti, A., Bonet, A., Kaiser, J. W., Razinger, M., Schulz, M., Serrar, S., Simmons, A. J., Sofiev, M., Suttie, M., Tompkins, A. M., and Untch, A.: Aerosol analysis and forecast in the ECMWF Integrated Forecast System. Part I: Forward modelling, J. Geophys. Res., 114, D06206, https://doi.org/10.1029/2008JD011235, 2009.
Nickovic, S., Kallos, G., Papadopoulos, A., and Kakaliagou, O.: A model for prediction of desert dust cycle in the atmosphere, J. Geophys. Res., 106, 18113–18129, https://doi.org/10.1029/2000JD900794, 2001.
Niu, J., Flynn, L. E., Beck, T., Zhang, Z., and Beach, E.: Evaluation and Improvement of the Near-Real-Time Linear Fit SO2 Retrievals From Suomi NPP Ozone Mapping and Profiler Suite, IEEE T. Geosci. Remote, https://doi.org/10.1109/TGRS.2020.2992429, in press, 2021.
Osborne, M., Malavelle, F. F., Adam, M., Buxmann, J., Sugier, J., Marenco, F., and Haywood, J.: Saharan dust and biomass burning aerosols during ex-hurricane Ophelia: observations from the new UK lidar and sun-photometer network, Atmos. Chem. Phys., 19, 3557–3578, https://doi.org/10.5194/acp-19-3557-2019, 2019.
Panebianco, J. E., Mendez, M. J., Buschiazzo, D. E., Bran, D., and Gaitán, J. J.: Dynamics of volcanic ash remobilisation by wind through the Patagonian steppe after the eruption of Cordón Caulle, 2011, Sci. Rep., 7, 45529, https://doi.org/10.1038/srep45529, 2017.
Papagiannopoulos, N., D'Amico, G., Gialitaki, A., Ajtai, N., Alados-Arboledas, L., Amodeo, A., Amiridis, V., Baars, H., Balis, D., Binietoglou, I., Comerón, A., Dionisi, D., Falconieri, A., Fréville, P., Kampouri, A., Mattis, I., Mijić, Z., Molero, F., Papayannis, A., Pappalardo, G., Rodríguez-Gómez, A., Solomos, S., and Mona, L.: An EARLINET early warning system for atmospheric aerosol aviation hazards, Atmos. Chem. Phys., 20, 10775–10789, https://doi.org/10.5194/acp-20-10775-2020, 2020.
Pappalardo, G., Mona, L., D'Amico, G., Wandinger, U., Adam, M., Amodeo, A., Ansmann, A., Apituley, A., Alados Arboledas, L., Balis, D., Boselli, A., Bravo-Aranda, J. A., Chaikovsky, A., Comeron, A., Cuesta, J., De Tomasi, F., Freudenthaler, V., Gausa, M., Giannakaki, E., Giehl, H., Giunta, A., Grigorov, I., Groß, S., Haeffelin, M., Hiebsch, A., Iarlori, M., Lange, D., Linné, H., Madonna, F., Mattis, I., Mamouri, R.-E., McAuliffe, M. A. P., Mitev, V., Molero, F., Navas-Guzman, F., Nicolae, D., Papayannis, A., Perrone, M. R., Pietras, C., Pietruczuk, A., Pisani, G., Preißler, J., Pujadas, M., Rizi, V., Ruth, A. A., Schmidt, J., Schnell, F., Seifert, P., Serikov, I., Sicard, M., Simeonov, V., Spinelli, N., Stebel, K., Tesche, M., Trickl, T., Wang, X., Wagner, F., Wiegner, M., and Wilson, K. M.: Four-dimensional distribution of the 2010 Eyjafjallajökull volcanic cloud over Europe observed by EARLINET, Atmos. Chem. Phys., 13, 4429–4450, https://doi.org/10.5194/acp-13-4429-2013, 2013.
Pavolonis, M. J., Sieglaff, J., and Cintineo, J.: Spectrally Enhanced Cloud Objects: A generalized framework for automated detection of volcanic ash and dust clouds using passive satellite measurements: 1. Multispectral analysis, J. Geophys. Res.-Atmos., 120, 7813–7841, https://doi.org/10.1002/2014jd022968, 2015a.
Pavolonis, M. J., Sieglaff, J., and Cintineo, J.: Spectrally Enhanced Cloud Objects: A generalized framework for automated detection of volcanic ash and dust clouds using passive satellite measurements: 2. Cloud object analysis and global application, J. Geophys. Res.-Atmos., 120, 7842–7870, https://doi.org/10.1002/2014jd022969, 2015b.
Pavolonis, M. J., Sieglaff, J., and Cintineo, J.: Automated detection of explosive volcanic eruptions using satellite-derived cloud vertical growth rates, Earth Space Sci., 5, 903–928, https://doi.org/10.1029/2018EA000410, 2018.
Pavolonis, M. J., Sieglaff, J., and Cintineo, J. L.: Chapter 10 – Remote Sensing of Volcanic Ash with the GOES-R Series, in: The GOES-R Series, edited by: Goodman, S. J., Schmit, T. J., Daniels, J., and Redmon, R. J., Elsevier, Amsterdam, 103–124, https://doi.org/10.1016/B978-0-12-814327-8.00010-X, 2020.
Pérez, C., Haustein, K., Janjic, Z., Jorba, O., Huneeus, N., Baldasano, J. M., Black, T., Basart, S., Nickovic, S., Miller, R. L., Perlwitz, J. P., Schulz, M., and Thomson, M.: Atmospheric dust modeling from meso to global scales with the online NMMB/BSC-Dust model – Part 1: Model description, annual simulations and evaluation, Atmos. Chem. Phys., 11, 13001–13027, https://doi.org/10.5194/acp-11-13001-2011, 2011.
Persson, C., Rodhe, H., and De Geer, L.-E.: The Chernobyl Accident: A Meteorological Analysis of How Radionuclides Reached and Were Deposited in Sweden, Ambio, 16, 20–31, 1987.
Petersen, G. N., Bjornsson, H., Arason, P., and von Löwis, S.: Two weather radar time series of the altitude of the volcanic plume during the May 2011 eruption of Grímsvötn, Iceland, Earth Syst. Sci. Data, 4, 121–127, https://doi.org/10.5194/essd-4-121-2012, 2012.
Plu, M., Scherllin-Pirscher, B., Arnold Arias, D., Baro, R., Bigeard, G., Bugliaro, L., Carvalho, A., El Amraoui, L., Eschbacher, K., Hirtl, M., Maurer, C., Mulder, M. D., Piontek, D., Robertson, L., Rokitansky, C.-H., Zobl, F., and Zopp, R.: An ensemble of state-of-the-art ash dispersion models: towards probabilistic forecasts to increase the resilience of air traffic against volcanic eruptions, Nat. Hazards Earth Syst. Sci., 21, 2973–2992, https://doi.org/10.5194/nhess-21-2973-2021, 2021a.
Plu, M., Bigeard, G., Sič, B., Emili, E., Bugliaro, L., El Amraoui, L., Guth, J., Josse, B., Mona, L., and Piontek, D.: Modelling the volcanic ash plume from Eyjafjallajökull eruption (May 2010) over Europe: evaluation of the benefit of source term improvements and of the assimilation of aerosol measurements, Nat. Hazards Earth Syst. Sci. Discuss. [preprint], https://doi.org/10.5194/nhess-2021-97, in review, 2021b.
Prata, A. J.: Satellite detection of hazardous volcanic clouds and the risk to global air traffic, Nat. Hazards, 51, 303–324, https://doi.org/10.1007/s11069-008-9273-z, 2009.
Prata, A. J. and Bernardo, C.: Retrieval of volcanic SO2 column abundance from Atmospheric Infrared Sounder data, J. Geophys. Res., 112, D20204, https://doi.org/10.1029/2006JD007955, 2007.
Prata, A. J., Gangale, G., Clarisse, L., and Karagulian, F.: Ash and sulfur dioxide in the 2008 eruptions of Okmok and Kasatochi: Insights from high spectral resolution satellite measurements, J. Geophys. Res., 115, D00L18, https://doi.org/10.1029/2009JD013556, 2010.
Ridley, D. A., Heald, C. L., and Ford, B.: North African dust export and deposition: A satellite and model perspective, J. Geophys. Res., 117, D02202, https://doi.org/10.1029/2011JD016794, 2012.
Rix, M., Valks, P., Hao, N., Van Geffen, J., Clerbaux, C., Clarisse, L., Coheur, P.-F., Loyola, D., Erbertseder, T., Zimmer, W., and Emmadi, S.: Satellite monitoring of volcanic sulfur dioxide emissions for early warning of volcanic hazards, IEEE J.-STARS, 2, 196–206, https://doi.org/10.1109/JSTARS.2009.2031120, 2009.
Rix, M., Valks, P., Hao, N., Loyola, D. G., Schlager, H., Huntrieser, H. H., Flemming, J., Koehler, U., Schumann, U., and Inness, A.: Volcanic SO2, BrO and plume height estimations using GOME-2 satellite measurements during the eruption of Eyjafjallajökull in May 2010, J. Geophys. Res., 117, D00U19, https://doi.org/10.1029/2011JD016718, 2012.
Roberts, G., Wooster, M. J., Xu, W., Freeborn, P. H., Morcrette, J.-J., Jones, L., Benedetti, A., Jiangping, H., Fisher, D., and Kaiser, J. W.: LSA SAF Meteosat FRP products – Part 2: Evaluation and demonstration for use in the Copernicus Atmosphere Monitoring Service (CAMS), Atmos. Chem. Phys., 15, 13241–13267, https://doi.org/10.5194/acp-15-13241-2015, 2015.
Salerno, G. G., Burton, M. R., Oppenheimer, C., Caltabiano, D., Randazzo, T., Bruno, N., and Longo, V.: Three-years of SO2 flux measurements of Mt. Etna using an automated UV scanner array: Comparison with conventional traverses and uncertainties in flux retrieval, J. Volcanol. Geoth. Res., 183, 76–83, https://doi.org/10.1016/j.jvolgeores.2009.02.013, 2009.
Scollo, S., Prestifilippo, M., Pecora, E., Corradini, S., Merucci, L., Spata, G., and Coltelli, M.: Eruption column height estimation of the 2011–2013 Etna lava fountains, Ann. Geophys., 57, S0214, https://doi.org/10.4401/ag-6396 , 2014.
Scollo, S., Prestifilippo, M., Bonadonna, C., Cioni, R., Corradini, S., Degruyter, W., Rossi, E., Silvestri, M., Biale, E., Carparelli, G., Cassisi, C., Merucci, L., Musacchio, M., and Pecora, E: Near-Real-Time Tephra Fallout Assessment at Mt. Etna, Italy, Remote Sens., 11, 2987, https://doi.org/10.3390/rs11242987, 2019.
Sessions, W. R., Reid, J. S., Benedetti, A., Colarco, P. R., da Silva, A., Lu, S., Sekiyama, T., Tanaka, T. Y., Baldasano, J. M., Basart, S., Brooks, M. E., Eck, T. F., Iredell, M., Hansen, J. A., Jorba, O. C., Juang, H.-M. H., Lynch, P., Morcrette, J.-J., Moorthi, S., Mulcahy, J., Pradhan, Y., Razinger, M., Sampson, C. B., Wang, J., and Westphal, D. L.: Development towards a global operational aerosol consensus: basic climatological characteristics of the International Cooperative for Aerosol Prediction Multi-Model Ensemble (ICAP-MME), Atmos. Chem. Phys., 15, 335–362, https://doi.org/10.5194/acp-15-335-2015, 2015.
Smith, F. B. and Clark, M. J.: Radionuclide deposition from the Chernobyl cloud, Nature, 322, 690–691, https://doi.org/10.1038/322690a0, 1986.
Theys, N., Campion, R., Clarisse, L., Brenot, H., van Gent, J., Dils, B., Corradini, S., Merucci, L., Coheur, P.-F., Van Roozendael, M., Hurtmans, D., Clerbaux, C., Tait, S., and Ferrucci, F.: Volcanic SO2 fluxes derived from satellite data: a survey using OMI, GOME-2, IASI and MODIS, Atmos. Chem. Phys., 13, 5945–5968, https://doi.org/10.5194/acp-13-5945-2013, 2013.
Theys, N., De Smedt, I., Yu, H., Danckaert, T., van Gent, J., Hörmann, C., Wagner, T., Hedelt, P., Bauer, H., Romahn, F., Pedergnana, M., Loyola, D., and Van Roozendael, M.: Sulfur dioxide retrievals from TROPOMI onboard Sentinel-5 Precursor: algorithm theoretical basis, Atmos. Meas. Tech., 10, 119–153, https://doi.org/10.5194/amt-10-119-2017, 2017.
Theys, N., Hedelt, P., De Smedt, I., Lerot, C., Yu, H., Vlietinck, J., Pedergnana, M., Arellano, S., Galle, B., Fernandez, D., Carlito, C. J. M., Barrington, C., Taisne, B., Delgado-Granados, H., Loyola, D., and Van Roozendael, M.: Global monitoring of volcanic SO2 degassing with unprecedented resolution from TROPOMI onboard Sentinel-5 Precursor, Sci. Rep., 9, 2643, https://doi.org/10.1038/s41598-019-39279-y, 2019.
Tobias, A., Karanasiou, A., Amato, F., Roqué, M., and Quérol, X.: Health effects of desert dust and sand storms: a systematic review and meta-analysis protocol, BMJ Open, 9, e029876. https://doi.org/10.1136/bmjopen-2019-029876, 2019.
Tulet, P. and Villeneuve, N.: Large scale modeling of the transport, chemical transformation and mass budget of the sulfur emitted during the April 2007 eruption of Piton de la Fournaise, Atmos. Chem. Phys., 11, 4533–4546, https://doi.org/10.5194/acp-11-4533-2011, 2011.
Virtanen, T. H., Kolmonen, P., Rodríguez, E., Sogacheva, L., Sundström, A.-M., and de Leeuw, G.: Ash plume top height estimation using AATSR, Atmos. Meas. Tech., 7, 2437–2456, https://doi.org/10.5194/amt-7-2437-2014, 2014.
WMO: SCOPE Pilot Project Criteria, WMO 08/2017, available at: http://www.wmo.int/pages/prog/sat/meetings/documents/SCOPE-Nowcasting-EP-1_Doc_10-01_RecapPilotCriteria.pdf (last access: 1 April 2021), 2017.
WMO: State of Climate Services, available at: https://library.wmo.int/doc_num.php?explnum_id=10385 (last access: 30 March 2021), 2020.
Woodward, S.: Modeling the atmospheric life cycle and radiative impact of mineral dust in the Hadley Centre climate model, J. Geophys. Res., 106, 18155–18166, https://doi.org/10.1029/2000JD900795, 2001.
Yang, K., Krotkov, N. A., Krueger, A. J., Carn, S. A., Bhartia, P. K., and Levelt, F. F.: Retrieval of large volcanic SO2 columns from the Aura Ozone Monitoring Instrument (OMI): comparison and limitations, J. Geophys. Res., 112, D24S43, https://doi.org/10.1029/2007JD008825, 2007.
Zakey, A. S., Solmon, F., and Giorgi, F.: Implementation and testing of a desert dust module in a regional climate model, Atmos. Chem. Phys., 6, 4687–4704, https://doi.org/10.5194/acp-6-4687-2006, 2006.
Zehner, C. (Ed.): Monitoring volcanic Ash from Space ESA-Eumetsat workshop on the 14 April to 23 May 2010 eruption at the Eyjafjallajökull volcano, South iceland, STM-280, ESA/ESRIN, 58 pp., July 2010.
Zheng, G., Sedlacek, A. J., Aiken, A. C., Feng, Y., Watson, T. B., Raveh-Rubin, S., Uin, J., Lewis, E. R., and Wang, J.: Long-range transported North American wildfire aerosols observed in marine boundary layer of eastern North Atlantic, Environ. Int., 139, 105680, https://doi.org/10.1016/j.envint.2020.105680, 2020.
- Abstract
- Introduction
- Requirements for the EUNADICS-AV early warning system
- Existing monitoring and warning systems
- Pre-alerting mechanism of the EUNADICS-AV EWS
- Performance verification, conclusion and future developments
- Appendix A: Description of the NCAP files
- Appendix B: Case studies and downloads of NCAP files
- Data availability
- Author contributions
- Competing interests
- Disclaimer
- Special issue statement
- Acknowledgements
- Financial support
- Review statement
- References
- Supplement